UNITED STATES
SECURITIES AND EXCHANGE COMMISSION
Washington, D.C. 20549
FORM N-CSR
CERTIFIED SHAREHOLDER REPORT OF REGISTERED
MANAGEMENT INVESTMENT COMPANIES
Investment Company Act file number 811-00173
DODGE & COX FUNDS
(Exact name of registrant as specified in charter)
555 California Street, 40th Floor
San Francisco, CA 94104
(Address of principal executive offices) (Zip code)
Roberta R.W. Kameda, Esq.
555 California Street, 40th Floor
San Francisco, CA 94104
(Name and address of agent for service)
Registrant’s telephone number, including area code: 415-981-1710
Date of fiscal year end: DECEMBER 31, 2023
Date of reporting period: JUNE 30, 2023
Form N-CSR is to be used by management investment companies to file reports with the Commission not later than 10 days after the transmission to stockholders of any report that is required to be transmitted to stockholders under Rule 30e-1 under the Investment Company Act of 1940 (17 CFR 270.30e-1). The Commission may use the information provided on Form N-CSR in its regulatory, disclosure review, inspection, and policymaking roles.
A registrant is required to disclose the information specified by Form N-CSR, and the Commission will make this information public. A registrant is not required to respond to the collection of information contained in Form N-CSR unless the Form displays a currently valid Office of Management and Budget (“OMB”) control number. Please direct comments concerning the accuracy of the information collection burden estimate and any suggestions for reducing the burden to Secretary, Securities and Exchange Commission, 450 Fifth Street, NW, Washington, DC 20549-0609. The OMB has reviewed this collection of information under the clearance requirements of 44 U.S.C. ss. 3507.
ITEM 1. REPORTS TO STOCKHOLDERS.
(a) The following are the June 30, 2023 semi-annual reports for the Dodge & Cox Funds, a Delaware statutory trust, consisting of seven series: Dodge & Cox Stock Fund, Dodge & Cox Global Stock Fund, Dodge & Cox International Stock Fund, Dodge & Cox Emerging Markets Stock Fund, Dodge & Cox Balanced Fund, Dodge & Cox Income Fund, and Dodge & Cox Global Bond Fund.
The reports of each series were transmitted to their respective shareholders on August 23, 2023.
Stock Fund | Class I (dodgx) | Class X (doxgx)
ESTABLISHED 1965
06/23 SF SAR Printed on recycled paper 
To Our Shareholders (unaudited)
The Dodge & Cox Stock Fund—Class I had a total return of 7.17% for the six-month period ended June 30, 2023, compared to a return of 16.89% for the S&P 500 Index and 5.12% for the Russell 1000 Value Index.1
Market Commentary
U.S. equity markets rose during the first half of 2023, amid resilient economic growth, slowing inflation, and a pause in interest-rate hikes by the Federal Reserve. The S&P 500 Index appreciated 16.9% and has gained more than 20% from its October 2022 low. The Information Technology and Communication Services sectors—among the worst-performing sectors in 2022—drove the S&P 500’s performance in the first half of 2023, principally fueled by excitement about artificial intelligence. Conversely, Energy, the best-performing sector of 2022, was the second worst-performing sector during the past six months due to a decline in commodity prices. Market leadership has been concentrated, with seven stocks in the S&P 500 accounting for 74% of the Index’s performance during the first half of 2023.2
After narrowing in 2022, the valuation disparity between U.S. value and growth stocks3 increased during the first half of 2023, as value stocks underperformed growth stocks by 23.9 percentage points.4 The Russell 1000 Value trades at 15.6 times forward earnings5 compared to 27.6 times for the Russell 1000 Growth Index.6
Investment Strategy
In the first half of 2023, the Fund had a positive absolute return. While it underperformed the S&P 500 by 9.7 percentage points, the Fund outperformed the Russell 1000 Value by 2.1 percentage points.7 The Fund’s underweight position and the performance of holdings in the Information Technology sector were the biggest detractors versus the S&P 500. The largest three Information Technology companies in the S&P 500—Apple, Microsoft, and NVIDIA—comprised 17.3% of the Index on June 30 and accounted for over 40% of the Index’s return. Of these three companies, the Fund held only an underweight position in Microsoft8 (2.6% of the Fund’s net assets compared to 6.8% of the S&P 500).
As a result of our value-oriented investment approach and focus on individual security selection, we increased the Fund’s exposure to companies that provide attractive dividends and trade at reasonable valuations in more stable sectors, including Health Care and Utilities. We also reduced the Fund’s exposure to companies that saw their valuations increase, including Meta Platforms, General Electric, and FedEx.
The Fund remains overweight the Financials (discussed below), Health Care, and Communication Services sectors and underweight Consumer Staples, Real Estate, and Utilities. We recently initiated two new positions—Dominion Energy and Norfolk Southern—which are also highlighted below.
Our Perspectives on the Financials Sector
The Financials sector has been a large detractor from the Fund’s relative results versus the S&P 500 this year, due to the Fund’s overweight position and the performance of its holdings. In March,
two U.S. regional banks not held in the Fund—Silicon Valley Bank and Signature Bank—collapsed and pressured Financials, particularly banks with weaker funding, sizable unrealized securities losses, and a greater concentration of customer deposits above the FDIC’s $250,000 insurance threshold. In May, regulators seized First Republic Bank (also not held in the Fund) and sold the majority of its assets to JPMorgan Chase.
We do not believe the weakness across U.S. Financials signals broader systemic risk for the sector. Key economic indicators are positive: corporate profits are healthy and consumer leverage is low. The Fund’s Financials exposure is primarily concentrated in two types of institutions. The first type is global, systemically important banks that already comply with tougher regulatory standards than regional banks and will likely gain deposit market share (e.g., Bank of America, Wells Fargo). The second type is financial institutions focused on capital markets with relatively little credit risk exposure (e.g., Bank of New York Mellon, Charles Schwab, Goldman Sachs).
Current valuations for the Fund’s Financials holdings are unusually inexpensive on both an absolute and relative basis, suggesting a pessimistic market outlook. Recent and potential headwinds include changes in depositor behavior, tougher regulatory capital standards, and potential reductions in credit quality due to tightening financial conditions, particularly within commercial real estate. Nevertheless, we remain more optimistic about the longer-term earnings capacity, margin resilience, and capital return potential for the Fund’s holdings. Importantly, rising interest rates have helped increase net interest income for the Fund’s banks. We believe a significant portion of this higher revenue is sustainable, absent a substantial decline in interest rates.
We continue to actively monitor the Financials sector and make portfolio decisions that incorporate our longer-term view of relative risk/reward opportunities. We have maintained the Fund’s overweight position in the Financials sector and recently added to bank holdings, including Truist Financial and Wells Fargo.
Dominion Energy
In the first quarter of this year, we started a position in Dominion Energy, a North American power and energy company headquartered in Richmond, Virginia. Dominion Energy has a strong electric utility franchise, but has faced considerable volatility in the past year, as concerns about the outcome of a regulatory review and a potential corporate restructuring have negatively impacted the stock price.
As part of our investment process, we seek to build a portfolio of individual companies whose current market valuation does not adequately reflect the company’s long-term profit opportunities, and Dominion Energy fits that description. The company has made significant efforts to prepare for the long-term energy transition away from fossil fuels. For many years, Dominion Energy traded at a premium valuation compared to other utilities, but now trades at a discount to both its industry peers and its own history. We believe this discounted valuation—along with the company’s 5% dividend yield—helps to mitigate the downside risk and doesn’t reflect the potential for multiple expansion if the current challenges are addressed successfully.
PAGE 1 ◾ Dodge & Cox Stock Fund
Norfolk Southern
During the second quarter, we initiated a position in Norfolk Southern, a railroad company with operations in the Eastern portion of the United States. The company competes in a stable duopoly (with CSX) whose participants prioritize return on invested capital (ROIC)9 and shareholder returns. Due to the highly publicized derailment of one of its trains in Ohio, Norfolk Southern’s shares underperformed significantly. Unfortunately, there are hundreds of train derailments in the United States each year; however, Norfolk Southern has dramatically improved its own safety record over the past two decades. The company is highly focused on operating a safer railroad and has committed to being the gold standard of safety in the railroad industry.
Norfolk Southern’s operating margins today materially lag its competition. The company can consistently pass along cost increases and has opportunities to improve margins, free cash flow10, and ROIC over time. We believe Norfolk Southern will see an improvement in its long-term volume growth as railroads continue to take market share from trucks, and the impact of declining revenues from the shrinking coal business diminishes. The company should also benefit as concerns about the financial impact of the derailment recede. We believe recent developments provided us an opportunity to buy an excellent franchise at a discounted valuation.
In Closing
We believe the Fund’s diversified portfolio is well positioned and could benefit if the wide valuation disparity between value and growth stocks narrows. The Fund’s portfolio trades at 12.5 times forward earnings, well below the S&P 500 and Russell 1000 Value’s valuations of 20.1 and 15.6 times, respectively. Since 1930, Dodge & Cox has navigated many challenging periods. In our experience, patience and persistence through turbulent markets have often been rewarded in the long run. We remain optimistic about the long-term outlook for the Fund.
Thank you for your continued confidence in Dodge & Cox. As always, we welcome your comments and questions.
For the Board of Trustees, | |
| |
Dana M. Emery,
Chair and President | |
July 31, 2023
| All returns are stated in U.S. dollars, unless otherwise noted. The Funds’ total returns include the reinvestment of dividend and capital gain distributions, but have not been adjusted for any income taxes payable by shareholders on these distributions or on Fund share redemptions. Index returns include dividend and/or interest income but, unlike Fund returns, do not reflect fees or expenses. The S&P 500 Index is a market capitalization-weighted index of 500 large-capitalization stocks commonly used to represent the U.S. equity market. The Russell 1000 Value Index is a broad-based, unmanaged equity market index composed of those Russell 1000 companies with lower price-to-book ratios and lower forecasted growth values. |
| The top-seven contributors to the S&P 500’s absolute returns in the first half of 2023 were Apple, Microsoft, NVIDIA, Amazon, Alphabet, Meta Platforms, and Tesla. |
| Generally, stocks that have lower valuations are considered “value” stocks, while those with higher valuations are considered “growth” stocks. |
| For the first half of 2023, the Russell 1000 Value Index had a total return of 5.12% compared to 29.02% for the Russell 1000 Growth Index. The Russell 1000 Growth Index is a broad-based, unmanaged equity market index composed of those Russell 1000 companies with higher price-to-book ratios and higher forecasted growth values. |
| Price-to-earnings (forward) ratios are calculated using 12-month forward earnings estimates from third-party sources as of the reporting period. Estimates reflect a consensus of sell-side analyst estimates, which may lag as market conditions change. |
| Unless otherwise specified, all weightings and characteristics are as of June 30, 2023. |
| Return for the Stock Fund’s Class I shares. |
| The use of specific examples does not imply that they are more or less attractive investments than the portfolio’s other holdings. |
| Return on Invested Capital (ROIC) reflects the rate of return generated by a company using the funds contributed by its capital providers. This metric helps assess whether a company is creating value with its investments. |
| Free cash flow is the cash a company generates after paying all expenses and loans. |
Dodge & Cox Stock Fund ◾ PAGE 2
Year-to-Date Performance Review for the Fund's Class I Shares (unaudited)
The Fund underperformed the S&P 500 by 9.72 percentage points year to date.
Key contributors to relative results included the Fund's:
◾ Industrials holdings, notably General Electric and FedEx;
◾ Stock selection in Consumer Staples—including Molson Coors—and underweight position in the sector;
◾ Underweight position in Utilities; and
◾ Positions in Fiserv and Alphabet.
Key detractors from relative results included the Fund's:
◾ Information Technology holdings, largely the underweight position in Microsoft and not owning Apple and NVIDIA;
◾ Financials overweight and holdings, particularly Charles Schwab, MetLife, and Fidelity National Information Services;
◾ Health Care holdings—including Cigna, Gilead Sciences and Incyte—and overweight position;
◾ Underweight position in Consumer Discretionary, especially in Amazon, and not owning Tesla; and
◾ Energy overweight and elected holdings, especially Occidental Petroleum.
The Fund outperformed the Russell 1000 Value by 2.05 percentage points year to date.
Key contributors to relative results included the Fund's:
◾ Stock selection in Industrials, particularly General Electric and FedEx;
◾ Information Technology overweight position and certain holdings, notably Microsoft and Microchip Technology;
◾ Underweight position in Utilities;
◾ Consumer Discretionary holdings, particularly Amazon;
◾ Stock selection in Consumer Staples, mainly Molson Coors; and
◾ Positions in Alphabet, Fiserv, Capital One Financial, and Sanofi.
Key detractors from relative results included the Fund's:
◾ Financials holdings—particularly Charles Schwab, MetLife, and Fidelity National Information Services—and overweight position; and
◾ Positions in Occidental Petroleum, Cigna, Incyte, Gilead Sciences, DISH Network, BioMarin Pharmaceuticals, and
underweight exposure to Meta Platforms.
Key Characteristics of Dodge & Cox
Independent Organization
Dodge & Cox is one of the largest privately owned investment managers in the world. We remain committed to independence, with a goal of providing the highest-quality investment management service to our existing clients.
Over 90 Years of Investment Experience
Dodge & Cox was founded in 1930. We have a stable and well- qualified team of investment professionals, most of whom have spent their entire careers at Dodge & Cox.
Experienced Investment Team
The U.S. Equity Investment Committee, which is the decision-making body for the Stock Fund, is a seven-member committee with an average tenure of 21 years at Dodge & Cox.
One Business with a Single Decision-Making Office
Dodge & Cox manages equity (domestic, international, and global), fixed income (domestic and global), and balanced investments, all from one office in San Francisco.
Consistent Investment Approach
Our team decision-making process involves thorough, bottom-up fundamental analysis of each investment.
Long-Term Focus and Low Expenses
We invest with a three- to five-year investment horizon, which has historically resulted in low turnover relative to our peers. We manage Funds that maintain low expense ratios.
Risks: The Fund is subject to market risk, meaning holdings in the Fund may decline in value for extended periods due to the financial prospects of individual companies, or due to general market and economic conditions. Please read the prospectus and summary prospectus for specific details regarding the Fund's risk profile.
Fund holdings and sector allocations are subject to change at any time and should not be considered recommendations to buy or sell any security. Please see the Portfolio of Investments section in this report for a complete list of fund holdings.
PAGE 3 ◾ Dodge & Cox Stock Fund
Growth of $10,000 Over 10 Years (unaudited)
For an Investment Made on June 30, 2013 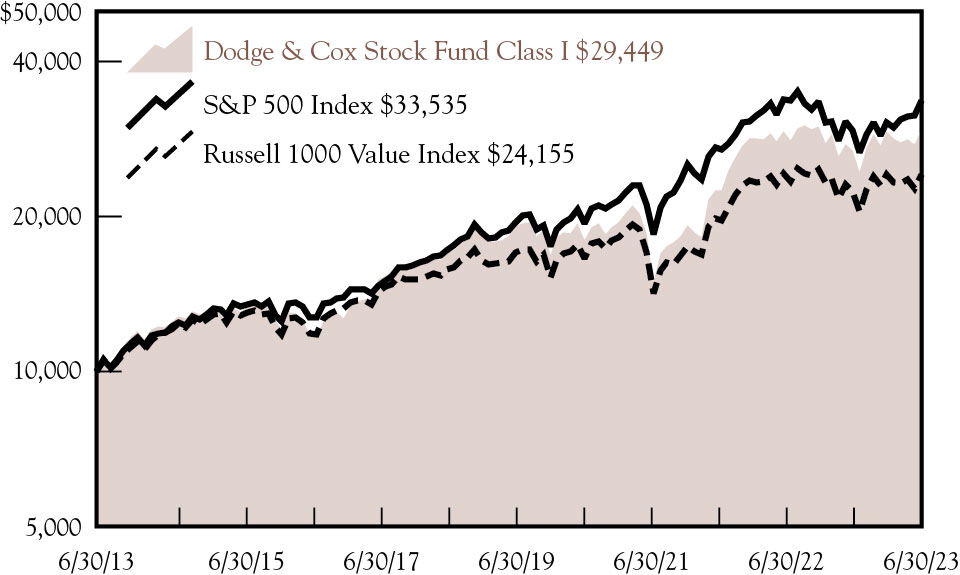
Average Annual Total Return
For Periods Ended June 30, 2023
Expense Ratios
Per the Prospectus Dated May 1, 2023
| The Class X shares inception date is May 2, 2022. The returns shown prior to that date are for the Class I shares. |
| Dodge & Cox has contractually agreed to reimburse the Fund for all ordinary expenses to the extent necessary to maintain Total Annual Fund Operating Expenses of Class X at 0.41% until April 30, 2026. This agreement cannot be terminated prior to April 30, 2026 other than by resolution of the Fund’s Board of Trustees. For purposes of the foregoing, ordinary expenses shall not include nonrecurring shareholder account fees, fees and expenses associated with Fund shareholder meetings, fees on portfolio transactions such as exchange fees, dividends and interest on short positions, fees and expenses of pooled investment vehicles that are held by the Fund, interest expenses and other fees and expenses related to any borrowings, taxes, brokerage fees and commissions and other costs and expenses relating to the acquisition and disposition of Fund investments, other expenditures which are capitalized in accordance with generally accepted accounting principles, and other non-routine expenses or extraordinary expenses not incurred in the ordinary course of the Fund’s business, such as litigation expenses. The term of the agreement will automatically renew for subsequent three-year terms unless terminated with at least 30 days’ written notice by either party prior to the end of the then-current term. The agreement does not permit Dodge & Cox to recoup any fees waived or payments made to the Fund for a prior year. |
Returns represent past performance and do not guarantee future results. Investment return and share price will fluctuate with market conditions, and investors may have a gain or loss when shares are sold. Fund performance changes over time and currently may be significantly lower than stated. Performance is updated and published monthly. Visit the Fund’s website at dodgeandcox.com or call 800-621-3979 for current performance figures.
The Fund's total returns include the reinvestment of dividend and capital gain distributions, but have not been adjusted for any income taxes payable by shareholders on these distributions or on Fund share redemptions. Index returns include dividends but, unlike Fund returns, do not reflect fees or expenses. The S&P 500 Index is a market capitalization-weighted index of 500 large-capitalization stocks commonly used to represent the U.S. equity market. The Russell 1000 Value Index is a broad-based, unmanaged equity market index composed of those Russell 1000 companies with lower price-to-book ratios and lower forecasted growth values.
S&P 500® is a trademark of S&P Global Inc. Russell 1000® is a trademark of the London Stock Exchange Group plc.
For more information about these indices, visit:
www.dodgeandcox.com/stockfund
Dodge & Cox Stock Fund ◾ PAGE 4
Portfolio Information (unaudited) June 30, 2023
| Net Cash & Other includes cash, short-term investments, derivatives, receivables, and payables. |
Fund Expense Example (unaudited)
As a Fund shareholder, you incur ongoing Fund costs, including management fees and other Fund expenses. All mutual funds have ongoing costs, sometimes referred to as operating expenses. The following example shows ongoing costs of investing in the Fund and can help you understand these costs and compare them with those of other mutual funds. The example assumes a $1,000 investment held for the six months indicated.
Actual Expenses
The first line of each share class in the table below provides information about actual account values and expenses based on the actual returns of the share class. You may use the information in this line, together with your account balance, to estimate the expenses that you paid over the period. Simply divide your account value by $1,000 (for example, an $8,600 account value divided by $1,000 = 8.6), then multiply the result by the number in the first line under the heading “Expenses Paid During Period” to estimate the expenses you paid on your account during this period.
Hypothetical Example for Comparison with Other Mutual Funds
Information on the second line of each share class in the table can help you compare ongoing costs of investing in the Fund with those of other mutual funds. This information may not be used to estimate the actual ending account balance or expenses you paid during the period. The hypothetical “Ending Account Value” is based on the actual expense ratio of the share class and an assumed 5% annual rate of return before expenses (not the actual return of the share class). The amount under the heading “Expenses Paid During Period” shows the hypothetical expenses your account would have incurred under this scenario. You can compare this figure with the 5% hypothetical examples that appear in shareholder reports of other mutual funds.
Six Months Ended
June 30, 2023 | Beginning Account Value
1/1/2023 | Ending Account Value
6/30/2023 | Expenses Paid
During Period* | |
| | | | |
| | | | |
Based on hypothetical 5% yearly return | | | | |
| | | | |
| | | | |
Based on hypothetical 5% yearly return | | | | |
| Expenses are equal to the annualized expense ratio, multiplied by the average account value over the period, multiplied by 181/365 (to reflect the one-half year period). |
The expenses shown in the table highlight ongoing costs only and do not reflect any transactional fees or account maintenance fees. Though other mutual funds may charge such fees, please note that the Fund does not charge transaction fees (e.g., redemption fees, sales loads) or universal account maintenance fees (e.g., small account fees).
PAGE 5 ◾ Dodge & Cox Stock Fund
Portfolio of Investments (unaudited) June 30, 2023
|
| | |
Communication Services: 12.2% |
Media & Entertainment: 11.1% |
Alphabet, Inc., Class A(a) | | |
Alphabet, Inc., Class C(a) | | |
Charter Communications, Inc., | | |
| | |
DISH Network Corp., Class A(a) | | |
| | |
| | |
Meta Platforms, Inc., Class A(a) | | |
| | |
| | |
Telecommunication Services: 1.1% |
| | |
| | |
Consumer Discretionary: 4.1% |
Automobiles & Components: 1.0% |
Honda Motor Co., Ltd. ADR (Japan) | | |
Consumer Discretionary Distribution & Retail: 1.9% |
| | |
| | |
| | |
|
Booking Holdings, Inc.(a) | | |
| | |
|
Food, Beverage & Tobacco: 2.0% |
Anheuser-Busch InBev SA/NV ADR (Belgium) | | |
Molson Coors Beverage Co., | | |
| | |
Household & Personal Products: 0.7% |
Haleon PLC ADR (United Kingdom) | | |
| | |
|
Baker Hughes Co., Class A | | |
| | |
Occidental Petroleum Corp.(b) | | |
Occidental Petroleum Corp., | | |
The Williams Companies, Inc. | | |
| | |
|
|
| | |
| | |
| | |
| | |
Financial Services: 15.4% |
Bank of New York Mellon Corp. | | |
Capital One Financial Corp.(b) | | |
| | |
Fidelity National Information Services, Inc. | | |
| | |
Goldman Sachs Group, Inc. | | |
|
| | |
| | |
UBS Group AG, NY Shs (Switzerland) | | |
| | |
|
Aegon NV, NY Shs (Netherlands) | | |
Brighthouse Financial, Inc.(a)(b) | | |
| | |
| | |
| | |
| | |
|
Health Care Equipment & Services: 6.5% |
| | |
GE HealthCare Technologies, Inc. | | |
| | |
| | |
| | |
Zimmer Biomet Holdings, Inc. | | |
| | |
Pharmaceuticals, Biotechnology & Life Sciences: 14.2% |
Alnylam Pharmaceuticals, Inc.(a) | | |
BioMarin Pharmaceutical, Inc.(a) | | |
| | |
Elanco Animal Health, Inc.(a)(b) | | |
| | |
GSK PLC ADR (United Kingdom) | | |
| | |
Novartis AG ADR (Switzerland) | | |
Regeneron Pharmaceuticals, Inc.(a) | | |
Roche Holding AG ADR (Switzerland) | | |
| | |
| | |
| | |
|
|
| | |
| | |
Johnson Controls International PLC | | |
| | |
Raytheon Technologies Corp. | | |
| | |
|
| | |
| | |
| | |
| | |
Information Technology: 14.3% |
Semiconductors & Semiconductor Equipment: 1.4% |
Microchip Technology, Inc. | | |
Software & Services: 6.2% |
Cognizant Technology Solutions Corp., Class A | | |
| | |
| | |
| | |
Technology, Hardware & Equipment: 6.7% |
| | |
| | |
See accompanying Notes to Financial StatementsDodge & Cox Stock Fund ◾ PAGE 6
Portfolio of Investments (unaudited) June 30, 2023
Common Stocks (continued) |
| | |
Dell Technologies, Inc., Class C | | |
Hewlett Packard Enterprise Co. | | |
| | |
Juniper Networks, Inc.(b) | | |
| | |
| | |
| | |
|
| | |
LyondellBasell Industries NV, Class A | | |
| | |
|
Equity Real Estate Investment Trusts (Reits): 0.2% |
Gaming and Leisure Properties, Inc. REIT | | |
|
| | |
Total Common Stocks
(Cost $62,740,198,847) | | |
Short-Term Investments: 1.4% |
| | |
Repurchase Agreements: 1.0% |
Fixed Income Clearing Corporation(c) 5.04%, dated 6/30/23, due 7/3/23, maturity value $630,264,600 | | |
Fixed Income Clearing Corporation(c) 2.45%, dated 6/30/23, due 7/3/23, maturity value $261,523,383 | | |
| | |
|
| | |
|
State Street Institutional U.S. Government Money Market Fund - Premier Class | | |
Total Short-Term Investments
(Cost $1,260,030,568) | |
Total Investments In Securities
(Cost $64,000,229,415) | | |
Other Assets Less Liabilities | | |
| | |
| |
| See below regarding holdings of 5% voting securities |
| Repurchase agreement is collateralized by U.S. Treasury Notes 1.125%-4.50%, 8/15/39-5/15/40. U.S. Treasury Inflation Indexed Notes 0.125%-2.125%, 10/15/25- 2/15/40. Total collateral value is $909,299,535. |
| The Fund usually classifies a company or issuer based on its country of risk, but may designate a different country in certain circumstances. |
| |
| |
ADR: American Depositary Receipt |
NY Shs: New York Registry Shares |
Futures Contracts
| | | | Value /
Unrealized
Appreciation/
(Depreciation) |
E-Mini S&P 500 Index— Long Position | | | | |
Holdings of 5% Voting Securities
Each of the companies listed below was considered to be an affiliate of the Fund because the Fund owned 5% or more of the company’s voting securities during all or part of the six months ended June 30, 2023. Further detail on these holdings and related activity during the period appear below.
| Value at
Beginning of Period | | | | Net Change in
Unrealized
Appreciation/
Depreciation | | Dividend
Income
(net of foreign
taxes, if any) |
| | | | | | | |
Consumer Discretionary 0.3% | | | | | | | |
Qurate Retail, Inc., Series A | | | | | | | |
| | | | | | | |
| | | | | | | |
| | | | | | | |
Molson Coors Beverage Co., Class B | | | | | | | |
PAGE 7 ◾ Dodge & Cox Stock FundSee accompanying Notes to Financial Statements
Portfolio of Investments (unaudited) June 30, 2023
Holdings of 5% Voting Securities (continued)
| Value at Beginning of Period | | | | Net Change in Unrealized Appreciation/ Depreciation | | Dividend Income (net of foreign taxes, if any) |
| | | | | | | |
Occidental Petroleum Corp. | | | | | | | |
Occidental Petroleum Corp., | | | | | | | |
| | | | | | | |
| | | | | | | |
Brighthouse Financial, Inc.(b) | | | | | | | |
Capital One Financial Corp. | | | | | | | |
| | | | | | | |
| | | | | | | |
Elanco Animal Health, Inc.(b) | | | | | | | |
| | | | | | | |
| | | | | | | |
Information Technology 1.5% | | | | | | | |
| | | | | | | |
| | | | | | | |
Micro Focus International PLC ADR | | | | | | | |
| | | | | | | |
| | | | | | | |
| Company was not an affiliate at period end |
| |
See accompanying Notes to Financial StatementsDodge & Cox Stock Fund ◾ PAGE 8
Statement of Assets and Liabilities (unaudited)
| |
|
Investments in securities, at value | |
Unaffiliated issuers (cost $55,100,650,110) | |
Affiliated issuers (cost $8,899,579,305) | |
| |
Deposits with broker for futures contracts | |
Receivable for variation margin for futures contracts | |
Receivable for investments sold | |
Receivable for Fund shares sold | |
Dividends and interest receivable | |
Expense reimbursement receivable | |
Prepaid expenses and other assets | |
| |
|
Payable for investments purchased | |
Payable for Fund shares redeemed | |
| |
| |
| |
| |
|
| |
| |
| |
|
| |
Shares outstanding (par value $0.01 each, unlimited shares authorized) | |
Net asset value per share | |
|
| |
Shares outstanding (par value $0.01 each, unlimited shares authorized) | |
Net asset value per share | |
Statement of Operations (unaudited)
| Six Months Ended
June 30, 2023 |
| |
Dividends (net of foreign taxes of $38,629,077) | |
| |
| |
| |
| |
| |
| |
Administrative services fees | |
| |
| |
Custody and fund accounting fees | |
| |
| |
| |
| |
| |
| |
Expenses reimbursed by investment manager | |
| |
| |
Realized and Unrealized Gain (Loss): | |
| |
Investments in securities of unaffiliated issuers (Note 6) | |
Investments in securities of affiliated issuers (Note 6) | |
| |
Foreign currency transactions | |
Net change in unrealized appreciation/depreciation | |
Investments in securities of unaffiliated issuers | |
Investments in securities of affiliated issuers | |
| |
Foreign currency translation | |
Net realized and unrealized gain | |
Net Change in Net Assets From Operations | |
PAGE 9 ◾ Dodge & Cox Stock FundSee accompanying Notes to Financial Statements
Statement of Changes in Net Assets (unaudited)
| | |
| | |
| | |
| | |
| | |
Net change in unrealized appreciation/depreciation | | |
| | |
Distributions to Shareholders: | | |
| | |
| | |
| | |
| | |
| | |
Proceeds from sales of shares | | |
Reinvestment of distributions | | |
| | |
| | |
Proceeds from sales of shares | | |
Reinvestment of distributions | | |
| | |
Net change from Fund share transactions | | |
Total change in net assets | | |
| | |
| | |
| | |
| | |
| | |
| | |
| | |
| | |
Net change in shares outstanding | | |
| | |
| | |
| | |
| | |
Net change in shares outstanding | | |
See accompanying Notes to Financial StatementsDodge & Cox Stock Fund ◾ PAGE 10
Notes to Financial Statements (unaudited)
Note 1: Organization and Significant Accounting Policies
Dodge & Cox Stock Fund (the "Fund") is one of the series constituting the Dodge & Cox Funds (the "Trust" or the "Funds"). The Trust is organized as a Delaware statutory trust and is registered under the Investment Company Act of 1940, as amended, as an open-end management investment company. The Fund commenced operations on January 4, 1965, and seeks long-term growth of principal and income. Risk considerations and investment strategies of the Fund are discussed in the Fund's Prospectus.
On May 1, 2022, the then-outstanding shares of the Fund were redesignated as Class I Shares, and Class X shares of the Fund were established. The share classes have different eligibility requirements and expense structures due to differing shareholder servicing arrangements. The share classes have the same rights as to redemption, dividends and liquidation proceeds, and voting privileges, except that each class has the exclusive right to vote on matters affecting only its class.
The Fund is an investment company and follows the accounting and reporting guidance issued in Topic 946 by the Financial Accounting Standards Board. The financial statements have been prepared in conformity with accounting principles generally accepted in the United States of America, which require the use of estimates and assumptions by management. Actual results may differ from those estimates. Significant accounting policies are as follows:
Security valuation The Fund’s net assets are normally valued as of the scheduled close of trading on the New York Stock Exchange (NYSE), generally 4 p.m. Eastern Time, each day that the NYSE is open for business.
Portfolio holdings for which market quotes are readily available are valued at market value. Listed securities, for example, are generally valued using the official quoted close price or the last sale on the exchange that is determined to be the primary market for the security. Exchange-traded derivatives are generally valued at the settlement price determined by the relevant exchange. Short-term securities less than 60 days to maturity may be valued at amortized cost if amortized cost approximates current value. Mutual funds are valued at their respective net asset values. Security values are not discounted based on the size of the Fund’s position and may differ from the value a Fund receives upon sale of the securities. All securities held by the Fund are denominated in U.S. dollars.
If market quotations are not readily available or if normal valuation procedures produce valuations that are deemed unreliable or inappropriate under the circumstances existing at the time, the investment will be valued at fair value as determined in good faith by Dodge & Cox. The Board of Trustees has appointed Dodge & Cox, the Fund’s investment manager, as its "valuation designee", as permitted by Rule 2a-5 under the Investment Company Act of 1940, to make fair value determinations in accordance with the Dodge & Cox Funds Valuation Policies (“Valuation Policies”), subject to Board oversight. Dodge & Cox has established a Pricing Committee that is comprised of representatives from Treasury, Legal, Compliance, and Operations. The Pricing Committee is responsible for implementing the Valuation Policies, including determining the fair value of securities and other investments when necessary. The Pricing Committee considers rel
evant indications of value that are reasonably available to it in determining the fair value assigned to a particular security, such as the value of similar financial instruments, trading volumes, contractual restrictions on disposition, related corporate actions, and changes in economic conditions. In doing so, the Pricing Committee employs various methods for calibrating fair valuation approaches, including a regular review of key inputs and assumptions, back-testing, and review of any related market activity.
Valuing securities through a fair value determination involves greater reliance on judgment than valuation of securities based on readily available market quotations. In some instances, lack of information and uncertainty as to the significance of information may lead to a conclusion that a prior valuation is the best indication of a security’s value. When fair value pricing is employed, the prices of securities used by the Fund to calculate its net asset value may differ from quoted or published prices for the same securities.
Security transactions, investment income, expenses, and distributions Security transactions are recorded on the trade date. Realized gains and losses on securities sold are determined on the basis of identified cost.
Dividend income and corporate action transactions are recorded on the ex-dividend date, or when the Fund first learns of the dividend/corporate action if the ex-dividend date has passed. Non-cash dividends, if any, are recorded at the fair market value of the securities received. Dividends characterized as return of capital for U.S. tax purposes are recorded as a reduction of cost of investments and/or realized gain. Interest income is recorded on the accrual basis.
Expenses are recorded on the accrual basis. Some expenses of the Trust can be directly attributed to a specific series. Expenses which cannot be directly attributed are allocated among the Funds in the Trust using methodologies determined by the nature of the expense.
Distributions to shareholders are recorded on the ex-dividend date.
Share class accounting Investment income, realized and unrealized gains and losses and expenses, other than class-specific expenses, are allocated to each share class of the Fund based upon the proportion of net assets of each class.
Foreign taxes The Fund may be subject to foreign taxes which may be imposed by certain countries in which the Fund invests. The Fund endeavors to record foreign taxes based on applicable foreign tax law. Withholding taxes are incurred on certain foreign dividends and are accrued at the time the associated dividend is recorded. The Fund files withholding tax reclaims in certain jurisdictions to recover a portion of amounts previously withheld. The Fund records a reclaim receivable based on, among other things, a jurisdiction’s legal obligation to pay reclaims as well as payment history and market convention. In consideration of recent decisions rendered by European courts, the Fund has filed for additional reclaims ("EU reclaims") related to prior years. A corresponding receivable is established when both the amount is known and significant contingencies or uncertainties regarding collectability are removed. These amounts, if any, are reported in dividends and interest receivable in the Statement of Assets and Liabilities. Expenses incurred related to filing EU reclaims
PAGE 11 ◾ Dodge & Cox Stock Fund
Notes to Financial Statements (unaudited)
are recorded on the accrual basis in professional services in the Statement of Operations. Expenses that are contingent upon successful EU reclaims are recorded in professional services in the Statement of Operations once the amount is known.
Repurchase agreements Repurchase agreements are transactions under which a Fund purchases a security from a counterparty and agrees to resell the security to that counterparty on a specified future date at the same price, plus a specified interest rate. The Fund’s repurchase agreements are secured by U.S. government or agency securities. It is the Fund’s policy that its regular custodian or third party custodian take possession of the underlying collateral securities, the fair value of which exceeds the principal amount of the repurchase transaction, including accrued interest, at all times. In the event of default by the counterparty, the Fund has the contractual right to liquidate the collateral securities and to apply the proceeds in satisfaction of the obligation.
Indemnification Under the Trust’s organizational documents, its officers and trustees are indemnified against certain liabilities arising out of the performance of their duties to the Trust. In addition, in the normal course of business the Trust enters into contracts that provide general indemnities to other parties. The Trust’s maximum exposure under these arrangements is unknown, as this would involve future claims that may be made against the Trust that have not yet occurred.
Note 2: Valuation Measurements
Various inputs are used in determining the value of the Fund’s investments. These inputs are summarized in the three broad levels below.
◾ Level 1: Unadjusted quoted prices in active markets for identical securities
◾ Level 2: Other significant observable inputs (including quoted prices for similar securities, market indices, interest rates, credit risk, forward exchange rates, etc.)
◾ Level 3: Significant unobservable inputs (including Fund management’s assumptions in determining the fair value of investments)
The inputs or methodology used for valuing securities are not necessarily an indication of the risk associated with investing in those securities.
The following is a summary of the inputs used to value the Fund’s holdings at June 30, 2023:
| | LEVEL 2
(Other Significant
Observable Inputs) |
|
|
| | |
| | |
| | |
| | |
| | |
| | |
| | LEVEL 2 (Other Significant Observable Inputs) |
| | |
| | |
| | |
| | |
| | |
|
| | |
| | |
| | |
|
|
| | |
Note 3: Derivative Instruments
The Fund may use derivatives either to minimize the impact of certain risks to one or more of its investments (as a ‘‘hedging technique’’) or to implement its investment strategy. A derivative is a financial instrument whose value is derived from a security, currency, interest rate, index, or other financial instrument.
Futures contracts Futures contracts involve an obligation to purchase or sell (depending on whether the Fund has entered a long or short futures contract, respectively) an asset at a future date, at a price set at the time of the contract. Futures contracts are exchange-traded. Upon entering into a futures contract, the Fund is required to deposit an amount of cash or liquid assets (referred to as "initial margin") in a segregated account with the clearing broker. Subsequent payments (referred to as "variation margin") to and from the clearing broker are made on a daily basis based on changes in the market value of the contract. Changes in the market value of open futures contracts are recorded as unrealized appreciation or depreciation in the Statement of Operations. Realized gains and losses on futures contracts are recorded in the Statement of Operations at the closing or expiration of the contracts. Cash deposited with a broker as initial margin is recorded in the Statement of Assets and Liabilities. A receivable and/or payable to brokers for daily variation margin is also recorded in the Statement of Assets and Liabilities.
Investments in futures contracts may include certain risks, which may be different from, and potentially greater than, those of the underlying securities. To the extent the Fund uses futures, it is exposed to additional volatility and potential losses resulting from leverage.
The Fund used long S&P 500 Index futures contracts to provide equity exposure, approximately equal to some or all of the Fund's non-equity assets.
Additional derivative information The following identifies the location on the Statement of Assets and Liabilities and values of the Fund's derivative instruments categorized by primary underlying risk exposure.
Dodge & Cox Stock Fund ◾ PAGE 12
Notes to Financial Statements (unaudited)
| Includes cumulative appreciation (depreciation). Only the current day’s variation margin is reported in the Statement of Assets and Liabilities. |
The following summarizes the effect of derivative instruments on the Statement of Operations, categorized by primary underlying risk exposure.
| |
| |
| |
Net change in unrealized appreciation/depreciation |
| |
The following summarizes the range of volume in the Fund's derivative instruments during the six months ended June 30, 2023.
Note 4: Related Party Transactions
Investment advisory fee The Fund pays an investment advisory fee monthly at an annual rate of 0.40% of the Fund’s average daily net assets to Dodge & Cox, investment manager of the Fund. The agreement further provides that Dodge & Cox shall waive its fee to the extent that such fee plus all other ordinary operating expenses of the Fund exceed 0.75% of the average daily net assets for the year.
Administrative services fee The Fund pays Dodge & Cox a fee for administrative and shareholder services. The fee is accrued daily and paid monthly equal to an annual rate of the average daily net assets of 0.10% for Class I shares and 0.05% for Class X shares. Under this agreement, Dodge & Cox also pays for the Fund's transfer agent fees.
Expense reimbursement Dodge & Cox has contractually agreed to reimburse the Fund for all ordinary expenses to the extent necessary to maintain the ratio of total operating expenses of the Class X shares to average net assets of the Class X shares at 0.41% through April 30, 2026. The term of the agreement will automatically renew for subsequent three-year terms unless terminated with at least 30 days’ written notice by either party prior to the end of the then-current term. For the six months ended June 30, 2023, Dodge & Cox reimbursed expenses of $6,344,344.
Fund officers and trustees All officers and two of the trustees of the Trust are current or former senior executive officers of Dodge & Cox. The Trust pays a fee only to those trustees who are not affiliated with Dodge & Cox.
Note 5: Income Tax Information and Distributions to Shareholders
A provision for federal income taxes is not required since the Fund intends to continue to qualify as a regulated investment company under Subchapter M of the Internal Revenue Code and distribute all of
its taxable income to shareholders. Distributions are determined in accordance with income tax regulations, and such amounts may differ from net investment income and realized gains for financial reporting purposes. The Fund may also designate a portion of the amount paid to redeeming shareholders as a distribution for tax purposes. Financial reporting records are adjusted for permanent book to tax differences at year end to reflect tax character. Book to tax differences are primarily due to differing treatments of redemptions in-kind, wash sales, certain corporate action transactions, derivatives, and distributions.
Distributions during the periods noted below were characterized as follows for federal income tax purposes:
| Six Months Ended
June 30, 2023 | Year Ended
December 31, 2022 |
| | |
| | |
| | |
| | |
| | |
| | |
The components of distributable earnings on a tax basis are reported as of the Fund's most recent year end. At December 31, 2022, the tax basis components of distributable earnings were as follows:
Undistributed ordinary income | |
Undistributed long-term capital gain | |
Net unrealized appreciation | |
Total distributable earnings | |
At June 30, 2023, unrealized appreciation and depreciation for investments based on cost for federal income tax purposes were as follows:
| |
| |
| |
Net unrealized appreciation | |
Fund management has reviewed the tax positions for open periods (three years and four years, respectively, from filing the Fund’s Federal and State tax returns) as applicable to the Fund, and has determined that no provision for income tax is required in the Fund’s financial statements.
Note 6: Redemptions In-Kind
During the six months ended June 30, 2023, the Fund distributed securities and cash as payment for redemptions of Class I shares. For financial reporting purposes, the Fund realized a net gain of $236,555,605 attributable to the redemptions in-kind: $196,139,704 from unaffiliated issuers and $40,415,901 from affiliated issuers. For tax purposes, no capital gain on the redemptions in-kind was recognized.
PAGE 13 ◾ Dodge & Cox Stock Fund
Notes to Financial Statements (unaudited)
Note 7: Loan Facilities
Pursuant to an exemptive order issued by the Securities and Exchange Commission (SEC), the Fund may participate in an interfund lending facility (Facility). The Facility allows the Fund to borrow money from or loan money to the Funds. Loans under the Facility are made for temporary or emergency purposes, such as to fund shareholder redemption requests. Interest on borrowings is the average of the current repurchase agreement rate and the bank loan rate. There was no activity in the Facility during the period.
All Funds in the Trust participate in a $500 million committed credit facility (Line of Credit) with State Street Bank and Trust Company, to be utilized for temporary or emergency purposes to fund shareholder redemptions or for other short-term liquidity purposes. The maximum amount available to the Fund is $250 million. Each Fund pays an annual commitment fee on its pro-rata portion of the Line of Credit. For the six months ended June 30, 2023, the Fund’s
commitment fee amounted to $268,757 and is reflected as a Miscellaneous Expense in the Statement of Operations. Interest on borrowings is charged at the prevailing rate. There were no borrowings on the Line of Credit during the period.
Note 8: Purchases and Sales of Investments
For the six months ended June 30, 2023, purchases and sales of securities, other than short-term securities, aggregated $3,798,680,470 and $5,005,139,227, respectively.
Note 9: Subsequent Events
Fund management has determined that no material events or transactions occurred subsequent to June 30, 2023, and through the date of the Fund’s financial statements issuance, which require disclosure in the Fund’s financial statements.
Dodge & Cox Stock Fund ◾ PAGE 14
Financial Highlights (unaudited)
Selected data and ratios
(for a share outstanding throughout each period) | | |
| | | | | | |
| | | | | | |
Net asset value, beginning of period | | | | | | |
Income from investment operations: | | | | | | |
| | | | | | |
Net realized and unrealized gain (loss) | | | | | | |
Total from investment operations | | | | | | |
Distributions to shareholders from: | | | | | | |
| | | | | | |
| | | | | | |
| | | | | | |
Net asset value, end of period | | | | | | |
| | | | | | |
Ratios/supplemental data: | | | | | | |
Net assets, end of period (millions) | | | | | | |
Ratio of expenses to average net assets | | | | | | |
Ratio of net investment income to average net assets | | | | | | |
| | | | | | |
| | | | | | |
Net asset value, beginning of period | | | | | | |
Income from investment operations: | | | | | | |
| | | | | | |
Net realized and unrealized gain (loss) | | | | | | |
Total from investment operations | | | | | | |
Distributions to shareholders from: | | | | | | |
| | | | | | |
| | | | | | |
| | | | | | |
Net asset value, end of period | | | | | | |
| | | | | | |
Ratios/supplemental data: | | | | | | |
Net assets, end of period (millions) | | | | | | |
Ratio of expenses to average net assets | | | | | | |
Ratio of expenses to average net assets, before reimbursement by investment manager | | | | | | |
Ratio of net investment income to average net assets | | | | | | |
| | | | | | |
| Net investment income per share includes significant amounts received for EU reclaims related to prior years, which amounted to approximately $0.20 per share. Excluding such amounts, the ratio of net investment income to average net assets would have been 1.87%. |
| |
| For 2022, the period covers 5/2/2022 (commencement of operations) to 12/31/2022 |
See accompanying Notes to Financial Statements
PAGE 15 ◾ Dodge & Cox Stock Fund
Board Approval of Funds’ Investment Advisory Agreement and Investment Advisory Fees
(unaudited)
On June 1, 2023, the Board of Trustees (the “Board”) of the Dodge & Cox Funds (the “Trust”), including the members of the Board who are not “interested persons” of Dodge & Cox (as such term is defined in the Investment Company Act of 1940) (the “Independent Trustees”), voted to continue the Investment Advisory Agreement between Dodge & Cox and the Trust (the “Advisory Agreement”) in effect for an additional year beginning July 1, 2023 for each series of the Trust (each a “Fund”). Prior to the Board’s vote, the Trust’s Contract Review Committee, consisting solely of Independent Trustees, met with independent counsel to the Independent Trustees on May 8 and June 1, 2023, to discuss whether the Investment Advisory Agreement should be continued. At its June 1 meeting, the Board, including the Independent Trustees, concluded that the Investment Advisory Agreement is fair and reasonable. In considering the Investment Advisory Agreement, the Board, including the Independent Trustees, did not identify any single factor or particular information as all-important or controlling. In reaching the decision to continue the Investment Advisory Agreement in effect, the Board considered several factors, and reached the conclusions, described below:
Nature, Extent and Quality of Services Provided by Dodge & Cox
◾ The Board considered the nature, extent, and quality of the services provided by Dodge & Cox to each Fund under the Advisory Agreement. This consideration included, among other things, Dodge & Cox’s investment process and philosophy; the education and experience of the principal personnel of Dodge & Cox who provide such services; the other resources (including technology) that Dodge & Cox uses in managing the Funds’ portfolios; Dodge & Cox’s record of compliance with the Funds’ investment policies and restrictions and relevant regulatory and tax compliance requirements; and such matters as Dodge & Cox’s business continuity planning and insurance coverage.
◾ The Board concluded that the nature, extent, and quality of the services Dodge & Cox provides are consistent with the terms of the Advisory Agreement and support the recommendation to continue the Advisory Agreement in effect for the coming year.
◾ The Board also took note of the nature, extent, and quality of the broad range of services that Dodge & Cox provides to the Funds and their shareholders under a separate Administrative and Shareholder Services Agreement. Although that Agreement does not require Board approval on an annual basis, the services provided thereunder are an important part of the Funds’ overall relationship with Dodge & Cox, and the Board’s understanding and assessment of those services was a factor in its decision to recommend continuation of the Investment Advisory Agreement.
Investment Performance
◾ The Board reviewed information regarding the total return of each Fund over the most recent 1-, 3-, 5-, 10-, and 20-year periods (or since Fund inception, if shorter). The Board compared these returns to those of the Fund’s broad benchmark index and, for the Stock, International Stock, Global Stock, and Balanced Funds, to those of a relevant value-oriented index. The Board also considered the volatility of the Funds’ investment returns over various time horizons, including both volatility data provided by Broadridge Financial Solutions (“Broadridge”) and longer-term volatility measures presented by Dodge & Cox.
◾ In addition, the Board reviewed a report prepared by Broadridge comparing each Fund’s performance with the performance of other mutual funds in such Fund’s broad Morningstar category (as modified by Broadridge to include only those funds that have similar share class and expense characteristics to such Fund’s, the “Morningstar custom category”), as well as with the performance of a smaller peer group of comparable funds identified by Broadridge (such Fund’s “peer group”). The Board received information regarding the methodology and process underlying the construction of the Morningstar custom categories and peer groups, and any changes in the methodology from prior years. The Board also reviewed a report prepared by Dodge & Cox comparing each Fund’s performance to the composite performance of other accounts (if any) managed by Dodge & Cox using the same investment approach as the Fund. This information regarding the performance of other mutual funds and of other accounts managed by Dodge & Cox provided helpful context for the Board’s evaluation of the Funds’ performance.
◾ The Board concluded that the investment performance and volatility experienced by each Fund were consistent with Dodge & Cox’s long-term, research-driven, bottom-up, active investment style and support the recommendation to continue the Advisory Agreement in effect for an additional year.
Fees and Expense Ratios
◾ The Board reviewed a comparison prepared by Broadridge of the net expense ratio of each Fund (including the separate expense ratios of the two share classes of those Funds that have a dual class structure), and the various elements of those expense ratios, to those of mutual funds in (1) the Fund’s Morningstar custom category and (2) the Fund’s peer group.
◾ For each Fund for which such a comparison is relevant, the Board reviewed information regarding the fee rates Dodge & Cox charges for managing other accounts using the same investment approach as the Fund. The Board took note of the broader scope of services that Dodge & Cox provides to the Funds than to separate accounts and sub-advised funds, as well as differences in regulatory, litigation, and other risks associated with sponsoring a mutual fund as compared to managing separate accounts or sub-advising another
Dodge & Cox Stock Fund ◾ PAGE 16
sponsor’s mutual fund, and certain characteristics of the market for institutional separate account management services.
◾ The Board concluded, after discussion and based on all the relevant information it received, that the advisory fee rate that each Fund pays to Dodge & Cox under the Advisory Agreement is reasonable in relation to the scope and quality of the services that Dodge & Cox provides to such Fund thereunder.
◾ In assessing the Funds’ expense ratios and the fees the Funds pay to Dodge & Cox, the Board took note of and discussed with Dodge & Cox changes over the past several years in the competitive landscape for asset management services. The Board anticipates further changes in the competitive landscape and will continue to monitor and assess the Funds’ competitive position.
Costs of Services Provided and Profits Realized by Dodge & Cox from its Relationship to the Funds
◾ Dodge & Cox informed the Board that it operates as a unified business, with most employees providing services to support the firm and its clients across multiple strategies and/or products. Consequently the firm does not utilize cost accounting to allocate expenses across lines of business or across the Funds for management purposes. Also, the firm is owned exclusively by its senior managers and other active employees, and generally distributes substantially all of its net revenues each year to its employees, either as compensation or as distributions with respect to the shares they own in the firm. Accordingly, it is difficult, and in the Board’s view not especially meaningful, to attempt to calculate a specific profit margin associated with Dodge & Cox’s relationship to any particular Fund.
◾ The Board believes that Dodge & Cox’s commitment to employee ownership of the firm enhances its ability to attract and retain key investment and other management professionals and reinforces a long-term perspective on the management of the firm and the Funds, which the Board believe aligns well with the interests of the Funds and their shareholders.
◾ The Board noted that the employee-shareholders of Dodge & Cox give up a substantial stock value (which would be taxed at long-term capital gains rates) as a consequence of the firm’s independence from outside ownership; the estimated market value of the company is substantially in excess of its book value.
◾ The Board also considered that Dodge & Cox’s fee revenues from the Funds fluctuate from year to year based on changes in the aggregate net assets of the Funds, and that the firm has continued to invest in improved systems, additional compliance resources, and enhanced research capabilities despite these fluctuations.
◾ The Board concluded that Dodge & Cox’s profits are a keystone of its independence, stability, and long-term investment performance.
Economies and Benefits of Scale
◾ The Board considered whether there have been economies or benefits of scale as the Funds have grown over the longer term, and whether fee levels reflect economies of scale for the benefit of Fund investors. In the Board’s view any consideration of economies of scale must take account of the relatively low overall fee and expense structure of the Funds. The Funds generally rank favorably when compared to their Broadridge custom categories and peer groups, on a net expense ratio basis.
◾ Dodge & Cox has built economies of scale into its fee structure by charging relatively low fees at the beginning of operations. A comparison of the Funds’ advisory fee rates to those of many otherwise comparable funds that employ fee “breakpoints” shows that the Funds’ advisory fee rates are in general relatively lower from the first dollar. As a result of their straightforward share class and fee structure and relatively low total expenses, the Funds provide small investors with access to professional, active portfolio management and related services at a reasonable cost. In addition to building economies of scale into its fee rates from the first dollar of each Fund’s assets, Dodge & Cox has capped the expenses borne by certain Funds in their early years of operations when those Funds are not yet operating at scale. The Global Bond Fund has benefited from such an expense cap since its inception in 2014, as has the Emerging Markets Stock Fund since its inception in 2021. Dodge & Cox has agreed to continue expense caps for those Funds, and for the X share class of each of the other Funds, through April 30, 2026.
◾ Over the years, Dodge & Cox has voluntarily forgone opportunities for growth in its assets under management and revenues in order to protect the Funds’ ability to achieve investment returns for shareholders. Dodge & Cox closed the International Stock Fund for a number of years beginning in 2015 and previously closed other Funds and limited the growth of its separate account business during periods of high growth--to Dodge & Cox’s economic detriment--and continues to closely monitor the size of the Funds.
◾ The Board also noted that Dodge & Cox has continued to make additional expenditures on staff and information technology to enable it to enhance its investment processes and to implement effectively the Funds’ strategies. The Board also considered that there may be certain diseconomies of scale associated with managing very large asset pools such as several of the Funds, insofar as certain of the costs or risks associated with managing the Funds potentially increase at a rate that exceeds the rate of asset growth.
PAGE 17 ◾ Dodge & Cox Stock Fund
Fall-Out Benefits
◾ The Board concluded that “fall-out” benefits derived by Dodge & Cox from its relationship with the Funds are not a significant issue.
Fund Holdings
The Fund provides a complete list of its holdings on a quarterly basis by filing the lists with the SEC on Form N-CSR (as of the end of the second and fourth quarters) and on Part F of Form N-PORT (as of the end of the first and third quarters). Shareholders may view the Fund’s Forms N-CSR and Part F of N-PORT on the SEC’s website at sec.gov. A list of the Fund’s quarter-end holdings is also available at dodgeandcox.com on or about the 15th day following each quarter end and remains available on the website until the list is updated for the subsequent quarter.
Proxy Voting
For a free copy of the Fund’s proxy voting policies and procedures, please call 800-621-3979, visit the Fund’s website at dodgeandcox.com, or visit the SEC’s website at sec.gov. Information regarding how the Fund voted proxies relating to portfolio securities during the most recent 12-month period ended June 30 is also available at dodgeandcox.com or shareholders may view the Fund's Form N-PX at sec.gov.
Household Mailings
The Fund routinely mails shareholder reports and summary prospectuses to shareholders and, on occasion, proxy statements. In order to reduce the volume of mail, when possible, only one copy of these documents will be sent to shareholders who are part of the same family and share the same residential address.
If you have a direct account with the Funds and you do not want the mailing of shareholder reports and summary prospectuses combined with other members in your household, contact the Funds at 800-621-3979. Your request will be implemented within 30 days.
Dodge & Cox Stock Fund ◾ PAGE 18
dodgeandcox.com
For Fund literature, transactions, and account
information, please visit the Funds’ website.
or write or call:
Dodge & Cox Funds
P.O. Box 219502
Kansas City, Missouri 64121-9502
(800) 621-3979
Investment Manager
Dodge & Cox
555 California Street, 40th Floor
San Francisco, California 94104
(415) 981-1710
Principal Underwriter
Foreside Fund Services, LLC
3 Canal Plaza, Suite 100
Portland, Maine 04101
(866) 251-6920
This report is submitted for the general information of the shareholders of the Fund. The report is not authorized for distribution to prospective investors in the Fund unless it is accompanied by a current prospectus.
This report reflects our views, opinions, and portfolio holdings as of June 30, 2023, the end of the reporting period. Any such views are subject to change at any time based upon market or other conditions and Dodge & Cox disclaims any responsibility to update such views. These views may not be relied on as investment advice and, because investment decisions for a Dodge & Cox Fund are based on numerous factors, may not be relied on as an indication of trading intent on behalf of any Dodge & Cox Fund.
Global Stock Fund | Class I (dodwx) | Class X (doxwx)
ESTABLISHED 2008
06/23 GSF SAR Printed on recycled paper 
To Our Shareholders (unaudited)
The Dodge & Cox Global Stock Fund—Class I had a total return of 10.94% for the six-month period ended June 30, 2023, compared to a return of 13.93% for the MSCI All Country World Index (ACWI).1
Market Commentary
Global equities continued to appreciate in the second quarter, after performing strongly in the first quarter of 2023. During the first half of 2023, the MSCI ACWI posted a total return of 13.9%, a resilient performance amid macroeconomic uncertainty, geopolitical concerns, and heightened volatility.
Global growth stocks2 outperformed value stocks by 20.0 percentage points during the first half of the year.3 The growth-oriented Information Technology and Communication Services sectors outperformed, while the value-oriented Energy, Real Estate, and Materials sectors underperformed. Notably, seven large technology-related companies (Alphabet, Amazon, Apple, Meta Platforms, Microsoft, NVIDIA, and Tesla), which together represented only 13.9% of the MSCI ACWI, accounted for about half of the Index’s total return.4
With the recent rise in leading growth stocks, the valuation gap between value and growth stocks has widened: the MSCI ACWI Value Index5 now trades at 12.0 times forward earnings6 compared to 24.5 times for the MSCI ACWI Growth Index.7 In addition, international equities continue to trade at a substantial discount to U.S. equities: 13.0 times forward earnings for the MSCI EAFE Index, compared to 20.1 times for the S&P 500 Index.8
Investment Strategy
In the first half of 2023, the Fund had a positive absolute return. While it underperformed the MSCI ACWI by 3.0 percentage points, the Fund outperformed the MSCI ACWI Value by 6.7 percentage points.9 The Fund’s underweight position and the performance of holdings in the Information Technology sector were the biggest detractors versus the MSCI ACWI. The three largest Information Technology companies in the MSCI ACWI—Apple, Microsoft, and NVIDIA—comprised 10.3% of the Index on June 30 and accounted for almost a third of the Index’s return. Of these three companies, the Fund held only an underweight position in Microsoft10 (2.0% of the Fund’s net assets compared to 3.8% of the MSCI ACWI).
True to our value-oriented investment approach and focus on individual security selection, during the first six months of 2023, we trimmed areas of the Fund that saw their valuations increase, such as Information Technology and Communication Services (notable examples included Meta, Baidu, and NetEase). We also trimmed outperformers such as General Electric and FedEx. We leaned into areas of the market with more attractive valuations, including Financials (where we started a position in Truist Financial) and Transportation (where we initiated a position in Norfolk Southern).
Relative to the MSCI ACWI, the Fund continues to be overweight Financials (discussed below) and underweight Information Technology. By region, the Fund continues to be overweight international and underweight the United States. These relative weights are the culmination of our bottom-up research process, which focuses on individual security selection within the context of broader market conditions.
At Dodge & Cox, market volatility plays to our investment strengths. Our long-term investment horizon and valuation discipline help us take advantage of price dislocations in the market and, importantly, maintain conviction in the face of macroeconomic uncertainty. Our bottom-up approach enables us to capitalize on a variety of opportunities, ranging from deep value turnarounds to mispriced secular growth opportunities. The long tenure of our team of investment professionals helps us develop unique insights based on deep institutional knowledge of individual companies and industry dynamics.
The global economy currently faces challenges, including elevated inflation and rate hikes across major economies, as well as uncertainty around China’s economic recovery (discussed below). These challenges also present opportunities. The Fund’s diversified portfolio trades at only 10.5 times forward earnings, a significant discount to the MSCI ACWI at 16.3 times.
Our Perspectives on the Financials Sector
The Financials sector (28.9% of the Fund) has been a detractor from the Fund’s results relative to the MSCI ACWI this year, due to the Fund’s overweight position. In March, two U.S. regional banks not held in the Fund—Silicon Valley Bank and Signature Bank—collapsed, which was followed by share price weakness across Financials, and in particular banks with weaker funding, sizable unrealized securities losses, and a greater concentration of uninsured customer deposits. In May, regulators seized First Republic Bank (also not held in the Fund) and sold the majority of its assets to JPMorgan Chase.
We do not believe the weakness in U.S. Financials signals broader systemic risk for the sector. The Fund’s Financials exposure is broadly diversified across U.S., European, and emerging market banks, capital markets, and other financial services. The Fund’s U.S. Financials holdings represent only 10.6% of the Fund. The Fund’s largest U.S. Financials holdings include financial institutions focused on capital markets or financial services with relatively little credit risk exposure (e.g., Bank of New York Mellon, Charles Schwab, Fiserv) and Wells Fargo, a global, systemically important bank that already complies with tougher regulatory standards than regional banks and will likely gain deposit market share.
Following widespread bank share price declines, the Fund opportunistically started a position in Truist, a large U.S. regional bank. With Truist, we stress-tested earnings for possible adverse changes to deposits, credit quality, and regulations. We also explored how margins might evolve based on different scenarios for deposit flows and balance sheet composition. We analyzed Truist’s commercial real estate exposure and potential losses in stressed scenarios. We continue to monitor changes in bank funding dynamics by analyzing the Fed’s weekly aggregate data, industry data, and pricing information in the public domain. We believe the combination of Truist’s low valuation (7.3 times forward earnings, which is 40% below its long-term average), high starting dividend yield, and integration of BB&T and SunTrust offered us an opportunity to start a new position in an out-of-favor sector.
PAGE 1 ◾ Dodge & Cox Global Stock Fund
Finding Value in China Internet
After a strong finish to 2022, the MSCI China Index11 declined 5.5%, and the CSI Overseas China Internet Index12 was down 11.9% in the first half of 2023, as China’s post-COVID economic recovery was slower than expected and geopolitical tensions heightened. We continued to closely monitor holdings with exposure to this region. While we initially trimmed a number of China-related holdings—such as Prosus and Baidu—in the first quarter, we added to Alibaba and JD.com as valuations declined in the second quarter.
Alibaba, one of the largest China Internet13 holdings in the Fund, is a multinational technology company that started in e-commerce retailing. In late March, the company announced plans for a reorganization, which would separate its six business segments into independently run companies. Each of these business units would have a standalone board, its own incentive programs, and self-financing opportunities. We were encouraged by this announcement and anticipate increased productivity, enhanced operational agility, faster decision making, and an acceleration of growth. Alibaba has proven it can adapt in a very competitive environment. We will continue to monitor the reorganization. Trading at 9.9 times forward earnings, Alibaba comprises a 1.5% position in the Fund.
New Holding in Norfolk Southern
During the second quarter, we also initiated a position in Norfolk Southern, a railroad company with operations in the Eastern portion of the United States. The company competes in a stable duopoly (with CSX) whose participants prioritize return on invested capital (ROIC)14 and shareholder returns. Due to the highly publicized derailment of one of its trains in Ohio, Norfolk Southern’s shares underperformed significantly. Unfortunately, there are hundreds of train derailments in the United States each year; however, Norfolk Southern has dramatically improved its own safety record over the past two decades. The company is highly focused on operating a safer railroad and has committed to being the gold standard of safety in the railroad industry.
Norfolk Southern’s operating margins today materially lag its competition. The company can consistently pass along cost increases and has opportunities to improve margins, free cash flow15, and ROIC over time. We believe Norfolk Southern will see an improvement in its long-term volume growth as railroads take market share from trucks and the impact of declining revenues from the shrinking coal business diminishes. The company should also benefit as concerns about the financial impact of the derailment recede. We believe recent developments provided us an opportunity to buy an excellent franchise at a discounted valuation.
In Closing
Since 1930, Dodge & Cox has navigated many challenging periods. In our experience, patience and persistence in turbulent markets have often been rewarded in the long run. We remain optimistic about the long-term outlook for the Fund. Valuation changes can occur swiftly and without warning, so we encourage our shareholders to maintain a long-term perspective.
Thank you for your continued confidence in Dodge & Cox. As always, we welcome your comments and questions.
For the Board of Trustees, | |
| |
Dana M. Emery,
Chair and President | |
July 31, 2023
| All returns are stated in U.S. dollars, unless otherwise noted. The Funds’ total returns include the reinvestment of dividend and capital gain distributions, but have not been adjusted for any income taxes payable by shareholders on these distributions or on Fund share redemptions. Index returns include dividend and/or interest income but, unlike Fund returns, do not reflect fees or expenses. The MSCI ACWI (All Country World Index) is a broad-based, unmanaged equity market index aggregated from developed market and emerging market country indicies. |
| Generally, stocks that have lower valuations are considered “value” stocks, while those with higher valuations are considered “growth” stocks. |
| For the six months ended June 30, 2023, the MSCI ACWI Value Index had a total return of 4.25% and the MSCI ACWI Growth Index had a total return of 24.25%. |
| Alphabet, Amazon, Apple, Meta Platforms, Microsoft, NVIDIA, and Tesla had a combined average weight of 13.9% in the MSCI ACWI Index during the first half of 2023. |
| The MSCI ACWI Value Index captures large- and mid-cap securities exhibiting overall value style characteristics across developed market and emerging market countries. The value investment style characteristics for index construction are defined using three variables: book value to price, 12-month forward earnings to price and dividend yield. |
| Price-to-earnings (forward) ratios are calculated using 12-month forward earnings estimates from third-party sources as of the reporting period. Estimates reflect a consensus of sell-side analyst estimates, which may lag as market conditions change. |
| The MSCI ACWI Growth Index captures large- and mid-cap securities exhibiting overall growth style characteristics across developed market and emerging market countries. The growth investment style characteristics for index construction are defined using five variables: long-term forward EPS growth rate, short-term forward EPS growth rate, current internal growth rate, long-term historical EPS growth trend, and long-term historical sales per share growth trend. |
| The MSCI EAFE (Europe, Australasia, Far East) Index is a broad-based, unmanaged equity market index aggregated from developed market country indices, excluding the United States and Canada. The S&P 500 Index is a market capitalization- weighted index of 500 large-capitalization stocks commonly used to represent the U.S. equity market. |
| Return for the Global Stock Fund’s Class I shares. |
| The use of specific examples does not imply that they are more or less attractive investments than the portfolio’s other holdings. |
| The MSCI China Index captures large- and mid-cap representation across China A shares, H shares, B shares, Red chips, P chips, and foreign listings (e.g., ADRs). |
| The CSI Overseas China Internet Index is designed to measure the performance of the investable universe of publicly traded China-based companies whose primary business or businesses are in the Internet and Internet-related sectors. |
| China Internet comprises Alibaba, Baidu, JD.com, and Prosus. |
| Return on Invested Capital (ROIC) reflects the rate of return generated by a company using the funds contributed by its capital providers. This metric helps assess whether a company is creating value with its investments. |
| Free cash flow is the cash a company generates after paying all expenses and loans. |
Dodge & Cox Global Stock Fund ◾ PAGE 2
Year-to-Date Performance Review for the Fund's Class I Shares (unaudited)
The Fund underperformed the MSCI ACWI by 2.99 percentage points year to date.
Key contributors to relative results included the Fund's:
◾ Industrials holdings (up 31% compared to up 13% for the MSCI ACWI sector), particularly General Electric, FedEx, and Mitsubishi Electric;
◾ Overweight position in Communication Services and specific holdings, such as Alphabet and Meta Platforms; and
◾ Positions in XP and Fresenius Medical Care.
Key detractors from relative results included the Fund's:
◾ Underweight position in Information Technology, including underweight holdings, such as Microsoft;
◾ Consumer Discretionary holdings (up 10% compared to up 25% for the MSCI ACWI sector), including JD.com;
◾ Energy holdings—specifically Ovintiv, Occidental Petroleum, and Suncor Energy—and overweight position in the worst-performing sector of the market; and
◾ Positions in Charles Schwab and Incyte.
Key Characteristics of Dodge & Cox
Independent Organization
Dodge & Cox is one of the largest privately owned investment managers in the world. We remain committed to independence, with a goal of providing the highest-quality investment management service to our existing clients.
Over 90 Years of Investment Experience
Dodge & Cox was founded in 1930. We have a stable and well- qualified team of investment professionals, most of whom have spent their entire careers at Dodge & Cox.
Experienced Investment Team
The Global Equity Investment Committee, which is the decision-making body for the Global Stock Fund, is a six-member committee with an average tenure of 25 years at Dodge & Cox.
One Business with a Single Decision-Making Office
Dodge & Cox manages equity (domestic, international, and global), fixed income (domestic and global), and balanced investments, all from one office in San Francisco.
Consistent Investment Approach
Our team decision-making process involves thorough, bottom-up fundamental analysis of each investment.
Long-Term Focus and Low Expenses
We invest with a three- to five-year investment horizon, which has historically resulted in low turnover relative to our peers. We manage Funds that maintain low expense ratios.
Risks: The Fund is subject to market risk, meaning holdings in the Fund may decline in value for extended periods due to the financial prospects of individual companies, or due to general market and economic conditions. Investing in non-U.S. securities may entail risk due to foreign economic and political developments; this risk may be increased when investing in emerging markets. The Fund is also subject to currency risk. Please read the prospectus and summary prospectus for specific details regarding the Fund's risk profile.
Fund holdings and sector allocations are subject to change at any time and should not be considered recommendations to buy or sell any security. Please see the Portfolio of Investments section in this report for a complete list of fund holdings.
PAGE 3 ◾ Dodge & Cox Global Stock Fund
Growth of $10,000 Over 10 Years (unaudited)
For an Investment Made on June 30, 2013 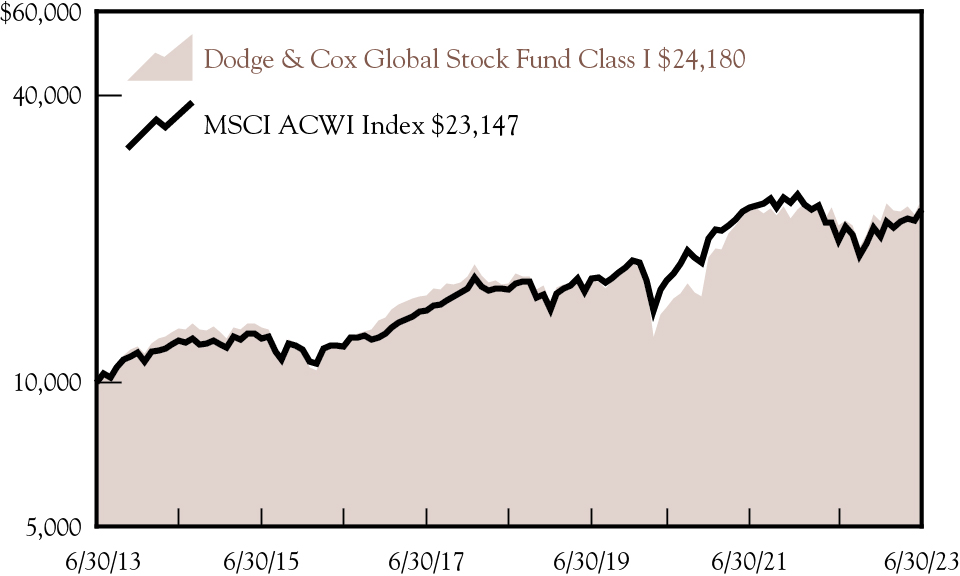
Average Annual Total Return
For Periods Ended June 30, 2023
| | | | |
Dodge & Cox Global Stock Fund | | | | |
| | | | |
| | | | |
| | | | |
Expense Ratios
Per the Prospectus Dated May 1, 2023
| | |
Dodge & Cox Global Stock Fund | | |
| | |
| | |
| The Class X shares inception date is May 2, 2022. The returns shown prior to that date are for the Class I shares. |
| Dodge & Cox has contractually agreed to reimburse the Fund for all ordinary expenses to the extent necessary to maintain Total Annual Fund Operating Expenses of the Fund’s Class X at 0.52% until April 30, 2026. This agreement cannot be terminated prior to April 30, 2026 other than by resolution of the Fund’s Board of Trustees. For purposes of the foregoing, ordinary expenses shall not include nonrecurring shareholder account fees, fees and expenses associated with Fund shareholder meetings, fees on portfolio transactions such as exchange fees, dividends and interest on short positions, fees and expenses of pooled investment vehicles that are held by the Fund, interest expenses and other fees and expenses related to any borrowings, taxes, brokerage fees and commissions and other costs and expenses relating to the acquisition and disposition of Fund investments, other expenditures which are capitalized in accordance with generally accepted accounting principles, and other non-routine expenses or extraordinary expenses not incurred in the ordinary course of the Fund’s business, such as litigation expenses. The term of the agreement will automatically renew for subsequent three- year terms unless terminated with at least 30 days’ written notice by either party prior to the end of the then-current term. The agreement does not permit Dodge & Cox to recoup any fees waived or payments made to the Fund for a prior year. |
Returns represent past performance and do not guarantee future results. Investment return and share price will fluctuate with market conditions, and investors may have a gain or loss when shares are sold. Fund performance changes over time and currently may be significantly lower than stated. Performance is updated and published monthly. Visit the Fund's website at dodgeandcox.com or call 800-621-3979 for current performance figures.
The Fund's total returns include the reinvestment of dividend and capital gain distributions, but have not been adjusted for any income taxes payable by shareholders on these distributions or on Fund share redemptions. Index returns include dividends but, unlike Fund returns, do not reflect fees or expenses. Effective May 1, 2022, the Fund's benchmark changed from the MSCI World Index (Net) to the MSCI All Country World Index (Net) ("MSCI ACWI Index"). The Fund's investment manager believes the MSCI ACWI Index is a more appropriate index against which to measure performance in light of the Fund’s portfolio and investable universe. The MSCI ACWI (All Country World Index) Index is a broad-based, unmanaged equity market index aggregated from developed market and emerging market country indices. MSCI makes no express or implied warranties or representations and shall have no liability whatsoever with respect to any MSCI data contained herein. The MSCI data may not be further redistributed or used as a basis for other indices or any securities or financial products. This report is not approved, reviewed, or produced by MSCI.
MSCI ACWI is a service mark of MSCI Barra. For more information about this index, visit:
www.dodgeandcox.com/globalstockfund
Dodge & Cox Global Stock Fund ◾ PAGE 4
Portfolio Information (unaudited) June 30, 2023
Sector Diversification(a) | |
| |
| |
| |
| |
| |
| |
| |
| |
| |
| |
| |
Region Diversification(a) | |
| |
Developed Europe (excluding United Kingdom) | |
| |
| |
| |
| |
| |
| Net Cash & Other includes cash, short-term investments, derivatives, receivables, and payables. |
Fund Expense Example (unaudited)
As a Fund shareholder, you incur ongoing Fund costs, including management fees and other Fund expenses. All mutual funds have ongoing costs, sometimes referred to as operating expenses. The following example shows ongoing costs of investing in the Fund and can help you understand these costs and compare them with those of other mutual funds. The example assumes a $1,000 investment held for the six months indicated.
Actual Expenses
The first line of each share class in the table below provides information about actual account values and expenses based on the actual returns of the share class. You may use the information in this line, together with your account balance, to estimate the expenses that you paid over the period. Simply divide your account value by $1,000 (for example, an $8,600 account value divided by $1,000 = 8.6), then multiply the result by the number in the first line under the heading “Expenses Paid During Period” to estimate the expenses you paid on your account during this period.
Hypothetical Example for Comparison with Other Mutual Funds
Information on the second line of each share class in the table can help you compare ongoing costs of investing in the Fund with those of other mutual funds. This information may not be used to estimate the actual ending account balance or expenses you paid during the period. The hypothetical “Ending Account Value” is based on the actual expense ratio of the share class and an assumed 5% annual rate of return before expenses (not the actual return of the share class). The amount under the heading “Expenses Paid During Period” shows the hypothetical expenses your account would have incurred under this scenario. You can compare this figure with the 5% hypothetical examples that appear in shareholder reports of other mutual funds.
Six Months Ended
June 30, 2023 | Beginning Account Value
1/1/2023 | Ending Account Value
6/30/2023 | Expenses Paid
During Period* | |
| | | | |
| | | | |
Based on hypothetical 5% yearly return | | | | |
| | | | |
| | | | |
Based on hypothetical 5% yearly return | | | | |
| Expenses are equal to the annualized expense ratio, multiplied by the average account value over the period, multiplied by 181/365 (to reflect the one-half year period). |
The expenses shown in the table highlight ongoing costs only and do not reflect any transactional fees or account maintenance fees. Though other mutual funds may charge such fees, please note that the Fund does not charge transaction fees (e.g., redemption fees, sales loads) or universal account maintenance fees (e.g., small account fees).
PAGE 5 ◾ Dodge & Cox Global Stock Fund
Consolidated Portfolio of Investments (unaudited) June 30, 2023
|
| | |
Communication Services: 11.2% |
Media & Entertainment: 10.3% |
Alphabet, Inc., Class C(a) (United States) | | |
Baidu, Inc. ADR(a) (China) | | |
Charter Communications, Inc., Class A(a) (United States) | | |
Comcast Corp., Class A (United States) | | |
DISH Network Corp., Class A(a) (United States) | | |
Fox Corp., Class A (United States) | | |
Grupo Televisa SAB ADR (Mexico) | | |
Meta Platforms, Inc., Class A(a) (United States) | | |
| | |
Telecommunication Services: 0.9% |
T-Mobile U.S., Inc.(a) (United States) | | |
| | |
Consumer Discretionary: 8.1% |
Automobiles & Components: 0.5% |
Stellantis NV (Netherlands) | | |
Consumer Discretionary Distribution & Retail: 5.3% |
Alibaba Group Holding, Ltd. ADR(a) (China) | | |
Amazon.com, Inc.(a) (United States) | | |
| | |
Prosus NV, Class N (China) | | |
| | |
Consumer Durables & Apparel: 0.5% |
| | |
|
Booking Holdings, Inc.(a) (United States) | | |
Entain PLC (United Kingdom) | | |
| | |
| | |
|
Consumer Staples Distribution & Retail: 0.0% |
| | |
Food, Beverage & Tobacco: 1.7% |
Anheuser-Busch InBev SA/NV (Belgium) | | |
Molson Coors Beverage Co., Class B (United States) | | |
| | |
Household & Personal Products: 1.0% |
Haleon PLC (United Kingdom) | | |
| | |
|
Occidental Petroleum Corp. (United States) | | |
Occidental Petroleum Corp., Warrant(a) (United States) | | |
Ovintiv, Inc. (United States) | | |
Suncor Energy, Inc. (Canada) | | |
| | |
|
| | |
|
|
| | |
Banco Santander SA (Spain) | | |
Barclays PLC (United Kingdom) | | |
| | |
| | |
| | |
Standard Chartered PLC (United Kingdom) | | |
Truist Financial Corp. (United States) | | |
Wells Fargo & Co. (United States) | | |
| | |
Financial Services: 11.0% |
Bank of New York Mellon Corp. (United States) | | |
Capital One Financial Corp. (United States) | | |
Charles Schwab Corp. (United States) | | |
Fidelity National Information Services, Inc. (United States) | | |
Fiserv, Inc.(a) (United States) | | |
Jackson Financial, Inc., Class A (United States) | | |
UBS Group AG (Switzerland) | | |
XP, Inc., Class A(a) (Brazil) | | |
| | |
|
| | |
Aviva PLC (United Kingdom) | | |
MetLife, Inc. (United States) | | |
Prudential PLC (Hong Kong) | | |
| | |
| | |
|
Health Care Equipment & Services: 4.3% |
CVS Health Corp. (United States) | | |
Fresenius Medical Care AG & Co. KGaA (Germany) | | |
GE HealthCare Technologies, Inc. (United States) | | |
The Cigna Group (United States) | | |
UnitedHealth Group, Inc. (United States) | | |
| | |
Pharmaceuticals, Biotechnology & Life Sciences: 13.1% |
Alnylam Pharmaceuticals, Inc.(a) (United States) | | |
| | |
BioMarin Pharmaceutical, Inc.(a) (United States) | | |
Elanco Animal Health, Inc.(a) (United States) | | |
| | |
Incyte Corp.(a) (United States) | | |
Novartis AG (Switzerland) | | |
Regeneron Pharmaceuticals, Inc.(a) (United States) | | |
See accompanying Notes to Consolidated Financial StatementsDodge & Cox Global Stock Fund ◾ PAGE 6
Consolidated Portfolio of Investments (unaudited) June 30, 2023
Common Stocks (continued) |
| | |
Roche Holding AG (Switzerland) | | |
| | |
| | |
| | |
|
|
General Electric Co. (United States) | | |
Johnson Controls International PLC (United States) | | |
Mitsubishi Electric Corp. (Japan) | | |
Raytheon Technologies Corp. (United States) | | |
| | |
|
FedEx Corp. (United States) | | |
Norfolk Southern Corp. (United States) | | |
| | |
| | |
Information Technology: 7.2% |
Semiconductors & Semiconductor Equipment: 0.7% |
Microchip Technology, Inc. (United States) | | |
Software & Services: 4.8% |
Cognizant Technology Solutions Corp., Class A (United States) | | |
Microsoft Corp. (United States) | | |
VMware, Inc., Class A(a) (United States) | | |
| | |
Technology, Hardware & Equipment: 1.7% |
Cisco Systems, Inc. (United States) | | |
Coherent Corp.(a) (United States) | | |
TE Connectivity, Ltd. (United States) | | |
| | |
| | |
|
Akzo Nobel NV (Netherlands) | | |
Celanese Corp. (United States) | | |
| | |
Holcim, Ltd. (Switzerland) | | |
LyondellBasell Industries NV, Class A (United States) | | |
Mitsubishi Chemical Group Corp. (Japan) | | |
| | |
Teck Resources, Ltd., Class B (Canada) | | |
| | |
|
Real Estate Management & Development: 0.2% |
Daito Trust Construction Co., Ltd. (Japan) | | |
Total Common Stocks
(Cost $8,074,036,073) | | |
|
| | |
|
|
Itau Unibanco Holding SA, Pfd (Brazil) | | |
Information Technology: 0.9% |
Technology, Hardware & Equipment: 0.9% |
Samsung Electronics Co., Ltd., Pfd (South Korea) | | |
Total Preferred Stocks
(Cost $129,809,853) | | |
Short-Term Investments: 1.6% |
| | |
Repurchase Agreements: 1.2% |
Fixed Income Clearing Corporation(c) 5.04%, dated 6/30/23, due 7/3/23, maturity value $71,029,820 | | |
Fixed Income Clearing Corporation(c) 2.45%, dated 6/30/23, due 7/3/23, maturity value $51,157,443 | | |
| | |
|
State Street Institutional U.S. Government Money Market Fund - Premier Class | | |
Total Short-Term Investments
(Cost $164,071,358) | |
Total Investments In Securities
(Cost $8,367,917,284) | | |
Other Assets Less Liabilities | | |
| | |
| |
| Valued using significant unobservable inputs. |
| Repurchase agreement is collateralized by U.S. Treasury Notes 1.875%-4.25%, 10/15/25-2/15/41. Total collateral value is $124,589,981. |
| The Fund usually classifies a company or issuer based on its country of risk, but may designate a different country in certain circumstances. |
| |
| |
ADR: American Depositary Receipt |
PAGE 7 ◾ Dodge & Cox Global Stock FundSee accompanying Notes to Consolidated Financial Statements
Consolidated Portfolio of Investments (unaudited) June 30, 2023
Futures Contracts
| | | | Value /
Unrealized
Appreciation/
(Depreciation) |
Euro Stoxx 50 Index— Long Position | | | | |
Yen Denominated Nikkei 225 Index— Long Position | | | | |
| | | | |
Currency Forward Contracts
| | | | Unrealized Appreciation
(Depreciation) |
CNH: Chinese Yuan Renminbi |
| | | | | | |
| | | | | | |
| | | | | | |
| | | | | | |
| | | | | | |
| | | | | | |
| | | | | | |
| | | | | | |
| | | | | | |
| | | | | | |
| | | | | | |
| | | | | | |
| | | | | | |
| | | | | | |
| | | | | | |
| | | | | | |
| | | | | | |
| | | | | | |
| | | | | | |
| | | | | | |
| | | | | | |
| | | | | | |
| | | | | | |
| | | | | | |
| | | | | | |
| | | | | | |
| | | | | | |
| | | | | | |
| | | | | | |
| | | | | | |
| | | | | | |
| | | | | | |
| | | | | | |
| | | | | | |
| | | | | | |
| | | | | | |
| | | | | | |
| | | | | | |
| | | | | | |
| | | | | | |
| | | | | | |
| | | | | | |
| | | | | | |
| | | | | | |
| | | | | | |
| | | | | | |
| | | | | | |
| | | | | | |
| | | | | | |
| | | | | | |
| | | | | | |
| | | | | | |
| | | | | | |
See accompanying Notes to Consolidated Financial StatementsDodge & Cox Global Stock Fund ◾ PAGE 8
Consolidated Portfolio of Investments (unaudited) June 30, 2023
Currency Forward Contracts (continued)
| | | | Unrealized Appreciation (Depreciation) |
| | | | | | |
| | | | | | |
Unrealized gain on currency forward contracts | | | |
Unrealized loss on currency forward contracts | | | |
Net unrealized gain on currency forward contracts | | | | |
The listed counterparty may be the parent company or one of its subsidiaries.
PAGE 9 ◾ Dodge & Cox Global Stock FundSee accompanying Notes to Consolidated Financial Statements
Consolidated
Statement of Assets and Liabilities (unaudited)
| |
|
Investments in securities, at value (cost $8,367,917,284) | |
Unrealized appreciation on currency forward contracts | |
| |
Cash denominated in foreign currency (cost $1,678,677) | |
Deposits with broker for futures contracts | |
Receivable for variation margin for futures contracts | |
Receivable for investments sold | |
Receivable for Fund shares sold | |
Dividends and interest receivable | |
Expense reimbursement receivable | |
Prepaid expenses and other assets | |
| |
|
Unrealized depreciation on currency forward contracts | |
Cash received as collateral for currency forward contracts | |
Payable for investments purchased | |
Payable for Fund shares redeemed | |
Deferred foreign capital gains tax | |
| |
| |
| |
| |
|
| |
| |
| |
|
| |
Shares outstanding (par value $0.01 each, unlimited shares authorized) | |
Net asset value per share | |
|
| |
Shares outstanding (par value $0.01 each, unlimited shares authorized) | |
Net asset value per share | |
Consolidated
Statement of Operations (unaudited)
| Six Months Ended
June 30, 2023 |
| |
Dividends (net of foreign taxes of $8,457,194) | |
| |
| |
| |
| |
Administrative services fees | |
| |
| |
Custody and fund accounting fees | |
| |
| |
| |
| |
| |
| |
Expenses reimbursed by investment manager | |
| |
| |
Realized and Unrealized Gain (Loss): | |
| |
Investments in securities (net of foreign capital gains tax of $122,129) | |
| |
Currency forward contracts | |
Foreign currency transactions | |
Net change in unrealized appreciation/depreciation | |
Investments in securities (net of change in deferred foreign capital gains tax of $1,686,476) | |
| |
Currency forward contracts | |
Foreign currency translation | |
Net realized and unrealized gain | |
Net Change in Net Assets From Operations | |
See accompanying Notes to Consolidated Financial StatementsDodge & Cox Global Stock Fund ◾ PAGE 10
Consolidated
Statement of Changes in Net Assets (unaudited)
| | |
| | |
| | |
| | |
| | |
Net change in unrealized appreciation/depreciation | | |
| | |
Distributions to Shareholders: | | |
| | |
| | |
| | |
| | |
| | |
Proceeds from sales of shares | | |
Reinvestment of distributions | | |
| | |
| | |
Proceeds from sales of shares | | |
Reinvestment of distributions | | |
| | |
Net change from Fund share transactions | | |
Total change in net assets | | |
| | |
| | |
| | |
| | |
| | |
| | |
| | |
| | |
Net change in shares outstanding | | |
| | |
| | |
| | |
| | |
Net change in shares outstanding | | |
PAGE 11 ◾ Dodge & Cox Global Stock FundSee accompanying Notes to Consolidated Financial Statements
Notes to Consolidated Financial Statements (unaudited)
Note 1: Organization and Significant Accounting Policies
Dodge & Cox Global Stock Fund (the “Fund”) is one of the series constituting the Dodge & Cox Funds (the “Trust” or the “Funds”). The Trust is organized as a Delaware statutory trust and is registered under the Investment Company Act of 1940, as amended, as an open-end management investment company. The Fund commenced operations on May 1, 2008, and seeks long-term growth of principal and income. The Fund invests primarily in a diversified portfolio of U.S. and foreign equity securities. Foreign investing, especially in developing countries, has special risks such as currency and market volatility and political and social instability. These and other risk considerations are discussed in the Fund’s Prospectus.
On May 1, 2022, the then-outstanding shares of the Fund were redesignated as Class I Shares, and Class X shares of the Fund were established. The share classes have different eligibility requirements and expense structures due to differing shareholder servicing arrangements. The share classes have the same rights as to redemption, dividends and liquidation proceeds, and voting privileges, except that each class has the exclusive right to vote on matters affecting only its class.
The Fund is an investment company and follows the accounting and reporting guidance issued in Topic 946 by the Financial Accounting Standards Board. The financial statements have been prepared in conformity with accounting principles generally accepted in the United States of America, which require the use of estimates and assumptions by management. Actual results may differ from those estimates. Significant accounting policies are as follows:
Security valuation The Fund’s net assets are normally valued as of the scheduled close of trading on the New York Stock Exchange (NYSE), generally 4 p.m. Eastern Time, each day that the NYSE is open for business.
Portfolio holdings for which market quotes are readily available are valued at market value. Listed securities, for example, are generally valued using the official quoted close price or the last sale on the exchange that is determined to be the primary market for the security. Convertible debt securities are valued using prices received from independent pricing services which utilize dealer quotes, recent transaction data, pricing models, and other inputs to arrive at market-based valuations. Pricing models may consider quoted prices for similar securities, interest rates, cash flows (including prepayment speeds), and credit risk. Equity total return swaps are valued using prices received from independent pricing services which utilize market quotes from underlying reference instruments. Exchange-traded derivatives are valued at the settlement price determined by the relevant exchange. Short-term securities less than 60 days to maturity may be valued at amortized cost if amortized cost approximates current value. Mutual funds are valued at their respective net asset values. Security values are not discounted based on the size of the Fund’s position and may differ from the value a Fund receives upon sale of the securities.
Investments initially valued in currencies other than the U.S. dollar are converted to the U.S. dollar using prevailing exchange rates. Currency forward contracts are valued based on the prevailing forward exchange rates of the underlying currencies. As a result, the
Fund’s net assets may be affected by changes in the value of currencies in relation to the U.S. dollar.
If market quotations are not readily available or if normal valuation procedures produce valuations that are deemed unreliable or inappropriate under the circumstances existing at the time, the investment will be valued at fair value as determined in good faith by Dodge & Cox. The Board of Trustees has appointed Dodge & Cox, the Fund’s investment manager, as its "valuation designee", as permitted by Rule 2a-5 under the Investment Company Act of 1940, to make fair value determinations in accordance with the Dodge & Cox Funds Valuation Policies (“Valuation Policies”), subject to Board oversight. Dodge & Cox has established a Pricing Committee that is comprised of representatives from Treasury, Legal, Compliance, and Operations. The Pricing Committee is responsible for implementing the Valuation Policies, including determining the fair value of securities and other investments when necessary. The Pricing Committee considers relevant indications of value that are reasonably available to it in determining the fair value assigned to a particular security, such as the value of similar financial instruments, trading volumes, contractual restrictions on disposition, related corporate actions, and changes in economic conditions. In doing so, the Pricing Committee employs various methods for calibrating fair valuation approaches, including a regular review of key inputs and assumptions, back-testing, and review of any related market activity.
As trading in securities on most foreign exchanges is normally completed before the close of the NYSE, the value of non-U.S. securities can change by the time the Fund calculates its net asset value. To address these changes, the Fund may utilize adjustment factors provided by an independent pricing service to systematically value non-U.S. securities at fair value. These adjustment factors are based on statistical analyses of subsequent movements and changes in U.S. markets and financial instruments trading in U.S. markets that represent foreign securities or baskets of securities.
Valuing securities through a fair value determination involves greater reliance on judgment than valuation of securities based on readily available market quotations. In some instances, lack of information and uncertainty as to the significance of information may lead to a conclusion that a prior valuation is the best indication of a security’s value. When fair value pricing is employed, the prices of securities used by the Fund to calculate its net asset value may differ from quoted or published prices for the same securities.
Security transactions, investment income, expenses, and distributions Security transactions are recorded on the trade date. Realized gains and losses on securities sold are determined on the basis of identified cost.
Dividend income and corporate action transactions are recorded on the ex-dividend date, or when the Fund first learns of the dividend/corporate action if the ex-dividend date has passed. Non-cash dividends, if any, are recorded at the fair market value of the securities received. Dividends characterized as return of capital for U.S. tax purposes are recorded as a reduction of cost of investments and/or realized gain. Interest income is recorded on the accrual basis.
Expenses are recorded on the accrual basis. Some expenses of the Trust can be directly attributed to a specific series. Expenses
Dodge & Cox Global Stock Fund ◾ PAGE 12
Notes to Consolidated Financial Statements (unaudited)
which cannot be directly attributed are allocated among the Funds in the Trust using methodologies determined by the nature of the expense.
Distributions to shareholders are recorded on the ex-dividend date.
Share class accounting Investment income, realized and unrealized gains and losses and expenses, other than class-specific expenses, are allocated to each share class of the Fund based upon the proportion of net assets of each class.
Foreign taxes The Fund is subject to foreign taxes which may be imposed by certain countries in which the Fund invests. The Fund endeavors to record foreign taxes based on applicable foreign tax law. Withholding taxes are incurred on certain foreign dividends and are accrued at the time the associated dividend is recorded. The Fund files withholding tax reclaims in certain jurisdictions to recover a portion of amounts previously withheld. The Fund records a reclaim receivable based on, among other things, a jurisdiction’s legal obligation to pay reclaims as well as payment history and market convention. In consideration of recent decisions rendered by European courts, the Fund has filed for additional reclaims ("EU reclaims") related to prior years. A corresponding receivable is established when both the amount is known and significant contingencies or uncertainties regarding collectability are removed. These amounts, if any, are reported in dividends and interest receivable in the Consolidated Statement of Assets and Liabilities. Expenses incurred related to filing EU reclaims are recorded on the accrual basis in professional services in the Consolidated Statement of Operations. Expenses that are contingent upon successful EU reclaims are recorded in professional services in the Consolidated Statement of Operations once the amount is known.
Capital gains taxes are incurred upon disposition of certain foreign securities. Expected capital gains taxes on appreciated securities, if any, are accrued as unrealized losses and incurred capital gains taxes are reflected as realized losses upon the sale of the related security. Currency taxes may be incurred when the Fund purchases certain foreign currencies related to securities transactions
Foreign currency translation The books and records of the Fund are maintained in U.S. dollars. Foreign currency amounts are translated into U.S. dollars at the prevailing exchange rates of such currencies against the U.S. dollar. The market value of investment securities and other assets and liabilities are translated at the exchange rate as of the valuation date. Purchases and sales of investment securities, income, and expenses are translated at the exchange rate prevailing on the transaction date.
Reported realized and unrealized gain (loss) on investments include foreign currency gain (loss) related to investment transactions.
Reported realized and unrealized gain (loss) on foreign currency transactions and translation include the following: disposing/holding of foreign currency, the difference in exchange rate between the trade and settlement dates on securities transactions, the difference in exchange rate between the accrual and payment dates on dividends, and currency losses on the purchase of foreign currency in certain countries that impose taxes on such transactions.
Repurchase agreements Repurchase agreements are transactions under which a Fund purchases a security from a counterparty and agrees to resell the security to that counterparty on a specified future date at the same price, plus a specified interest rate. The Fund’s repurchase agreements are secured by U.S. government or agency securities. It is the Fund’s policy that its regular custodian or third party custodian take possession of the underlying collateral securities, the fair value of which exceeds the principal amount of the repurchase transaction, including accrued interest, at all times. In the event of default by the counterparty, the Fund has the contractual right to liquidate the collateral securities and to apply the proceeds in satisfaction of the obligation.
Consolidation The Fund may invest in certain securities through its wholly owned subsidiary, Dodge & Cox Global Stock Fund Cayman, Ltd. (the “Subsidiary”). The Subsidiary is a Cayman Islands exempted company and invests in certain securities consistent with the investment objective of the Fund. The Fund’s Consolidated Financial Statements, including the Consolidated Portfolio of Investments, consist of the holdings and accounts of the Fund and the Subsidiary. All intercompany transactions and balances have been eliminated. At June 30, 2023, the Subsidiary had net assets of $100, which represented less than 0.01% of the Fund’s consolidated net assets.
Indemnification Under the Trust’s organizational documents, its officers and trustees are indemnified against certain liabilities arising out of the performance of their duties to the Trust. In addition, in the normal course of business the Trust enters into contracts that provide general indemnities to other parties. The Trust’s maximum exposure under these arrangements is unknown, as this would involve future claims that may be made against the Trust that have not yet occurred.
Note 2: Valuation Measurements
Various inputs are used in determining the value of the Fund’s investments. These inputs are summarized in the three broad levels below.
◾ Level 1: Unadjusted quoted prices in active markets for identical securities
◾ Level 2: Other significant observable inputs (including quoted prices for similar securities, market indices, interest rates, credit risk, forward exchange rates, etc.)
◾ Level 3: Significant unobservable inputs (including Fund management’s assumptions in determining the fair value of investments)
The inputs or methodology used for valuing securities are not necessarily an indication of the risk associated with investing in those securities.
The following is a summary of the inputs used to value the Fund’s holdings at June 30, 2023:
| | LEVEL 2
(Other Significant
Observable
Inputs) | LEVEL 3
(Signficant
Unobservable
Inputs) |
|
|
| | | |
PAGE 13 ◾ Dodge & Cox Global Stock Fund
Notes to Consolidated Financial Statements (unaudited)
| | LEVEL 2 (Other Significant Observable Inputs) | LEVEL 3 (Signficant Unobservable Inputs) |
| | | |
| | | |
| | | |
| | | |
| | | |
| | | |
| | | |
| | | |
| | | |
|
| | | |
| | | |
|
| | | |
| | | |
| | | |
|
|
| | | |
| | | |
Currency Forward Contracts |
| | | |
| | | |
Note 3: Derivative Instruments
The Fund may use derivatives either to minimize the impact of certain risks to one or more of its investments (as a ‘‘hedging technique’’) or to implement its investment strategy. A derivative is a financial instrument whose value is derived from a security, currency, interest rate, index, or other financial instrument.
Futures contracts Futures contracts involve an obligation to purchase or sell (depending on whether the Fund has entered a long or short futures contract, respectively) an asset at a future date, at a price set at the time the contract is purchased. Futures contracts are exchange-traded. Upon entering into a futures contract, the Fund is required to deposit an amount of cash or liquid assets (referred to as "initial margin") in a segregated account with the clearing broker to secure the Fund's obligation to perform. Initial margin is returned to the Fund when the futures contract is closed. Subsequent payments (referred to as "variation margin") are made to or received from the clearing broker on a daily basis based on changes in the market value of the contract. Changes in the market value of open futures contracts are recorded as unrealized appreciation or depreciation in the Consolidated Statement of Operations. Realized gains and losses on futures contracts are recorded in the Consolidated Statement of Operations at the closing or expiration of the contracts. Cash deposited with a broker as initial margin is recorded in the Consolidated Statement of Assets and Liabilities. A receivable and/or payable to brokers for daily variation margin is also recorded in the Consolidated Statement of Assets and Liabilities.
Investments in futures contracts may include certain risks, which may be different from, and potentially greater than, those of the
underlying securities. To the extent the Fund uses futures, it is exposed to additional volatility and potential losses resulting from leverage.
The Fund used equity index futures contracts to create equity exposure, equal to some or all of its non-equity net assets.
Currency forward contracts Currency forward contracts are agreements to purchase or sell a specific currency at a specified future date and price. Currency forward contracts are traded over-the-counter. The values of currency forward contracts change daily based on the prevailing forward exchange rates of the underlying currencies. Changes in the value of open contracts are recorded as unrealized appreciation or depreciation in the Consolidated Statement of Operations. When a currency forward contract is closed, the Fund records a realized gain or loss in the Consolidated Statement of Operations equal to the difference between the value at the time the contract was opened and the value at the time it was closed.
Losses from these transactions may arise from unfavorable changes in currency values or if a counterparty does not perform under a contract’s terms.
The Fund used currency forward contracts to hedge direct and indirect foreign currency exposure.
Additional derivative information The following identifies the location on the Consolidated Statement of Assets and Liabilities and values of the Fund's derivative instruments categorized by primary underlying risk exposure.
| | Foreign
Exchange
Derivatives | |
| | | |
Unrealized appreciation on currency forward contracts | | | |
| | | |
| | | |
| | | |
Unrealized depreciation on currency forward contracts | | | |
| | | |
| | | |
| Includes cumulative appreciation (depreciation). Only the current day’s variation margin is reported in the Consolidated Statement of Assets and Liabilities. |
The following summarizes the effect of derivative instruments on the Consolidated Statement of Operations, categorized by primary underlying risk exposure.
| | Foreign
Exchange
Derivatives | |
| | | |
| | | |
Currency forward contracts | | | |
| | | |
Net change in unrealized appreciation/depreciation |
| | | |
Currency forward contracts | | | |
| | | |
Dodge & Cox Global Stock Fund ◾ PAGE 14
Notes to Consolidated Financial Statements (unaudited)
The following summarizes the range of volume in the Fund's derivative instruments during the six months ended June 30, 2023.
| | |
| | |
Currency forward contracts | | |
The Fund may enter into various over-the-counter derivative contracts governed by International Swaps and Derivatives Association master agreements (“ISDA agreements”). The Fund’s ISDA agreements, which are separately negotiated with each dealer counterparty, specify (i) events of default and other events permitting a party to terminate some or all of the contracts thereunder and (ii) the process by which those contracts will be valued for purposes of determining termination payments. If some or all of the contracts under a master agreement are terminated because of an event of default or similar event, the values of all terminated contracts must be netted to determine a single payment owed by one party to the other. To the extent amounts owed to the Fund by its counterparties are not collateralized, the Fund is at risk of those counterparties’ non-performance. The Fund attempts to mitigate counterparty credit risk by entering into contracts only with counterparties it believes to be of good credit quality, by exchanging collateral, and by monitoring the financial stability of those counterparties.
For financial reporting purposes, the Fund does not offset assets and liabilities that are subject to a master netting arrangement in the Consolidated Statement of Assets and Liabilities.
The Fund’s ability to net assets and liabilities and to offset collateral pledged or received is based on contractual netting/offset provisions in the ISDA agreements. The following table presents the Fund’s net exposure to each counterparty for derivatives that are subject to enforceable master netting arrangements as of June 30, 2023.
| Gross
Amount of
Recognized
Assets | Gross
Amount of
Recognized
Liabilities | | |
| | | | |
| | | | |
| | | | |
| | | | |
| | | | |
| | | | |
| Cash collateral pledged/(received) in excess of derivative assets/liabilities is not presented in this table. The total cash collateral is presented on the Fund's Consolidated Statement of Assets and Liabilities. |
| Represents the net amount receivable from (payable to) the counterparty in the event of a default. |
Note 4: Related Party Transactions
Investment advisory fee The Fund pays an investment advisory fee monthly at an annual rate of 0.50% of the Fund’s average daily net assets to Dodge & Cox, investment manager of the Fund.
Administrative services fee The Fund pays Dodge & Cox a fee for administrative and shareholder services. The fee is accrued daily and paid monthly equal to an annual rate of the average daily net
assets of 0.10% for Class I shares and 0.05% for Class X shares. Under this agreement, Dodge & Cox also pays for the Fund's transfer agent fees.
Expense reimbursement Dodge & Cox has contractually agreed to reimburse the Fund for all ordinary expenses to the extent necessary to maintain the ratio of total operating expenses of the Class X shares to average net assets of the Class X shares at 0.52% through April 30, 2026. The term of the agreement will automatically renew for subsequent three-year terms unless terminated with at least 30 days’ written notice by either party prior to the end of the then-current term. For the six months ended June 30, 2023, Dodge & Cox reimbursed expenses of $106,352.
Fund officers and trustees All officers and two of the trustees of the Trust are current or former senior executive officers of Dodge & Cox. The Trust pays a fee only to those trustees who are not affiliated with Dodge & Cox.
Note 5: Income Tax Information and Distributions to Shareholders
A provision for federal income taxes is not required since the Fund intends to qualify as a regulated investment company under Subchapter M of the Internal Revenue Code and distribute all of its taxable income to shareholders. Distributions are determined in accordance with income tax regulations, and such amounts may differ from net investment income and realized gains for financial reporting purposes. The Fund may also designate a portion of the amount paid to redeeming shareholders as a distribution for tax purposes. Financial reporting records are adjusted for permanent book to tax differences at year end to reflect tax character. Book to tax differences are primarily due to differing treatments of wash sales, investments in passive foreign investment companies, foreign currency realized gain (loss), foreign capital gains tax, certain corporate action transactions, derivatives, and distributions.
Distributions during the periods noted below were characterized as follows for federal income tax purposes:
| Six Months Ended
June 30, 2023 | Year Ended
December 31, 2022 |
| | |
| | |
| | |
| | |
| | |
| | |
The components of distributable earnings on a tax basis are reported as of the Fund's most recent year end. At December 31, 2022, the tax basis components of distributable earnings were as follows:
| |
Net unrealized appreciation | |
Total distributable earnings | |
| Represents capital loss incurred between November 1, 2022 and December 31, 2022. As permitted by tax regulation, the Fund has elected to treat this loss as arising in 2023. |
PAGE 15 ◾ Dodge & Cox Global Stock Fund
Notes to Consolidated Financial Statements (unaudited)
At June 30, 2023, unrealized appreciation and depreciation for investments and derivatives based on cost for federal income tax purposes were as follows:
| |
| |
| |
Net unrealized appreciation | |
Fund management has reviewed the tax positions for open periods (three years and four years, respectively, from filing the Fund’s Federal and State tax returns) as applicable to the Fund, and has determined that no provision for income tax is required in the Fund’s financial statements.
Note 6: Loan Facilities
Pursuant to an exemptive order issued by the Securities and Exchange Commission (SEC), the Fund may participate in an interfund lending facility (Facility). The Facility allows the Fund to borrow money from or loan money to the Funds. Loans under the Facility are made for temporary or emergency purposes, such as to fund shareholder redemption requests. Interest on borrowings is the average of the current repurchase agreement rate and the bank loan rate. There was no activity in the Facility during the period.
All Funds in the Trust participate in a $500 million committed credit facility (Line of Credit) with State Street Bank and Trust Com
pany, to be utilized for temporary or emergency purposes to fund shareholder redemptions or for other short-term liquidity purposes. The maximum amount available to the Fund is $250 million. Each Fund pays an annual commitment fee on its pro-rata portion of the Line of Credit. For the six months ended June 30, 2023, the Fund’s commitment fee amounted to $30,503 and is reflected as a Miscellaneous Expense in the Consolidated Statement of Operations. Interest on borrowings is charged at the prevailing rate. There were no borrowings on the Line of Credit during the period.
Note 7: Purchases and Sales of Investments
For the six months ended June 30, 2023, purchases and sales of securities, other than short-term securities, aggregated $981,562,253 and $1,407,369,017, respectively.
Note 8: Subsequent Events
In July 2023, the Fund received a tender offer to purchase shares of Magnit PJSC, an illiquid Fund holding in Russia, in exchange for cash. The Fund tendered its shares for a price equivalent to 0.1% of Fund net assets. Fund management has determined that no other material events or transactions occurred subsequent to June 30, 2023, and through the date of the Fund’s financial statements issuance, which require disclosure in the Fund’s financial statements.
Dodge & Cox Global Stock Fund ◾ PAGE 16
Consolidated Financial Highlights (unaudited)
Selected data and ratios
(for a share outstanding throughout each period) | | |
| | | | | | |
| | | | | | |
Net asset value, beginning of period | | | | | | |
Income from investment operations: | | | | | | |
| | | | | | |
Net realized and unrealized gain (loss) | | | | | | |
Total from investment operations | | | | | | |
Distributions to shareholders from: | | | | | | |
| | | | | | |
| | | | | | |
| | | | | | |
Net asset value, end of period | | | | | | |
| | | | | | |
Ratios/supplemental data: | | | | | | |
Net assets, end of period (millions) | | | | | | |
Ratio of expenses to average net assets | | | | | | |
Ratio of net investment income to average net assets | | | | | | |
| | | | | | |
| | | | | | |
Net asset value, beginning of period | | | | | | |
Income from investment operations: | | | | | | |
| | | | | | |
Net realized and unrealized gain (loss) | | | | | | |
Total from investment operations | | | | | | |
Distributions to shareholders from: | | | | | | |
| | | | | | |
| | | | | | |
| | | | | | |
Net asset value, end of period | | | | | | |
| | | | | | |
Ratios/supplemental data: | | | | | | |
Net assets, end of period (millions) | | | | | | |
Ratio of expenses to average net assets | | | | | | |
Ratio of expenses to average net assets, before reimbursement by investment manager | | | | | | |
Ratio of net investment income to average net assets | | | | | | |
| | | | | | |
| Net investment income per share includes significant amounts received for EU reclaims related to prior years, which amounted to approximately $0.01 per share. Excluding such amounts, the ratio of net investment income to average net assets would have been 1.47%. |
| |
| For 2022, the period covers 5/2/2022 (commencement of operations) to 12/31/2022 |
See accompanying Notes to Consolidated Financial Statements
PAGE 17 ◾ Dodge & Cox Global Stock Fund
Board Approval of Funds’ Investment Advisory Agreement and Investment Advisory Fees
(unaudited)
On June 1, 2023, the Board of Trustees (the “Board”) of the Dodge & Cox Funds (the “Trust”), including the members of the Board who are not “interested persons” of Dodge & Cox (as such term is defined in the Investment Company Act of 1940) (the “Independent Trustees”), voted to continue the Investment Advisory Agreement between Dodge & Cox and the Trust (the “Advisory Agreement”) in effect for an additional year beginning July 1, 2023 for each series of the Trust (each a “Fund”). Prior to the Board’s vote, the Trust’s Contract Review Committee, consisting solely of Independent Trustees, met with independent counsel to the Independent Trustees on May 8 and June 1, 2023, to discuss whether the Investment Advisory Agreement should be continued. At its June 1 meeting, the Board, including the Independent Trustees, concluded that the Investment Advisory Agreement is fair and reasonable. In considering the Investment Advisory Agreement, the Board, including the Independent Trustees, did not identify any single factor or particular information as all-important or controlling. In reaching the decision to continue the Investment Advisory Agreement in effect, the Board considered several factors, and reached the conclusions, described below:
Nature, Extent and Quality of Services Provided by Dodge & Cox
◾ The Board considered the nature, extent, and quality of the services provided by Dodge & Cox to each Fund under the Advisory Agreement. This consideration included, among other things, Dodge & Cox’s investment process and philosophy; the education and experience of the principal personnel of Dodge & Cox who provide such services; the other resources (including technology) that Dodge & Cox uses in managing the Funds’ portfolios; Dodge & Cox’s record of compliance with the Funds’ investment policies and restrictions and relevant regulatory and tax compliance requirements; and such matters as Dodge & Cox’s business continuity planning and insurance coverage.
◾ The Board concluded that the nature, extent, and quality of the services Dodge & Cox provides are consistent with the terms of the Advisory Agreement and support the recommendation to continue the Advisory Agreement in effect for the coming year.
◾ The Board also took note of the nature, extent, and quality of the broad range of services that Dodge & Cox provides to the Funds and their shareholders under a separate Administrative and Shareholder Services Agreement. Although that Agreement does not require Board approval on an annual basis, the services provided thereunder are an important part of the Funds’ overall relationship with Dodge & Cox, and the Board’s understanding and assessment of those services was a factor in its decision to recommend continuation of the Investment Advisory Agreement.
Investment Performance
◾ The Board reviewed information regarding the total return of each Fund over the most recent 1-, 3-, 5-, 10-, and 20-year periods (or since Fund inception, if shorter). The Board compared these returns to those of the Fund’s broad benchmark index and, for the Stock, International Stock, Global Stock, and Balanced Funds, to those of a relevant value-oriented index. The Board also considered the volatility of the Funds’ investment returns over various time horizons, including both volatility data provided by Broadridge Financial Solutions (“Broadridge”) and longer-term volatility measures presented by Dodge & Cox.
◾ In addition, the Board reviewed a report prepared by Broadridge comparing each Fund’s performance with the performance of other mutual funds in such Fund’s broad Morningstar category (as modified by Broadridge to include only those funds that have similar share class and expense characteristics to such Fund’s, the “Morningstar custom category”), as well as with the performance of a smaller peer group of comparable funds identified by Broadridge (such Fund’s “peer group”). The Board received information regarding the methodology and process underlying the construction of the Morningstar custom categories and peer groups, and any changes in the methodology from prior years. The Board also reviewed a report prepared by Dodge & Cox comparing each Fund’s performance to the composite performance of other accounts (if any) managed by Dodge & Cox using the same investment approach as the Fund. This information regarding the performance of other mutual funds and of other accounts managed by Dodge & Cox provided helpful context for the Board’s evaluation of the Funds’ performance.
◾ The Board concluded that the investment performance and volatility experienced by each Fund were consistent with Dodge & Cox’s long-term, research-driven, bottom-up, active investment style and support the recommendation to continue the Advisory Agreement in effect for an additional year.
Fees and Expense Ratios
◾ The Board reviewed a comparison prepared by Broadridge of the net expense ratio of each Fund (including the separate expense ratios of the two share classes of those Funds that have a dual class structure), and the various elements of those expense ratios, to those of mutual funds in (1) the Fund’s Morningstar custom category and (2) the Fund’s peer group.
◾ For each Fund for which such a comparison is relevant, the Board reviewed information regarding the fee rates Dodge & Cox charges for managing other accounts using the same investment approach as the Fund. The Board took note of the broader scope of services that Dodge & Cox provides to the Funds than to separate accounts and sub-advised funds, as well as differences in regulatory, litigation, and other risks associated with sponsoring a mutual fund as compared to managing separate accounts or sub-advising another
Dodge & Cox Global Stock Fund ◾ PAGE 18
sponsor’s mutual fund, and certain characteristics of the market for institutional separate account management services.
◾ The Board concluded, after discussion and based on all the relevant information it received, that the advisory fee rate that each Fund pays to Dodge & Cox under the Advisory Agreement is reasonable in relation to the scope and quality of the services that Dodge & Cox provides to such Fund thereunder.
◾ In assessing the Funds’ expense ratios and the fees the Funds pay to Dodge & Cox, the Board took note of and discussed with Dodge & Cox changes over the past several years in the competitive landscape for asset management services. The Board anticipates further changes in the competitive landscape and will continue to monitor and assess the Funds’ competitive position.
Costs of Services Provided and Profits Realized by Dodge & Cox from its Relationship to the Funds
◾ Dodge & Cox informed the Board that it operates as a unified business, with most employees providing services to support the firm and its clients across multiple strategies and/or products. Consequently the firm does not utilize cost accounting to allocate expenses across lines of business or across the Funds for management purposes. Also, the firm is owned exclusively by its senior managers and other active employees, and generally distributes substantially all of its net revenues each year to its employees, either as compensation or as distributions with respect to the shares they own in the firm. Accordingly, it is difficult, and in the Board’s view not especially meaningful, to attempt to calculate a specific profit margin associated with Dodge & Cox’s relationship to any particular Fund.
◾ The Board believes that Dodge & Cox’s commitment to employee ownership of the firm enhances its ability to attract and retain key investment and other management professionals and reinforces a long-term perspective on the management of the firm and the Funds, which the Board believe aligns well with the interests of the Funds and their shareholders.
◾ The Board noted that the employee-shareholders of Dodge & Cox give up a substantial stock value (which would be taxed at long-term capital gains rates) as a consequence of the firm’s independence from outside ownership; the estimated market value of the company is substantially in excess of its book value.
◾ The Board also considered that Dodge & Cox’s fee revenues from the Funds fluctuate from year to year based on changes in the aggregate net assets of the Funds, and that the firm has continued to invest in improved systems, additional compliance resources, and enhanced research capabilities despite these fluctuations.
◾ The Board concluded that Dodge & Cox’s profits are a keystone of its independence, stability, and long-term investment performance.
Economies and Benefits of Scale
◾ The Board considered whether there have been economies or benefits of scale as the Funds have grown over the longer term, and whether fee levels reflect economies of scale for the benefit of Fund investors. In the Board’s view any consideration of economies of scale must take account of the relatively low overall fee and expense structure of the Funds. The Funds generally rank favorably when compared to their Broadridge custom categories and peer groups, on a net expense ratio basis.
◾ Dodge & Cox has built economies of scale into its fee structure by charging relatively low fees at the beginning of operations. A comparison of the Funds’ advisory fee rates to those of many otherwise comparable funds that employ fee “breakpoints” shows that the Funds’ advisory fee rates are in general relatively lower from the first dollar. As a result of their straightforward share class and fee structure and relatively low total expenses, the Funds provide small investors with access to professional, active portfolio management and related services at a reasonable cost. In addition to building economies of scale into its fee rates from the first dollar of each Fund’s assets, Dodge & Cox has capped the expenses borne by certain Funds in their early years of operations when those Funds are not yet operating at scale. The Global Bond Fund has benefited from such an expense cap since its inception in 2014, as has the Emerging Markets Stock Fund since its inception in 2021. Dodge & Cox has agreed to continue expense caps for those Funds, and for the X share class of each of the other Funds, through April 30, 2026.
◾ Over the years, Dodge & Cox has voluntarily forgone opportunities for growth in its assets under management and revenues in order to protect the Funds’ ability to achieve investment returns for shareholders. Dodge & Cox closed the International Stock Fund for a number of years beginning in 2015 and previously closed other Funds and limited the growth of its separate account business during periods of high growth--to Dodge & Cox’s economic detriment--and continues to closely monitor the size of the Funds.
◾ The Board also noted that Dodge & Cox has continued to make additional expenditures on staff and information technology to enable it to enhance its investment processes and to implement effectively the Funds’ strategies. The Board also considered that there may be certain diseconomies of scale associated with managing very large asset pools such as several of the Funds, insofar as certain of the costs or risks associated with managing the Funds potentially increase at a rate that exceeds the rate of asset growth.
PAGE 19 ◾ Dodge & Cox Global Stock Fund
Fall-Out Benefits
◾ The Board concluded that “fall-out” benefits derived by Dodge & Cox from its relationship with the Funds are not a significant issue.
Fund Holdings
The Fund provides a complete list of its holdings on a quarterly basis by filing the lists with the SEC on Form N-CSR (as of the end of the second and fourth quarters) and on Part F of Form N-PORT (as of the end of the first and third quarters). Shareholders may view the Fund’s Forms N-CSR and Part F of N-PORT on the SEC’s website at sec.gov. A list of the Fund’s quarter-end holdings is also available at dodgeandcox.com on or about the 15th day following each quarter end and remains available on the website until the list is updated for the subsequent quarter.
Proxy Voting
For a free copy of the Fund’s proxy voting policies and procedures, please call 800-621-3979, visit the Fund’s website at dodgeandcox.com, or visit the SEC’s website at sec.gov. Information regarding how the Fund voted proxies relating to portfolio securities during the most recent 12-month period ended June 30 is also available at dodgeandcox.com or shareholders may view the Fund's Form N-PX at sec.gov.
Household Mailings
The Fund routinely mails shareholder reports and summary prospectuses to shareholders and, on occasion, proxy statements. In order to reduce the volume of mail, when possible, only one copy of these documents will be sent to shareholders who are part of the same family and share the same residential address.
If you have a direct account with the Funds and you do not want the mailing of shareholder reports and summary prospectuses combined with other members in your household, contact the Funds at 800-621-3979. Your request will be implemented within 30 days.
Dodge & Cox Global Stock Fund ◾ PAGE 20
dodgeandcox.com
For Fund literature, transactions, and account
information, please visit the Funds’ website.
or write or call:
Dodge & Cox Funds
P.O. Box 219502
Kansas City, Missouri 64121-9502
(800) 621-3979
Investment Manager
Dodge & Cox
555 California Street, 40th Floor
San Francisco, California 94104
(415) 981-1710
Principal Underwriter
Foreside Fund Services, LLC
3 Canal Plaza, Suite 100
Portland, Maine 04101
(866) 251-6920
This report is submitted for the general information of the shareholders of the Fund. The report is not authorized for distribution to prospective investors in the Fund unless it is accompanied by a current prospectus.
This report reflects our views, opinions, and portfolio holdings as of June 30, 2023, the end of the reporting period. Any such views are subject to change at any time based upon market or other conditions and Dodge & Cox disclaims any responsibility to update such views. These views may not be relied on as investment advice and, because investment decisions for a Dodge & Cox Fund are based on numerous factors, may not be relied on as an indication of trading intent on behalf of any Dodge & Cox Fund.
International Stock Fund | Class I (dodfx) | Class X (doxfx)
ESTABLISHED 2001
06/23 ISF SAR Printed on recycled paper 
To Our Shareholders (unaudited)
The Dodge & Cox International Stock Fund—Class I had a total return of 10.72% for the six-month period ended June 30, 2023, compared to a return of 11.67% for the MSCI EAFE (Europe, Australasia, Far East) Index.1
Market Commentary
International equities continued to appreciate in the first half of 2023, after performing well in the fourth quarter of 2022. Both developed and emerging markets proved to be resilient2 despite macroeconomic uncertainty, geopolitical concerns, and heightened market volatility. In March, turmoil among U.S. regional banks drove down stock prices globally. But fears of contagion dissipated after larger banks intervened, regional bank deposits stabilized, and U.S. interest rate hikes slowed.
Nevertheless, the global economic outlook remains cloudy, especially given China’s sluggish recovery. Inflation continues to moderate, but most central banks remain committed to increasing interest rates further. The valuation spread between stocks benefitting from, and those hindered by, low interest rates remains near its widest point over the past 20 years.
International growth stocks outperformed value stocks3 by 4.9 percentage points during the first half of the year.4 The growth-oriented Information Technology and Consumer Discretionary sectors outperformed, while the value-oriented Real Estate, Energy, and Materials sectors underperformed. The valuation disparity between international value and growth stocks remains wide at 2.4 standard deviations5 above the long-term average: the MSCI EAFE Value Index6 trades at 9.4 times forward earnings7 compared to 20.9 times for the MSCI EAFE Growth Index.8 In addition, international equities still trade at a substantial discount to U.S. equities: 13.0 times forward earnings for the MSCI EAFE, compared to 20.1 times for the S&P 500 Index.9
Investment Strategy
At Dodge & Cox, market volatility plays to our investment strengths. Our long-term investment horizon and valuation discipline help us take advantage of price dislocations in the market and, importantly, maintain conviction in the face of macroeconomic uncertainty. Our bottom-up approach enables us to capitalize on a variety of opportunities, ranging from deep value turnarounds to mispriced secular growth opportunities. The long tenure of our team of investment professionals helps us develop unique insights based on deep institutional knowledge of individual companies and industry dynamics.
Market volatility can create opportunities. We recently added to the Fund’s holdings in Energy and select names within China Internet.10 Within Financials, we took advantage of relative price performance to trim some emerging markets banks and add to European banks.
Energy
In both 2021 and 2022, Energy was the best-performing sector of the MSCI EAFE and contributed strongly to the Fund’s outperformance. In the preceding years, we built up an overweight position in the
sector based on a constructive view of oil and gas prices and our identification of well-managed companies trading at attractive valuations. Our positive view on commodity prices was contrarian at the time, as concerns about peaking oil demand dominated the headlines, especially during the pandemic. Based on our research, we thought demand would recover and continue to grow this decade because substitution away from oil would take longer than expected. During that period of uncertainty, we added to our overweight position, and that persistence was rewarded in later years. As share prices of the Fund’s energy investments rose, we trimmed those holdings.
In the first half of 2023, macroeconomic concerns and demand uncertainty resulted in oil price declines and relative underperformance in energy. Capitalizing on lower valuations, we added significantly to existing holdings, including Equinor, Ovintiv, TotalEnergies, and TC Energy.11 Energy was our largest addition during the first half of the year, and the Fund remains overweight Energy (7.5% versus 4.2% of the MSCI EAFE).
Equinor, a Norwegian oil and gas company, was our largest add within the sector during the period. As one of the largest natural gas suppliers to Europe, declining European gas prices on the heels of a warmer-than-average winter weighed on Equinor’s share price. At what we believe is a reasonable European gas price, the company should generate meaningful free cash flow12 while still growing its production capabilities. Management has already demonstrated discipline with that free cash flow, recently returning $17 billion to shareholders via a 50% increase in its base dividend, share buybacks, and an extraordinary dividend. Equinor (0.9% position) is attractively valued, trading at 6.6 times forward earnings with a net cash position on the balance sheet.
China Internet
After a strong finish to 2022, the MSCI China Index13 declined 5.5%, and the CSI Overseas China Internet Index14 was down 11.9% in the first half of 2023 as China’s post-COVID economic recovery was slower than expected and geopolitical tensions heightened. We continued to closely monitor holdings with exposure to this region. While we initially trimmed a number of China-related holdings—such as Prosus, Baidu, and NetEase—in the first quarter, we later reversed course in the second quarter and added to Alibaba and JD.com as valuations declined.
Alibaba, one of the largest China Internet holdings in the Fund, is a multinational technology company that started in e-commerce retailing. In late March, the company announced plans for a reorganization, which would split its six business segments into independently run companies. Each of these business units would have a standalone board, its own incentive programs, and self-financing opportunities. We were encouraged by this announcement and anticipate increased productivity, enhanced operational agility, faster decision making, and an acceleration in growth. Alibaba has proven it can adapt in a very competitive environment. We will continue to monitor the reorganization as it comes to fruition. Trading at 9.9 times forward earnings, Alibaba comprises a 1.7% position in the Fund.
PAGE 1 ◾ Dodge & Cox International Stock Fund
Financials
In March, the U.S. regional banking crisis sparked fears of broader contagion resulting in a sell-off of Financials stocks worldwide. Our global Financials team conducted intensive research on the Fund’s Financials holdings. We stress-tested their balance sheets under a variety of scenarios, engaged in frequent discussions with management teams, and closely monitored regulatory developments. Despite the volatility in the market, we concluded that the troubles at a few U.S. regional banks were not representative of the broader global banking system. Our investment approach enabled us to take advantage of that volatility by adding to selected holdings—including Barclays and BNP Paribas—and trimming UBS Group.
Shares of Barclays, a diversified retail, corporate, and investment bank based in the United Kingdom, declined 14.7% in March. As the U.S. regional banking turmoil had little impact on Barclays, we felt this share price reaction was unjustified. Over the past few years, management has grown earnings, improved returns on equity, and steadily raised both dividends and buybacks. Despite these fundamental improvements and larger returns of capital, the shares have remained relatively range bound over the past year and trade at a very low valuation. In March, the valuation dipped to around four times forward earnings, and we added to the Fund’s position. At just under five times earnings as of June 30, we believe the company trades at a large discount to its inexpensive peer group. Barclays is a 2.2% position in the Fund.
Given the U.S. banking crisis, one would not necessarily expect the international Financials sector to serve as a tailwind for performance. However, the Financials sector was the Fund’s top-contributing sector from a relative performance perspective, up 13.2% versus up 7.5% for the benchmark. Emerging market holdings were a notable contributor to the Fund’s Financials performance. Brazilian holdings XP and Itau Unibanco were two of the Fund’s best-performing Financials, with especially high returns of 52.9% and 27.1%, respectively. Given the relative performance of emerging market versus developed market Financials, we funded the adds mentioned above with trims of emerging market holdings such as ICICI Bank in India. Overall, we remain enthusiastic about the Fund’s Financials holdings, with an overweight at 26.9% compared to 18.2% for the MSCI EAFE.
In Closing
In our experience, elevated levels of market volatility and macroeconomic uncertainty can create significant opportunities for active, bottom-up managers like Dodge & Cox. We remain confident in our ability to successfully navigate challenging economic and market conditions, and we remain enthusiastic about the long-term outlook for the Fund. Valuation changes can occur swiftly and without warning, so we encourage our shareholders to maintain a long-term perspective.
Thank you for your continued confidence in our firm. As always, we welcome your comments and questions.
For the Board of Trustees, | |
| |
Dana M. Emery,
Chair and President | |
July 31, 2023
| All returns are stated in U.S. dollars, unless otherwise noted. The Funds’ total returns include the reinvestment of dividend and capital gain distributions, but have not been adjusted for any income taxes payable by shareholders on these distributions or on Fund share redemptions. Index returns include dividend and/or interest income but, unlike Fund returns, do not reflect fees or expenses. The MSCI EAFE (Europe, Australasia, Far East) Index is a broad-based, unmanaged equity market index aggregated from developed market country indices, excluding the United States and Canada. It covers approximately 85%of the free float-adjusted market capitalization in each country. |
| During the first half of 2023, the MSCI EAFE Index and the MSCI Emerging Markets Index had total returns of 11.67% and 4.89%, respectively. The MSCI Emerging Markets Index captures large- and mid-cap representation across emerging market countries. |
| Generally, stocks that have lower valuations are considered “value” stocks, while those with higher valuations are considered “growth” stocks. |
| For the six months ended June 30, 2023, the MSCI EAFE Value Index had a total return of 9.28% and the MSCI EAFE Growth Index had a total return of 14.18%. |
| Unless otherwise specified, all weightings and characteristics are as of June 30, 2023. Standard deviation measures the volatility of the Fund’s returns. Higher standard deviation represents higher volatility. |
| The MSCI EAFE Value Index captures large- and mid-cap securities exhibiting overall value style characteristics across developed market countries around the world, excluding the United States and Canada. The value investment style characteristics for index construction are defined using three variables: book value to price, 12-month forward earnings to price, and dividend yield. |
| Price-to-earnings (forward) ratios are calculated using 12-month forward earnings estimates from third-party sources as of the reporting period. Estimates reflect a consensus of sell-side analyst estimates, which may lag as market conditions change. |
| The MSCI EAFE Growth Index captures large- and mid-cap securities exhibiting overall growth style characteristics across developed market countries around the world, excluding the United States and Canada. The growth investment style characteristics for index construction are defined using five variables: long-term forward EPS growth rate, short-term forward EPS growth rate, current internal growth rate, long-term historical EPS growth trend, and long-term historical sales per share growth trend. |
| The S&P 500 Index is a market capitalization-weighted index of 500 large- capitalization stocks commonly used to represent the U.S. equity market. |
| China Internet comprises Alibaba, Baidu, JD.com, and Prosus. |
| The use of specific examples does not imply that they are more or less attractive investments than the portfolio’s other holdings. |
| Free cash flow is the cash a company generates after paying all expenses and loans. |
| The MSCI China Index captures large- and mid-cap representation across China A shares, H shares, B shares, Red chips, P chips, and foreign listings (e.g., ADRs). |
| The CSI Overseas China Internet Index is designed to measure the performance of the investable universe of publicly traded China-based companies whose primary business or businesses are in the Internet and Internet-related sectors. |
Dodge & Cox International Stock Fund ◾ PAGE 2
Year-to-Date Performance Review for the Fund's Class I Shares (unaudited)
The Fund underperformed the MSCI EAFE by 0.95 percentage points year to date.
Key contributors to relative results included the Fund's:
◾ Financials holdings, particularly XP, Banco Santander, and Itau Unibanco;
◾ Materials holdings, notably Holcim;
◾ Communication Services holdings, including NetEase; and
◾ Positions in Mitsubishi Electric and Fresenius Medical Care.
Key detractors from relative results included the Fund's:
◾ Overweight position in China Internet and certain holdings, including JD.com and Alibaba;
◾ Overweight position and holdings in Energy, notably Ovintiv, Suncor Energy, and TotalEnergies;
◾ Information Technology holdings; and
◾ Positions in Imperial Brands and Nutrien.
Key Characteristics of Dodge & Cox
Independent Organization
Dodge & Cox is one of the largest privately owned investment managers in the world. We remain committed to independence, with a goal of providing the highest-quality investment management service to our existing clients.
Over 90 Years of Investment Experience
Dodge & Cox was founded in 1930. We have a stable and well- qualified team of investment professionals, most of whom have spent their entire careers at Dodge & Cox.
Experienced Investment Team
The International Equity Investment Committee, which is the decision-making body for the International Stock Fund, is a six-member committee with average tenure of 22 years at Dodge & Cox.
One Business with a Single Decision-Making Office
Dodge & Cox manages equity (domestic, international, and global), fixed income (domestic and global), and balanced investments, all from one office in San Francisco.
Consistent Investment Approach
Our team decision-making process involves thorough, bottom-up fundamental analysis of each investment.
Long-Term Focus and Low Expenses
We invest with a three- to five-year investment horizon, which has historically resulted in low turnover relative to our peers. We manage Funds that maintain low expense ratios.
Risks: The Fund is subject to market risk, meaning holdings in the Fund may decline in value for extended periods due to the financial prospects of individual companies, or due to general market and economic conditions. Investing in non-U.S. securities may entail risk due to foreign economic and political developments; this risk may be increased when investing in emerging markets. The Fund is also subject to currency risk. Please read the prospectus and summary prospectus for specific details regarding the Fund's risk profile.
Fund holdings and sector allocations are subject to change at any time and should not be considered recommendations to buy or sell any security. Please see the Portfolio of Investments section in this report for a complete list of fund holdings.
PAGE 3 ◾ Dodge & Cox International Stock Fund
Growth of $10,000 Over 10 Years (unaudited)
For an Investment Made on June 30, 2013 
Average Annual Total Return
For Periods Ended June 30, 2023
| | | | |
Dodge & Cox International Stock Fund | | | | |
| | | | |
| | | | |
| | | | |
Expense Ratios
Per the Prospectus Dated May 1, 2023
| | |
Dodge & Cox International Stock Fund | | |
| | |
| | |
| The Class X shares inception date is May 2, 2022. The returns shown prior to that date are for the Class I shares. |
| Dodge & Cox has contractually agreed to reimburse the Fund for all ordinary expenses to the extent necessary to maintain Total Annual Fund Operating Expenses of the Fund’s Class X shares at 0.52% until April 30, 2026. This agreement cannot be terminated prior to April 30, 2026 other than by resolution of the Fund’s Board of Trustees. For purposes of the foregoing, ordinary expenses shall not include nonrecurring shareholder account fees, fees and expenses associated with Fund shareholder meetings, fees on portfolio transactions such as exchange fees, dividends and interest on short positions, fees and expenses of pooled investment vehicles that are held by the Fund, interest expenses and other fees and expenses related to any borrowings, taxes, brokerage fees and commissions and other costs and expenses relating to the acquisition and disposition of Fund investments, other expenditures which are capitalized in accordance with generally accepted accounting principles, and other non-routine expenses or extraordinary expenses not incurred in the ordinary course of the Fund’s business, such as litigation expenses. The term of the agreement will automatically renew for subsequent three- year terms unless terminated with at least 30 days’ written notice by either party prior to the end of the then-current term. The agreement does not permit Dodge & Cox to recoup any fees waived or payments made to the Fund for a prior year. |
Returns represent past performance and do not guarantee future results. Investment return and share price will fluctuate with market conditions, and investors may have a gain or loss when shares are sold. Fund performance changes over time and currently may be significantly lower than stated. Performance is updated and published monthly. Visit the Fund's website at dodgeandcox.com or call 800-621-3979 for current performance figures.
The Fund’s total returns include the reinvestment of dividend and capital gain distributions, but have not been adjusted for any income taxes payable by shareholders on these distributions or on Fund share redemptions. Index returns include dividends but, unlike Fund returns, do not reflect fees or expenses. The MSCI EAFE (Europe, Australasia, Far East) Index is a broad-based, unmanaged equity market index aggregated from developed market country indices, excluding the United States and Canada. It covers approximately 85% of the free float-adjusted market capitalization in each country. MSCI makes no express or implied warranties or representations and shall have no liability whatsoever with respect to any MSCI data contained herein. The MSCI data may not be further redistributed or used as a basis for other indices or any securities or financial products. This report is not approved, reviewed, or produced by MSCI.
MSCI EAFE is a service mark of MSCI Barra. For more information about this index, visit:
www.dodgeandcox.com/internationalstockfund
Dodge & Cox International Stock Fund ◾ PAGE 4
Portfolio Information (unaudited) June 30, 2023
Sector Diversification(a) | |
| |
| |
| |
| |
| |
| |
| |
| |
| |
| |
| |
| |
Region Diversification(a) | |
Developed Europe (excluding United Kingdom) | |
| |
| |
| |
| |
| |
| Net Cash & Other includes cash, short-term investments, derivatives, receivables, and payables. |
Fund Expense Example (unaudited)
As a Fund shareholder, you incur ongoing Fund costs, including management fees and other Fund expenses. All mutual funds have ongoing costs, sometimes referred to as operating expenses. The following example shows ongoing costs of investing in the Fund and can help you understand these costs and compare them with those of other mutual funds. The example assumes a $1,000 investment held for the six months indicated.
Actual Expenses
The first line of each share class in the table below provides information about actual account values and expenses based on the actual returns of the share class. You may use the information in this line, together with your account balance, to estimate the expenses that you paid over the period. Simply divide your account value by $1,000 (for example, an $8,600 account value divided by $1,000 = 8.6), then multiply the result by the number in the first line under the heading “Expenses Paid During Period” to estimate the expenses you paid on your account during this period.
Hypothetical Example for Comparison with Other Mutual Funds
Information on the second line of each share class in the table can help you compare ongoing costs of investing in the Fund with those of other mutual funds. This information may not be used to estimate the actual ending account balance or expenses you paid during the period. The hypothetical “Ending Account Value” is based on the actual expense ratio of the share class and an assumed 5% annual rate of return before expenses (not the actual return of the share class). The amount under the heading “Expenses Paid During Period” shows the hypothetical expenses your account would have incurred under this scenario. You can compare this figure with the 5% hypothetical examples that appear in shareholder reports of other mutual funds.
Six Months Ended
June 30, 2023 | Beginning Account Value
1/1/2023 | Ending Account Value
6/30/2023 | Expenses Paid
During Period* | |
| | | | |
| | | | |
Based on hypothetical 5% yearly return | | | | |
| | | | |
| | | | |
Based on hypothetical 5% yearly return | | | | |
| Expenses are equal to the annualized expense ratio, multiplied by the average account value over the period, multiplied by 181/365 (to reflect the one-half year period). |
The expenses shown in the table highlight ongoing costs only and do not reflect any transactional fees or account maintenance fees. Though other mutual funds may charge such fees, please note that the Fund does not charge transaction fees (e.g., redemption fees, sales loads) or universal account maintenance fees (e.g., small account fees).
PAGE 5 ◾ Dodge & Cox International Stock Fund
Consolidated Portfolio of Investments (unaudited) June 30, 2023
|
| | |
Communication Services: 3.2% |
Media & Entertainment: 2.3% |
Baidu, Inc. ADR(a) (China) | | |
Grupo Televisa SAB ADR (Mexico) | | |
NetEase, Inc. ADR (China) | | |
| | |
Telecommunication Services: 0.9% |
Deutsche Telekom AG (Germany) | | |
Liberty Global PLC, Class A(a) (United Kingdom) | | |
Liberty Global PLC, Class C(a) (United Kingdom) | | |
Millicom International Cellular SA SDR(a) (Guatemala) | | |
| | |
| | |
Consumer Discretionary: 11.0% |
Automobiles & Components: 2.7% |
Honda Motor Co., Ltd. (Japan) | | |
Stellantis NV (Netherlands) | | |
| | |
Consumer Discretionary Distribution & Retail: 5.5% |
Alibaba Group Holding, Ltd. ADR(a) (China) | | |
| | |
Prosus NV, Class N (China) | | |
| | |
Consumer Durables & Apparel: 0.5% |
| | |
|
Booking Holdings, Inc.(a) (United States) | | |
Entain PLC (United Kingdom) | | |
Flutter Entertainment PLC(a) (Ireland) | | |
| | |
| | |
|
Consumer Staples Distribution & Retail: 0.9% |
| | |
Seven & i Holdings Co., Ltd. (Japan) | | |
| | |
Food, Beverage & Tobacco: 3.3% |
Anheuser-Busch InBev SA/NV (Belgium) | | |
Imperial Brands PLC (United Kingdom) | | |
| | |
Household & Personal Products: 1.9% |
| | |
Haleon PLC (United Kingdom) | | |
| | |
| | |
|
| | |
Ovintiv, Inc.(c) (United States) | | |
Suncor Energy, Inc. (Canada) | | |
|
| | |
| | |
TotalEnergies SE (France) | | |
| | |
|
|
| | |
Banco Santander SA (Spain) | | |
Barclays PLC (United Kingdom) | | |
| | |
| | |
| | |
Mitsubishi UFJ Financial Group, Inc. (Japan) | | |
Standard Chartered PLC (United Kingdom) | | |
| | |
|
UBS Group AG (Switzerland) | | |
XP, Inc., Class A(a) (Brazil) | | |
| | |
|
| | |
Aviva PLC (United Kingdom) | | |
Prudential PLC (Hong Kong) | | |
| | |
| | |
|
Health Care Equipment & Services: 1.9% |
Fresenius Medical Care AG & Co. KGaA (Germany) | | |
| | |
| | |
Pharmaceuticals, Biotechnology & Life Sciences: 13.4% |
| | |
| | |
| | |
Novartis AG (Switzerland) | | |
Roche Holding AG (Switzerland) | | |
| | |
| | |
| | |
|
|
Johnson Controls International PLC (United States) | | |
Mitsubishi Electric Corp. (Japan) | | |
| | |
Schneider Electric SA (France) | | |
Smiths Group PLC(c) (United Kingdom) | | |
| | |
Information Technology: 4.4% |
Semiconductors & Semiconductor Equipment: 0.7% |
Taiwan Semiconductor Manufacturing Co., Ltd. (Taiwan) | | |
Technology, Hardware & Equipment: 3.7% |
Brother Industries, Ltd. (Japan) | | |
| | |
Murata Manufacturing Co., Ltd. (Japan) | | |
See accompanying Notes to Consolidated Financial StatementsDodge & Cox International Stock Fund ◾ PAGE 6
Consolidated Portfolio of Investments (unaudited) June 30, 2023
Common Stocks (continued) |
| | |
Samsung Electronics Co., Ltd. (South Korea) | | |
TE Connectivity, Ltd. (United States) | | |
| | |
| | |
|
Akzo Nobel NV(c) (Netherlands) | | |
| | |
Holcim, Ltd. (Switzerland) | | |
Linde PLC (United States) | | |
Mitsubishi Chemical Group Corp.(c) (Japan) | | |
| | |
Teck Resources, Ltd., Class B (Canada) | | |
| | |
|
Real Estate Management & Development: 1.8% |
CK Asset Holdings, Ltd. (Hong Kong) | | |
Daito Trust Construction Co., Ltd. (Japan) | | |
Hang Lung Group, Ltd.(c) (Hong Kong) | | |
| | |
|
| | |
Total Common Stocks
(Cost $35,816,419,744) | | |
|
| | |
|
|
Itau Unibanco Holding SA, Pfd (Brazil) | | |
Information Technology: 1.7% |
Technology, Hardware & Equipment: 1.7% |
Samsung Electronics Co., Ltd., Pfd (South Korea) | | |
Total Preferred Stocks
(Cost $1,047,190,374) | | |
Short-Term Investments: 3.6% |
| | |
Repurchase Agreements: 3.2% |
5.05%, dated 6/30/23, due 7/3/23, maturity value $125,052,604 | | |
Fixed Income Clearing Corporation(d) 5.04%, dated 6/30/23, due 7/3/23, maturity value $630,264,600 | | |
Fixed Income Clearing Corporation(d) 2.45%, dated 6/30/23, due 7/3/23, maturity value $273,481,824 | | |
|
| | |
5.04%, dated 6/30/23, due 7/3/23, maturity value $150,063,000 | | |
5.05%, dated 6/30/23, due 7/3/23, maturity value $150,063,125 | | |
5.05%, dated 6/30/23, due 7/3/23, maturity value $150,063,125 | | |
| | |
|
State Street Institutional U.S. Government Money Market Fund - Premier Class | | |
Total Short-Term Investments
(Cost $1,658,442,522) | |
Total Investments In Securities
(Cost $38,522,052,640) | | |
Other Assets Less Liabilities | | |
| | |
| |
| Valued using significant unobservable inputs. |
| See below regarding holdings of 5% voting securities |
| Repurchase agreements are collateralized by:
Barclays: U.S. Treasury Note 3.50%, 1/31/28. Total collateral value is $127,553,666.
Fixed Income Clearing Corporation: U.S. Treasury Notes 1.125%-4.25%, 10/15/25- 2/15/41. U.S. Treasury Inflation Indexed Notes 0.125%, 10/15/25. Total collateral value is $921,494,643.
Nomura: U.S. Treasury Notes 0.375%-3.625%, 4/15/24-8/15/30. Total collateral value is $153,064,263.
Royal Bank of Canada: U.S. Treasury Notes 1.25%-2.25%, 8/15/27-11/15/31. Total collateral value is $153,064,407.
Standard Chartered: U.S. Treasury Notes 0.25%-3.75%, 8/31/25-5/31/30. U.S. Treasury Inflation Indexed Notes 0.125%-0.75%, 7/15/28-7/15/31. Total collateral value is $153,064,451. |
| The Fund usually classifies a company or issuer based on its country of risk, but may designate a different country in certain circumstances. |
| |
| |
ADR: American Depositary Receipt |
SDR: Swedish Depository Receipt |
PAGE 7 ◾ Dodge & Cox International Stock FundSee accompanying Notes to Consolidated Financial Statements
Consolidated Portfolio of Investments (unaudited) June 30, 2023
Futures Contracts
| | | | Value /
Unrealized
Appreciation/
(Depreciation) |
Euro Stoxx 50 Index— Long Position | | | | |
Yen Denominated Nikkei 225 Index— Long Position | | | | |
| | | | |
Currency Forward Contracts
| | | | Unrealized Appreciation
(Depreciation) |
CNH: Chinese Yuan Renminbi |
| | | | | | |
| | | | | | |
| | | | | | |
| | | | | | |
| | | | | | |
| | | | | | |
| | | | | | |
| | | | | | |
| | | | | | |
| | | | | | |
| | | | | | |
| | | | | | |
| | | | | | |
| | | | | | |
| | | | | | |
| | | | | | |
| | | | | | |
| | | | | | |
| | | | | | |
| | | | | | |
| | | | | | |
| | | | | | |
| | | | | | |
| | | | | | |
| | | | | | |
| | | | | | |
| | | | | | |
| | | | | | |
| | | | | | |
| | | | | | |
| | | | | | |
| | | | | | |
| | | | | | |
| | | | | | |
| | | | | | |
| | | | | | |
| | | | | | |
| | | | | | |
| | | | | | |
| | | | | | |
| | | | | | |
| | | | | | |
| | | | | | |
| | | | | | |
| | | | | | |
| | | | | | |
| | | | | | |
| | | | | | |
| | | | | | |
| | | | | | |
| | | | | | |
| | | | | | |
| | | | | | |
| | | | | | |
See accompanying Notes to Consolidated Financial StatementsDodge & Cox International Stock Fund ◾ PAGE 8
Consolidated Portfolio of Investments (unaudited) June 30, 2023
Currency Forward Contracts (continued)
| | | | Unrealized Appreciation (Depreciation) |
| | | | | | |
| | | | | | |
| | | | | | |
| | | | | | |
| | | | | | |
| | | | | | |
| | | | | | |
Unrealized gain on currency forward contracts | | | |
Unrealized loss on currency forward contracts | | | |
Net unrealized gain on currency forward contracts | | | | |
The listed counterparty may be the parent company or one of its subsidiaries.
Holdings of 5% Voting Securities
Each of the companies listed below was considered to be an affiliate of the Fund because the Fund owned 5% or more of the company’s voting securities during all or part of the six months ended June 30, 2023. Further detail on these holdings and related activity during the period appear below.
| Value at
Beginning of Period | | | | Net Change in
Unrealized
Appreciation/
Depreciation | | Dividend
Income
(net of foreign
taxes, if any) |
| | | | | | | |
Communication Services 0.0% | | | | | | | |
Television Broadcasts, Ltd. | | | | | | | |
| | | | | | | |
| | | | | | | |
| | | | | | | |
| | | | | | | |
Information Technology 0.0% | | | | | | | |
Micro Focus International | | | | | | | |
| | | | | | | |
| | | | | | | |
Mitsubishi Chemical Group Corp. | | | | | | | |
| | | | | | | |
| | | | | | | |
| | | | | | | |
| | | | | | | |
| Company was not an affiliate at period end |
| |
PAGE 9 ◾ Dodge & Cox International Stock FundSee accompanying Notes to Consolidated Financial Statements
Consolidated
Statement of Assets and Liabilities (unaudited)
| |
|
Investments in securities, at value | |
Unaffiliated issuers (cost $35,830,571,339) | |
Affiliated issuers (cost $2,691,481,301) | |
| |
Unrealized appreciation on currency forward contracts | |
| |
Cash denominated in foreign currency (cost $111,784,035) | |
Deposits with broker for futures contracts | |
Receivable for variation margin for futures contracts | |
Receivable for investments sold | |
Receivable for Fund shares sold | |
Dividends and interest receivable | |
Expense reimbursement receivable | |
Prepaid expenses and other assets | |
| |
|
Unrealized depreciation on currency forward contracts | |
Cash received as collateral for currency forward contracts | |
Payable for investments purchased | |
Payable for Fund shares redeemed | |
Deferred foreign capital gains tax | |
| |
| |
| |
| |
|
| |
| |
| |
|
| |
Shares outstanding (par value $0.01 each, unlimited shares authorized) | |
Net asset value per share | |
|
| |
Shares outstanding (par value $0.01 each, unlimited shares authorized) | |
Net asset value per share | |
Consolidated
Statement of Operations (unaudited)
| Six Months Ended
June 30, 2023 |
| |
Dividends (net of foreign taxes of $65,767,756) | |
| |
| |
| |
| |
| |
| |
Administrative services fees | |
| |
| |
Custody and fund accounting fees | |
| |
| |
| |
| |
| |
| |
Expenses reimbursed by investment manager | |
| |
| |
Realized and Unrealized Gain (Loss): | |
| |
Investments in securities of unaffiliated issuers (net of foreign capital gains taxes of $5,640,135) | |
Investments in securities of affiliated issuers | |
| |
Currency forward contracts | |
Foreign currency transactions | |
Net change in unrealized appreciation/depreciation | |
Investments in securities of unaffiliated issuers (net of change in deferred foreign capital gains tax of $5,521,474) | |
Investments in securities of affiliated issuers | |
| |
Currency forward contracts | |
Foreign currency translation | |
Net realized and unrealized gain | |
Net Change in Net Assets From Operations | |
See accompanying Notes to Consolidated Financial StatementsDodge & Cox International Stock Fund ◾ PAGE 10
Consolidated
Statement of Changes in Net Assets (unaudited)
| | |
| | |
| | |
| | |
| | |
Net change in unrealized appreciation/depreciation | | |
| | |
Distributions to Shareholders: | | |
| | |
| | |
| | |
| | |
| | |
Proceeds from sales of shares | | |
Reinvestment of distributions | | |
| | |
| | |
Proceeds from sales of shares | | |
Reinvestment of distributions | | |
| | |
Net change from Fund share transactions | | |
Total change in net assets | | |
| | |
| | |
| | |
| | |
| | |
| | |
| | |
| | |
Net change in shares outstanding | | |
| | |
| | |
| | |
| | |
Net change in shares outstanding | | |
PAGE 11 ◾ Dodge & Cox International Stock FundSee accompanying Notes to Consolidated Financial Statements
Notes to Consolidated Financial Statements (unaudited)
Note 1: Organization and Significant Accounting Policies
Dodge & Cox International Stock Fund (the “Fund”) is one of the series constituting the Dodge & Cox Funds (the “Trust” or the “Funds”). The Trust is organized as a Delaware statutory trust and is registered under the Investment Company Act of 1940, as amended, as an open-end management investment company. The Fund commenced operations on May 1, 2001, and seeks long-term growth of principal and income. The Fund invests primarily in a diversified portfolio of foreign equity securities. Foreign investing, especially in developing countries, has special risks such as currency and market volatility and political and social instability. These and other risk considerations are discussed in the Fund’s Prospectus.
On May 1, 2022, the then-outstanding shares of the Fund were redesignated as Class I Shares, and Class X shares of the Fund were established. The share classes have different eligibility requirements and expense structures due to differing shareholder servicing arrangements. The share classes have the same rights as to redemption, dividends and liquidation proceeds, and voting privileges, except that each class has the exclusive right to vote on matters affecting only its class.
The Fund is an investment company and follows the accounting and reporting guidance issued in Topic 946 by the Financial Accounting Standards Board. The financial statements have been prepared in conformity with accounting principles generally accepted in the United States of America, which require the use of estimates and assumptions by management. Actual results may differ from those estimates. Significant accounting policies are as follows:
Security valuation The Fund’s net assets are normally valued as of the scheduled close of trading on the New York Stock Exchange (NYSE), generally 4 p.m. Eastern Time, each day that the NYSE is open for business.
Portfolio holdings for which market quotes are readily available are valued at market value. Listed securities, for example, are generally valued using the official quoted close price or the last sale on the exchange that is determined to be the primary market for the security. Convertible debt securities are valued using prices received from independent pricing services which utilize dealer quotes, recent transaction data, pricing models, and other inputs to arrive at market-based valuations. Pricing models may consider quoted prices for similar securities, interest rates, cash flows (including prepayment speeds), and credit risk. Equity total return swaps are valued using prices received from independent pricing services which utilize market quotes from underlying reference instruments. Exchange-traded derivatives are valued at the settlement price determined by the relevant exchange. Short-term securities less than 60 days to maturity may be valued at amortized cost if amortized cost approximates current value. Mutual funds are valued at their respective net asset values. Security values are not discounted based on the size of the Fund’s position and may differ from the value a Fund receives upon sale of the securities.
Investments initially valued in currencies other than the U.S. dollar are converted to the U.S. dollar using prevailing exchange rates. Currency forward contracts are valued based on the prevailing forward exchange rates of the underlying currencies. As a result, the
Fund’s net assets may be affected by changes in the value of currencies in relation to the U.S. dollar.
If market quotations are not readily available or if normal valuation procedures produce valuations that are deemed unreliable or inappropriate under the circumstances existing at the time, the investment will be valued at fair value as determined in good faith by Dodge & Cox. The Board of Trustees has appointed Dodge & Cox, the Fund’s investment manager, as its "valuation designee", as permitted by Rule 2a-5 under the Investment Company Act of 1940, to make fair value determinations in accordance with the Dodge & Cox Funds Valuation Policies (“Valuation Policies”), subject to Board oversight. Dodge & Cox has established a Pricing Committee that is comprised of representatives from Treasury, Legal, Compliance, and Operations. The Pricing Committee is responsible for implementing the Valuation Policies, including determining the fair value of securities and other investments when necessary. The Pricing Committee considers relevant indications of value that are reasonably available to it in determining the fair value assigned to a particular security, such as the value of similar financial instruments, trading volumes, contractual restrictions on disposition, related corporate actions, and changes in economic conditions. In doing so, the Pricing Committee employs various methods for calibrating fair valuation approaches, including a regular review of key inputs and assumptions, back-testing, and review of any related market activity.
As trading in securities on most foreign exchanges is normally completed before the close of the NYSE, the value of non-U.S. securities can change by the time the Fund calculates its net asset value. To address these changes, the Fund may utilize adjustment factors provided by an independent pricing service to systematically value non-U.S. securities at fair value. These adjustment factors are based on statistical analyses of subsequent movements and changes in U.S. markets and financial instruments trading in U.S. markets that represent foreign securities or baskets of securities.
Valuing securities through a fair value determination involves greater reliance on judgment than valuation of securities based on readily available market quotations. In some instances, lack of information and uncertainty as to the significance of information may lead to a conclusion that a prior valuation is the best indication of a security’s value. When fair value pricing is employed, the prices of securities used by the Fund to calculate its net asset value may differ from quoted or published prices for the same securities.
Security transactions, investment income, expenses, and distributions Security transactions are recorded on the trade date. Realized gains and losses on securities sold are determined on the basis of identified cost.
Dividend income and corporate action transactions are recorded on the ex-dividend date, or when the Fund first learns of the dividend/corporate action if the ex-dividend date has passed. Non-cash dividends, if any, are recorded at the fair market value of the securities received. Dividends characterized as return of capital for U.S. tax purposes are recorded as a reduction of cost of investments and/or realized gain. Interest income is recorded on the accrual basis.
Expenses are recorded on the accrual basis. Some expenses of the Trust can be directly attributed to a specific series. Expenses
Dodge & Cox International Stock Fund ◾ PAGE 12
Notes to Consolidated Financial Statements (unaudited)
which cannot be directly attributed are allocated among the Funds in the Trust using methodologies determined by the nature of the expense.
Distributions to shareholders are recorded on the ex-dividend date.
Share class accounting Investment income, realized and unrealized gains and losses and expenses, other than class-specific expenses, are allocated to each share class of the Fund based upon the proportion of net assets of each class.
Foreign taxes The Fund is subject to foreign taxes which may be imposed by certain countries in which the Fund invests. The Fund endeavors to record foreign taxes based on applicable foreign tax law. Withholding taxes are incurred on certain foreign dividends and are accrued at the time the associated dividend is recorded. The Fund files withholding tax reclaims in certain jurisdictions to recover a portion of amounts previously withheld. The Fund records a reclaim receivable based on, among other things, a jurisdiction’s legal obligation to pay reclaims as well as payment history and market convention. In consideration of recent decisions rendered by European courts, the Fund has filed for additional reclaims ("EU reclaims") related to prior years. A corresponding receivable is established when both the amount is known and significant contingencies or uncertainties regarding collectability are removed. These amounts, if any, are reported in dividends and interest receivable in the Consolidated Statement of Assets and Liabilities. Expenses incurred related to filing EU reclaims are recorded on the accrual basis in professional services in the Consolidated Statement of Operations. Expenses that are contingent upon successful EU reclaims are recorded in professional services in the Consolidated Statement of Operations once the amount is known.
Capital gains taxes are incurred upon disposition of certain foreign securities. Expected capital gains taxes on appreciated securities, if any, are accrued as unrealized losses and incurred capital gains taxes are reflected as realized losses upon the sale of the related security. Currency taxes may be incurred when the Fund purchases certain foreign currencies related to securities transactions and are recorded as realized losses on foreign currency transactions.
Foreign currency translation The books and records of the Fund are maintained in U.S. dollars. Foreign currency amounts are translated into U.S. dollars at the prevailing exchange rates of such currencies against the U.S. dollar. The market value of investment securities and other assets and liabilities are translated at the exchange rate as of the valuation date. Purchases and sales of investment securities, income, and expenses are translated at the exchange rate prevailing on the transaction date.
Reported realized and unrealized gain (loss) on investments include foreign currency gain (loss) related to investment transactions.
Reported realized and unrealized gain (loss) on foreign currency transactions and translation include the following: disposing/holding of foreign currency, the difference in exchange rate between the trade and settlement dates on securities transactions, the difference in
exchange rate between the accrual and payment dates on dividends, and currency losses on the purchase of foreign currency in certain countries that impose taxes on such transactions.
Repurchase agreements Repurchase agreements are transactions under which a Fund purchases a security from a counterparty and agrees to resell the security to that counterparty on a specified future date at the same price, plus a specified interest rate. The Fund’s repurchase agreements are secured by U.S. government or agency securities. It is the Fund’s policy that its regular custodian or third party custodian take possession of the underlying collateral securities, the fair value of which exceeds the principal amount of the repurchase transaction, including accrued interest, at all times. In the event of default by the counterparty, the Fund has the contractual right to liquidate the collateral securities and to apply the proceeds in satisfaction of the obligation.
Consolidation The Fund may invest in certain securities through its wholly owned subsidiary, Dodge & Cox International Stock Fund Cayman, Ltd. (the “Subsidiary”). The Subsidiary is a Cayman Islands exempted company and invests in certain securities consistent with the investment objective of the Fund. The Fund’s Consolidated Financial Statements, including the Consolidated Portfolio of Investments, consist of the holdings and accounts of the Fund and the Subsidiary. All intercompany transactions and balances have been eliminated. At June 30, 2023, the Subsidiary had net assets of $100, which represented less than 0.01% of the Fund’s consolidated net assets.
Indemnification Under the Trust’s organizational documents, its officers and trustees are indemnified against certain liabilities arising out of the performance of their duties to the Trust. In addition, in the normal course of business the Trust enters into contracts that provide general indemnities to other parties. The Trust’s maximum exposure under these arrangements is unknown, as this would involve future claims that may be made against the Trust that have not yet occurred.
Note 2: Valuation Measurements
Various inputs are used in determining the value of the Fund’s investments. These inputs are summarized in the three broad levels below.
◾ Level 1: Unadjusted quoted prices in active markets for identical securities
◾ Level 2: Other significant observable inputs (including quoted prices for similar securities, market indices, interest rates, credit risk, forward exchange rates, etc.)
◾ Level 3: Significant unobservable inputs (including Fund management’s assumptions in determining the fair value of investments)
The inputs or methodology used for valuing securities are not necessarily an indication of the risk associated with investing in those securities.
PAGE 13 ◾ Dodge & Cox International Stock Fund
Notes to Consolidated Financial Statements (unaudited)
The following is a summary of the inputs used to value the Fund’s holdings at June 30, 2023:
| | LEVEL 2
(Other Significant
Observable
Inputs) | LEVEL 3
(Signficant
Unobservable
Inputs) |
|
|
| | | |
| | | |
| | | |
| | | |
| | | |
| | | |
| | | |
| | | |
| | | |
| | | |
| | | |
|
| | | |
| | | |
|
| | | |
| | | |
| | | |
|
|
| | | |
Currency Forward Contracts |
| | | |
| | | |
Note 3: Derivative Instruments
The Fund may use derivatives either to minimize the impact of certain risks to one or more of its investments (as a ‘‘hedging technique’’) or to implement its investment strategy. A derivative is a financial instrument whose value is derived from a security, currency, interest rate, index, or other financial instrument.
Equity total return swaps Equity total return swaps are contracts that can create long or short economic exposure to an underlying equity security. Under such a contract, one party agrees to make payments to another based on the total return of a notional amount of the underlying security (including dividends and changes in market value), in return for an upfront or periodic payments from the other party based on a fixed or variable interest rate applied to the same notional amount. Equity total return swaps can also be used to hedge against exposure to specific risks associated with a particular issuer or with other companies owned by such an issuer. Investments in equity total return swaps may include certain risks including unfavorable price movements in the underlying reference instrument(s), or a default or failure by the counterparty.
Equity total return swaps are traded over-the-counter. The value of equity total return swaps changes daily based on the value of the underlying equity security. Changes in the market value of equity total return swaps are recorded as unrealized appreciation or depreciation
in the Consolidated Statement of Operations. Realized gains and losses on equity total return swaps are recorded in the Consolidated Statement of Operations upon exchange of cash flows for periodic payments and upon the closing or expiration of the swaps.
The Fund used equity total return swaps to create long economic exposure to particular equity securities and to hedge against risks created by investments made by one of the portfolio securities it owns.
Futures contracts Futures contracts involve an obligation to purchase or sell (depending on whether the Fund has entered a long or short futures contract, respectively) an asset at a future date, at a price set at the time the contract is purchased. Futures contracts are exchange-traded. Upon entering into a futures contract, the Fund is required to deposit an amount of cash or liquid assets (referred to as "initial margin") in a segregated account with the clearing broker to secure the Fund's obligation to perform. Initial margin is returned to the Fund when the futures contract is closed. Subsequent payments (referred to as "variation margin") are made to or received from the clearing broker on a daily basis based on changes in the market value of the contract. Changes in the market value of open futures contracts are recorded as unrealized appreciation or depreciation in the Consolidated Statement of Operations. Realized gains and losses on futures contracts are recorded in the Consolidated Statement of Operations at the closing or expiration of the contracts. Cash deposited with a broker as initial margin is recorded in the Consolidated Statement of Assets and Liabilities. A receivable and/or payable to brokers for daily variation margin is also recorded in the Consolidated Statement of Assets and Liabilities.
Investments in futures contracts may include certain risks, which may be different from, and potentially greater than, those of the underlying securities. To the extent the Fund uses futures, it is exposed to additional volatility and potential losses resulting from leverage.
The Fund used equity index futures contracts to create equity exposure equal to some or all of its non-equity net assets.
Currency forward contracts Currency forward contracts are agreements to purchase or sell a specific currency at a specified future date and price. Currency forward contracts are traded over-the-counter. The values of currency forward contracts change daily based on the prevailing forward exchange rates of the underlying currencies. Changes in the value of open contracts are recorded as unrealized appreciation or depreciation in the Consolidated Statement of Operations. When a currency forward contract is closed, the Fund records a realized gain or loss in the Consolidated Statement of Operations equal to the difference between the value at the time the contract was opened and the value at the time it was closed.
Losses from these transactions may arise from unfavorable changes in currency values or if a counterparty does not perform under a contract’s terms.
The Fund used currency forward contracts to hedge direct and indirect foreign currency exposure.
Additional derivative information The following identifies the location on the Consolidated Statement of Assets and Liabilities and
Dodge & Cox International Stock Fund ◾ PAGE 14
Notes to Consolidated Financial Statements (unaudited)
values of the Fund's derivative instruments categorized by primary underlying risk exposure.
| | Foreign
Exchange
Derivatives | |
| | | |
Unrealized appreciation on currency forward contracts | | | |
| | | |
| | | |
| | | |
Unrealized depreciation on currency forward contracts | | | |
| Includes cumulative appreciation (depreciation). Only the current day’s variation margin is reported in the Consolidated Statement of Assets and Liabilities. |
The following summarizes the effect of derivative instruments on the Consolidated Statement of Operations, categorized by primary underlying risk exposure.
| | Foreign
Exchange
Derivatives | |
| | | |
| | | |
Currency forward contracts | | | |
| | | |
Net change in unrealized appreciation/depreciation |
| | | |
Currency forward contracts | | | |
| | | |
The following summarizes the range of volume in the Fund's derivative instruments during the six months ended June 30, 2023.
| | |
| | |
Currency forward contracts | | |
The Fund may enter into various over-the-counter derivative contracts governed by International Swaps and Derivatives Association master agreements (“ISDA agreements”). The Fund’s ISDA agreements, which are separately negotiated with each dealer counterparty, specify (i) events of default and other events permitting a party to terminate some or all of the contracts thereunder and (ii) the process by which those contracts will be valued for purposes of determining termination payments. If some or all of the contracts under a master agreement are terminated because of an event of default or similar event, the values of all terminated contracts must be netted to determine a single payment owed by one party to the other. To the extent amounts owed to the Fund by its counterparties are not collateralized, the Fund is at risk of those counterparties’ non-performance. The Fund attempts to mitigate counterparty credit risk by entering into contracts only with counterparties it believes to be of
good credit quality, by exchanging collateral, and by monitoring the financial stability of those counterparties.
For financial reporting purposes, the Fund does not offset assets and liabilities that are subject to a master netting arrangement in the Consolidated Statement of Assets and Liabilities.
The Fund’s ability to net assets and liabilities and to offset collateral pledged or received is based on contractual netting/offset provisions in the ISDA agreements. The following table presents the Fund’s net exposure to each counterparty for derivatives that are subject to enforceable master netting arrangements as of June 30, 2023.
| Gross
Amount of
Recognized
Assets | Gross
Amount of
Recognized
Liabilities | | |
| | | | |
| | | | |
| | | | |
| | | | |
| | | | |
| | | | |
| | | | |
| Cash collateral pledged/(received) in excess of derivative assets/liabilities is not presented in this table. The total cash collateral is presented on the Fund's Consolidated Statement of Assets and Liabilities. |
| Represents the net amount receivable from (payable to) the counterparty in the event of a default. |
Note 4: Related Party Transactions
Investment advisory fee The Fund pays an investment advisory fee monthly at an annual rate of 0.50% of the Fund’s average daily net assets to Dodge & Cox, investment manager of the Fund.
Administrative services fee The Fund pays Dodge & Cox a fee for administrative and shareholder services. The fee is accrued daily and paid monthly equal to an annual rate of the average daily net assets of 0.10% for Class I shares and 0.05% for Class X shares. Under this agreement, Dodge & Cox also pays for the Fund's transfer agent fees.
Expense reimbursement Dodge & Cox has contractually agreed to reimburse the Fund for all ordinary expenses to the extent necessary to maintain the ratio of total operating expenses of the Class X shares to average net assets of the Class X shares at 0.52% through April 30, 2026. The term of the agreement will automatically renew for subsequent three-year terms unless terminated with at least 30 days’ written notice by either party prior to the end of the then-current term. For the six months ended June 30, 2023, Dodge & Cox reimbursed expenses of $1,137,258.
Fund officers and trustees All officers and two of the trustees of the Trust are current or former senior executive officers of Dodge & Cox. The Trust pays a fee only to those trustees who are not affiliated with Dodge & Cox.
PAGE 15 ◾ Dodge & Cox International Stock Fund
Notes to Consolidated Financial Statements (unaudited)
Note 5: Income Tax Information and Distributions to Shareholders
A provision for federal income taxes is not required since the Fund intends to continue to qualify as a regulated investment company under Subchapter M of the Internal Revenue Code and distribute all of its taxable income to shareholders. Distributions are determined in accordance with income tax regulations, and such amounts may differ from net investment income and realized gains for financial reporting purposes. The Fund may also designate a portion of the amount paid to redeeming shareholders as a distribution for tax purposes. Financial reporting records are adjusted for permanent book to tax differences at year end to reflect tax character. Book to tax differences are primarily due to differing treatments of wash sales, expenses, investments in passive foreign investment companies, foreign currency realized gain (loss), foreign capital gains tax, certain corporate action transactions, derivatives, and distributions.
Distributions during the periods noted below were characterized as follows for federal income tax purposes.
| Six Months Ended
June 30, 2023 | Year Ended
December 31, 2022 |
| | |
| | |
| | |
| | |
| | |
| | |
The components of distributable earnings on a tax basis are reported as of the Fund's most recent year end. At December 31, 2022, the tax basis components of distributable earnings were as follows:
Undistributed ordinary income | |
Capital loss carryforward1 | |
Net unrealized appreciation | |
Total distributable earnings | |
| Represents accumulated long-term capital loss as of December 31, 2022, which may be carried forward to offset future capital gains. |
At June 30, 2023, unrealized appreciation and depreciation for investments and derivatives based on cost for federal income tax purposes were as follows:
| |
| |
| |
Net unrealized appreciation | |
Fund management has reviewed the tax positions for open periods (three years and four years, respectively, from filing the
Fund’s Federal and State tax returns) as applicable to the Fund, and has determined that no provision for income tax is required in the Fund’s financial statements.
For U.S. income tax purposes, EU reclaims received by the Fund reduce the amounts of foreign taxes that the Fund passes through to shareholders. In the event that EU reclaims received by the Fund during the year exceed foreign withholding taxes paid, and the Fund previously passed foreign tax credit on to its shareholders, the Fund will enter into a closing agreement with the Internal Revenue Service (IRS) in order to pay the associated tax liability on behalf of the Fund's shareholders.
Note 6: Loan Facilities
Pursuant to an exemptive order issued by the Securities and Exchange Commission (SEC), the Fund may participate in an interfund lending facility (Facility). The Facility allows the Fund to borrow money from or loan money to the Funds. Loans under the Facility are made for temporary or emergency purposes, such as to fund shareholder redemption requests. Interest on borrowings is the average of the current repurchase agreement rate and the bank loan rate. There was no activity in the Facility during the period.
All Funds in the Trust participate in a $500 million committed credit facility (Line of Credit) with State Street Bank and Trust Company, to be utilized for temporary or emergency purposes to fund shareholder redemptions or for other short-term liquidity purposes. The maximum amount available to the Fund is $250 million. Each Fund pays an annual commitment fee on its pro-rata portion of the Line of Credit. For the six months ended June 30, 2023, the Fund’s commitment fee amounted to $125,971 and is reflected as a Miscellaneous Expense in the Consolidated Statement of Operations. Interest on borrowings is charged at the prevailing rate. There were no borrowings on the Line of Credit during the period.
Note 7: Purchases and Sales of Investments
For the six months ended June 30, 2023, purchases and sales of securities, other than short-term securities, aggregated $2,514,262,105 and $2,786,287,068, respectively.
Note 8: Subsequent Events
In July 2023, the Fund received a tender offer to purchase shares of Magnit PJSC, an illiquid Fund holding in Russia, in exchange for cash. The Fund tendered its shares for a price equivalent to 0.2% of Fund net assets. Fund management has determined that no other material events or transactions occurred subsequent to June 30, 2023, and through the date of the Fund’s financial statements issuance, which require disclosure in the Fund’s financial statements.
Dodge & Cox International Stock Fund ◾ PAGE 16
Consolidated Financial Highlights (unaudited)
Selected data and ratios
(for a share outstanding throughout each period) | | |
| | | | | | |
| | | | | | |
Net asset value, beginning of period | | | | | | |
Income from investment operations: | | | | | | |
| | | | | | |
Net realized and unrealized gain (loss) | | | | | | |
Total from investment operations | | | | | | |
Distributions to shareholders from: | | | | | | |
| | | | | | |
| | | | | | |
| | | | | | |
Net asset value, end of period | | | | | | |
| | | | | | |
Ratios/supplemental data: | | | | | | |
Net assets, end of period (millions) | | | | | | |
Ratio of expenses to average net assets | | | | | | |
Ratio of net investment income to average net assets | | | | | | |
| | | | | | |
| | | | | | |
Net asset value, beginning of period | | | | | | |
Income from investment operations: | | | | | | |
| | | | | | |
Net realized and unrealized gain (loss) | | | | | | |
Total from investment operations | | | | | | |
Distributions to shareholders from: | | | | | | |
| | | | | | |
| | | | | | |
| | | | | | |
Net asset value, end of period | | | | | | |
| | | | | | |
Ratios/supplemental data: | | | | | | |
Net assets, end of period (millions) | | | | | | |
Ratio of expenses to average net assets | | | | | | |
Ratio of expenses to average net assets, before reimbursement by investment manager | | | | | | |
Ratio of net investment income to average net assets | | | | | | |
| | | | | | |
| Net investment income per share includes significant amounts received for EU reclaims related to prior years, which amounted to approximately $0.13 per share. Excluding such amounts, the ratio of net investment income to average net assets would have been 1.87%. |
| Net investment income per share includes significant amounts received for EU reclaims related to prior years, which amounted to approximately $0.28 per share. Excluding such amounts, the ratio of net investment income to average net assets would have been 1.73% and total return would have been approximately 1.55%. |
| |
| For 2022, the period covers 5/2/2022 (commencement of operations) to 12/31/2022 |
See accompanying Notes to Consolidated Financial Statements
PAGE 17 ◾ Dodge & Cox International Stock Fund
Board Approval of Funds’ Investment Advisory Agreement and Investment Advisory Fees
(unaudited)
On June 1, 2023, the Board of Trustees (the “Board”) of the Dodge & Cox Funds (the “Trust”), including the members of the Board who are not “interested persons” of Dodge & Cox (as such term is defined in the Investment Company Act of 1940) (the “Independent Trustees”), voted to continue the Investment Advisory Agreement between Dodge & Cox and the Trust (the “Advisory Agreement”) in effect for an additional year beginning July 1, 2023 for each series of the Trust (each a “Fund”). Prior to the Board’s vote, the Trust’s Contract Review Committee, consisting solely of Independent Trustees, met with independent counsel to the Independent Trustees on May 8 and June 1, 2023, to discuss whether the Investment Advisory Agreement should be continued. At its June 1 meeting, the Board, including the Independent Trustees, concluded that the Investment Advisory Agreement is fair and reasonable. In considering the Investment Advisory Agreement, the Board, including the Independent Trustees, did not identify any single factor or particular information as all-important or controlling. In reaching the decision to continue the Investment Advisory Agreement in effect, the Board considered several factors, and reached the conclusions, described below:
Nature, Extent and Quality of Services Provided by Dodge & Cox
◾ The Board considered the nature, extent, and quality of the services provided by Dodge & Cox to each Fund under the Advisory Agreement. This consideration included, among other things, Dodge & Cox’s investment process and philosophy; the education and experience of the principal personnel of Dodge & Cox who provide such services; the other resources (including technology) that Dodge & Cox uses in managing the Funds’ portfolios; Dodge & Cox’s record of compliance with the Funds’ investment policies and restrictions and relevant regulatory and tax compliance requirements; and such matters as Dodge & Cox’s business continuity planning and insurance coverage.
◾ The Board concluded that the nature, extent, and quality of the services Dodge & Cox provides are consistent with the terms of the Advisory Agreement and support the recommendation to continue the Advisory Agreement in effect for the coming year.
◾ The Board also took note of the nature, extent, and quality of the broad range of services that Dodge & Cox provides to the Funds and their shareholders under a separate Administrative and Shareholder Services Agreement. Although that Agreement does not require Board approval on an annual basis, the services provided thereunder are an important part of the Funds’ overall relationship with Dodge & Cox, and the Board’s understanding and assessment of those services was a factor in its decision to recommend continuation of the Investment Advisory Agreement.
Investment Performance
◾ The Board reviewed information regarding the total return of each Fund over the most recent 1-, 3-, 5-, 10-, and 20-year periods (or since Fund inception, if shorter). The Board compared these returns to those of the Fund’s broad benchmark index and, for the Stock, International Stock, Global Stock, and Balanced Funds, to those of a relevant value-oriented index. The Board also considered the volatility of the Funds’ investment returns over various time horizons, including both volatility data provided by Broadridge Financial Solutions (“Broadridge”) and longer-term volatility measures presented by Dodge & Cox.
◾ In addition, the Board reviewed a report prepared by Broadridge comparing each Fund’s performance with the performance of other mutual funds in such Fund’s broad Morningstar category (as modified by Broadridge to include only those funds that have similar share class and expense characteristics to such Fund’s, the “Morningstar custom category”), as well as with the performance of a smaller peer group of comparable funds identified by Broadridge (such Fund’s “peer group”). The Board received information regarding the methodology and process underlying the construction of the Morningstar custom categories and peer groups, and any changes in the methodology from prior years. The Board also reviewed a report prepared by Dodge & Cox comparing each Fund’s performance to the composite performance of other accounts (if any) managed by Dodge & Cox using the same investment approach as the Fund. This information regarding the performance of other mutual funds and of other accounts managed by Dodge & Cox provided helpful context for the Board’s evaluation of the Funds’ performance.
◾ The Board concluded that the investment performance and volatility experienced by each Fund were consistent with Dodge & Cox’s long-term, research-driven, bottom-up, active investment style and support the recommendation to continue the Advisory Agreement in effect for an additional year.
Fees and Expense Ratios
◾ The Board reviewed a comparison prepared by Broadridge of the net expense ratio of each Fund (including the separate expense ratios of the two share classes of those Funds that have a dual class structure), and the various elements of those expense ratios, to those of mutual funds in (1) the Fund’s Morningstar custom category and (2) the Fund’s peer group.
◾ For each Fund for which such a comparison is relevant, the Board reviewed information regarding the fee rates Dodge & Cox charges for managing other accounts using the same investment approach as the Fund. The Board took note of the broader scope of services that Dodge & Cox provides to the Funds than to separate accounts and sub-advised funds, as well as differences in regulatory, litigation, and other risks associated with sponsoring a mutual fund as compared to managing separate accounts or sub-advising another
Dodge & Cox International Stock Fund ◾ PAGE 18
sponsor’s mutual fund, and certain characteristics of the market for institutional separate account management services.
◾ The Board concluded, after discussion and based on all the relevant information it received, that the advisory fee rate that each Fund pays to Dodge & Cox under the Advisory Agreement is reasonable in relation to the scope and quality of the services that Dodge & Cox provides to such Fund thereunder.
◾ In assessing the Funds’ expense ratios and the fees the Funds pay to Dodge & Cox, the Board took note of and discussed with Dodge & Cox changes over the past several years in the competitive landscape for asset management services. The Board anticipates further changes in the competitive landscape and will continue to monitor and assess the Funds’ competitive position.
Costs of Services Provided and Profits Realized by Dodge & Cox from its Relationship to the Funds
◾ Dodge & Cox informed the Board that it operates as a unified business, with most employees providing services to support the firm and its clients across multiple strategies and/or products. Consequently the firm does not utilize cost accounting to allocate expenses across lines of business or across the Funds for management purposes. Also, the firm is owned exclusively by its senior managers and other active employees, and generally distributes substantially all of its net revenues each year to its employees, either as compensation or as distributions with respect to the shares they own in the firm. Accordingly, it is difficult, and in the Board’s view not especially meaningful, to attempt to calculate a specific profit margin associated with Dodge & Cox’s relationship to any particular Fund.
◾ The Board believes that Dodge & Cox’s commitment to employee ownership of the firm enhances its ability to attract and retain key investment and other management professionals and reinforces a long-term perspective on the management of the firm and the Funds, which the Board believe aligns well with the interests of the Funds and their shareholders.
◾ The Board noted that the employee-shareholders of Dodge & Cox give up a substantial stock value (which would be taxed at long-term capital gains rates) as a consequence of the firm’s independence from outside ownership; the estimated market value of the company is substantially in excess of its book value.
◾ The Board also considered that Dodge & Cox’s fee revenues from the Funds fluctuate from year to year based on changes in the aggregate net assets of the Funds, and that the firm has continued to invest in improved systems, additional compliance resources, and enhanced research capabilities despite these fluctuations.
◾ The Board concluded that Dodge & Cox’s profits are a keystone of its independence, stability, and long-term investment performance.
Economies and Benefits of Scale
◾ The Board considered whether there have been economies or benefits of scale as the Funds have grown over the longer term, and whether fee levels reflect economies of scale for the benefit of Fund investors. In the Board’s view any consideration of economies of scale must take account of the relatively low overall fee and expense structure of the Funds. The Funds generally rank favorably when compared to their Broadridge custom categories and peer groups, on a net expense ratio basis.
◾ Dodge & Cox has built economies of scale into its fee structure by charging relatively low fees at the beginning of operations. A comparison of the Funds’ advisory fee rates to those of many otherwise comparable funds that employ fee “breakpoints” shows that the Funds’ advisory fee rates are in general relatively lower from the first dollar. As a result of their straightforward share class and fee structure and relatively low total expenses, the Funds provide small investors with access to professional, active portfolio management and related services at a reasonable cost. In addition to building economies of scale into its fee rates from the first dollar of each Fund’s assets, Dodge & Cox has capped the expenses borne by certain Funds in their early years of operations when those Funds are not yet operating at scale. The Global Bond Fund has benefited from such an expense cap since its inception in 2014, as has the Emerging Markets Stock Fund since its inception in 2021. Dodge & Cox has agreed to continue expense caps for those Funds, and for the X share class of each of the other Funds, through April 30, 2026.
◾ Over the years, Dodge & Cox has voluntarily forgone opportunities for growth in its assets under management and revenues in order to protect the Funds’ ability to achieve investment returns for shareholders. Dodge & Cox closed the International Stock Fund for a number of years beginning in 2015 and previously closed other Funds and limited the growth of its separate account business during periods of high growth--to Dodge & Cox’s economic detriment--and continues to closely monitor the size of the Funds.
◾ The Board also noted that Dodge & Cox has continued to make additional expenditures on staff and information technology to enable it to enhance its investment processes and to implement effectively the Funds’ strategies. The Board also considered that there may be certain diseconomies of scale associated with managing very large asset pools such as several of the Funds, insofar as certain of the costs or risks associated with managing the Funds potentially increase at a rate that exceeds the rate of asset growth.
PAGE 19 ◾ Dodge & Cox International Stock Fund
Fall-Out Benefits
◾ The Board concluded that “fall-out” benefits derived by Dodge & Cox from its relationship with the Funds are not a significant issue.
Fund Holdings
The Fund provides a complete list of its holdings on a quarterly basis by filing the lists with the SEC on Form N-CSR (as of the end of the second and fourth quarters) and on Part F of Form N-PORT (as of the end of the first and third quarters). Shareholders may view the Fund’s Forms N-CSR and Part F of N-PORT on the SEC’s website at sec.gov. A list of the Fund’s quarter-end holdings is also available at dodgeandcox.com on or about the 15th day following each quarter end and remains available on the website until the list is updated for the subsequent quarter.
Proxy Voting
For a free copy of the Fund's proxy voting policies and procedures, please call 800-621-3979, or visit the Fund’s website at dodgeandcox.com, or visit the SEC’s website at sec.gov.Information regarding how the Fund voted proxies relating to portfolio securities during the most recent 12-month period ended June 30 is also available at dodgeandcox.com or shareholders may view the Fund's Form N-PX at sec.gov.
Household Mailings
The Fund routinely mails shareholder reports and summary prospectuses to shareholders and, on occasion, proxy statements. In order to reduce the volume of mail, when possible, only one copy of these documents will be sent to shareholders who are part of the same family and share the same residential address.
If you have a direct account with the Funds and you do not want the mailing of shareholder reports and summary prospectuses combined with other members in your household, contact the Funds at 800-621-3979. Your request will be implemented within 30 days.
Dodge & Cox International Stock Fund ◾ PAGE 20
dodgeandcox.com
For Fund literature, transactions, and account
information, please visit the Funds’ website.
or write or call:
Dodge & Cox Funds
P.O. Box 219502
Kansas City, Missouri 64121-9502
(800) 621-3979
Investment Manager
Dodge & Cox
555 California Street, 40th Floor
San Francisco, California 94104
(415) 981-1710
Principal Underwriter
Foreside Fund Services, LLC
3 Canal Plaza, Suite 100
Portland, Maine 04101
(866) 251-6920
This report is submitted for the general information of the shareholders of the Fund. The report is not authorized for distribution to prospective investors in the Fund unless it is accompanied by a current prospectus.
This report reflects our views, opinions, and portfolio holdings as of June 30, 2023, the end of the reporting period. Any such views are subject to change at any time based upon market or other conditions and Dodge & Cox disclaims any responsibility to update such views. These views may not be relied on as investment advice and, because investment decisions for a Dodge & Cox Fund are based on numerous factors, may not be relied on as an indication of trading intent on behalf of any Dodge & Cox Fund.
Emerging Markets Stock Fund (dodex)
ESTABLISHED 2021
06/23 EM SAR Printed on recycled paper 
To Our Shareholders (unaudited)
The Dodge & Cox Emerging Markets Stock Fund had a total return of 7.55% for the six-month period ended June 30, 2023, compared to a return of 4.89% for the MSCI Emerging Markets Index.1
Market Commentary
Many of investors’ worst fears of 2022 dissipated during the first half of 2023 as equity valuations rose across most global regions and economic sectors. The MSCI Emerging Markets returned almost 5% during the first half of 2023 with particularly strong contributions from companies based in Korea and Taiwan, which benefited from renewed enthusiasm around hardware spending. Latin America was another bright spot in early 2023 as corporations and investors became more comfortable with recently elected leftist governments, resulting in currency appreciation and some recovery in equity markets.
We also saw challenges in some regions. Economic data in China was disappointing, and economic and institutional challenges also hurt the returns of South Africa and Turkey, where currency devaluation had a negative impact. While the Russia-Ukraine conflict continues to cause enormous local harm and elevates the risk of geopolitical catastrophe, the economic impact of the conflict was less prominent in the first half of 2023. For example, crude oil prices spiked to more than $120 per barrel in the early months of conflict, but have since returned to $71 per barrel, near their 5-year average level.
At a time when global growth prospects are slowing and equity valuations are relatively high, we believe emerging market stocks present a compelling long-term investment opportunity at a reasonable price. The MSCI Emerging Markets trades at 12.1 times forward earnings2, compared to 20.1 times for the S&P 500 Index.3 Looking ahead, the diverse risks and valuation dispersion within emerging markets create a fertile environment for building an attractive portfolio of investments.
Investment Strategy
At Dodge & Cox, we focus on our long-term investment horizon and price-disciplined approach in selecting stocks. This valuation focus can be observed in the Fund’s current holdings, which trade at 9.7 times forward earnings, a discount to the MSCI Emerging Markets at 12.1 times.
The Fund considers a broader investment universe than the MSCI Emerging Markets. Occasionally, emerging market companies choose a legal domicile or headquarters within a developed market country even though most or all of their business operations are within emerging markets. This is the case for Prosus, one of the largest positions in the Fund.4 The company holds a variety of internet businesses, derives significant revenue from China, and is headquartered in the Netherlands.
Our investment strategy also enables us to take a large number of small positions in companies and markets that are sometimes overlooked. For example, Vietnam’s economy is developing quickly and transforming dramatically, but its equity market is not yet included within the MSCI Emerging Markets. This has not stopped us from researching companies, such as Techcombank (Vietnam
Technological & Commercial Joint Stock Bank), where we built a 0.4% position. Techcombank is a leading financial institution that has partnered with the emerging ecosystem of young Vietnamese companies. Growth-driven bubbles in credit and real estate markets may bring short-term volatility, but if navigated prudently, allow for compounded returns that could result in a profitable long-term outcome for investors. The Fund aggregates a large number of small positions in companies, like Techcombank, that diversify risk and include many of the best long-term ideas of our investment team.
Latin America
Our research team is finding compelling opportunities in Latin America. Following a series of elections where left-wing governments were elected in Mexico, Brazil, and Colombia, there was substantial concern that new policies could be harmful to economic growth. While these fears were certainly justified, our Macroeconomic and Global Industry Analysts concluded market expectations were too pessimistic and ignored some of the positive economic developments within these economies. Mexico, for example, has seen enormous growth in “near-shoring” as U.S. companies have reduced risk by shifting their supply chains from China to Mexico.
During the first half of 2023, some of the Fund’s strongest returns have come from its Latin American holdings. The Mexican cement producer, Cemex, had a return of 74.8%; the Brazilian brokerage platform, XP, returned 52.9%; the Brazilian oil company, Petrobras, returned 51.0%; and the Mexican beverage company, FEMSA, returned 43.4%. While this level of performance is highly unusual, we continue to find attractive opportunities at reasonable valuations within Latin American markets.
Technology Hardware
Our decision to allocate less of the portfolio to hardware companies detracted from the Fund’s relative results versus the MSCI Emerging Markets. These are some of the largest businesses in emerging markets, including Taiwan Semiconductor Manufacturing Co. (TSMC) and Samsung Electronics, which produce an enormous portion of the world’s semiconductors. The Fund owns positions in both companies, as well as a variety of other emerging market semiconductor companies. However, going into 2023, we concluded the semiconductor cycle would weigh on the profitability of these companies and their equity valuations were not trading at substantial discounts. As a result, the Fund’s position sizes in these companies were modest relative to their allocation in the benchmark. These stocks had strong performance during the first half of 2023, as the 21% return from the Information Technology sector was the highest among all emerging market sectors, and our relatively smaller exposure in this sector detracted from return relative to the benchmark. Going forward, we continue to hold positions in emerging market hardware companies that are smaller than those in the benchmark, but we believe it is prudent over the long-term to allocate more of our capital to other investment opportunities.
China and Internet Platforms for Consumers
China plays such a prominent role in geopolitical discussions that many investors conflate the investment prospects of individual
PAGE 1 ◾ Dodge & Cox Emerging Markets Stock Fund
Chinese companies with the prospects of the Chinese economy. They are closely related, and China’s national policy and planning decisions have a major impact. At the same time, there is enormous breadth and diversity in the Chinese market, and we expect to find attractive opportunities even within a challenging environment.
A primary example is the digital economy where Chinese companies and consumers are at the forefront of the global digital transformation. We believe careful research and stock selection are especially critical for managing risk and growth. Three of the Fund’s largest portfolio holdings are involved in e-commerce: Alibaba, Baidu, and JD.com. Their profitable platforms are widely seen as global innovators yet are reasonably priced. We also see strong potential in three digital entertainment companies: NetEase, 37 Interactive, and IGG. On the other hand, there are many large Chinese consumer companies where we had less confidence in the business model or could not justify market valuations. During the first half of 2023, our stock selection within China was a positive contributor to portfolio returns. While the MSCI China Index5 declined approximately 5.5% of the first half of the year, many of the Fund’s strongest performing investments (and a few of its weakest) were in Chinese companies.
Currency Risk Management
Emerging market economies typically have higher rates of inflation and higher probability of financial crisis than developed economies. As a result, emerging market investors face currency risks that can result in a gradual erosion of the dollar value of their investments, sudden devaluation, or currency controls that make it impossible to return capital in the form of U.S. dollars. We consider these risks in our portfolio construction, and we occasionally hedge currency exposure as a risk management tool.
Our portfolio currently hedges the Taiwan dollar and the Chinese renminbi. In both cases, we do not anticipate massive devaluation. Instead, we see a modest probability that economic challenges could lead to currency weakness and concluded the portfolio return profile is more attractive with the hedges in place. During the first half of 2023, both currencies declined, and our hedges added approximately 0.8% to the Fund’s return.
New Holdings
During the first half of 2023, we added 12 new holdings to the portfolio. Each of these positions was relatively small as of June 30:
◾ Bank Negara Indonesia: government-sponsored bank in Indonesia;
◾ Coca-Cola HBC*: bottling company for Coca-Cola products sold in Eastern Europe and various other markets;
◾ Commercial Bank: leading bank in Qatar;
◾ Gedeon Richter: pharmaceutical company based in Hungary;
◾ Hankook Tire: global tire manufacturer based in Korea;
◾ Indorama Ventures: Thai company that is one of the world’s largest producers of polyester;
◾ Sahara International Petrochemical (Sipchem): Saudi Arabian petrochemical company;
◾ Shandong Sinocera*: Chinese producer of ceramic materials used in technology;
◾ Shanghai Baosight Software: Chinese developer of automation and information computer software;
◾ Suzano: Brazilian producer of paper and wood pulp materials;
◾ Thai Union*: global seafood producer based in Thailand; and
◾ Tofflon Science and Technology*: Chinese manufacturer of pharmaceutical equipment.
*Not held in the MSCI Emerging Markets Index.
In Closing
We believe the world’s emerging market economies will continue to be the primary driver of global growth, and they are increasingly centers of innovation. Our investment team shares a high degree of enthusiasm regarding the breadth and variety of opportunities we see.
At the same time, it is no secret that these economies also face elevated risks. The structural challenges that delayed their economic development in the past are often still present. We expect that most of the holdings in the portfolio will experience short-term challenges, and some may result in permanent loss of capital. As in other markets, we believe careful research and patience are keys to long-term success.
Thank you for your continued confidence in Dodge & Cox. As always, we welcome your comments and questions.
For the Board of Trustees, | |
| |
Dana M. Emery,
Chair and President | |
July 31, 2023
| All returns are stated in U.S. dollars, unless otherwise noted. The Funds’ total returns include the reinvestment of dividend and capital gain distributions, but have not been adjusted for any income taxes payable by shareholders on these distributions or on Fund share redemptions. Index returns include dividend and/or interest income but, unlike Fund returns, do not reflect fees or expenses. The MSCI Emerging Markets Index captures large- and mid-cap representation across emerging market countries. |
| Unless otherwise specified, all weightings and characteristics are as of June 30, 2023. Price-to-earnings (forward) ratios are calculated using 12-month forward earnings estimates from third-party sources as of the reporting period. Estimates reflect a consensus of sell-side analyst estimates, which may lag as market conditions change. |
| The S&P 500 Index is a market capitalization-weighted index of 500 large- capitalization stocks commonly used to represent the U.S. equity market. |
| The use of specific examples does not imply that they are more or less attractive investments than the portfolio’s other holdings. |
| The MSCI China Index captures large- and mid-cap representation across China A shares, H shares, B shares, Red chips, P chips, and foreign listings (e.g., ADRs). |
Dodge & Cox Emerging Markets Stock Fund ◾ PAGE 2
Year-to-Date Performance Review (unaudited)
The Fund outperformed the MSCI Emerging Markets Index by 2.66 percentage points year to date.
Key contributors to relative results included the Fund’s:
◾ Latin American Financials holdings, particularly XP and Itau Unibanco;
◾ Communication Services holdings, notably NetEase, Baidu, and 37 Interactive;
◾ Materials holdings, including Cemex and Teck Resources; and
◾ Position in Sinopharm Group.
Key detractors from relative results included the Fund’s:
◾ Underweight position in the Information Technology sector and certain holdings, including Weimob;
◾ Overweight position in the Consumer Discretionary sector and certain holdings, notably JD.com, Alibaba, and China Tourism;
◾ Energy holdings, particularly National Energy Services; and
◾ Positions in Glencore, Greentown Service, and Anheuser-
Busch InBev.
Key Characteristics of Dodge & Cox
Independent Organization
Dodge & Cox is one of the largest privately owned investment managers in the world. We remain committed to independence, with a goal of providing the highest-quality investment management service to our existing clients.
Over 90 Years of Investment Experience
Dodge & Cox was founded in 1930. We have a stable and well- qualified team of investment professionals, most of whom have spent their entire careers at Dodge & Cox.
Experienced Investment Team
The Emerging Markets Equity Investment Committee, which is the decision-making body for the Emerging Markets Stock Fund, is a five-member committee with an average tenure of 17 years at Dodge & Cox.
One Business with a Single Decision-Making Office
Dodge & Cox manages equity (domestic, international, and global), fixed income (domestic and global), and balanced investments, all from one office in San Francisco.
Consistent Investment Approach
Our team decision-making process involves thorough, bottom-up fundamental analysis of each investment.
Long-Term Focus and Low Expenses
We invest with a three- to five-year investment horizon, which has historically resulted in low turnover relative to our peers. We manage Funds that maintain low expense ratios.
Risks: The Fund is subject to market risk, meaning holdings in the Fund may decline in value for extended periods due to the financial prospects of individual companies, or due to general market and economic conditions. Investing in non-U.S. securities may entail risk due to foreign economic and political developments; this risk may be increased when investing in emerging markets. The Fund is also subject to currency risk. Please read the prospectus and summary prospectus for specific details regarding the Fund's risk profile.
Fund holdings and sector allocations are subject to change at any time and should not be considered recommendations to buy or sell any security. Please see the Portfolio of Investments section in this report for a complete list of fund holdings.
PAGE 3 ◾ Dodge & Cox Emerging Markets Stock Fund
Growth of $10,000 Since Inception (unaudited)
For an Investment Made on May 11, 2021 
Average Annual Total Return
For Periods Ended June 30, 2023
| | Since Inception (5/11/21) |
Dodge & Cox Emerging Markets Stock Fund | | |
MSCI Emerging Markets Index | | |
Expense Ratios
Per the Prospectus Dated May 1, 2023
| | |
Dodge & Cox Emerging Markets Stock Fund | | |
| Dodge & Cox has contractually agreed to reimburse the Fund for all ordinary expenses to the extent necessary to maintain Total Annual Fund Operating Expenses at 0.70% until April 30, 2026. This agreement cannot be terminated prior to April 30, 2026 other than by resolution of the Fund’s Board of Trustees. For purposes of the foregoing, ordinary expenses shall not include nonrecurring shareholder account fees, fees and expenses associated with Fund shareholder meetings, fees on portfolio transactions such as exchange fees, dividends and interest on short positions, fees and expenses of pooled investment vehicles that are held by the Fund, interest expenses and other fees and expenses related to any borrowings, taxes, brokerage fees and commissions and other costs and expenses relating to the acquisition and disposition of Fund investments, other expenditures which are capitalized in accordance with generally accepted accounting principles, and other non-routine expenses or extraordinary expenses not incurred in the ordinary course of the Fund’s business, such as litigation expenses. The term of the agreement will automatically renew for subsequent three-year terms unless terminated with at least 30 days’ written notice by either party prior to the end of the then-current term. The agreement does not permit Dodge & Cox to recoup any fees waived or payments made to the Fund for a prior year. |
Returns represent past performance and do not guarantee future results. Investment return and share price will fluctuate with market conditions, and investors may have a gain or loss when shares are sold. Fund performance changes over time and currently may be significantly lower than stated. Performance is updated and published monthly. Visit the Fund's website at dodgeandcox.com or call 800-621-3979 for current performance figures.
The Fund’s total returns include the reinvestment of dividend and capital gain distributions, but have not been adjusted for any income taxes payable by shareholders on these distributions or on Fund share redemptions. Index returns include dividends but, unlike Fund returns, do not reflect fees or expenses. The MSCI Emerging Markets Index captures large- and mid-cap representation across emerging market countries. MSCI makes no express or implied warranties or representations and shall have no liability whatsoever with respect to any MSCI data contained herein. The MSCI data may not be further redistributed or used as a basis for other indices or any securities or financial products. This report is not approved, reviewed, or produced by MSCI.
MSCI Emerging Markets is a service mark of MSCI Barra. For more information about this index, visit:
www.dodgeandcox.com/emergingmarketsstockfund
Dodge & Cox Emerging Markets Stock Fund ◾ PAGE 4
Portfolio Information (unaudited) June 30, 2023
Sector Diversification(a) | |
| |
| |
| |
| |
| |
| |
| |
| |
| |
| |
| |
| |
| |
| Net Cash & Other includes cash, short-term investments, derivatives, receivables, and payables. |
Fund Expense Example (unaudited)
As a Fund shareholder, you incur ongoing Fund costs, including management fees and other Fund expenses. All mutual funds have ongoing costs, sometimes referred to as operating expenses. The following example shows ongoing costs of investing in the Fund and can help you understand these costs and compare them with those of other mutual funds. The example assumes a $1,000 investment held for the six months indicated.
Actual Expenses
The first line of the table below provides information about actual account values and expenses based on the Fund’s actual returns. You may use the information in this line, together with your account balance, to estimate the expenses that you paid over the period. Simply divide your account value by $1,000 (for example, an $8,600 account value divided by $1,000 = 8.6), then multiply the result by the number in the first line under the heading “Expenses Paid During Period” to estimate the expenses you paid on your account during this period.
Hypothetical Example for Comparison with Other Mutual Funds
Information on the second line of the table can help you compare ongoing costs of investing in the Fund with those of other mutual funds. This information may not be used to estimate the actual ending account balance or expenses you paid during the period. The hypothetical “Ending Account Value” is based on the actual expense ratio of the Fund and an assumed 5% annual rate of return before expenses (not the Fund’s actual return). The amount under the heading “Expenses Paid During Period” shows the hypothetical expenses your account would have incurred under this scenario. You can compare this figure with the 5% hypothetical examples that appear in shareholder reports of other mutual funds.
Six Months Ended
June 30, 2023 | Beginning Account Value
1/1/2023 | Ending Account Value
6/30/2023 | Expenses Paid
During Period* |
Based on Actual Fund Return | | | |
Based on Hypothetical 5% Yearly Return | | | |
| Expenses are equal to the Fund’s annualized expense ratio of 0.70%, multiplied by the average account value over the period, multiplied by 181/365 (to reflect the one-half year period). |
The expenses shown in the table highlight ongoing costs only and do not reflect any transactional fees or account maintenance fees. Though other mutual funds may charge such fees, please note that the Fund does not charge transaction fees (e.g., redemption fees, sales loads) or universal account maintenance fees (e.g., small account fees).
PAGE 5 ◾ Dodge & Cox Emerging Markets Stock Fund
Portfolio of Investments (unaudited) June 30, 2023
|
| | |
Communication Services: 7.1% |
Media & Entertainment: 6.2% |
37 Interactive Entertainment Network Technology Group Co., Ltd., Class A (China) | | |
AfreecaTV Co., Ltd. (South Korea) | | |
Astro Malaysia Holdings BHD (Malaysia) | | |
Baidu, Inc. ADR(a) (China) | | |
Grupo Televisa SAB (Mexico) | | |
| | |
| | |
Megacable Holdings SAB de CV (Mexico) | | |
MultiChoice Group, Ltd. (South Africa) | | |
NetEase, Inc. ADR (China) | | |
Sun TV Network, Ltd. (India) | | |
| | |
| | |
Telecommunication Services: 0.9% |
America Movil SAB de CV (Mexico) | | |
China Tower Corp., Ltd., Class H(b)(c) (China) | | |
Millicom International Cellular SA SDR(a) (Guatemala) | | |
Sitios Latinoamerica SAB de CV(a) (Brazil) | | |
| | |
| | |
Consumer Discretionary: 18.8% |
Automobiles & Components: 1.5% |
Fuyao Glass Industry Group Co., Ltd., Class H(b)(c) (China) | | |
Hankook Tire & Technology Co., Ltd. (South Korea) | | |
Hyundai Mobis Co., Ltd. (South Korea) | | |
| | |
| | |
Consumer Discretionary Distribution & Retail: 11.8% |
Alibaba Group Holding, Ltd. ADR(a) (China) | | |
China Tourism Group Duty Free Corp., Ltd., Class A (China) | | |
China Yongda Automobiles Services Holdings, Ltd. (China) | | |
Cuckoo Homesys Co., Ltd. (South Korea) | | |
Detsky Mir PJSC(a)(b)(c)(d) (Russia) | | |
JD.com, Inc., Class A (China) | | |
Motus Holdings, Ltd. (South Africa) | | |
Prosus NV, Class N (China) | | |
PTG Energy PCL NVDR (Thailand) | | |
Vibra Energia SA (Brazil) | | |
Vipshop Holdings, Ltd. ADR(a) (China) | | |
Zhongsheng Group Holdings, Ltd. (China) | | |
| | |
Consumer Durables & Apparel: 2.1% |
Feng Tay Enterprise Co., Ltd. (Taiwan) | | |
Gree Electric Appliances, Inc. of Zhuhai, Class A (China) | | |
|
| | |
Haier Smart Home Co., Ltd., Class H (China) | | |
Man Wah Holdings, Ltd. (Hong Kong) | | |
Midea Group Co., Ltd., Class A (China) | | |
| | |
| | |
|
Afya, Ltd., Class A(a) (Brazil) | | |
H World Group, Ltd.(a) (China) | | |
Haidilao International Holding, Ltd.(b)(c) (China) | | |
HumanSoft Holding Co. KSCC (Kuwait) | | |
Las Vegas Sands Corp.(a) (United States) | | |
Leejam Sports Co. JSC (Saudi Arabia) | | |
Sands China, Ltd.(a) (Macau) | | |
Ser Educacional SA(b)(c) (Brazil) | | |
Trip.com Group, Ltd. ADR (China) | | |
Yum China Holdings, Inc. (China) | | |
| | |
| | |
|
Consumer Staples Distribution & Retail: 0.6% |
| | |
BIM Birlesik Magazalar AS (Turkey) | | |
Grupo Comercial Chedraui SAB de CV (Mexico) | | |
| | |
Wal-Mart de Mexico SAB de CV (Mexico) | | |
X5 Retail Group NV GDR(b)(d) (Russia) | | |
Yonghui Superstores Co., Ltd., Class A(a) (China) | | |
| | |
Food, Beverage & Tobacco: 5.0% |
Anadolu Efes Biracilik Ve Malt (Turkey) | | |
Angel Yeast Co., Ltd., Class A (China) | | |
Anheuser-Busch InBev SA/NV (Belgium) | | |
Arca Continental SAB de CV (Mexico) | | |
Century Pacific Food, Inc. (Philippines) | | |
China Feihe, Ltd.(b)(c) (China) | | |
| | |
| | |
Fomento Economico Mexicano SAB de CV (Mexico) | | |
| | |
| | |
PT Indofood CBP Sukses Makmur Tbk (Indonesia) | | |
Sanquan Food Co., Ltd., Class A (China) | | |
Saudia Dairy & Foodstuff Co. (Saudi Arabia) | | |
Thai Union Group PCL NVDR (Thailand) | | |
Tingyi (Cayman Islands) Holding Corp. (China) | | |
See accompanying Notes to Financial StatementsDodge & Cox Emerging Markets Stock Fund ◾ PAGE 6
Portfolio of Investments (unaudited) June 30, 2023
Common Stocks (continued) |
| | |
Vietnam Dairy Products JSC (Vietnam) | | |
WH Group, Ltd.(b)(c) (Hong Kong) | | |
| | |
Household & Personal Products: 0.2% |
Grape King Bio, Ltd. (Taiwan) | | |
| | |
|
Bharat Petroleum Corp., Ltd. (India) | | |
China Suntien Green Energy Corp., Ltd., Class H (China) | | |
| | |
| | |
Hindustan Petroleum Corp., Ltd. (India) | | |
| | |
| | |
MOL Hungarian Oil & Gas PLC, Class A (Hungary) | | |
Motor Oil (Hellas) Corinth Refineries SA (Greece) | | |
National Energy Services Reunited Corp.(a) (United States) | | |
| | |
Petroleo Brasileiro SA (Brazil) | | |
PTT Exploration & Production PCL NVDR (Thailand) | | |
Saudi Arabian Oil Co.(b)(c) (Saudi Arabia) | | |
| | |
|
|
| | |
Banca Transilvania SA (Romania) | | |
Bangkok Bank PCL NVDR (Thailand) | | |
Bank Polska Kasa Opieki SA (Poland) | | |
BDO Unibank, Inc. (Philippines) | | |
Brac Bank, Ltd. (Bangladesh) | | |
China Merchants Bank Co., Ltd., Class H (China) | | |
Commercial International Bank (Egypt) SAE (Egypt) | | |
| | |
Equity Group Holdings PLC (Kenya) | | |
Grupo Financiero Banorte SAB de CV, Class O (Mexico) | | |
Hong Leong Financial Group BHD (Malaysia) | | |
| | |
IndusInd Bank, Ltd. (India) | | |
Intercorp Financial Services, Inc. (Peru) | | |
JB Financial Group Co., Ltd. (South Korea) | | |
Kasikornbank PCL NVDR (Thailand) | | |
KB Financial Group, Inc. (South Korea) | | |
Military Commercial Joint Stock Bank (Vietnam) | | |
| | |
Ping An Bank Co., Ltd., Class A (China) | | |
PT Bank Negara Indonesia (Persero) Tbk (Indonesia) | | |
|
| | |
PT Bank Rakyat Indonesia (Persero) Tbk, Class B (Indonesia) | | |
Shinhan Financial Group Co., Ltd. (South Korea) | | |
TCS Group Holding PLC GDR, Class A(a)(b)(d) (Russia) | | |
The Commercial Bank PSQC (Qatar) | | |
Tisco Financial Group PCL NVDR (Thailand) | | |
Vietnam Technological & Commercial Joint Stock Bank(a) (Vietnam) | | |
| | |
|
AEON Credit Service (M) BHD (Malaysia) | | |
Banco BTG Pactual SA (Brazil) | | |
Chailease Holding Co., Ltd. (Taiwan) | | |
| | |
FirstRand, Ltd. (South Africa) | | |
Grupo de Inversiones Suramericana SA (Colombia) | | |
Kaspi.kz JSC GDR(b) (Kazakhstan) | | |
Noah Holdings, Ltd. ADR, Class A (China) | | |
XP, Inc., Class A(a) (Brazil) | | |
| | |
|
BB Seguridade Participacoes SA (Brazil) | | |
China Pacific Insurance (Group) Co., Ltd., Class H (China) | | |
DB Insurance Co., Ltd. (South Korea) | | |
Korean Reinsurance Co. (South Korea) | | |
Old Mutual, Ltd. (South Africa) | | |
Ping An Insurance (Group) Co. of China Ltd., Class H (China) | | |
Prudential PLC (Hong Kong) | | |
Samsung Fire & Marine Insurance Co., Ltd. (South Korea) | | |
Sanlam, Ltd. (South Africa) | | |
| | |
| | |
|
Health Care Equipment & Services: 2.8% |
China Isotope & Radiation Corp. (China) | | |
Guangzhou Baiyunshan Pharmaceutical Holdings Co., Ltd., Class H (China) | | |
Hartalega Holdings BHD (Malaysia) | | |
Kossan Rubber Industries BHD (Malaysia) | | |
Shandong Pharmaceutical Glass Co., Ltd., Class A (China) | | |
Shandong Weigao Group Medical Polymer Co., Ltd., Class H (China) | | |
Sinocare, Inc., Class A (China) | | |
Sinopharm Group Co., Ltd. (China) | | |
PAGE 7 ◾ Dodge & Cox Emerging Markets Stock FundSee accompanying Notes to Financial Statements
Portfolio of Investments (unaudited) June 30, 2023
Common Stocks (continued) |
| | |
Sonoscape Medical Corp., Class A (China) | | |
Tofflon Science & Technology Group Co., Ltd., Class A (China) | | |
| | |
Pharmaceuticals, Biotechnology & Life Sciences: 1.9% |
Adcock Ingram Holdings, Ltd. (South Africa) | | |
Aurobindo Pharma, Ltd. (India) | | |
Beijing Tong Ren Tang Chinese Medicine Co., Ltd. (China) | | |
Dr. Reddy's Laboratories, Ltd. (India) | | |
Jiangsu Hengrui Pharmaceuticals Co., Ltd., Class A (China) | | |
Richter Gedeon NYRT (Hungary) | | |
Zhejiang NHU Co., Ltd., Class A (China) | | |
| | |
| | |
|
|
BOC Aviation, Ltd.(b)(c) (China) | | |
Chicony Power Technology Co., Ltd. (Taiwan) | | |
Doosan Bobcat, Inc. (South Korea) | | |
| | |
| | |
| | |
Larsen & Toubro, Ltd. (India) | | |
PT Astra International Tbk (Indonesia) | | |
SFA Engineering Corp. (South Korea) | | |
United Integrated Services Co., Ltd. (Taiwan) | | |
Xinjiang Goldwind Science & Technology Co., Ltd., Class H (China) | | |
| | |
|
Air Arabia PJSC (United Arab Emirates) | | |
Aramex PJSC (United Arab Emirates) | | |
Cebu Air, Inc.(a) (Philippines) | | |
Copa Holdings SA, Class A (Panama) | | |
Globaltrans Investment PLC GDR(a)(b)(d) (Russia) | | |
Gulf Warehousing Co. (Qatar) | | |
Hyundai Glovis Co., Ltd. (South Korea) | | |
International Container Terminal Services, Inc. (Philippines) | | |
Movida Participacoes SA (Brazil) | | |
Promotora y Operadora de Infraestructura SAB de CV (Mexico) | | |
Westports Holdings BHD (Malaysia) | | |
| | |
| | |
Information Technology: 10.1% |
Semiconductors & Semiconductor Equipment: 7.6% |
Alpha & Omega Semiconductor, Ltd.(a) (United States) | | |
ASE Technology Holding Co., Ltd. (Taiwan) | | |
ELAN Microelectronics Corp. (Taiwan) | | |
Nanya Technology Corp. (Taiwan) | | |
|
| | |
Novatek Microelectronics Corp. (Taiwan) | | |
Powertech Technology, Inc. (Taiwan) | | |
Taiwan Semiconductor Manufacturing Co., Ltd. (Taiwan) | | |
| | |
Software & Services: 1.5% |
Asseco Poland SA (Poland) | | |
Chinasoft International, Ltd. (China) | | |
Hancom, Inc.(a) (South Korea) | | |
Shanghai Baosight Software Co., Ltd., Class A (China) | | |
Weimob, Inc.(a)(b)(c) (China) | | |
| | |
Technology, Hardware & Equipment: 1.0% |
Lenovo Group, Ltd. (China) | | |
Sterlite Technologies, Ltd. (India) | | |
| | |
| | |
| | |
|
Alpek SAB de CV, Class A (Mexico) | | |
Alrosa PJSC(a)(d) (Russia) | | |
Anhui Conch Cement Co., Ltd., Class H (China) | | |
Cemex SAB de CV ADR(a) (Mexico) | | |
| | |
Indorama Ventures PCL NVDR (Thailand) | | |
| | |
LB Group Co., Ltd., Class A (China) | | |
Loma Negra Cia Industrial Argentina SA ADR (Argentina) | | |
| | |
Nine Dragons Paper Holdings, Ltd. (Hong Kong) | | |
Orbia Advance Corp. SAB de CV (Mexico) | | |
PTT Global Chemical PCL NVDR (Thailand) | | |
Sahara International Petrochemical Co. (Saudi Arabia) | | |
Severstal PJSC(a)(d) (Russia) | | |
Shandong Sinocera Functional Material Co., Ltd., Class A (China) | | |
| | |
Teck Resources, Ltd., Class B (Canada) | | |
| | |
Wanhua Chemical Group Co., Ltd., Class A (China) | | |
| | |
|
Equity Real Estate Investment Trusts (Reits): 0.2% |
Macquarie Mexico Real Estate Management SA de CV REIT(b)(c) (Mexico) | | |
Prologis Property Mexico SA de CV REIT (Mexico) | | |
| | |
See accompanying Notes to Financial StatementsDodge & Cox Emerging Markets Stock Fund ◾ PAGE 8
Portfolio of Investments (unaudited) June 30, 2023
Common Stocks (continued) |
| | |
Real Estate Management & Development: 2.2% |
China Resources Land, Ltd. (China) | | |
Corporacion Inmobiliaria Vesta SAB de CV (Mexico) | | |
Country Garden Services Holdings Co., Ltd. (China) | | |
Emaar Development PJSC (United Arab Emirates) | | |
Greentown Service Group Co., Ltd.(b) (China) | | |
Hang Lung Group, Ltd. (Hong Kong) | | |
KE Holdings, Inc. ADR, Class A(a) (China) | | |
Megaworld Corp. (Philippines) | | |
| | |
| | |
|
China Gas Holdings, Ltd. (China) | | |
China Water Affairs Group, Ltd. (China) | | |
Enerjisa Enerji AS(b)(c) (Turkey) | | |
Engie Brasil Energia SA (Brazil) | | |
Engie Energia Chile SA(a) (Chile) | | |
GAIL (India), Ltd. (India) | | |
KunLun Energy Co., Ltd. (China) | | |
Mahanagar Gas, Ltd.(b) (India) | | |
| | |
Tenaga Nasional BHD (Malaysia) | | |
| | |
Total Common Stocks
(Cost $218,107,635) | | |
|
| | |
Consumer Discretionary: 0.4% |
Automobiles & Components: 0.4% |
Hyundai Motor Co., Pfd 2 (South Korea) | | |
|
Food, Beverage & Tobacco: 0.1% |
Embotelladora Andina SA, Pfd, Class B (Chile) | | |
Household & Personal Products: 0.2% |
Amorepacific Corp., Pfd (South Korea) | | |
LG H&H Co., Ltd., Pfd (South Korea) | | |
| | |
| | |
|
|
Itau Unibanco Holding SA, Pfd (Brazil) | | |
|
|
DL E&C Co., Ltd., Pfd (South Korea) | | |
DL E&C Co., Ltd., Pfd 2 (South Korea) | | |
| | |
|
| | |
Information Technology: 3.4% |
Technology, Hardware & Equipment: 3.4% |
Samsung Electro-Mechanics Co., Ltd., Pfd (South Korea) | | |
Samsung Electronics Co., Ltd., Pfd (South Korea) | | |
| | |
| | |
DL Holdings Co., Ltd., Pfd (South Korea) | | |
Braskem SA, Pfd, Class A(a) (Brazil) | | |
| | |
| | |
Centrais Eletricas Brasileiras SA, Pfd, Class B (Brazil) | | |
Total Preferred Stocks
(Cost $18,926,397) | | |
Short-Term Investments: 3.6% |
| | |
Repurchase Agreements: 3.2% |
Fixed Income Clearing Corporation(e) 5.04%, dated 6/30/23, due 7/3/23, maturity value $5,002,100 | | |
Fixed Income Clearing Corporation(e) 2.45%, dated 6/30/23, due 7/3/23, maturity value $1,808,369 | | |
| | |
|
State Street Institutional U.S. Government Money Market Fund - Premier Class | | |
Total Short-Term Investments
(Cost $7,663,899) | |
Total Investments In Securities
(Cost $244,697,931) | | |
Other Assets Less Liabilities | | |
| | |
| |
| Security exempt from registration pursuant to Regulation S under the Securities Act of 1933, as amended. Regulation S securities are subject to restrictions on resale in the United States. |
| Security exempt from registration under Rule 144A of the Securities Act of 1933. The security may be resold in transactions exempt from registration, normally to qualified institutional buyers. |
| Valued using significant unobservable inputs. |
| Repurchase agreement is collateralized by U.S. Treasury Notes 0.25%-1.875%, 9/30/25-2/15/41. Total collateral value is $6,944,252. |
| The Fund usually classifies a company or issuer based on its country of risk, but may designate a different country in certain circumstances. |
| |
| |
ADR: American Depositary Receipt |
GDR: Global Depositary Receipt |
NVDR: Non-Voting Depository Receipt |
SDR: Swedish Depository Receipt |
PAGE 9 ◾ Dodge & Cox Emerging Markets Stock FundSee accompanying Notes to Financial Statements
Portfolio of Investments (unaudited) June 30, 2023
Futures Contracts
| | | | Value /
Unrealized
Appreciation/
(Depreciation) |
ICE US MSCI Emerging Markets Index Futures— Long Position | | | | |
Currency Forward Contracts
| | | | Unrealized Appreciation
(Depreciation) |
CNH: Chinese Yuan Renminbi |
| | | | | | |
| | | | | | |
| | | | | | |
| | | | | | |
| | | | | | |
| | | | | | |
| | | | | | |
| | | | | | |
| | | | | | |
| | | | | | |
| | | | | | |
| | | | | | |
| | | | | | |
| | | | | | |
| | | | | | |
| | | | | | |
| | | | | | |
| | | | | | |
| | | | | | |
| | | | | | |
| | | | | | |
| | | | | | |
| | | | | | |
| | | | | | |
|
| | | | | | |
| | | | | | |
| | | | | | |
| | | | | | |
| | | | | | |
| | | | | | |
Unrealized gain on currency forward contracts | | | |
Unrealized loss on currency forward contracts | | | |
Net unrealized gain on currency forward contracts | | | | |
The listed counterparty may be the parent company or one of its subsidiaries.
See accompanying Notes to Financial StatementsDodge & Cox Emerging Markets Stock Fund ◾ PAGE 10
Statement of Assets and Liabilities (unaudited)
| |
|
Investments in securities, at value (cost $244,697,931) | |
Unrealized appreciation on currency forward contracts | |
Cash denominated in foreign currency (cost $180,609) | |
Deposits with broker for futures contracts | |
Receivable for variation margin for futures contracts | |
Receivable for Fund shares sold | |
Dividends and interest receivable | |
Expense reimbursement receivable | |
Prepaid expenses and other assets | |
| |
|
Unrealized depreciation on currency forward contracts | |
Cash received as collateral for currency forward contracts | |
Payable for Fund shares redeemed | |
Deferred foreign capital gains tax | |
| |
| |
| |
| |
|
| |
| |
| |
Fund shares outstanding (par value $0.01 each, unlimited shares authorized) | |
Net asset value per share | |
Statement of Operations (unaudited)
| Six Months Ended
June 30, 2023 |
| |
Dividends (net of foreign taxes of $290,799) | |
| |
| |
| |
| |
Custody and fund accounting fees | |
Administrative services fees | |
| |
| |
| |
| |
| |
| |
Expenses reimbursed by investment manager | |
| |
| |
Realized and Unrealized Gain (Loss): | |
| |
Investments in securities (net of foreign capital gains tax of $31,113) | |
| |
Currency forward contracts | |
Foreign currency transactions | |
Net change in unrealized appreciation/depreciation | |
Investments in securities (net of change in deferred foreign capital gains tax of $215,941) | |
| |
Currency forward contracts | |
Foreign currency translation | |
Net realized and unrealized gain | |
Net Change in Net Assets From Operations | |
Statement of Changes in Net Assets (unaudited)
| | |
| | |
| | |
| | |
| | |
Net change in unrealized appreciation/depreciation | | |
| | |
Distributions to Shareholders: | | |
| | |
| | |
Proceeds from sale of shares | | |
Reinvestment of distributions | | |
| | |
Net change from Fund share transactions | | |
Total change in net assets | | |
| | |
| | |
| | |
| | |
| | |
| | |
| | |
Net change in shares outstanding | | |
PAGE 11 ◾ Dodge & Cox Emerging Markets Stock FundSee accompanying Notes to Financial Statements
Notes to Financial Statements (unaudited)
Note 1: Organization and Significant Accounting Policies
Dodge & Cox Emerging Markets Stock Fund (the “Fund”) is one of the series constituting the Dodge & Cox Funds (the “Trust” or the “Funds”). The Trust is organized as a Delaware statutory trust and is registered under the Investment Company Act of 1940, as amended, as an open-end management investment company. The Fund commenced operations on May 11, 2021, and seeks long-term growth of principal and income. The Fund invests primarily in a diversified portfolio of emerging markets equity securities issued by companies from at least three different countries. Foreign investing, especially in developing countries, has special risks such as currency and market volatility and political and social instability. These and other risk considerations are discussed in the Fund’s Prospectus.
The Fund is an investment company and follows the accounting and reporting guidance issued in Topic 946 by the Financial Accounting Standards Board. The financial statements have been prepared in conformity with accounting principles generally accepted in the United States of America, which require the use of estimates and assumptions by management. Actual results may differ from those estimates. Significant accounting policies are as follows:
Security valuation The Fund’s net assets are normally valued as of the scheduled close of trading on the New York Stock Exchange (NYSE), generally 4 p.m. Eastern Time, each day that the NYSE is open for business.
Portfolio holdings for which market quotes are readily available are valued at market value. Listed securities, for example, are generally valued using the official quoted close price or the last sale on the exchange that is determined to be the primary market for the security. Exchange-traded derivatives are valued at the settlement price determined by the relevant exchange. Short-term securities less than 60 days to maturity may be valued at amortized cost if amortized cost approximates current value. Mutual funds are valued at their respective net asset values. Security values are not discounted based on the size of the Fund’s position and may differ from the value a Fund receives upon sale of the securities.
Investments initially valued in currencies other than the U.S. dollar are converted to the U.S. dollar using prevailing exchange rates. Currency forward contracts are valued based on the prevailing forward exchange rates of the underlying currencies. As a result, the Fund’s net assets may be affected by changes in the value of currencies in relation to the U.S. dollar.
If market quotations are not readily available or if normal valuation procedures produce valuations that are deemed unreliable or inappropriate under the circumstances existing at the time, the investment will be valued at fair value as determined in good faith by Dodge & Cox. The Board of Trustees has appointed Dodge & Cox, the Fund’s investment manager, as its "valuation designee", as permitted by Rule 2a-5 under the Investment Company Act of 1940, to make fair value determinations in accordance with the Dodge & Cox Funds Valuation Policies (“Valuation Policies”), subject to Board oversight. Dodge & Cox has established a Pricing Committee that is comprised of representatives from Treasury, Legal, Compliance, and Operations. The Pricing Committee is responsible for implementing the Valuation Policies, including determining the fair value of securities and other
investments when necessary. The Pricing Committee considers relevant indications of value that are reasonably available to it in determining the fair value assigned to a particular security, such as the value of similar financial instruments, trading volumes, contractual restrictions on disposition, related corporate actions, and changes in economic conditions. In doing so, the Pricing Committee employs various methods for calibrating fair valuation approaches, including a regular review of key inputs and assumptions, back-testing, and review of any related market activity.
As trading in securities on most foreign exchanges is normally completed before the close of the NYSE, the value of non-U.S. securities can change by the time the Fund calculates its net asset value. To address these changes, the Fund may utilize adjustment factors provided by an independent pricing service to systematically value non-U.S. securities at fair value. These adjustment factors are based on statistical analyses of subsequent movements and changes in U.S. markets and financial instruments trading in U.S. markets that represent foreign securities or baskets of securities.
Valuing securities through a fair value determination involves greater reliance on judgment than valuation of securities based on readily available market quotations. In some instances, lack of information and uncertainty as to the significance of information may lead to a conclusion that a prior valuation is the best indication of a security’s value. When fair value pricing is employed, the prices of securities used by the Fund to calculate its net asset value may differ from quoted or published prices for the same securities.
Security transactions, investment income, expenses, and distributions Security transactions are recorded on the trade date. Realized gains and losses on securities sold are determined on the basis of identified cost.
Dividend income and corporate action transactions are recorded on the ex-dividend date, or when the Fund first learns of the dividend/corporate action if the ex-dividend date has passed. Non-cash dividends, if any, are recorded at the fair market value of the securities received. Dividends characterized as return of capital for U.S. tax purposes are recorded as a reduction of cost of investments and/or realized gain. Interest income is recorded on the accrual basis.
Expenses are recorded on the accrual basis. Some expenses of the Trust can be directly attributed to a specific series. Expenses which cannot be directly attributed are allocated among the Funds in the Trust using methodologies determined by the nature of the expense.
Distributions to shareholders are recorded on the ex-dividend date.
Foreign taxes The Fund may be subject to foreign taxes which may be imposed by certain countries in which the Fund invests. The Fund endeavors to record foreign taxes based on applicable foreign tax law. Withholding taxes are incurred on certain foreign dividends and are accrued at the time the associated dividend is recorded. The Fund files withholding tax reclaims in certain jurisdictions to recover a portion of amounts previously withheld. The Fund records a reclaim receivable based on, among other things, a jurisdiction’s legal obligation to pay reclaims as well as payment history and market convention.
Dodge & Cox Emerging Markets Stock Fund ◾ PAGE 12
Notes to Financial Statements (unaudited)
Foreign currency translation The books and records of the Fund are maintained in U.S. dollars. Foreign currency amounts are translated into U.S. dollars at the prevailing exchange rates of such currencies against the U.S. dollar. The market value of investment securities and other assets and liabilities are translated at the exchange rate as of the valuation date. Purchases and sales of investment securities, income, and expenses are translated at the exchange rate prevailing on the transaction date.
Reported realized and unrealized gain (loss) on investments include foreign currency gain (loss) related to investment transactions.
Reported realized and unrealized gain (loss) on foreign currency transactions and translation include the following: disposing/holding of foreign currency, the difference in exchange rate between the trade and settlement dates on securities transactions, the difference in exchange rate between the accrual and payment dates on dividends, and currency losses on the purchase of foreign currency in certain countries that impose taxes on such transactions.
Repurchase agreements Repurchase agreements are transactions under which a Fund purchases a security from a counterparty and agrees to resell the security to that counterparty on a specified future date at the same price, plus a specified interest rate. The Fund’s repurchase agreements are secured by U.S. government or agency securities. It is the Fund’s policy that its regular custodian or third party custodian take possession of the underlying collateral securities, the fair value of which exceeds the principal amount of the repurchase transaction, including accrued interest, at all times. In the event of default by the counterparty, the Fund has the contractual right to liquidate the collateral securities and to apply the proceeds in satisfaction of the obligation.
Indemnification Under the Trust’s organizational documents, its officers and trustees are indemnified against certain liabilities arising out of the performance of their duties to the Trust. In addition, in the normal course of business the Trust enters into contracts that provide general indemnities to other parties. The Trust’s maximum exposure under these arrangements is unknown, as this would involve future claims that may be made against the Trust that have not yet occurred.
Note 2: Valuation Measurements
Various inputs are used in determining the value of the Fund’s investments. These inputs are summarized in the three broad levels below.
◾ Level 1: Unadjusted quoted prices in active markets for identical securities
◾ Level 2: Other significant observable inputs (including quoted prices for similar securities, market indices, interest rates, credit risk, forward exchange rates, etc.)
◾ Level 3: Significant unobservable inputs (including Fund management’s assumptions in determining the fair value of investments)
The inputs or methodology used for valuing securities are not necessarily an indication of the risk associated with investing in those securities.
The following is a summary of the inputs used to value the Fund’s holdings at June 30, 2023:
| | LEVEL 2
(Other Significant
Observable
Inputs) | LEVEL 3
(Signficant
Unobservable
Inputs) |
|
|
| | | |
| | | |
| | | |
| | | |
| | | |
| | | |
| | | |
| | | |
| | | |
| | | |
| | | |
|
| | | |
| | | |
| | | |
| | | |
| | | |
| | | |
| | | |
|
| | | |
| | | |
| | | |
|
|
| | | |
Currency Forward Contracts |
| | | |
| | | |
Note 3: Derivative Instruments
The Fund may use derivatives either to minimize the impact of certain risks to one or more of its investments (as a ‘‘hedging technique’’) or to implement its investment strategy. A derivative is a financial instrument whose value is derived from a security, currency, interest rate, index, or other financial instrument.
Futures contracts Futures contracts involve an obligation to purchase or sell (depending on whether the Fund has entered a long or short futures contract, respectively) an asset at a future date, at a price set at the time the contract is purchased. Futures contracts are exchange-traded. Upon entering into a futures contract, the Fund is required to deposit an amount of cash or liquid assets (referred to as "initial margin") in a segregated account with the clearing broker to secure the Fund's obligation to perform. Initial margin is returned to the Fund when the futures contract is closed. Subsequent payments (referred to as "variation margin") are made to or received from the clearing broker on a daily basis based on changes in the market value of the contract. Changes in the market value of open futures contracts
PAGE 13 ◾ Dodge & Cox Emerging Markets Stock Fund
Notes to Financial Statements (unaudited)
are recorded as unrealized appreciation or depreciation in the Statement of Operations. Realized gains and losses on futures contracts are recorded in the Statement of Operations at the closing or expiration of the contracts. Cash deposited with a broker as initial margin is recorded in the Statement of Assets and Liabilities. A receivable and/or payable to brokers for daily variation margin is also recorded in the Statement of Assets and Liabilities.
Investments in futures contracts may include certain risks, which may be different from, and potentially greater than, those of the underlying securities. To the extent the Fund uses futures, it is exposed to additional volatility and potential losses resulting from leverage.
The Fund used equity index futures contracts to create equity exposure, equal to some or all of its non-equity net assets.
Currency forward contracts Currency forward contracts are agreements to purchase or sell a specific currency at a specified future date and price. Currency forward contracts are traded over-the-counter. The values of currency forward contracts change daily based on the prevailing forward exchange rates of the underlying currencies. Changes in the value of open contracts are recorded as unrealized appreciation or depreciation in the Statement of Operations. When a currency forward contract is closed, the Fund records a realized gain or loss in the Statement of Operations equal to the difference between the value at the time the contract was opened and the value at the time it was closed.
Losses from these transactions may arise from unfavorable changes in currency values or if a counterparty does not perform under a contract’s terms.
The Fund used currency forward contracts to hedge direct foreign currency exposure.
Additional derivative information The following identifies the location on the Statement of Assets and Liabilities and values of the Fund's derivative instruments categorized by primary underlying risk exposure.
| | Foreign
Exchange
Derivatives | |
| | | |
Unrealized appreciation on currency forward contracts | | | |
| | | |
Unrealized depreciation on currency forward contracts | | | |
| | | |
| | | |
| Includes cumulative appreciation (depreciation). Only the current day’s variation margin is reported in the Statement of Assets and Liabilities. |
The following summarizes the effect of derivative instruments on the Statement of Operations, categorized by primary underlying risk exposure.
| | Foreign
Exchange
Derivatives | |
| | | |
| | | |
Currency forward contracts | | | |
| | | |
Net change in unrealized appreciation/depreciation |
| | | |
Currency forward contracts | | | |
| | | |
The following summarizes the range of volume in the Fund's derivative instruments during the six months ended June 30, 2023.
| | |
| | |
Currency forward contracts | | |
The Fund may enter into various over-the-counter derivative contracts governed by International Swaps and Derivatives Association master agreements (“ISDA agreements”). The Fund’s ISDA agreements, which are separately negotiated with each dealer counterparty, specify (i) events of default and other events permitting a party to terminate some or all of the contracts thereunder and (ii) the process by which those contracts will be valued for purposes of determining termination payments. If some or all of the contracts under a master agreement are terminated because of an event of default or similar event, the values of all terminated contracts must be netted to determine a single payment owed by one party to the other. To the extent amounts owed to the Fund by its counterparties are not collateralized, the Fund is at risk of those counterparties’ non-performance. The Fund attempts to mitigate counterparty credit risk by entering into contracts only with counterparties it believes to be of good credit quality, by exchanging collateral, and by monitoring the financial stability of those counterparties.
For financial reporting purposes, the Fund does not offset assets and liabilities that are subject to a master netting arrangement in the Statement of Assets and Liabilities.
The Fund’s ability to net assets and liabilities and to offset collateral pledged or received is based on contractual netting/offset provisions in the ISDA agreements. The Fund did not hold derivatives that are subject to enforceable master netting arrangements at June 30, 2023.
| Gross
Amount of
Recognized
Assets | Gross
Amount of
Recognized
Liabilities | | |
| | | | |
| | | | |
| | | | |
| | | | |
| | | | |
| | | | |
Dodge & Cox Emerging Markets Stock Fund ◾ PAGE 14
Notes to Financial Statements (unaudited)
| Cash collateral pledged/(received) in excess of derivative assets/liabilities is not presented in this table. The total cash collateral is presented on the Fund's Statement of Assets and Liabilities. |
| Represents the net amount receivable from (payable to) the counterparty in the event of a default. |
Note 4: Related Party Transactions
Investment advisory fee The Fund pays an investment advisory fee monthly at an annual rate of 0.55% of the Fund’s average daily net assets to Dodge & Cox, investment manager of the Fund.
Administrative services fee The Fund pays Dodge & Cox a fee for administrative and shareholder services. The fee is accrued daily and paid monthly equal to an annual rate of 0.05% of the Fund’s average daily net assets. Under this agreement, Dodge & Cox also pays for the Fund's transfer agent fees.
Expense reimbursement Dodge & Cox has contractually agreed to reimburse the Fund for all ordinary expenses to the extent necessary to maintain the ratio of total operating expenses to average net assets (“net expense ratio”) at 0.70% through April 30, 2026. The term of the agreement will automatically renew for subsequent three-year terms unless terminated with at least 30 days’ written notice by either party prior to the end of the then-current term.
Fund officers and trustees All officers and two of the trustees of the Trust are current or former senior executive officers of Dodge & Cox. The Trust pays a fee only to those trustees who are not affiliated with Dodge & Cox.
Share ownership At June 30, 2023, Dodge & Cox and its executive officers owned 16% of the Fund’s outstanding shares.
Note 5: Income Tax Information and Distributions to Shareholders
A provision for federal income taxes is not required since the Fund intends to qualify as a regulated investment company under Subchapter M of the Internal Revenue Code and distribute all of its taxable income to shareholders. Distributions are determined in accordance with income tax regulations, and such amounts may differ from net investment income and realized gains for financial reporting purposes. The Fund may also designate a portion of the amount paid to redeeming shareholders as a distribution for tax purposes. Financial reporting records are adjusted for permanent book to tax differences at year end to reflect tax character. Book to tax differences are primarily due to differing treatments of wash sales, foreign currency realized gain (loss), foreign capital gains tax, passive foreign investment companies, certain corporate action transactions, derivatives, and distributions.
Distributions during the periods noted below were characterized as follows for federal income tax purposes:
| Six Months Ended
June 30, 2023 | Year Ended
December 31, 2022 |
| | |
| | |
The components of distributable earnings on a tax basis are reported as of the Fund's most recent year end. At December 31, 2022, the tax basis components of distributable earnings were as follows:
Undistributed ordinary income | |
Capital loss carryforward1 | |
Net unrealized depreciation | |
Total distributable earnings | |
| Represents accumulated long-term capital loss as of December 31, 2022, which may be carried forward to offset future capital gains. |
At June 30, 2023, unrealized appreciation and depreciation for investments and derivatives based on cost for federal income tax purposes were as follows:
| |
| |
| |
Net unrealized appreciation | |
Fund management has reviewed the tax positions for open periods (three years and four years, respectively, from filing the Fund’s Federal and State tax returns) as applicable to the Fund, and has determined that no provision for income tax is required in the Fund’s financial statements.
Note 6: Loan Facilities
Pursuant to an exemptive order issued by the Securities and Exchange Commission (SEC), the Fund may participate in an interfund lending facility (Facility). The Facility allows the Fund to borrow money from or loan money to the Funds. Loans under the Facility are made for temporary or emergency purposes, such as to fund shareholder redemption requests. Interest on borrowings is the average of the current repurchase agreement rate and the bank loan rate. There was no activity in the Facility during the period.
All Funds in the Trust participate in a $500 million committed credit facility (Line of Credit) with State Street Bank and Trust Company, to be utilized for temporary or emergency purposes to fund shareholder redemptions or for other short-term liquidity purposes. The maximum amount available to the Fund is $250 million. Each Fund pays an annual commitment fee on its pro-rata portion of the Line of Credit. For the six months ended June 30, 2023, the Fund’s commitment fee amounted to $540 and is reflected as a Miscellaneous Expense in the Statement of Operations. Interest on borrowings is charged at the prevailing rate. There were no borrowings on the Line of Credit during the period.
Note 7: Purchases and Sales of Investments
For the six months ended June 30, 2023, purchases and sales of securities, other than short-term securities, aggregated $45,579,295 and $15,256,499, respectively.
Note 8: Subsequent Events
In July 2023, the Fund received a tender offer to purchase shares of Magnit PJSC, an illiquid Fund holding in Russia, in exchange for cash. The Fund tendered its shares for a price equivalent to 0.6% of Fund net assets. Fund management has determined that no other material
PAGE 15 ◾ Dodge & Cox Emerging Markets Stock Fund
Notes to Financial Statements (unaudited)
events or transactions occurred subsequent to June 30, 2023, and through the date of the Fund’s financial statements issuance, which require disclosure in the Fund’s financial statements.
Dodge & Cox Emerging Markets Stock Fund ◾ PAGE 16
Financial Highlights (unaudited)
Selected Data and Ratios
(for a share outstanding throughout each period) | | | Period from
May 11, 2021
(Inception) to
December 31, |
| | | |
Net asset value, beginning of period | | | |
Income from investment operations: | | | |
| | | |
Net realized and unrealized gain (loss) | | | |
Total from investment operations | | | |
Distributions to shareholders from: | | | |
| | | |
| | | |
| | | |
Net asset value, end of period | | | |
| | | |
Ratios/supplemental data: | | | |
Net assets, end of period (millions) | | | |
Ratio of expenses to average net assets | | | |
Ratio of expenses to average net assets, before reimbursement by investment manager | | | |
Ratio of net investment income to average net assets | | | |
| | | |
See accompanying Notes to Financial Statements
PAGE 17 ◾ Dodge & Cox Emerging Markets Stock Fund
Board Approval of Funds’ Investment Advisory Agreement and Investment Advisory Fees
(unaudited)
On June 1, 2023, the Board of Trustees (the “Board”) of the Dodge & Cox Funds (the “Trust”), including the members of the Board who are not “interested persons” of Dodge & Cox (as such term is defined in the Investment Company Act of 1940) (the “Independent Trustees”), voted to continue the Investment Advisory Agreement between Dodge & Cox and the Trust (the “Advisory Agreement”) in effect for an additional year beginning July 1, 2023 for each series of the Trust (each a “Fund”). Prior to the Board’s vote, the Trust’s Contract Review Committee, consisting solely of Independent Trustees, met with independent counsel to the Independent Trustees on May 8 and June 1, 2023, to discuss whether the Investment Advisory Agreement should be continued. At its June 1 meeting, the Board, including the Independent Trustees, concluded that the Investment Advisory Agreement is fair and reasonable. In considering the Investment Advisory Agreement, the Board, including the Independent Trustees, did not identify any single factor or particular information as all-important or controlling. In reaching the decision to continue the Investment Advisory Agreement in effect, the Board considered several factors, and reached the conclusions, described below:
Nature, Extent and Quality of Services Provided by Dodge & Cox
◾ The Board considered the nature, extent, and quality of the services provided by Dodge & Cox to each Fund under the Advisory Agreement. This consideration included, among other things, Dodge & Cox’s investment process and philosophy; the education and experience of the principal personnel of Dodge & Cox who provide such services; the other resources (including technology) that Dodge & Cox uses in managing the Funds’ portfolios; Dodge & Cox’s record of compliance with the Funds’ investment policies and restrictions and relevant regulatory and tax compliance requirements; and such matters as Dodge & Cox’s business continuity planning and insurance coverage.
◾ The Board concluded that the nature, extent, and quality of the services Dodge & Cox provides are consistent with the terms of the Advisory Agreement and support the recommendation to continue the Advisory Agreement in effect for the coming year.
◾ The Board also took note of the nature, extent, and quality of the broad range of services that Dodge & Cox provides to the Funds and their shareholders under a separate Administrative and Shareholder Services Agreement. Although that Agreement does not require Board approval on an annual basis, the services provided thereunder are an important part of the Funds’ overall relationship with Dodge & Cox, and the Board’s understanding and assessment of those services was a factor in its decision to recommend continuation of the Investment Advisory Agreement.
Investment Performance
◾ The Board reviewed information regarding the total return of each Fund over the most recent 1-, 3-, 5-, 10-, and 20-year periods (or since Fund inception, if shorter). The Board compared these returns to those of the Fund’s broad benchmark index and, for the Stock, International Stock, Global Stock, and Balanced Funds, to those of a relevant value-oriented index. The Board also considered the volatility of the Funds’ investment returns over various time horizons, including both volatility data provided by Broadridge Financial Solutions (“Broadridge”) and longer-term volatility measures presented by Dodge & Cox.
◾ In addition, the Board reviewed a report prepared by Broadridge comparing each Fund’s performance with the performance of other mutual funds in such Fund’s broad Morningstar category (as modified by Broadridge to include only those funds that have similar share class and expense characteristics to such Fund’s, the “Morningstar custom category”), as well as with the performance of a smaller peer group of comparable funds identified by Broadridge (such Fund’s “peer group”). The Board received information regarding the methodology and process underlying the construction of the Morningstar custom categories and peer groups, and any changes in the methodology from prior years. The Board also reviewed a report prepared by Dodge & Cox comparing each Fund’s performance to the composite performance of other accounts (if any) managed by Dodge & Cox using the same investment approach as the Fund. This information regarding the performance of other mutual funds and of other accounts managed by Dodge & Cox provided helpful context for the Board’s evaluation of the Funds’ performance.
◾ The Board concluded that the investment performance and volatility experienced by each Fund were consistent with Dodge & Cox’s long-term, research-driven, bottom-up, active investment style and support the recommendation to continue the Advisory Agreement in effect for an additional year.
Fees and Expense Ratios
◾ The Board reviewed a comparison prepared by Broadridge of the net expense ratio of each Fund (including the separate expense ratios of the two share classes of those Funds that have a dual class structure), and the various elements of those expense ratios, to those of mutual funds in (1) the Fund’s Morningstar custom category and (2) the Fund’s peer group.
◾ For each Fund for which such a comparison is relevant, the Board reviewed information regarding the fee rates Dodge & Cox charges for managing other accounts using the same investment approach as the Fund. The Board took note of the broader scope of services that Dodge & Cox provides to the Funds than to separate accounts and sub-advised funds, as well as differences in regulatory, litigation, and other risks associated with sponsoring a mutual fund as compared to managing separate accounts or sub-advising another
Dodge & Cox Emerging Markets Stock Fund ◾ PAGE 18
sponsor’s mutual fund, and certain characteristics of the market for institutional separate account management services.
◾ The Board concluded, after discussion and based on all the relevant information it received, that the advisory fee rate that each Fund pays to Dodge & Cox under the Advisory Agreement is reasonable in relation to the scope and quality of the services that Dodge & Cox provides to such Fund thereunder.
◾ In assessing the Funds’ expense ratios and the fees the Funds pay to Dodge & Cox, the Board took note of and discussed with Dodge & Cox changes over the past several years in the competitive landscape for asset management services. The Board anticipates further changes in the competitive landscape and will continue to monitor and assess the Funds’ competitive position.
Costs of Services Provided and Profits Realized by Dodge & Cox from its Relationship to the Funds
◾ Dodge & Cox informed the Board that it operates as a unified business, with most employees providing services to support the firm and its clients across multiple strategies and/or products. Consequently the firm does not utilize cost accounting to allocate expenses across lines of business or across the Funds for management purposes. Also, the firm is owned exclusively by its senior managers and other active employees, and generally distributes substantially all of its net revenues each year to its employees, either as compensation or as distributions with respect to the shares they own in the firm. Accordingly, it is difficult, and in the Board’s view not especially meaningful, to attempt to calculate a specific profit margin associated with Dodge & Cox’s relationship to any particular Fund.
◾ The Board believes that Dodge & Cox’s commitment to employee ownership of the firm enhances its ability to attract and retain key investment and other management professionals and reinforces a long-term perspective on the management of the firm and the Funds, which the Board believe aligns well with the interests of the Funds and their shareholders.
◾ The Board noted that the employee-shareholders of Dodge & Cox give up a substantial stock value (which would be taxed at long-term capital gains rates) as a consequence of the firm’s independence from outside ownership; the estimated market value of the company is substantially in excess of its book value.
◾ The Board also considered that Dodge & Cox’s fee revenues from the Funds fluctuate from year to year based on changes in the aggregate net assets of the Funds, and that the firm has continued to invest in improved systems, additional compliance resources, and enhanced research capabilities despite these fluctuations.
◾ The Board concluded that Dodge & Cox’s profits are a keystone of its independence, stability, and long-term investment performance.
Economies and Benefits of Scale
◾ The Board considered whether there have been economies or benefits of scale as the Funds have grown over the longer term, and whether fee levels reflect economies of scale for the benefit of Fund investors. In the Board’s view any consideration of economies of scale must take account of the relatively low overall fee and expense structure of the Funds. The Funds generally rank favorably when compared to their Broadridge custom categories and peer groups, on a net expense ratio basis.
◾ Dodge & Cox has built economies of scale into its fee structure by charging relatively low fees at the beginning of operations. A comparison of the Funds’ advisory fee rates to those of many otherwise comparable funds that employ fee “breakpoints” shows that the Funds’ advisory fee rates are in general relatively lower from the first dollar. As a result of their straightforward share class and fee structure and relatively low total expenses, the Funds provide small investors with access to professional, active portfolio management and related services at a reasonable cost. In addition to building economies of scale into its fee rates from the first dollar of each Fund’s assets, Dodge & Cox has capped the expenses borne by certain Funds in their early years of operations when those Funds are not yet operating at scale. The Global Bond Fund has benefited from such an expense cap since its inception in 2014, as has the Emerging Markets Stock Fund since its inception in 2021. Dodge & Cox has agreed to continue expense caps for those Funds, and for the X share class of each of the other Funds, through April 30, 2026.
◾ Over the years, Dodge & Cox has voluntarily forgone opportunities for growth in its assets under management and revenues in order to protect the Funds’ ability to achieve investment returns for shareholders. Dodge & Cox closed the International Stock Fund for a number of years beginning in 2015 and previously closed other Funds and limited the growth of its separate account business during periods of high growth--to Dodge & Cox’s economic detriment--and continues to closely monitor the size of the Funds.
◾ The Board also noted that Dodge & Cox has continued to make additional expenditures on staff and information technology to enable it to enhance its investment processes and to implement effectively the Funds’ strategies. The Board also considered that there may be certain diseconomies of scale associated with managing very large asset pools such as several of the Funds, insofar as certain of the costs or risks associated with managing the Funds potentially increase at a rate that exceeds the rate of asset growth.
PAGE 19 ◾ Dodge & Cox Emerging Markets Stock Fund
Fall-Out Benefits
◾ The Board concluded that “fall-out” benefits derived by Dodge & Cox from its relationship with the Funds are not a significant issue.
Fund Holdings
The Fund provides a complete list of its holdings on a quarterly basis by filing the lists with the SEC on Form N-CSR (as of the end of the second and fourth quarters) and on Part F of Form N-PORT (as of the end of the first and third quarters). Shareholders may view the Fund’s Forms N-CSR and Part F of N-PORT on the SEC’s website at sec.gov. A list of the Fund’s quarter-end holdings is also available at dodgeandcox.com on or about the 15th day following each quarter end and remains available on the website until the list is updated for the subsequent quarter.
Proxy Voting
For a free copy of the Fund’s proxy voting policies and procedures, please call 800-621-3979, visit the Fund’s website at dodgeandcox.com, or visit the SEC’s website at sec.gov. Information regarding how the Fund voted proxies relating to portfolio securities during the most recent 12-month period ended June 30 is also available at dodgeandcox.com or shareholders may view the Fund's Form N-PX at sec.gov.
Household Mailings
The Fund routinely mails shareholder reports and summary prospectuses to shareholders and, on occasion, proxy statements. In order to reduce the volume of mail, when possible, only one copy of these documents will be sent to shareholders who are part of the same family and share the same residential address.
If you have a direct account with the Funds and you do not want the mailing of shareholder reports and summary prospectuses combined with other members in your household, contact the Funds at 800-621-3979. Your request will be implemented within 30 days.
Dodge & Cox Emerging Markets Stock Fund ◾ PAGE 20
Emerging Markets Stock Fund
dodgeandcox.com
For Fund literature, transactions, and account
information, please visit the Funds’ website.
or write or call:
Dodge & Cox Funds
P.O. Box 219502
Kansas City, Missouri 64121-9502
(800) 621-3979
Investment Manager
Dodge & Cox
555 California Street, 40th Floor
San Francisco, California 94104
(415) 981-1710
Principal Underwriter
Foreside Fund Services, LLC
3 Canal Plaza, Suite 100
Portland, Maine 04101
(866) 251-6920
This report is submitted for the general information of the shareholders of the Fund. The report is not authorized for distribution to prospective investors in the Fund unless it is accompanied by a current prospectus.
This report reflects our views, opinions, and portfolio holdings as of June 30, 2023, the end of the reporting period. Any such views are subject to change at any time based upon market or other conditions and Dodge & Cox disclaims any responsibility to update such views. These views may not be relied on as investment advice and, because investment decisions for a Dodge & Cox Fund are based on numerous factors, may not be relied on as an indication of trading intent on behalf of any Dodge & Cox Fund.
Balanced Fund | Class I (dodbx) | Class X (doxbx)
ESTABLISHED 1931
06/23 BF SAR Printed on recycled paper 
To Our Shareholders (unaudited)
The Dodge & Cox Balanced Fund—Class I had a total return of 5.63% for the six-month period ended June 30, 2023, compared to a return of 10.81% for the Combined Index (a 60/40 blend of stocks and fixed income securities).1
Market Commentary
During the first half of 2023, U.S. equity markets rose, amid resilient economic growth, slowing inflation, and a pause in interest rate hikes by the Federal Reserve. U.S. equities, as measured by the S&P 500, returned 16.9%, while non-U.S. equities (MSCI EAFE Index2) had a total return of 11.7%.
Within U.S. equity markets, the Information Technology and Communication Services sectors—among the worst-performing sectors in 2022—drove the S&P 500’s performance in the first half of 2023, principally fueled by excitement about artificial intelligence. Conversely, Energy, the best-performing sector of 2022, was one of the worst-performing sectors during the past six months due to a decline in commodity prices. Market leadership was concentrated, with seven stocks in the S&P 500 accounting for 74% of the Index’s performance during the first half of 2023.3 After narrowing in 2022, the valuation disparity between U.S. value and growth stocks4 increased, as value stocks underperformed growth stocks by 23.9 percentage points.5
After one of the most challenging calendar years on record for fixed income investors, and despite continued volatility, the Bloomberg U.S. Agg returned 2.1%6 in first half of 2023, led by strong returns from the Credit sector. Amidst changing investor expectations regarding inflation, economic growth, and Fed policy, interest rates and credit spreads fluctuated significantly. Concerns about the health of regional banks sent U.S. Treasury yields sharply lower and pushed credit spreads wider in March, but these moves reversed in the second quarter as stress in the Banking sector eased and the economy showed resiliency (e.g., growth, labor).
After raising interest rates by a total of 75 basis points7 over the first five months of the year, the Fed held rates steady in June, partly to assess how 15 months of cumulative rate hikes have worked their way through the economy. Core PCE8, the Fed’s preferred inflation metric, rose 4.6% from a year earlier, a deceleration from the 40-year highs reached in early 2022, but still well above the central bank’s 2% target. As a result of continued inflation pressure, policymakers have signaled additional hikes are likely this year.
Investment Strategy
Asset Allocation
The Balanced Fund Investment Committee regularly assesses the appropriate asset allocation for the Fund, which is set based on our long-term outlook for both equity and fixed income securities. While we build the portfolio on a bottom-up basis, we deliberately review and manage risk exposures across the entire Fund, with an eye toward constructing a portfolio that can perform well across a variety of market environments. As of June 30, the Fund held 46.2% in U.S. equities, 16.5% in non-U.S. equities, and 35.0% in fixed income securities, which include preferred securities.9
Reflecting the improvement in fixed income yields and the return outlook over the past year, we increased the Fund’s allocation to fixed income to its highest level in recent years and reduced the net equity weight below the benchmark’s 60% weight. This reduction in net equity exposure was achieved, in part, through the use of S&P 500 futures, which enabled the Fund to maintain exposure to its carefully selected set of stocks, while reducing exposure to the overall equity market.
Equity
During the first half of 2023 and as a result of our value-oriented investment approach and focus on individual security selection, we increased the Fund’s equity exposure to companies that provide attractive dividends, trade at reasonable valuations, and operate in more stable sectors, including Health Care (e.g., CVS) and Utilities (e.g., Dominion Energy).10 Meanwhile, we reduced exposure to companies whose valuations increased, including Meta Platforms, General Electric, and FedEx. The Fund’s equity portfolio remains overweight the Financials, Health Care, and Communication Services sectors and underweight Consumer Staples, Real Estate, and Utilities.
U.S. Financials
The Financials sector has been a detractor from the Fund’s equity performance versus the S&P 500 Index in the first half of the year because of the Fund’s overweight position in this sector as well as the performance of specific holdings. In March, two U.S. regional banks not held in the Fund—Silicon Valley Bank and Signature Bank—collapsed and pressured Financials, particularly banks with weaker funding, sizable unrealized securities losses, and a greater concentration of customer deposits above the FDIC’s insurance threshold.
We do not believe the period of weakness affecting U.S. Financials signals broader systemic risk for the sector. The Fund’s Financials exposure is primarily concentrated in two types of institutions. The first type is global, systemically important banks that already comply with tougher regulatory standards than regional banks and will likely gain deposit market share from them (e.g., Bank of America, Wells Fargo). The second category is financial institutions focused on capital markets with relatively little credit risk exposure (e.g., Bank of New York Mellon, Charles Schwab, Goldman Sachs).
Current valuations for the Fund’s Financials equity holdings are unusually inexpensive on both an absolute and relative basis, suggesting a pessimistic market outlook. Recent and potential headwinds include changes in depositor behavior, tougher regulatory capital standards, and potential reductions in credit quality due to tightening financial conditions, particularly within commercial real estate. Nevertheless, we remain optimistic about the longer-term earnings capacity, margin resilience, and capital return potential for the Fund’s holdings. Rising interest rates have helped increase net interest income for the Fund’s bank holdings, and while rates may be volatile, we believe a significant portion of this higher revenue is sustainable. We continue to actively monitor the Financials sector and make portfolio decisions that incorporate our longer-term view of relative risk/reward opportunities.
PAGE 1 ◾ Dodge & Cox Balanced Fund
International Equity
As of June 30, international equities made up 16.5% of the Fund. Over the course of the last year, we increased the Fund’s international equity exposure by five percentage points. International stocks continue to be inexpensive relative to U.S. stocks: the MSCI EAFE trades at 13.0 times forward earnings compared to 20.1 times for the S&P 500. As value-oriented investors, we have found several opportunities to add attractively priced international companies to the portfolio (e.g., Fresenius Medical Care, Imperial Brands). These international investments also provide an important diversification benefit because their performance is generally less correlated with the other equity holdings in the Fund.
Fixed Income
Over the first half of the year, we adjusted fixed income portfolio positioning in response to changing relative valuations, particularly within the Credit sector (17%11 of the Fund), where we trimmed several holdings that had performed well and also selectively added to certain existing and new issuers. We continue to find Agency12 mortgage-back securities (MBS) exposure attractive, as shifting market dynamics have created compelling value. Finally, we continue to maintain the portfolio’s below-benchmark duration13 position.
The Credit Sector
Overall, we are optimistic about the long-term total return prospects for the portfolio’s credit holdings, which we curate through our rigorous credit underwriting process. We focus on downside scenarios, seeking to identify attractively priced issuers with strong fundamentals and the ability to navigate a range of economic environments. Reflecting our selectivity, the portfolio’s credit exposure has a higher yield premium and shorter duration than the broad credit market (represented by the U.S. Credit Index). This should help offset potential headwinds from future bouts of volatility due to uncertain Fed policy, persistent recession concerns, and ongoing geopolitical tensions.
While the Fund’s overall Credit weighting remained roughly unchanged in the first half of the year, we made several adjustments to the composition of holdings. We sold or trimmed several credit issuers that had performed well and were fully valued in our view. Meanwhile, we added to a number of existing holdings as well as initiated small positions in several new corporate issuers. For example, as concerns about the banking system caused corporate spread volatility in March through May, we initiated a position in Charles Schwab as well as added to a number of existing bank holdings (e.g., NatWest Group, Bank of America). In early June, we also started a position in American Electric Power, a large U.S. electric utility in which we purchased two-year bonds that we found attractive relative to other short-duration, high-quality investment alternatives.
The Securitized Sector
We view the Fund’s 15% weight in structured products as an important source of ballast in the portfolio, offering dependable liquidity, relatively low volatility, and attractive return prospects over our investment horizon.
For Agency MBS, which constitute the bulk of the Fund’s structured products exposure, the primary risk facing investors is prepayment risk (i.e., when, not if, an investor will be repaid). Rising interest rates over the past 18 months have pushed mortgage rates to near multi-decade highs, which disincentivized mortgage borrowers from refinancing, leading to low prepayment rates and high cash flow stability of Agency MBS investments. At the same time, valuations in this area have remained attractive due to Banking sector stress (including liquidations from failed banks), the Fed’s ongoing reduction of its MBS portfolio, and interest rate volatility.
Interest Rate and Inflation Risk
Managing interest rate and inflation risk is an important focus for the Investment Committee, as it can affect both the equity and fixed income segments of the Fund. While the Fed has made significant progress in reducing the rate of inflation, there remains significant uncertainty as to when inflation will return to more normalized levels. As such, we maintained a below-benchmark duration position. As an additional tool to hedge against inflation risk, we recently initiated a position in U.S. Treasury Inflation-Protected Securities.
In Closing
Despite recent underperformance relative to the benchmark, we are optimistic about the long-term outlook for the Fund. In our experience, elevated levels of market volatility and macroeconomic uncertainty can create significant opportunities for active, bottom-up managers like Dodge & Cox. Our decision-making process combines rigorous security analysis by our experienced team, with a strong price discipline and a long-term investment horizon.
Thank you for your continued confidence in Dodge & Cox. As always, we welcome your comments and questions.
For the Board of Trustees, | |
| |
Dana M. Emery,
Chair and President | |
July 31, 2023
| All returns are stated in U.S. dollars, unless otherwise noted. The Funds’ total returns include the reinvestment of dividend and capital gain distributions, but have not been adjusted for any income taxes payable by shareholders on these distributions or on Fund share redemptions. Index returns include dividend and/or interest income but, unlike Fund returns, do not reflect fees or expenses. The Combined Index reflects an unmanaged portfolio (rebalanced monthly) of 60% of the S&P 500 Index, which is a market capitalization-weighted index of 500 large capitalization stocks commonly used to represent the U.S. equity market, and 40% of the Bloomberg U.S. Aggregate Bond Index (Bloomberg U.S. Agg), which is a widely recognized, unmanaged index of U.S. dollar-denominated, investment-grade, taxable fixed income securities. The Fund may, however, invest up to 75% of its total assets in equity securities. |
| The MSCI EAFE (Europe, Australasia, Far East) Index is a broad-based, unmanaged equity market index aggregated from developed market country indices, excluding the United States and Canada. It covers approximately 85% of the free float-adjusted market capitalization in each country. |
| The top-seven contributors to the S&P 500’s absolute returns in the first half of 2023 were Apple, Microsoft, NVIDIA, Amazon, Alphabet, Meta Platforms, and Tesla |
Dodge & Cox Balanced Fund ◾ PAGE 2
| Generally, stocks that have lower valuations are considered “value” stocks, while those with higher valuations are considered “growth” stocks. |
| For the first half of 2023, the Russell 1000 Value Index had a total return of 5.12% compared to 29.02% for the Russell 1000 Growth Index. The Russell 1000 Value Index is a broad-based, unmanaged equity market index composed of those Russell 1000 companies with lower price-to-book ratios and lower forecasted growth values. The Russell 1000 Growth Index is a broad-based, unmanaged equity market index composed of those Russell 1000 companies with higher price-to-book ratios and higher forecasted growth values. |
| Return as calculated and reported by Bloomberg. |
| One basis point is equal to 1/100th of 1%. |
| Personal consumption expenditures (PCE) measure how much consumers spend on durable and non-durable goods and services. Core PCE prices exclude food and energy prices. |
| Unless otherwise specified, all weightings include accrued interest and weightings and characteristics are as of June 30, 2023. |
| The use of specific examples does not imply that they are more or less attractive investments than the portfolio’s other holdings. |
| Credit refers to corporate bonds and government-related securities, as classified by Bloomberg, as well as Rio Oil Finance Trust, an asset-backed security that we group as a credit investment. |
| The U.S. Government does not guarantee the Fund’s shares, yield, or net asset value. The agency guarantee (by, for example, Ginnie Mae, Fannie Mae, or Freddie Mac) does not eliminate market risk. |
| Duration is a measure of a bond’s (or a bond portfolio’s) price sensitivity to changes in interest rates. |
PAGE 3 ◾ Dodge & Cox Balanced Fund
Year-to-Date Performance Review for the Fund's Class I Shares (unaudited)
The Fund underperformed the Combined Index by 5.18 percentage year to date.
Equity Portfolio (vs. S&P 500)
Key contributors to relative results included the portfolio's:
◾ Industrials holdings, notably General Electric and FedEx.
Key detractors from relative results included the portfolio's:
◾ Information Technology holdings, including the underweight position in Microsoft and not owning Apple or NVIDIA;
◾ Financials overweight and holdings, particularly Charles Schwab and MetLife; and
◾ Energy holdings—especially Occidental Petroleum and Ovintiv—and overweight position.
Fixed Income Portfolio (vs. Bloomberg U.S. Agg)
Key contributors to relative results included the portfolio's:
◾ Credit issuer selection, particularly financial services holdings (e.g., Citigroup, JPMorgan, HSBC) as well as others (e.g., British American Tobacco, Charter Communications, TC Energy); and
◾ Overweight position in corporate bonds and underweight position in U.S. Treasuries.
There were no notable fixed income detractors during the
period.
Key Characteristics of Dodge & Cox
Independent Organization
Dodge & Cox is one of the largest privately owned investment managers in the world. We remain committed to independence, with a goal of providing the highest-quality investment management service to our existing clients.
Over 90 Years of Investment Experience
Dodge & Cox was founded in 1930. We have a stable and well- qualified team of investment professionals, most of whom have spent their entire careers at Dodge & Cox.
Experienced Investment Team
The Balanced Fund Investment Committee, which is the decision-making body for the Balanced Fund, is a seven-member committee with an average tenure of 17 years at Dodge & Cox.
One Business with a Single Decision-Making Office
Dodge & Cox manages equity (domestic, international, and global), fixed income (domestic and global), and balanced investments, all from one office in San Francisco.
Consistent Investment Approach
Our team decision-making process involves thorough, bottom-up fundamental analysis of each investment.
Long-Term Focus and Low Expenses
We invest with a three- to five-year investment horizon, which has historically resulted in low turnover relative to our peers. We manage Funds that maintain low expense ratios.
Risks: The Fund is subject to market risk, meaning holdings in the Fund may decline in value for extended periods due to the financial prospects of individual companies or due to general market and economic conditions. The Fund also invests in individual bonds whose yields and market values fluctuate, so that an investment may be worth more or less than its original cost. Debt securities are subject to interest rate risk, credit risk, and prepayment and call risk, all of which could have adverse effects on the value of the Fund. A low interest rate environment creates an elevated risk of future negative returns. Financial intermediaries may restrict their market making activities for certain debt securities, which may reduce the liquidity and increase the volatility of such securities. Please read the prospectus and summary prospectus for specific details regarding the Fund's risk profile.
Fund holdings and sector allocations are subject to change at any time and should not be considered recommendations to buy or sell any security. Please see the Portfolio of Investments section in this report for a complete list of fund holdings.
Dodge & Cox Balanced Fund ◾ PAGE 4
Growth of $10,000 Over 10 Years (unaudited)
For an Investment Made on June 30, 2013 
Average Annual Total Return
For Periods Ended June 30, 2023
| | | | |
Dodge & Cox Balanced Fund | | | | |
| | | | |
| | | | |
| | | | |
Bloomberg U.S. Aggregate Bond Index | | | | |
| | | | |
Expense Ratios
Per the Prospectus Dated May 1, 2023
| | |
Dodge & Cox Balanced Fund | | |
| | |
| | |
| The Class X shares inception date is May 2, 2022. The returns shown prior to that date are for the Class I shares. |
| The Combined Index reflects an unmanaged portfolio (rebalanced monthly) of 60% of the S&P 500 Index, which is a market capitalization-weighted index of 500 large capitalization stocks commonly used to represent the U.S. equity market, and 40% of the Bloomberg U.S. Aggregate Bond Index (Bloomberg U.S. Agg), which is a widely recognized, unmanaged index of U.S. dollar-denominated, investment-grade, taxable fixed income securities. The Fund may, however, invest up to 75% of its total assets in equity securities. |
| Dodge & Cox has contractually agreed to reimburse the Fund for all ordinary expenses to the extent necessary to maintain Total Annual Fund Operating Expenses of the Fund’s Class X shares at 0.42% until April 30, 2026. This agreement cannot be terminated prior to April 30, 2026 other than by resolution of the Fund’s Board of Trustees. For purposes of the foregoing, ordinary expenses shall not include nonrecurring shareholder account fees, fees and expenses associated with Fund shareholder meetings, fees on portfolio transactions such as exchange fees, dividends and interest on short positions, fees and expenses of pooled investment vehicles that are held by the Fund, interest expenses and other fees and expenses related to any borrowings, taxes, brokerage fees and commissions and other costs and expenses relating to the acquisition and disposition of Fund investments, other expenditures which are capitalized in accordance with generally accepted accounting principles, and other non-routine expenses or extraordinary expenses not incurred in the ordinary course of the Fund’s business, such as litigation expenses. The term of the agreement will automatically renew for subsequent three- year terms unless terminated with at least 30 days’ written notice by either party prior to the end of the then-current term. The agreement does not permit Dodge & Cox to recoup any fees waived or payments made to the Fund for a prior year. |
Returns represent past performance and do not guarantee future results. Investment return and share price will fluctuate with market conditions, and investors may have a gain or loss when shares are sold. Fund performance changes over time and currently may be significantly lower than stated. Performance is updated and published monthly. Visit the Fund’s website at dodgeandcox.com or call 800-621-3979 for current performance figures.
The Fund's total returns include the reinvestment of dividend and capital gain distributions, but have not been adjusted for any income taxes payable by shareholders on these distributions or on Fund share redemptions. Index returns include dividends and/or interest income but, unlike Fund returns, do not reflect fees or expenses.
S&P 500®is a trademark of S&P Global Inc. Bloomberg is a registered trademark of Bloomberg Finance L.P. and its affiliates.
For more information about these indices, visit:
www.dodgeandcox.com/balancedfund
PAGE 5 ◾ Dodge & Cox Balanced Fund
Portfolio Information (unaudited) June 30, 2023
Equity Sector Diversification | |
| |
| |
| |
| |
| |
| |
| |
| |
| |
| |
| |
Fixed Income Sector Diversification | |
| |
| |
| |
| |
| Net Cash & Other includes cash, short-term investments, derivatives, receivables, and payables. |
Fund Expense Example (unaudited)
As a Fund shareholder, you incur ongoing Fund costs, including management fees and other Fund expenses. All mutual funds have ongoing costs, sometimes referred to as operating expenses. The following example shows ongoing costs of investing in the Fund and can help you understand these costs and compare them with those of other mutual funds. The example assumes a $1,000 investment held for the six months indicated.
Actual Expenses
The first line of each share class in the table below provides information about actual account values and expenses based on the actual returns of the share class. You may use the information in this line, together with your account balance, to estimate the expenses that you paid over the period. Simply divide your account value by $1,000 (for example, an $8,600 account value divided by $1,000 = 8.6), then multiply the result by the number in the first line under the heading “Expenses Paid During Period” to estimate the expenses you paid on your account during this period.
Hypothetical Example for Comparison with Other Mutual Funds
Information on the second line of each share class in the table can help you compare ongoing costs of investing in the Fund with those of other mutual funds. This information may not be used to estimate the actual ending account balance or expenses you paid during the period. The hypothetical “Ending Account Value” is based on the actual expense ratio of the share class and an assumed 5% annual rate of return before expenses (not the actual return of the share class). The amount under the heading “Expenses Paid During Period” shows the hypothetical expenses your account would have incurred under this scenario. You can compare this figure with the 5% hypothetical examples that appear in shareholder reports of other mutual funds.
Six Months Ended
June 30, 2023 | Beginning Account Value
1/1/2023 | Ending Account Value
6/30/2023 | Expenses Paid
During Period* | |
| | | | |
| | | | |
Based on hypothetical 5% yearly return | | | | |
| | | | |
| | | | |
Based on hypothetical 5% yearly return | | | | |
| Expenses are equal to the annualized expense ratio, multiplied by the average account value over the period, multiplied by 181/365 (to reflect the one-half year period). |
The expenses shown in the table highlight ongoing costs only and do not reflect any transactional fees or account maintenance fees. Though other mutual funds may charge such fees, please note that the Fund does not charge transaction fees (e.g., redemption fees, sales loads) or universal account maintenance fees (e.g., small account fees).
Dodge & Cox Balanced Fund ◾ PAGE 6
Portfolio of Investments (unaudited) June 30, 2023
|
| | |
Communication Services: 6.6% |
Media & Entertainment: 5.9% |
Alphabet, Inc., Class A(a) | | |
Alphabet, Inc., Class C(a) | | |
Charter Communications, Inc., | | |
| | |
DISH Network Corp., Class A(a) | | |
| | |
| | |
Meta Platforms, Inc., Class A(a) | | |
| | |
| | |
Telecommunication Services: 0.7% |
| | |
| | |
Consumer Discretionary: 4.3% |
Automobiles & Components: 1.2% |
Honda Motor Co., Ltd. ADR (Japan) | | |
Consumer Discretionary Distribution & Retail: 2.6% |
Alibaba Group Holding, Ltd. ADR(a) (China) | | |
| | |
| | |
| | |
| | |
|
Booking Holdings, Inc.(a) | | |
| | |
|
Food, Beverage & Tobacco: 3.0% |
Anheuser-Busch InBev SA/NV ADR (Belgium) | | |
Imperial Brands PLC ADR (United Kingdom) | | |
Molson Coors Beverage Co., Class B | | |
| | |
Household & Personal Products: 0.5% |
Haleon PLC ADR (United Kingdom) | | |
| | |
|
Baker Hughes Co., Class A | | |
| | |
Occidental Petroleum Corp. | | |
Occidental Petroleum Corp., Warrant(a) | | |
| | |
The Williams Companies, Inc. | | |
| | |
|
|
Banco Santander SA(b) (Spain) | | |
| | |
BNP Paribas SA ADR (France) | | |
| | |
| | |
| | |
| | |
Financial Services: 10.6% |
Bank of New York Mellon Corp. | | |
|
| | |
Capital One Financial Corp. | | |
| | |
Fidelity National Information Services, Inc. | | |
| | |
Goldman Sachs Group, Inc. | | |
| | |
UBS Group AG, NY Shs (Switzerland) | | |
XP, Inc., Class A(a) (Brazil) | | |
| | |
|
Aegon NV, NY Shs (Netherlands) | | |
Brighthouse Financial, Inc.(a) | | |
| | |
| | |
| | |
| | |
|
Health Care Equipment & Services: 3.4% |
| | |
Fresenius Medical Care AG & Co. KGaA ADR (Germany) | | |
GE HealthCare Technologies, Inc. | | |
| | |
| | |
| | |
| | |
Pharmaceuticals, Biotechnology & Life Sciences: 9.5% |
Alnylam Pharmaceuticals, Inc.(a) | | |
| | |
BioMarin Pharmaceutical, Inc.(a) | | |
| | |
Elanco Animal Health, Inc.(a) | | |
| | |
GSK PLC ADR (United Kingdom) | | |
| | |
Novartis AG ADR (Switzerland) | | |
Regeneron Pharmaceuticals, Inc.(a) | | |
Roche Holding AG ADR (Switzerland) | | |
| | |
| | |
| | |
|
|
| | |
Johnson Controls International PLC | | |
Raytheon Technologies Corp. | | |
| | |
|
| | |
| | |
| | |
| | |
Information Technology: 6.2% |
Semiconductors & Semiconductor Equipment: 0.6% |
Microchip Technology, Inc. | | |
Software & Services: 3.5% |
Cognizant Technology Solutions Corp., Class A | | |
PAGE 7 ◾ Dodge & Cox Balanced FundSee accompanying Notes to Financial Statements
Portfolio of Investments (unaudited) June 30, 2023
Common Stocks (continued) |
| | |
| | |
| | |
| | |
Technology, Hardware & Equipment: 2.1% |
| | |
| | |
Dell Technologies, Inc., Class C | | |
| | |
| | |
| | |
| | |
| | |
|
| | |
LyondellBasell Industries NV, Class A | | |
| | |
Teck Resources, Ltd., Class B (Canada) | | |
| | |
|
Equity Real Estate Investment Trusts (Reits): 0.2% |
Gaming and Leisure Properties, Inc. REIT | | |
|
| | |
Total Common Stocks
(Cost $6,268,015,910) | | |
|
| | |
|
U.S. Treasury Inflation Indexed | | |
| | |
| | |
| | |
| | |
| | |
|
|
Petroleo Brasileiro SA (Brazil) | | |
| | |
| | |
Petroleos Mexicanos (Mexico) | | |
| | |
| | |
| | |
| | |
| | |
|
| | |
| | |
| | |
|
Colombia Government (Colombia) | | |
| | |
| | |
| | |
| | |
|
| | |
|
|
|
Small Business Admin. - 504 Program | | |
Series 2003-20J 1, 4.92%, 10/1/23 | | |
Series 2007-20F 1, 5.71%, 6/1/27 | | |
| | |
|
Rio Oil Finance Trust (Brazil) | | |
| | |
| | |
| | |
| | |
|
Navient Student Loan Trust | | |
| | |
+1.30%, 6.45%, 3/25/66(d) | | |
+0.80%, 5.95%, 7/26/66(d) | | |
+1.15%, 6.30%, 7/26/66(d) | | |
+1.05%, 6.20%, 12/27/66(d) | | |
+0.75%, 5.90%, 3/25/67(d) | | |
+1.00%, 6.15%, 2/27/68(d) | | |
+0.70%, 5.85%, 2/25/70(d) | | |
+0.55%, 0.70%, 2/25/70(d) | | |
| | |
| | |
| | |
| | |
| | |
+0.55%, 5.805%, 10/25/64(d) | | |
SMB Private Education Loan Trust (Private Loans) | | |
Series 2018-B A2A, 3.60%, | | |
Series 2023-A A1A, 5.38%, | | |
| | |
| | |
|
|
Freddie Mac Multifamily Interest Only | | |
Series K055 X1, 1.475%, 3/25/26(e) | | |
Series K056 X1, 1.375%, 5/25/26(e) | | |
Series K064 X1, 0.736%, 3/25/27(e) | | |
Series K065 X1, 0.805%, 4/25/27(e) | | |
Series K066 X1, 0.885%, 6/25/27(e) | | |
Series K069 X1, 0.474%, 9/25/27(e) | | |
Series K090 X1, 0.856%, 2/25/29(e) | | |
| | |
| | |
|
Federal Agency CMO & REMIC: 3.1% |
Dept. of Veterans Affairs | | |
Series 1995-1 1, 5.641%, 2/15/25(e) | | |
Series 1995-2C 3A, 8.793%, 6/15/25 | | |
Series 2002-1 2J, 6.50%, 8/15/31 | | |
| | |
Trust 2002-33 A1, 7.00%, 6/25/32 | | |
Trust 2009-30 AG, 6.50%, 5/25/39 | | |
Trust 2009-66 ET, 6.00%, 5/25/39 | | |
See accompanying Notes to Financial StatementsDodge & Cox Balanced Fund ◾ PAGE 8
Portfolio of Investments (unaudited) June 30, 2023
Debt Securities (continued) |
| | |
Trust 2001-T7 A1, 7.50%, 2/25/41 | | |
Trust 2001-T5 A3, 7.50%, 6/19/41(e) | | |
Trust 2001-T4 A1, 7.50%, 7/25/41 | | |
Trust 2001-T8 A1, 7.50%, 7/25/41 | | |
| | |
Trust 2001-T10 A2, 7.50%, 12/25/41 | | |
Trust 2013-106 MA, 4.00%, 2/25/42 | | |
Trust 2002-W6 2A1, 7.00%, | | |
Trust 2002-W8 A2, 7.00%, 6/25/42 | | |
Trust 2003-W2 1A2, 7.00%, 7/25/42 | | |
Trust 2003-W2 1A1, 6.50%, 7/25/42 | | |
Trust 2003-W4 4A, 5.637%, | | |
Trust 2012-121 NB, 7.00%, 11/25/42 | | |
Trust 2004-T1 1A2, 6.50%, 1/25/44 | | |
Trust 2004-W2 5A, 7.50%, 3/25/44 | | |
Trust 2004-W8 3A, 7.50%, 6/25/44 | | |
Trust 2005-W4 1A2, 6.50%, 8/25/45 | | |
Trust 2009-11 MP, 7.00%, 3/25/49 | | |
| | |
| | |
| | |
Series 16 PK, 7.00%, 8/25/23 | | |
Series T-48 1A4, 5.538%, 7/25/33 | | |
Series T-51 1A, 6.50%, 9/25/43(e) | | |
Series T-59 1A1, 6.50%, 10/25/43 | | |
Series 4281 BC, 4.50%, 12/15/43(e) | | |
Series 4384 DZ, 2.50%, 9/15/44 | | |
| | |
| | |
| | |
United States 30 Day Average SOFR | | |
+0.55%, Series 2022-H04 FG, 5.156%, 2/20/67 | | |
+0.80%, Series 2023-H05 FJ, 5.136%, 2/20/68 | | |
+0.41%, Series 2022-H06 FC, 3.761%, 8/20/68 | | |
+1.02%, Series 2023-H08 FE, 3.982%, 8/20/71 | | |
+1.00%, Series 2022-H20 FB, 4.048%, 8/20/71 | | |
+0.82%, Series 2022-H04 HF, 5.886%, 2/20/72 | | |
+0.67%, Series 2022-H09 FA, 5.736%, 4/20/72 | | |
+0.74%, Series 2022-H09 FC, 5.806%, 4/20/72 | | |
+0.97%, Series 2022-H11 EF, 6.036%, 5/20/72 | | |
| | |
| | |
| | |
| | |
| | |
| | |
| | |
| | |
| | |
|
| | |
| | |
| | |
| | |
| | |
| | |
Federal Agency Mortgage Pass-Through: 10.3% |
| | |
| | |
| | |
| | |
| | |
| | |
| | |
| | |
| | |
| | |
| | |
| | |
| | |
| | |
| | |
| | |
| | |
| | |
| | |
| | |
| | |
| | |
| | |
| | |
| | |
| | |
| | |
| | |
| | |
| | |
4.03%, 11/1/40 - 12/1/40(e) | | |
| | |
| | |
3.85%, 11/1/44 - 12/1/44(e) | | |
| | |
| | |
| | |
| | |
| | |
| | |
| | |
| | |
| | |
| | |
| | |
| | |
| | |
| | |
| | |
| | |
| | |
| | |
| | |
| | |
| | |
| | |
| | |
| | |
PAGE 9 ◾ Dodge & Cox Balanced FundSee accompanying Notes to Financial Statements
Portfolio of Investments (unaudited) June 30, 2023
Debt Securities (continued) |
| | |
| | |
| | |
| | |
| | |
| | |
| | |
| | |
| | |
| | |
| | |
| | |
| | |
Freddie Mac Gold, 15 Year | | |
| | |
Freddie Mac Gold, 20 Year | | |
| | |
| | |
Freddie Mac Gold, 30 Year | | |
| | |
| | |
| | |
| | |
| | |
Freddie Mac Pool, 20 Year | | |
| | |
Freddie Mac Pool, 30 Year | | |
| | |
| | |
| | |
| | |
| | |
7.50%, 11/15/24 - 10/15/25 | | |
| | |
| | |
| | |
|
|
| | |
| | |
| | |
| | |
| | |
| | |
| | |
Barclays PLC (United Kingdom) | | |
| | |
| | |
| | |
| | |
| | |
| | |
| | |
| | |
| | |
| | |
| | |
| | |
| | |
| | |
| | |
Capital One Financial Corp. | | |
| | |
| | |
| | |
|
| | |
| | |
| | |
| | |
| | |
| | |
| | |
| | |
| | |
| | |
| | |
| | |
+6.37%, 11.643%, 10/30/40(f) | | |
Goldman Sachs Group, Inc. | | |
| | |
HSBC Holdings PLC (United Kingdom) | | |
| | |
| | |
| | |
| | |
| | |
| | |
| | |
| | |
| | |
| | |
| | |
| | |
| | |
| | |
Lloyds Banking Group PLC (United Kingdom) | | |
| | |
| | |
| | |
NatWest Group PLC (United Kingdom) | | |
| | |
| | |
| | |
UBS Group AG (Switzerland) | | |
| | |
| | |
| | |
| | |
| | |
| | |
| | |
| | |
| | |
| | |
| | |
| | |
| | |
|
| | |
| | |
| | |
| | |
| | |
| | |
| | |
| | |
| | |
| | |
See accompanying Notes to Financial StatementsDodge & Cox Balanced Fund ◾ PAGE 10
Portfolio of Investments (unaudited) June 30, 2023
Debt Securities (continued) |
| | |
British American Tobacco PLC (United Kingdom) | | |
| | |
| | |
| | |
| | |
| | |
| | |
Burlington Northern Santa Fe LLC(j) | | |
| | |
| | |
| | |
| | |
| | |
| | |
Charter Communications, Inc. | | |
| | |
| | |
| | |
| | |
| | |
| | |
| | |
| | |
| | |
| | |
| | |
| | |
| | |
| | |
| | |
| | |
| | |
| | |
| | |
| | |
| | |
| | |
| | |
| | |
Elanco Animal Health, Inc. | | |
| | |
| | |
| | |
| | |
| | |
| | |
| | |
Ford Motor Credit Co. LLC(j) | | |
| | |
| | |
| | |
| | |
| | |
| | |
| | |
| | |
| | |
| | |
| | |
GE HealthCare Technologies, Inc. | | |
| | |
| | |
| | |
|
| | |
| | |
| | |
| | |
Imperial Brands PLC (United Kingdom) | | |
| | |
| | |
| | |
| | |
| | |
| | |
| | |
| | |
| | |
| | |
| | |
Microchip Technology, Inc. | | |
| | |
Occidental Petroleum Corp. | | |
| | |
| | |
| | |
| | |
| | |
Philip Morris International, Inc. | | |
| | |
| | |
| | |
| | |
| | |
| | |
| | |
| | |
| | |
| | |
| | |
| | |
| | |
| | |
| | |
Telecom Italia SPA (Italy) | | |
| | |
| | |
| | |
| | |
| | |
| | |
The Williams Companies, Inc. | | |
| | |
| | |
| | |
| | |
| | |
| | |
| | |
| | |
Ultrapar Participacoes SA (Brazil) | | |
| | |
| | |
| | |
| | |
Verizon Communications, Inc. | | |
| | |
| | |
| | |
PAGE 11 ◾ Dodge & Cox Balanced FundSee accompanying Notes to Financial Statements
Portfolio of Investments (unaudited) June 30, 2023
Debt Securities (continued) |
| | |
| | |
| | |
| | |
Vodafone Group PLC (United Kingdom) | | |
| | |
| | |
|
American Electric Power Co., Inc | | |
| | |
| | |
| | |
| | |
| | |
| | |
| | |
| | |
| | |
| | |
| | |
| | |
| | |
| | |
| | |
| | |
| | |
| | |
| | |
| | |
Total Debt Securities
(Cost $4,979,454,039) | |
Short-Term Investments: 3.1% |
| | |
Repurchase Agreements: 2.7% |
Fixed Income Clearing Corporation(k) 5.04%, dated 6/30/23, due 7/3/23, maturity value $335,140,700 | | |
Fixed Income Clearing Corporation(k) 2.45%, dated 6/30/23, due 7/3/23, maturity value $35,450,236 | | |
| | |
|
State Street Institutional U.S. Government Money Market Fund - Premier Class | | |
Total Short-Term Investments
(Cost $424,675,395) | |
Total Investments In Securities
(Cost $11,672,145,344) | | |
Other Assets Less Liabilities | | |
| | |
| |
| The security is issued in Euro currency. |
| |
| Security exempt from registration under Rule 144A of the Securities Act of 1933. The security may be resold in transactions exempt from registration, normally to qualified institutional buyers. |
| Variable rate security: interest rate is determined by the interest rates of underlying pool of assets that collateralize the security. The interest rate of the security may change due to a change in the interest rates or the composition of underlying pool of assets. The interest rate shown is the rate as of period end. |
| Hybrid security: characteristics of both a debt and equity security. |
| Perpetual security: no stated maturity date. |
| Variable rate security: fixed-to-float security pays an initial fixed interest rate and will pay a floating interest rate established at a predetermined time in the future. The interest rate shown is the rate as of period end. |
| Security exempt from registration pursuant to Regulation S under the Securities Act of 1933, as amended. Regulation S securities are subject to restrictions on resale in the United States. |
| Subsidiary. Security may be issued by parent company or one of its subsidiaries. (see below) |
| Repurchase agreement is collateralized by U.S. Treasury Notes 3.50%-4.25%, 10/15/23-2/15/33. U.S. Treasury Inflation Indexed Notes 1.125%, 1/15/33. Total collateral value is $377,851,963. |
| |
| The Fund usually classifies a company or issuer based on its country of risk, but may designate a different country in certain circumstances. |
| Debt securities are grouped by parent company unless otherwise noted. Actual securities may be issued by the listed parent company or one of its subsidiaries. |
| Debt securities with floating interest rates are linked to the referenced benchmark; the interest rate shown is the rate as of period end. |
ADR: American Depositary Receipt |
ARM: Adjustable Rate Mortgage |
CMBS: Commercial Mortgage-Backed Security |
CMO: Collateralized Mortgage Obligation |
|
NY Shs: New York Registry Shares |
REMIC: Real Estate Mortgage Investment Conduit |
SOFR: Secured Overnight Financing Rate |
See accompanying Notes to Financial StatementsDodge & Cox Balanced Fund ◾ PAGE 12
Portfolio of Investments (unaudited) June 30, 2023
Futures Contracts
| | | | Value /
Unrealized
Appreciation/
(Depreciation) |
E-Mini S&P 500 Index— Short Position | | | | |
Euro-Bund Future— Short Position | | | | |
Ultra 10 Year U.S. Treasury Note Future— Short Position | | | | |
| | | | |
Currency Forward Contracts
| | | | Unrealized Appreciation
(Depreciation) |
|
| | | | | | |
| | | | | | |
Unrealized gain on currency forward contracts | | | |
Unrealized loss on currency forward contracts | | | |
Net unrealized loss on currency forward contracts | | | | |
The listed counterparty may be the parent company or one of its subsidiaries.
PAGE 13 ◾ Dodge & Cox Balanced FundSee accompanying Notes to Financial Statements
Statement of Assets and Liabilities (unaudited)
| |
|
Investments in securities, at value (cost $11,672,145,344) | |
Deposits with broker for currency forward contracts | |
| |
Deposits with broker for futures contracts | |
Receivable for investments sold | |
Receivable for Fund shares sold | |
Dividends and interest receivable | |
Expense reimbursement receivable | |
Prepaid expenses and other assets | |
| |
|
Unrealized depreciation on currency forward contracts | |
Payable for variation margin for futures contracts | |
Payable for investments purchased | |
Payable for Fund shares redeemed | |
| |
| |
| |
| |
|
| |
| |
| |
|
| |
Shares outstanding (par value $0.01 each, unlimited shares authorized) | |
Net asset value per share | |
|
| |
Shares outstanding (par value $0.01 each, unlimited shares authorized) | |
Net asset value per share | |
Statement of Operations (unaudited)
| Six Months Ended
June 30, 2023 |
| |
Dividends (net of foreign taxes of $6,884,797) | |
| |
| |
| |
| |
Administrative services fees | |
| |
| |
Custody and fund accounting fees | |
| |
| |
| |
| |
| |
| |
Expenses reimbursed by investment manager | |
| |
| |
Realized and Unrealized Gain (Loss): | |
| |
Investments in securities (Note 6) | |
| |
| |
Currency forward contracts | |
Foreign currency transactions | |
Net change in unrealized appreciation/depreciation | |
Investments in securities | |
| |
| |
Currency forward contracts | |
Foreign currency translation | |
Net realized and unrealized gain | |
Net Change in Net Assets From Operations | |
See accompanying Notes to Financial StatementsDodge & Cox Balanced Fund ◾ PAGE 14
Statement of Changes in Net Assets (unaudited)
| | |
| | |
| | |
| | |
| | |
Net change in unrealized appreciation/depreciation | | |
| | |
Distributions to Shareholders: | | |
| | |
| | |
| | |
| | |
| | |
Proceeds from sales of shares | | |
Reinvestment of distributions | | |
| | |
| | |
Proceeds from sales of shares | | |
Reinvestment of distributions | | |
| | |
Net change from Fund share transactions | | |
Total change in net assets | | |
| | |
| | |
| | |
| | |
| | |
| | |
| | |
| | |
Net change in shares outstanding | | |
| | |
| | |
| | |
| | |
Net change in shares outstanding | | |
PAGE 15 ◾ Dodge & Cox Balanced FundSee accompanying Notes to Financial Statements
Notes to Financial Statements (unaudited)
Note 1: Organization and Significant Accounting Policies
Dodge & Cox Balanced Fund (the “Fund”) is one of the series constituting the Dodge & Cox Funds (the “Trust” or the “Funds”). The Trust is organized as a Delaware statutory trust and is registered under the Investment Company Act of 1940, as amended, as an open-end management investment company. The Fund commenced operations on June 26, 1931, and seeks regular income, conservation of principal, and an opportunity for long-term growth of principal and income. Risk considerations and investment strategies of the Fund are discussed in the Fund’s Prospectus.
On May 1, 2022, the then-outstanding shares of the Fund were redesignated as Class I Shares, and Class X shares of the Fund were established. The share classes have different eligibility requirements and expense structures due to differing shareholder servicing arrangements. The share classes have the same rights as to redemption, dividends and liquidation proceeds, and voting privileges, except that each class has the exclusive right to vote on matters affecting only its class.
The Fund is an investment company and follows the accounting and reporting guidance issued in Topic 946 by the Financial Accounting Standards Board. The financial statements have been prepared in conformity with accounting principles generally accepted in the United States of America, which require the use of estimates and assumptions by management. Actual results may differ from those estimates. Significant accounting policies are as follows:
Security valuation The Fund’s net assets are normally valued as of the scheduled close of trading on the New York Stock Exchange (NYSE), generally 4 p.m. Eastern Time, each day that the NYSE is open for business.
Portfolio holdings for which market quotes are readily available are valued at market value. Listed securities, for example, are generally valued using the official quoted close price or the last sale on the exchange that is determined to be the primary market for the security.
Debt securities, certain preferred stocks, equity-linked notes and derivatives traded over-the-counter are valued using prices received from independent pricing services which utilize dealer quotes, recent transaction data, pricing models, and other inputs to arrive at market-based valuations. Pricing models may consider quoted prices for similar securities, interest rates, cash flows (including prepayment speeds), and credit risk. Exchange-traded derivatives are valued at the settlement price determined by the relevant exchange. Short-term securities less than 60 days to maturity may be valued at amortized cost if amortized cost approximates current value. Mutual funds are valued at their respective net asset values. Security values are not discounted based on the size of the Fund’s position and may differ from the value a Fund receives upon sale of the securities.
Investments initially valued in currencies other than the U.S. dollar are converted to the U.S. dollar using prevailing exchange rates. Currency forward contracts are valued based on the prevailing forward exchange rates of the underlying currencies. As a result, the Fund’s net assets may be affected by changes in the value of currencies in relation to the U.S. dollar.
If market quotations are not readily available or if normal valuation procedures produce valuations that are deemed unreliable or
inappropriate under the circumstances existing at the time, the investment will be valued at fair value as determined in good faith by Dodge & Cox. The Board of Trustees has appointed Dodge & Cox, the Fund’s investment manager, as its "valuation designee", as permitted by Rule 2a-5 under the Investment Company Act of 1940, to make fair value determinations in accordance with the Dodge & Cox Funds Valuation Policies (“Valuation Policies”), subject to Board oversight. Dodge & Cox has established a Pricing Committee that is comprised of representatives from Treasury, Legal, Compliance, and Operations. The Pricing Committee is responsible for implementing the Valuation Policies, including determining the fair value of securities and other investments when necessary. The Pricing Committee considers relevant indications of value that are reasonably available to it in determining the fair value assigned to a particular security, such as the value of similar financial instruments, trading volumes, contractual restrictions on disposition, related corporate actions, and changes in economic conditions. In doing so, the Pricing Committee employs various methods for calibrating fair valuation approaches, including a regular review of key inputs and assumptions, back-testing, and review of any related market activity.
Valuing securities through a fair value determination involves greater reliance on judgment than valuation of securities based on readily available market quotations. In some instances, lack of information and uncertainty as to the significance of information may lead to a conclusion that a prior valuation is the best indication of a security’s value. When fair value pricing is employed, the prices of securities used by the Fund to calculate its net asset value may differ from quoted or published prices for the same securities.
Security transactions, investment income, expenses, and distributions Security transactions are recorded on the trade date. Realized gains and losses on securities sold are determined on the basis of identified cost.
Dividend income and corporate action transactions are recorded on the ex-dividend date, or when the Fund first learns of the dividend/corporate action if the ex-dividend date has passed. Non-cash dividends, if any, are recorded at the fair market value of the securities received. Dividends characterized as return of capital for U.S. tax purposes are recorded as a reduction of cost of investments and/or realized gain.
Interest income is recorded on the accrual basis. Interest income includes coupon interest, amortization of premium and accretion of discount on debt securities, and gain/loss on paydowns. The ability of the issuers of the debt securities held by the Fund to meet their obligations may be affected by economic developments in a specific industry, state, or region. Debt obligations may be placed on non-accrual status and related interest income may be reduced by ceasing current accruals and writing off interest receivables when the collection of all or a portion of interest has become doubtful. A debt obligation is removed from non-accrual status when the issuer resumes interest payments or when collectibility of interest is reasonably assured.
Expenses are recorded on the accrual basis. Some expenses of the Trust can be directly attributed to a specific series. Expenses
Dodge & Cox Balanced Fund ◾ PAGE 16
Notes to Financial Statements (unaudited)
which cannot be directly attributed are allocated among the Funds in the Trust using methodologies determined by the nature of the expense.
Distributions to shareholders are recorded on the ex-dividend date.
Share class accounting Investment income, realized and unrealized gains and losses and expenses, other than class-specific expenses, are allocated to each share class of the Fund based upon the proportion of net assets of each class.
Foreign taxes The Fund may be subject to foreign taxes which may be imposed by certain countries in which the Fund invests. The Fund endeavors to record foreign taxes based on applicable foreign tax law. Withholding taxes are incurred on certain foreign dividends and are accrued at the time the associated dividend is recorded. The Fund files withholding tax reclaims in certain jurisdictions to recover a portion of amounts previously withheld. The Fund records a reclaim receivable based on, among other things, a jurisdiction’s legal obligation to pay reclaims as well as payment history and market convention. In consideration of recent decisions rendered by European courts, the Fund has filed for additional reclaims ("EU reclaims") related to prior years. A corresponding receivable is established when both the amount is known and significant contingencies or uncertainties regarding collectability are removed. These amounts, if any, are reported in dividends and interest receivable in the Statement of Assets and Liabilities. Expenses incurred related to filing EU reclaims are recorded on the accrual basis in professional services in the Statement of Operations. Expenses that are contingent upon successful EU reclaims are recorded in professional services in the Statement of Operations once the amount is known.
Repurchase agreements Repurchase agreements are transactions under which a Fund purchases a security from a counterparty and agrees to resell the security to that counterparty on a specified future date at the same price, plus a specified interest rate. The Fund’s repurchase agreements are secured by U.S. government or agency securities. It is the Fund’s policy that its regular custodian or third party custodian take possession of the underlying collateral securities, the fair value of which exceeds the principal amount of the repurchase transaction, including accrued interest, at all times. In the event of default by the counterparty, the Fund has the contractual right to liquidate the collateral securities and to apply the proceeds in satisfaction of the obligation.
Equity-linked note An equity-linked note is a structured security with a return linked to one or more underlying reference equity securities. Changes in the market value of equity-linked notes are recorded as unrealized appreciation or depreciation and realized gains or losses are recorded upon the sale or maturity of the notes in the Statement of Operations within investments in securities. The risks of investing in equity-linked notes include unfavorable price movements in the underlying securities and the credit risk of the issuing financial institution. Equity-linked notes may be more volatile and less liquid than other investments held by the Fund.
To-Be-Announced securities The Fund may purchase mortgage-related securities on a to-be-announced (“TBA”) basis at a fixed price, with payment and delivery on a scheduled future date
beyond the customary settlement period for such securities. The Fund may choose to extend the settlement through a “dollar roll” transaction in which it sells the mortgage-related securities to a dealer and simultaneously agrees to purchase similar securities for future delivery at a predetermined price. The Fund accounts for TBA dollar rolls as purchase and sale transactions.
The Fund may also enter into a Master Securities Forward Transaction Agreement ("MSFTA") with a counterparty to govern transactions of delayed delivery securities, including TBA securities. The MSFTA provides for collateralization requirements and the right to offset amounts due to or from counterparties under specified conditions.
Indemnification Under the Trust’s organizational documents, its officers and trustees are indemnified against certain liabilities arising out of the performance of their duties to the Trust. In addition, in the normal course of business the Trust enters into contracts that provide general indemnities to other parties. The Trust’s maximum exposure under these arrangements is unknown, as this would involve future claims that may be made against the Trust that have not yet occurred.
Note 2: Valuation Measurements
Various inputs are used in determining the value of the Fund’s investments. These inputs are summarized in the three broad levels below.
◾ Level 1: Unadjusted quoted prices in active markets for identical securities
◾ Level 2: Other significant observable inputs (including quoted prices for similar securities, market indices, interest rates, credit risk, forward exchange rates, etc.)
◾ Level 3: Significant unobservable inputs (including Fund management’s assumptions in determining the fair value of investments)
The inputs or methodology used for valuing securities are not necessarily an indication of the risk associated with investing in those securities.
The following is a summary of the inputs used to value the Fund’s holdings at June 30, 2023:
| | LEVEL 2
(Other Significant
Observable Inputs) |
|
|
| | |
| | |
| | |
| | |
| | |
| | |
| | |
| | |
| | |
| | |
| | |
|
| | |
| | |
PAGE 17 ◾ Dodge & Cox Balanced Fund
Notes to Financial Statements (unaudited)
| | LEVEL 2 (Other Significant Observable Inputs) |
| | |
| | |
|
| | |
| | |
| | |
|
|
| | |
| | |
Currency Forward Contracts |
| | |
Note 3: Derivative Instruments
The Fund may use derivatives either to minimize the impact of certain risks to one or more of its investments (as a ‘‘hedging technique’’) or to implement its investment strategy. A derivative is a financial instrument whose value is derived from a security, currency, interest rate, index, or other financial instrument.
Covered equity call options written In return for the payment of an upfront premium, the buyer of a an equity call option has the right (but not the obligation) to buy a referenced stock at a predetermined strike price or to receive a payment equal to the profit from buying at the strike price or selling at the market price. If the Fund writes an equity call option, it records the premium it receives as a liability in the Statement of Assets and Liabilities. The liability is adjusted daily to reflect the current market value of the option. If an option is exercised, the premium is added to the proceeds from the sale of the underlying reference stock in determining realized gain or loss. If an option expires unexercised, the premium received is treated as a realized gain. If an option is closed, the difference between the premium received and the cost of the closing transaction is treated as realized gain or loss. Changes in the value of an open equity call option written are recorded as unrealized appreciation or depreciation and any realized gains or losses are recorded at the closing or expiration of the option in the Statement of Operations.
If the Fund writes a covered equity call option, it foregoes the opportunity to gain from increases in the price of the underlying stock above the sum of the premium and the strike price, but retains the risk of loss should the price of the underlying stock decline.
The Fund wrote over-the-counter covered equity call options referencing single stocks in order to express its opinion about the future value of the stock.
Futures contracts Futures contracts involve an obligation to purchase or sell (depending on whether the Fund has entered a long or short futures contract, respectively) an asset at a future date, at a price set at the time the contract is purchased. Futures contracts are exchange-traded. Upon entering into a futures contract, the Fund is required to deposit an amount of cash or liquid assets (referred to as "initial margin") in a segregated account with the clearing broker to secure the Fund's obligation to perform. Initial margin is returned to the Fund when the futures contract is closed. Subsequent payments
(referred to as "variation margin") are made to or received from the clearing broker on a daily basis based on changes in the market value of the contract. Changes in the market value of open futures contracts are recorded as unrealized appreciation or depreciation in the Statement of Operations. Realized gains and losses on futures contracts are recorded in the Statement of Operations at the closing or expiration of the contracts. Cash deposited with a broker as initial margin is recorded in the Statement of Assets and Liabilities. A receivable and/or payable to brokers for daily variation margin is also recorded in the Statement of Assets and Liabilities.
Investments in futures contracts may include certain risks, which may be different from, and potentially greater than, those of the underlying securities. To the extent the Fund uses futures, it is exposed to additional volatility and potential losses resulting from leverage.
The Fund used short equity index futures contracts to reduce the exposure of the Fund’s equity allocation to a general downturn in the equity markets. The Fund used short government debt futures contracts to adjust the overall interest rate exposure and duration of the portfolio.
Currency forward contracts Currency forward contracts are agreements to purchase or sell a specific currency at a specified future date and price. Currency forward contracts are traded over-the-counter. The values of currency forward contracts change daily based on the prevailing forward exchange rates of the underlying currencies. Changes in the value of open contracts are recorded as unrealized appreciation or depreciation in the Statement of Operations. When a currency forward contract is closed, the Fund records a realized gain or loss in the Statement of Operations equal to the difference between the value at the time the contract was opened and the value at the time it was closed.
Losses from these transactions may arise from unfavorable changes in currency values or if a counterparty does not perform under a contract’s terms.
The Fund used currency forward contracts to hedge direct foreign currency exposure.
Additional derivative information The following identifies the location on the Statement of Assets and Liabilities and values of the Fund's derivative instruments categorized by primary underlying risk exposure.
| | | Foreign
Exchange
Derivatives | |
| | | | |
| | | | |
| | | | |
Unrealized depreciation on currency forward contracts | | | | |
| | | | |
| | | | |
Dodge & Cox Balanced Fund ◾ PAGE 18
Notes to Financial Statements (unaudited)
| Includes cumulative appreciation (depreciation). Only the current day’s variation margin is reported in the Statement of Assets and Liabilities. |
The following summarizes the effect of derivative instruments on the Statement of Operations, categorized by primary underlying risk exposure.
| | | Foreign
Exchange
Derivatives | |
|
| | | | |
| | | | |
| | | | |
| | | | |
Net change in unrealized appreciation/depreciation |
| | | | |
| | | | |
| | | | |
| | | | |
The following summarizes the range of volume in the Fund's derivative instruments during the six months ended June 30, 2023.
| | |
| | |
Currency forward contracts | | |
The Fund may enter into various over-the-counter derivative contracts governed by International Swaps and Derivatives Association master agreements (“ISDA agreements”). The Fund’s ISDA agreements, which are separately negotiated with each dealer counterparty, specify (i) events of default and other events permitting a party to terminate some or all of the contracts thereunder and (ii) the process by which those contracts will be valued for purposes of determining termination payments. If some or all of the contracts under a master agreement are terminated because of an event of default or similar event, the values of all terminated contracts must be netted to determine a single payment owed by one party to the other. To the extent amounts owed to the Fund by its counterparties are not collateralized, the Fund is at risk of those counterparties’ non-performance. The Fund attempts to mitigate counterparty credit risk by entering into contracts only with counterparties it believes to be of good credit quality, by exchanging collateral, and by monitoring the financial stability of those counterparties.
For financial reporting purposes, the Fund does not offset assets and liabilities that are subject to a master netting arrangement in the Statement of Assets and Liabilities.
The Fund’s ability to net assets and liabilities and to offset collateral pledged or received is based on contractual netting/offset
provisions in the ISDA agreements. The following table presents the Fund’s net exposure to each counterparty for derivatives that are subject to enforceable master netting arrangements as of June 30, 2023.
| Gross
Amount of
Recognized
Assets | Gross
Amount of
Recognized
Liabilities | | |
| | | | |
| | | | |
| | | | |
| Cash collateral pledged/(received) in excess of derivative assets/liabilities is not presented in this table. The total cash collateral is presented on the Fund's Statement of Assets and Liabilities. |
| Represents the net amount receivable from (payable to) the counterparty in the event of a default. |
Note 4: Related Party Transactions
Investment advisory fee The Fund pays an investment advisory fee monthly at an annual rate of 0.40% of the Fund’s average daily net assets to Dodge & Cox, investment manager of the Fund.
Administrative services fee The Fund pays Dodge & Cox a fee for administrative and shareholder services. The fee is accrued daily and paid monthly equal to an annual rate of the average daily net assets of 0.10% for Class I shares and 0.05% for Class X shares. Under this agreement, Dodge & Cox also pays for the Fund's transfer agent fees.
Expense reimbursement Through April 30, 2023, Dodge & Cox contractually agreed to reimburse the Fund for all ordinary expenses to the extent necessary to maintain the ratio of total operating expenses of the Class X shares to average net assets of the Class X shares at 0.41%. Effective May 1, 2023, Dodge & Cox has contractually agreed to reimburse the Fund for all ordinary expenses to the extent necessary to maintain the ratio of total operating expenses of the Class X shares to average net assets of the Class X shares at 0.42% through April 30, 2026. The term of the agreement will automatically renew for subsequent three-year terms unless terminated with at least 30 days’ written notice by either party prior to the end of the then-current term. For the six months ended June 30, 2023, Dodge & Cox reimbursed expenses of $274,133.
Fund officers and trustees All officers and two of the trustees of the Trust are current or former senior executive officers of Dodge & Cox. The Trust pays a fee only to those trustees who are not affiliated with Dodge & Cox.
Note 5: Income Tax Information and Distributions to Shareholders
A provision for federal income taxes is not required since the Fund intends to continue to qualify as a regulated investment company under Subchapter M of the Internal Revenue Code and distribute all of its taxable income to shareholders. Distributions are determined in accordance with income tax regulations, and such amounts may differ from net investment income and realized gains for financial reporting purposes. The Fund may also designate a portion of the amount
PAGE 19 ◾ Dodge & Cox Balanced Fund
Notes to Financial Statements (unaudited)
paid to redeeming shareholders as a distribution for tax purposes. Financial reporting records are adjusted for permanent book to tax differences at year end to reflect tax character. Book to tax differences are primarily due to differing treatments of wash sales, foreign currency realized gain (loss), redemptions in-kind, certain corporate action transactions, derivatives, and distributions.
Distributions during the periods noted below were characterized as follows for federal income tax purposes:
| Six Months Ended
June 30, 2023 | Year Ended
December 31, 2022 |
| | |
| | |
| | |
| | |
| | |
| | |
The components of distributable earnings on a tax basis are reported as of the Fund's most recent year end. At December 31, 2022, the tax basis components of distributable earnings were as follows:
Undistributed long-term capital gain | |
Net unrealized appreciation | |
Total distributable earnings | |
At June 30, 2023, unrealized appreciation and depreciation for investments and derivatives based on cost for federal income tax purposes were as follows:
| |
| |
| |
Net unrealized appreciation | |
Fund management has reviewed the tax positions for open periods (three years and four years, respectively, from filing the Fund’s Federal and State tax returns) as applicable to the Fund, and has determined that no provision for income tax is required in the Fund’s financial statements.
Note 6: Redemptions In-Kind
During the six months ended June 30, 2023, the Fund distributed securities and cash as payment for redemptions of Class I shares. For financial reporting purposes, the Fund realized a net gain of $403,888,161 attributable to the redemptions in-kind. For tax purposes, no capital gain on the redemptions in-kind was recognized.
Note 7: Loan Facilities
Pursuant to an exemptive order issued by the Securities and Exchange Commission (SEC), the Fund may participate in an inter
fund lending facility (Facility). The Facility allows the Fund to borrow money from or loan money to the Funds. Loans under the Facility are made for temporary or emergency purposes, such as to fund shareholder redemption requests. Interest on borrowings is the average of the current repurchase agreement rate and the bank loan rate. There was no activity in the Facility during the period.
All Funds in the Trust participate in a $500 million committed credit facility (Line of Credit) with State Street Bank and Trust Company, to be utilized for temporary or emergency purposes to fund shareholder redemptions or for other short-term liquidity purposes. The maximum amount available to the Fund is $250 million. Each Fund pays an annual commitment fee on its pro-rata portion of the Line of Credit. For the six months ended June 30, 2023, the Fund’s commitment fee amounted to $40,231 and is reflected as a Miscellaneous Expense in the Statement of Operations. Interest on borrowings is charged at the prevailing rate. There were no borrowings on the Line of Credit during the period.
Note 8: Purchases and Sales of Investments
For the six months ended June 30, 2023, purchases and sales of securities, other than short-term securities and U.S. government securities, aggregated $1,252,834,001 and $1,516,784,099, respectively. For the six months ended June 30, 2023, purchases and sales of U.S. government securities aggregated $1,098,145,200 and $677,366,375, respectively.
Note 9: New Accounting Guidance
In March 2020, the Financial Accounting Standards Board (FASB) issued Accounting Standards Update (ASU) No. 2020-04, Reference Rate Reform (Topic 848) – Facilitation of the Effects of Reference Rate Reform on Financial Reporting. The amendments in the ASU provide optional temporary financial reporting relief from the effect of certain types of contract modifications due to the planned discontinuation of the London Interbank Offered Rate and other interbank-offered based reference rates as of the end of 2021. The ASU is effective for certain reference rate-related contract modifications that occur during the period March 12, 2020 through December 31, 2022. In December 2022, the FASB issued ASU No. 2022-06, Reference Rate Reform (Topic 848) - Deferral of the Sunset Date of Topic 848, which extends the period through December 31, 2024. Management has reviewed the requirements and believes the adoption of these ASUs will not have a material impact on the financial statements.
Note 10: Subsequent Events
Fund management has determined that no material events or transactions occurred subsequent to June 30, 2023, and through the date of the Fund’s financial statements issuance, which require disclosure in the Fund’s financial statements.
Dodge & Cox Balanced Fund ◾ PAGE 20
Financial Highlights (unaudited)
Selected data and ratios
(for a share outstanding throughout each period) | | |
| | | | | | |
| | | | | | |
Net asset value, beginning of period | | | | | | |
Income from investment operations: | | | | | | |
| | | | | | |
Net realized and unrealized gain (loss) | | | | | | |
Total from investment operations | | | | | | |
Distributions to shareholders from: | | | | | | |
| | | | | | |
| | | | | | |
| | | | | | |
Net asset value, end of period | | | | | | |
| | | | | | |
Ratios/supplemental data: | | | | | | |
Net assets, end of period (millions) | | | | | | |
Ratio of expenses to average net assets | | | | | | |
Ratio of net investment income to average net assets | | | | | | |
| | | | | | |
Portfolio turnover rate excluding TBA rolls(c) | | | | | | |
| | | | | | |
Net asset value, beginning of period | | | | | | |
Income from investment operations: | | | | | | |
| | | | | | |
Net realized and unrealized gain (loss) | | | | | | |
Total from investment operations | | | | | | |
Distributions to shareholders from: | | | | | | |
| | | | | | |
| | | | | | |
| | | | | | |
Net asset value, end of period | | | | | | |
| | | | | | |
Ratios/supplemental data: | | | | | | |
Net assets, end of period (millions) | | | | | | |
Ratio of expenses to average net assets | | | | | | |
Ratio of expenses to average net assets, before reimbursement by investment manager | | | | | | |
Ratio of net investment income to average net assets | | | | | | |
| | | | | | |
Portfolio turnover rate excluding TBA rolls(c) | | | | | | |
| Net investment income per share includes significant amounts received for EU reclaims related to prior years, which amounted to approximately $0.11 per share. Excluding such amounts, the ratio of net investment income to average net assets would have been 2.17%. |
| |
| See Note 1 regarding To-Be-Announced securities |
| For 2022, the period covers 5/2/2022 (commencement of operations) to 12/31/2022 |
See accompanying Notes to Financial Statements
PAGE 21 ◾ Dodge & Cox Balanced Fund
Board Approval of Funds’ Investment Advisory Agreement and Investment Advisory Fees
(unaudited)
On June 1, 2023, the Board of Trustees (the “Board”) of the Dodge & Cox Funds (the “Trust”), including the members of the Board who are not “interested persons” of Dodge & Cox (as such term is defined in the Investment Company Act of 1940) (the “Independent Trustees”), voted to continue the Investment Advisory Agreement between Dodge & Cox and the Trust (the “Advisory Agreement”) in effect for an additional year beginning July 1, 2023 for each series of the Trust (each a “Fund”). Prior to the Board’s vote, the Trust’s Contract Review Committee, consisting solely of Independent Trustees, met with independent counsel to the Independent Trustees on May 8 and June 1, 2023, to discuss whether the Investment Advisory Agreement should be continued. At its June 1 meeting, the Board, including the Independent Trustees, concluded that the Investment Advisory Agreement is fair and reasonable. In considering the Investment Advisory Agreement, the Board, including the Independent Trustees, did not identify any single factor or particular information as all-important or controlling. In reaching the decision to continue the Investment Advisory Agreement in effect, the Board considered several factors, and reached the conclusions, described below:
Nature, Extent and Quality of Services Provided by Dodge & Cox
◾ The Board considered the nature, extent, and quality of the services provided by Dodge & Cox to each Fund under the Advisory Agreement. This consideration included, among other things, Dodge & Cox’s investment process and philosophy; the education and experience of the principal personnel of Dodge & Cox who provide such services; the other resources (including technology) that Dodge & Cox uses in managing the Funds’ portfolios; Dodge & Cox’s record of compliance with the Funds’ investment policies and restrictions and relevant regulatory and tax compliance requirements; and such matters as Dodge & Cox’s business continuity planning and insurance coverage.
◾ The Board concluded that the nature, extent, and quality of the services Dodge & Cox provides are consistent with the terms of the Advisory Agreement and support the recommendation to continue the Advisory Agreement in effect for the coming year.
◾ The Board also took note of the nature, extent, and quality of the broad range of services that Dodge & Cox provides to the Funds and their shareholders under a separate Administrative and Shareholder Services Agreement. Although that Agreement does not require Board approval on an annual basis, the services provided thereunder are an important part of the Funds’ overall relationship with Dodge & Cox, and the Board’s understanding and assessment of those services was a factor in its decision to recommend continuation of the Investment Advisory Agreement.
Investment Performance
◾ The Board reviewed information regarding the total return of each Fund over the most recent 1-, 3-, 5-, 10-, and 20-year periods (or since Fund inception, if shorter). The Board compared these returns to those of the Fund’s broad benchmark index and, for the Stock, International Stock, Global Stock, and Balanced Funds, to those of a relevant value-oriented index. The Board also considered the volatility of the Funds’ investment returns over various time horizons, including both volatility data provided by Broadridge Financial Solutions (“Broadridge”) and longer-term volatility measures presented by Dodge & Cox.
◾ In addition, the Board reviewed a report prepared by Broadridge comparing each Fund’s performance with the performance of other mutual funds in such Fund’s broad Morningstar category (as modified by Broadridge to include only those funds that have similar share class and expense characteristics to such Fund’s, the “Morningstar custom category”), as well as with the performance of a smaller peer group of comparable funds identified by Broadridge (such Fund’s “peer group”). The Board received information regarding the methodology and process underlying the construction of the Morningstar custom categories and peer groups, and any changes in the methodology from prior years. The Board also reviewed a report prepared by Dodge & Cox comparing each Fund’s performance to the composite performance of other accounts (if any) managed by Dodge & Cox using the same investment approach as the Fund. This information regarding the performance of other mutual funds and of other accounts managed by Dodge & Cox provided helpful context for the Board’s evaluation of the Funds’ performance.
◾ The Board concluded that the investment performance and volatility experienced by each Fund were consistent with Dodge & Cox’s long-term, research-driven, bottom-up, active investment style and support the recommendation to continue the Advisory Agreement in effect for an additional year.
Fees and Expense Ratios
◾ The Board reviewed a comparison prepared by Broadridge of the net expense ratio of each Fund (including the separate expense ratios of the two share classes of those Funds that have a dual class structure), and the various elements of those expense ratios, to those of mutual funds in (1) the Fund’s Morningstar custom category and (2) the Fund’s peer group.
◾ For each Fund for which such a comparison is relevant, the Board reviewed information regarding the fee rates Dodge & Cox charges for managing other accounts using the same investment approach as the Fund. The Board took note of the broader scope of services that Dodge & Cox provides to the Funds than to separate accounts and sub-advised funds, as well as differences in regulatory, litigation, and other risks associated with sponsoring a mutual fund as compared to managing separate accounts or sub-advising another
Dodge & Cox Balanced Fund ◾ PAGE 22
sponsor’s mutual fund, and certain characteristics of the market for institutional separate account management services.
◾ The Board concluded, after discussion and based on all the relevant information it received, that the advisory fee rate that each Fund pays to Dodge & Cox under the Advisory Agreement is reasonable in relation to the scope and quality of the services that Dodge & Cox provides to such Fund thereunder.
◾ In assessing the Funds’ expense ratios and the fees the Funds pay to Dodge & Cox, the Board took note of and discussed with Dodge & Cox changes over the past several years in the competitive landscape for asset management services. The Board anticipates further changes in the competitive landscape and will continue to monitor and assess the Funds’ competitive position.
Costs of Services Provided and Profits Realized by Dodge & Cox from its Relationship to the Funds
◾ Dodge & Cox informed the Board that it operates as a unified business, with most employees providing services to support the firm and its clients across multiple strategies and/or products. Consequently the firm does not utilize cost accounting to allocate expenses across lines of business or across the Funds for management purposes. Also, the firm is owned exclusively by its senior managers and other active employees, and generally distributes substantially all of its net revenues each year to its employees, either as compensation or as distributions with respect to the shares they own in the firm. Accordingly, it is difficult, and in the Board’s view not especially meaningful, to attempt to calculate a specific profit margin associated with Dodge & Cox’s relationship to any particular Fund.
◾ The Board believes that Dodge & Cox’s commitment to employee ownership of the firm enhances its ability to attract and retain key investment and other management professionals and reinforces a long-term perspective on the management of the firm and the Funds, which the Board believe aligns well with the interests of the Funds and their shareholders.
◾ The Board noted that the employee-shareholders of Dodge & Cox give up a substantial stock value (which would be taxed at long-term capital gains rates) as a consequence of the firm’s independence from outside ownership; the estimated market value of the company is substantially in excess of its book value.
◾ The Board also considered that Dodge & Cox’s fee revenues from the Funds fluctuate from year to year based on changes in the aggregate net assets of the Funds, and that the firm has continued to invest in improved systems, additional compliance resources, and enhanced research capabilities despite these fluctuations.
◾ The Board concluded that Dodge & Cox’s profits are a keystone of its independence, stability, and long-term investment performance.
Economies and Benefits of Scale
◾ The Board considered whether there have been economies or benefits of scale as the Funds have grown over the longer term, and whether fee levels reflect economies of scale for the benefit of Fund investors. In the Board’s view any consideration of economies of scale must take account of the relatively low overall fee and expense structure of the Funds. The Funds generally rank favorably when compared to their Broadridge custom categories and peer groups, on a net expense ratio basis.
◾ Dodge & Cox has built economies of scale into its fee structure by charging relatively low fees at the beginning of operations. A comparison of the Funds’ advisory fee rates to those of many otherwise comparable funds that employ fee “breakpoints” shows that the Funds’ advisory fee rates are in general relatively lower from the first dollar. As a result of their straightforward share class and fee structure and relatively low total expenses, the Funds provide small investors with access to professional, active portfolio management and related services at a reasonable cost. In addition to building economies of scale into its fee rates from the first dollar of each Fund’s assets, Dodge & Cox has capped the expenses borne by certain Funds in their early years of operations when those Funds are not yet operating at scale. The Global Bond Fund has benefited from such an expense cap since its inception in 2014, as has the Emerging Markets Stock Fund since its inception in 2021. Dodge & Cox has agreed to continue expense caps for those Funds, and for the X share class of each of the other Funds, through April 30, 2026.
◾ Over the years, Dodge & Cox has voluntarily forgone opportunities for growth in its assets under management and revenues in order to protect the Funds’ ability to achieve investment returns for shareholders. Dodge & Cox closed the International Stock Fund for a number of years beginning in 2015 and previously closed other Funds and limited the growth of its separate account business during periods of high growth--to Dodge & Cox’s economic detriment--and continues to closely monitor the size of the Funds.
◾ The Board also noted that Dodge & Cox has continued to make additional expenditures on staff and information technology to enable it to enhance its investment processes and to implement effectively the Funds’ strategies. The Board also considered that there may be certain diseconomies of scale associated with managing very large asset pools such as several of the Funds, insofar as certain of the costs or risks associated with managing the Funds potentially increase at a rate that exceeds the rate of asset growth.
PAGE 23 ◾ Dodge & Cox Balanced Fund
Fall-Out Benefits
◾ The Board concluded that “fall-out” benefits derived by Dodge & Cox from its relationship with the Funds are not a significant issue.
Fund Holdings
The Fund provides a complete list of its holdings on a quarterly basis by filing the lists with the SEC on Form N-CSR (as of the end of the second and fourth quarters) and on Part F of Form N-PORT (as of the end of the first and third quarters). Shareholders may view the Fund’s Forms N-CSR and Part F of N-PORT on the SEC’s website at sec.gov. A list of the Fund’s quarter-end holdings is also available at dodgeandcox.com on or about the 15th day following each quarter end and remains available on the website until the list is updated for the subsequent quarter.
Proxy Voting
For a free copy of the Fund’s proxy voting policies and procedures, please call 800-621-3979, visit the Fund’s website at dodgeandcox.com, or visit the SEC’s website at sec.gov. Information regarding how the Fund voted proxies relating to portfolio securities during the most recent 12-month period ended June 30 is also available at dodgeandcox.com or shareholders may view the Fund's Form N-PX at sec.gov.
Household Mailings
The Fund routinely mails shareholder reports and summary prospectuses to shareholders and, on occasion, proxy statements. In order to reduce the volume of mail, when possible, only one copy of these documents will be sent to shareholders who are part of the same family and share the same residential address.
If you have a direct account with the Funds and you do not want the mailing of shareholder reports and summary prospectuses combined with other members in your household, contact the Funds at 800-621-3979. Your request will be implemented within 30 days.
Dodge & Cox Balanced Fund ◾ PAGE 24
dodgeandcox.com
For Fund literature, transactions, and account
information, please visit the Funds’ website.
or write or call:
Dodge & Cox Funds
P.O. Box 219502
Kansas City, Missouri 64121-9502
(800) 621-3979
Investment Manager
Dodge & Cox
555 California Street, 40th Floor
San Francisco, California 94104
(415) 981-1710
Principal Underwriter
Foreside Fund Services, LLC
3 Canal Plaza, Suite 100
Portland, Maine 04101
(866) 251-6920
This report is submitted for the general information of the shareholders of the Fund. The report is not authorized for distribution to prospective investors in the Fund unless it is accompanied by a current prospectus.
This report reflects our views, opinions, and portfolio holdings as of June 30, 2023, the end of the reporting period. Any such views are subject to change at any time based upon market or other conditions and Dodge & Cox disclaims any responsibility to update such views. These views may not be relied on as investment advice and, because investment decisions for a Dodge & Cox Fund are based on numerous factors, may not be relied on as an indication of trading intent on behalf of any Dodge & Cox Fund.
Income Fund | Class I (dodix) | Class X (doxix)
ESTABLISHED 1989
06/23 IF SAR Printed on recycled paper 
To Our Shareholders (unaudited)
The Dodge & Cox Income Fund—Class I had a total return of 3.21% for the six-month period ended June 30, 2023, compared to a return of 2.09% for the Bloomberg U.S. Aggregate Bond Index (Bloomberg U.S. Agg).1
Market Commentary
The first half of 2023 brought renewed bond market volatility amid changing investor expectations regarding inflation, economic growth, and Federal Reserve policy. Concerns about the health of regional banks sent U.S. Treasury yields sharply lower and credit spreads wider in March, but markets recovered in the second quarter as stress in the Banking sector eased. Investors then turned their attention to the resilient labor market and higher-than-expected inflation. Amid the volatility, the Credit sector performed particularly well, making it a leading contributor to the Bloomberg U.S. Agg’s 2.1% first-half return.
After raising the federal funds rate by a total of 75 basis points2 (bps) over the first five months of the year, the Fed held steady in June, partly to assess the cumulative impact of 15 months of significant rate hikes on the economy. Core PCE3, the Fed’s preferred inflation metric, rose 4.6% from a year earlier, a deceleration from the 40-year highs reached in early 2022, but still well above the central bank’s 2% target. As a result of continued inflation pressure, policymakers have signaled additional hikes are likely this year.
Despite higher interest rates, the U.S. economy expanded at a 2% annualized rate in the first quarter according to the Bureau of Economic Analysis, much faster than its previous estimate of 1.3%. The labor market remained robust as employers added 280,000 jobs per month on average over the first half of the year. Meanwhile, the unemployment rate hovered near historical lows.
For the first six months of the year, the investment-grade Corporate sector returned 3.2%4 and outperformed comparable-duration5 Treasuries by 1.6 percentage points as credit spreads narrowed despite intra-period volatility. The Agency6 mortgage-backed securities (MBS) sector returned 1.9% and modestly outperformed comparable-duration Treasuries.
Investment Strategy
After 2022, one of the most challenging calendar years on record for fixed income investors, the broad fixed income market delivered a positive return for the first half of 2023 despite ongoing volatility. Much of this result came from the tailwind provided by the highest bond yields in 15 years, which cushioned the negative effects of an assortment of troubling developments, including the failure of three significant U.S. regional banks, prolonged and contentious debt ceiling negotiations, and still-elevated inflation.
Over the first half of the year, we adjusted the Fund’s credit and interest rate exposures in response to changing relative valuations. We also made other modest adjustments in the portfolio, although it retains the same general themes. The Fund has sizeable exposures to credit7 securities (45%) and Agency MBS (40%), both of which represent meaningful overweight positions relative to the Bloomberg U.S. Agg.8 The Fund also features a small position in asset-backed securities (5%). The Fund’s weighting in U.S. Treasuries (8%) and net cash (1%) serves as “dry powder” that we can deploy as we uncover compelling investment opportunities in the future. We continue to position the Fund with a below-benchmark duration (5.2 years versus 6.3 for the Bloomberg U.S. Agg) and lower exposure to the long end of the yield curve.
We are excited about the prospects for fixed income as an asset class given the relatively high level of starting yields, and we are optimistic about our ability to add value through our actively managed investment approach.
The Credit Sector: Opportunistic Trims and Adds
Within the Credit sector, we sold or trimmed several corporate issuers that had performed well and reached full valuations. Examples include AbbVie, CVS, HSBC, and Oracle.9 Meanwhile, we added to a number of existing credit holdings and initiated small positions in four issuers: American Electric Power, Charles Schwab, Foundry JV Holdco, and UBS Group. On a net basis, these adjustments reduced the portfolio’s credit weighting by four percentage points.
Early in the year, we initiated a small position in senior (non-preferred) bonds issued by UBS Group. UBS has a diverse mix of market-leading high-return businesses, including a large and growing wealth management segment, domestic Swiss banking, and a de-risked capital markets operation. The Group runs its business with high capital ratios and substantial balance sheet liquidity. We later added slightly to the position upon news of its merger with Credit Suisse. In our view, UBS received favorable deal terms, including a low purchase price and downside protection from the Swiss government. Meanwhile, the merger created unique synergies and substantial market concentration in the Swiss banking business. While combining these entities introduces new hurdles for UBS, including increased organizational complexity, challenges in integrating Credit Suisse, and litigation, we believe the benefits outweigh the challenges from a credit perspective.
We are optimistic about the long-term total return prospects for the Fund’s credit holdings. Although broad credit market spreads (as represented by the U.S. Credit Index) narrowed over the first half of the year and are now in line with long-term averages, the Fund’s credit portfolio is substantially different from the market. Our rigorous credit underwriting process helps us identify attractively priced issuers with strong fundamentals that are able to navigate a range of economic environments. Reflecting our selectivity, the credit portfolio features 74 issuers (versus over 1,000 in the U.S. Credit Index). The Fund’s holdings have a higher yield premium (215 bps versus 114 bps) and a shorter duration (5.4 years versus 7.0 years). Future bouts of volatility are likely given uncertain Fed policy, persistent recession concerns, and ongoing geopolitical tensions. Wider credit spreads are certainly a risk given the Fund’s overweight positioning, but we believe the credit portfolio’s selectivity and yield cushion will add to total returns over time.
The Securitized Sector: Strong Fundamentals at Attractive Valuations
Rising interest rates over the past 18 months have pushed mortgage rates to near multi-decade highs of around 6.7% as of June 30. Virtually all existing mortgage borrowers lack financial incentives to refinance, leading to low prepayments and high cash flow stability on the Agency MBS which feature these loans. This is advantageous from a fundamental standpoint because the primary risk for which Agency MBS investors are paid is the timing and variability of cash flows from the underlying loans. At the same time, Agency MBS valuations have remained wide (and attractive) for more technical reasons: Banking sector stress, the Fed’s ongoing reduction of its MBS portfolio, and interest rate volatility. In addition, the FDIC
PAGE 1 ◾ Dodge & Cox Income Fund
takeover of Silicon Valley Bank and Signature Bank led to liquidations of over $50 billion of MBS, adding to supply and further pressuring MBS valuations. In short, the fundamentals and pricing of Agency mortgage bonds are attractive and have led us to maintain a sizable Agency MBS pass-through exposure in the Fund.
Within the Fund’s diversified set of Agency MBS, we continue to favor 30-year 2% and 2.5% coupon pass-through securities given their low prepayment risk and compelling valuations. The portfolio also holds Ginnie Mae-guaranteed Home Equity Conversion Mortgages (also known as reverse mortgages) and hybrid ARMs (adjustable-rate mortgages). These are two unique, out-of-benchmark, floating-rate securities that offer diversification benefits and trade at compelling valuations versus short duration alternatives. We are optimistic overall about the Fund’s Agency MBS holdings, which offer dependable liquidity, relatively low volatility (compared to credit securities), and attractive return prospects over our investment horizon.
The Fund also holds a small position in AAA-rated asset-backed securities (ABS). These are primarily FFELP Student Loan ABS, which are high-quality, short-duration structured products backed by 97% federally guaranteed student loans. Along with expectations for rising consumer debt and delinquencies, the expiration of the pandemic era forbearance program on student loans could further pressure repayment rates. But we believe the attractive spreads of the portfolio’s ABS holdings compensate for these risks and are further comforted by the high degree of federal government support on the underlying FFELP student loans.
Economic Outlook and Portfolio Duration: Balancing Risks in Light of Flat Yield Curve
The Fed’s interest rate hikes in the first half of the year brought the fed funds rate up to 5.25%, its highest level in over 15 years. Meanwhile, yield volatility has been remarkable, illustrated by the 2-year U.S. Treasury, which fluctuated between 3.8% and 5.1% over the first half of the year. These market events reflect the elevated inflation environment and resilient economy the Fed has been seeking to navigate.
Our investment team regularly produces long-term base, up, and down case economic scenarios. Currently, in our base case, we expect the Fed’s actions to achieve a relatively “soft landing” in which the economy avoids a deep recession. That said, we believe economic growth is most likely to slow meaningfully later this year, possibly into mild recession territory. In turn, inflation is likely to continue moderating, but not fall back to the Fed’s 2% target until at least 2024. In the interim, we expect the Fed to raise rates to 5.5% or slightly higher, pausing there until inflation trends consolidate convincingly toward target as the labor market loosens. Around these baseline views, the team has also considered alternative scenarios where inflation remains stickier (calling for higher rates) or growth weakens significantly more (calling for lower rates).
As of June 30, the Fund’s duration was 5.2 years (versus 6.3 years for the Bloomberg U.S. Agg), with a lower exposure to the long end of the yield curve. We trimmed duration by 0.25 years in March, following a sharp decline in interest rates. This shift was in contrast to
last year, when we lengthened portfolio duration amidst what was then a rising rate environment. This reflects our view that rates will remain relatively high given the resilience of the economy and stubbornness of inflation, which is likely to remain above target for some time despite considerable monetary tightening. Moreover, short- and intermediate-term yields are higher than long-term yields given the inverted yield curve. Combined with other portfolio considerations, including yield advantage and exposure to credit risk, we believe this duration positioning is prudent in the present context.
In Closing
Overall, we are optimistic about the Fund’s current portfolio and its long-term return prospects. Treasury yields are significantly higher than in years past, and we continue to find attractive opportunities to add value within the Credit and Securitized sectors. We believe the fixed income asset class continues to serve a vital role in many portfolios by providing investors with liquidity, current income, diversification, and, typically, low correlation to riskier asset classes over multi-year investment horizons.
Thank you for your continued confidence in Dodge & Cox. As always, we welcome your comments and questions.
For the Board of Trustees, | |
| |
Dana M. Emery,
Chair and President | |
July 31, 2023
| All returns are stated in U.S. dollars, unless otherwise noted. The Funds’ total returns include the reinvestment of dividend and capital gain distributions, but have not been adjusted for any income taxes payable by shareholders on these distributions or on Fund share redemptions. Index returns include dividend and/or interest income but, unlike Fund returns, do not reflect fees or expenses. The Bloomberg U.S. Aggregate Bond Index is a widely recognized, unmanaged index of U.S. dollar-denominated, investment-grade, taxable fixed income securities. |
| One basis point is equal to 1/100th of 1%. |
| Personal consumption expenditures (PCE) measure how much consumers spend on durable and non-durable goods and services. Core PCE prices exclude food and energy prices. |
| Return as calculated and reported by Bloomberg. |
| Duration is a measure of a bond’s (or a bond portfolio’s) price sensitivity to changes in interest rates. |
| The U.S. Government does not guarantee the Fund’s shares, yield, or net asset value. The agency guarantee (by, for example, Ginnie Mae, Fannie Mae, or Freddie Mac) does not eliminate market risk. |
| Credit refers to corporate bonds and government-related securities, as classified by Bloomberg, as well as Rio Oil Finance Trust, an asset-backed security that we group as a credit investment. |
| Unless otherwise specified, all weightings include accrued interest and weightings and characteristics are as of June 30, 2023. |
| The use of specific examples does not imply that they are more or less attractive investments than the portfolio’s other holdings. |
Dodge & Cox Income Fund ◾ PAGE 2
Year-to-Date Performance Review for the Fund's Class I Shares (unaudited)
The Fund outperformed the Bloomberg U.S. Agg by 1.12 percentage points year to date.
Key contributors to relative results included the Fund’s:
◾ Credit issuer selection, particularly Charter Communications, HSBC, Enel, and Telecom Italia;
◾ Underweight to U.S. Treasuries and overweight to corporate bonds;
◾ Below-benchmark duration position; and
◾ Strong performance of FFELP* Student Loan ABS.
*FFELP is the Federal Family Education Loan Program.
There were no notable detractors during the period.
Key Characteristics of Dodge & Cox
Independent Organization
Dodge & Cox is one of the largest privately owned investment managers in the world. We remain committed to independence, with a goal of providing the highest-quality investment management service to our existing clients.
Over 90 Years of Investment Experience
Dodge & Cox was founded in 1930. We have a stable and well-qualified team of investment professionals, most of whom have spent their entire careers at Dodge & Cox.
Experienced Investment Team
The U.S. Fixed Income Investment Committee, which is the decision-making body for the Income Fund, is an eight-member committee with an average tenure of 24 years at Dodge & Cox.
One Business with a Single Decision-Making Office
Dodge & Cox manages equity (domestic, international, and global), fixed income (domestic and global), and balanced investments, all from one office in San Francisco.
Consistent Investment Approach
Our team decision-making process involves thorough, bottom-up fundamental analysis of each investment.
Long-Term Focus and Low Expenses
We invest with a three- to five-year investment horizon. We manage Funds that maintain low expense ratios.
Risks: The Fund invests in individual bonds whose yields and market values fluctuate, so that an investment may be worth more or less than its original cost. Debt securities are subject to interest rate risk, credit risk, and prepayment and call risk, all of which could have adverse effects on the value of the Fund. A low interest rate environment creates an elevated risk of future negative returns. Financial intermediaries may restrict their market making activities for certain debt securities, which may reduce the liquidity and increase the volatility of such securities. Please read the prospectus and summary prospectus for specific details regarding the Fund’s risk profile.
Fund holdings and sector allocations are subject to change at any time and should not be considered recommendations to buy or sell any security. Please see the Portfolio of Investments section in this report for a complete list of fund holdings.
PAGE 3 ◾ Dodge & Cox Income Fund
Growth of $10,000 Over 10 Years (unaudited)
For an Investment Made on June 30, 2013 
Average Annual Total Return
For Periods Ended June 30, 2023
| | | | |
| | | | |
| | | | |
| | | | |
Bloomberg U.S. Aggregate Bond Index | | | | |
Expense Ratios
Per the Prospectus Dated May 1, 2023
| The Class X shares inception date is May 2, 2022. The returns shown prior to that date are for the Class I shares. |
| Dodge & Cox has contractually agreed to reimburse the Fund for all ordinary expenses to the extent necessary to maintain Total Annual Fund Operating Expenses of the Fund’s Class X shares at 0.33% until April 30, 2026. This agreement cannot be terminated prior to April 30, 2026 other than by resolution of the Fund’s Board of Trustees. For purposes of the foregoing, ordinary expenses shall not include nonrecurring shareholder account fees, fees and expenses associated with Fund shareholder meetings, fees on portfolio transactions such as exchange fees, dividends and interest on short positions, fees and expenses of pooled investment vehicles that are held by the Fund, interest expenses and other fees and expenses related to any borrowings, taxes, brokerage fees and commissions and other costs and expenses relating to the acquisition and disposition of Fund investments, other expenditures which are capitalized in accordance with generally accepted accounting principles, and other non-routine expenses or extraordinary expenses not incurred in the ordinary course of the Fund’s business, such as litigation expenses. The term of the agreement will automatically renew for subsequent three- year terms unless terminated with at least 30 days’ written notice by either party prior to the end of the then-current term. The agreement does not permit Dodge & Cox to recoup any fees waived or payments made to the Fund for a prior year. |
Returns represent past performance and do not guarantee future results. Investment return and share price will fluctuate with market conditions, and investors may have a gain or loss when shares are sold. Fund performance changes over time and currently may be significantly lower than stated. Performance is updated and published monthly. Visit the Fund’s website at dodgeandcox.com or call 800-621-3979 for current performance figures.
The Fund’s total returns include the reinvestment of dividend and capital gain distributions, but have not been adjusted for any income taxes payable by shareholders on these distributions or on Fund share redemptions. Index returns include interest income but, unlike Fund returns, do not reflect fees or expenses. The Bloomberg U.S. Aggregate Bond Index (Bloomberg U.S. Agg) is a widely recognized, unmanaged index of U.S. dollar-denominated, investment-grade fixed income securities.
Bloomberg is a registered trademark of Bloomberg Finance L.P. and its affiliates. For more information about this index, visit:
www.dodgeandcox.com/incomefund
Dodge & Cox Income Fund ◾ PAGE 4
Portfolio Information (unaudited) June 30, 2023
| Net Cash & Other includes cash, short-term investments, derivatives, receivables, and payables. |
Fund Expense Example (unaudited)
As a Fund shareholder, you incur ongoing Fund costs, including management fees and other Fund expenses. All mutual funds have ongoing costs, sometimes referred to as operating expenses. The following example shows ongoing costs of investing in the Fund and can help you understand these costs and compare them with those of other mutual funds. The example assumes a $1,000 investment held for the six months indicated.
Actual Expenses
The first line of each share class in the table below provides information about actual account values and expenses based on the actual returns of the share class. You may use the information in this line, together with your account balance, to estimate the expenses that you paid over the period. Simply divide your account value by $1,000 (for example, an $8,600 account value divided by $1,000 = 8.6), then multiply the result by the number in the first line under the heading “Expenses Paid During Period” to estimate the expenses you paid on your account during this period.
Hypothetical Example for Comparison with Other Mutual Funds
Information on the second line of each share class in the table can help you compare ongoing costs of investing in the Fund with those of other mutual funds. This information may not be used to estimate the actual ending account balance or expenses you paid during the period. The hypothetical “Ending Account Value” is based on the actual expense ratio of the share class and an assumed 5% annual rate of return before expenses (not the actual return of the share class). The amount under the heading “Expenses Paid During Period” shows the hypothetical expenses your account would have incurred under this scenario. You can compare this figure with the 5% hypothetical examples that appear in shareholder reports of other mutual funds.
Six Months Ended
June 30, 2023 | Beginning Account Value
1/1/2023 | Ending Account Value
6/30/2023 | Expenses Paid
During Period* | |
| | | | |
| | | | |
Based on hypothetical 5% yearly return | | | | |
| | | | |
| | | | |
Based on hypothetical 5% yearly return | | | | |
| Expenses are equal to the annualized expense ratio, multiplied by the average account value over the period, multiplied by 181/365 (to reflect the one-half year period). |
The expenses shown in the table highlight ongoing costs only and do not reflect any transactional fees or account maintenance fees. Though other mutual funds may charge such fees, please note that the Fund does not charge transaction fees (e.g., redemption fees, sales loads) or universal account maintenance fees (e.g., small account fees).
PAGE 5 ◾ Dodge & Cox Income Fund
Portfolio of Investments (unaudited) June 30, 2023
|
| | |
|
| | |
| | |
| | |
| | |
| | |
| | |
| | |
| | |
| | |
| | |
| | |
| | |
| | |
|
|
Petroleo Brasileiro SA (Brazil) | | |
| | |
| | |
| | |
| | |
Petroleos Mexicanos (Mexico) | | |
| | |
| | |
| | |
| | |
| | |
| | |
| | |
| | |
|
L.A. Unified School District GO | | |
| | |
| | |
New Jersey Turnpike Authority RB | | |
| | |
| | |
Regents of the UC Medical Center RB | | |
| | |
| | |
| | |
| | |
| | |
| | |
| | |
|
Colombia Government (Colombia) | | |
| | |
| | |
| | |
| | |
| | |
|
|
|
Small Business Admin. - 504 Program | | |
Series 2003-20G 1, 4.35%, 7/1/23 | | |
Series 2004-20L 1, 4.87%, 12/1/24 | | |
Series 2005-20B 1, 4.625%, 2/1/25 | | |
Series 2005-20D 1, 5.11%, 4/1/25 | | |
Series 2005-20E 1, 4.84%, 5/1/25 | | |
Series 2005-20G 1, 4.75%, 7/1/25 | | |
|
| | |
Series 2005-20H 1, 5.11%, 8/1/25 | | |
Series 2005-20I 1, 4.76%, 9/1/25 | | |
Series 2006-20A 1, 5.21%, 1/1/26 | | |
Series 2006-20B 1, 5.35%, 2/1/26 | | |
Series 2006-20C 1, 5.57%, 3/1/26 | | |
Series 2006-20G 1, 6.07%, 7/1/26 | | |
Series 2006-20H 1, 5.70%, 8/1/26 | | |
Series 2006-20I 1, 5.54%, 9/1/26 | | |
Series 2006-20J 1, 5.37%, 10/1/26 | | |
Series 2006-20L 1, 5.12%, 12/1/26 | | |
Series 2007-20A 1, 5.32%, 1/1/27 | | |
Series 2007-20C 1, 5.23%, 3/1/27 | | |
Series 2007-20D 1, 5.32%, 4/1/27 | | |
Series 2007-20G 1, 5.82%, 7/1/27 | | |
| | |
|
Rio Oil Finance Trust (Brazil) | | |
| | |
| | |
| | |
| | |
|
Navient Student Loan Trust | | |
| | |
| | |
+1.25%, 6.40%, 6/25/65(a) | | |
+1.15%, 6.30%, 3/25/66(a) | | |
+1.30%, 6.45%, 3/25/66(a) | | |
+0.80%, 5.95%, 7/26/66(a) | | |
+1.05%, 6.20%, 7/26/66(a) | | |
+1.15%, 6.30%, 7/26/66(a) | | |
+1.00%, 6.15%, 9/27/66(a) | | |
+1.05%, 6.20%, 12/27/66(a) | | |
+0.72%, 5.87%, 3/25/67(a) | | |
+0.80%, 5.95%, 3/25/67(a) | | |
+0.68%, 5.83%, 6/27/67(a) | | |
+1.00%, 6.15%, 2/27/68(a) | | |
+0.83%, 5.98%, 7/25/68(a) | | |
+0.81%, 5.96%, 7/25/68(a) | | |
+1.05%, 6.20%, 6/25/69(a) | | |
+0.90%, 1.04%, 8/26/69(a) | | |
+0.60%, 5.75%, 12/26/69(a) | | |
+0.70%, 5.85%, 2/25/70(a) | | |
+0.55%, 0.70%, 2/25/70(a) | | |
Navient Student Loan Trust (Private Loans) | | |
Series 2017-A A2A, 2.88%, | | |
| | |
| | |
| | |
| | |
+0.63%, 5.885%, 1/25/40(a) | | |
| | |
| | |
+0.55%, 5.805%, 10/25/64(a) | | |
+0.55%, 5.805%, 10/25/64(a) | | |
SMB Private Education Loan Trust (Private Loans) | | |
Series 2017-A A2A, 2.88%, | | |
Series 2017-B A2A, 2.82%, | | |
See accompanying Notes to Financial StatementsDodge & Cox Income Fund ◾ PAGE 6
Portfolio of Investments (unaudited) June 30, 2023
Debt Securities (continued) |
| | |
Series 2018-A A2A, 3.50%, | | |
Series 2018-B A2A, 3.60%, | | |
Series 2021-A APT2, 1.07%, | | |
Series 2023-B A1A, 4.99%, | | |
Series 2022-D A1A, 5.37%, | | |
| | |
| | |
|
|
Freddie Mac Multifamily Interest Only | | |
Series K055 X1, 1.475%, 3/25/26(b) | | |
Series K056 X1, 1.375%, 5/25/26(b) | | |
Series K062 X1, 0.418%, 12/25/26(b) | | |
Series K064 X1, 0.736%, 3/25/27(b) | | |
Series K065 X1, 0.805%, 4/25/27(b) | | |
Series K066 X1, 0.885%, 6/25/27(b) | | |
Series K067 X1, 0.707%, 7/25/27(b) | | |
Series K069 X1, 0.474%, 9/25/27(b) | | |
Series K070 X1, 0.456%, 11/25/27(b) | | |
Series K071 X1, 0.414%, 11/25/27(b) | | |
Series K089 X1, 0.687%, 1/25/29(b) | | |
Series K091 X1, 0.706%, 3/25/29(b) | | |
Series K092 X1, 0.855%, 4/25/29(b) | | |
Series K093 X1, 1.093%, 5/25/29(b) | | |
Series K094 X1, 1.015%, 6/25/29(b) | | |
Series K095 X1, 1.084%, 6/25/29(b) | | |
Series K096 X1, 1.257%, 7/25/29(b) | | |
Series K097 X1, 1.22%, 7/25/29(b) | | |
Series K098 X1, 1.268%, 8/25/29(b) | | |
Series K099 X1, 1.003%, 9/25/29(b) | | |
Series K101 X1, 0.947%, 10/25/29(b) | | |
Series K102 X1, 0.944%, 10/25/29(b) | | |
Series K152 X1, 1.101%, 1/25/31(b) | | |
Series K154 X1, 0.433%, 11/25/32(b) | | |
Series K-1511 X1, 0.929%, | | |
| | |
| | |
|
Federal Agency CMO & REMIC: 6.9% |
Dept. of Veterans Affairs | | |
Series 1995-2D 4A, 9.293%, 5/15/25 | | |
Series 1997-2 Z, 7.50%, 6/15/27 | | |
Series 1998-2 2A, 8.613%, | | |
Series 1998-1 1A, 8.293%, | | |
| | |
Trust 1998-58 PX, 6.50%, 9/25/28 | | |
Trust 1998-58 PC, 6.50%, 10/25/28 | | |
Trust 2001-69 PQ, 6.00%, 12/25/31 | | |
Trust 2002-33 A1, 7.00%, 6/25/32 | | |
Trust 2002-69 Z, 5.50%, 10/25/32 | | |
Trust 2008-24 GD, 6.50%, 3/25/37 | | |
Trust 2007-47 PE, 5.00%, 5/25/37 | | |
Trust 2009-30 AG, 6.50%, 5/25/39 | | |
|
| | |
Trust 2009-40 TB, 6.00%, 6/25/39 | | |
Trust 2001-T3 A1, 7.50%, 11/25/40 | | |
Trust 2010-123 WT, 7.00%, 11/25/40 | | |
Trust 2001-T7 A1, 7.50%, 2/25/41 | | |
Trust 2001-T5 A2, 6.971%, | | |
Trust 2001-T5 A3, 7.50%, 6/19/41(b) | | |
Trust 2001-T4 A1, 7.50%, 7/25/41 | | |
Trust 2011-58 AT, 4.00%, 7/25/41 | | |
Trust 2001-T10 A1, 7.00%, 12/25/41 | | |
Trust 2013-106 MA, 4.00%, 2/25/42 | | |
Trust 2002-W6 2A1, 7.00%, | | |
Trust 2002-W8 A2, 7.00%, 6/25/42 | | |
Trust 2002-90 A1, 6.50%, 6/25/42 | | |
Trust 2002-T16 A3, 7.50%, 7/25/42 | | |
Trust 2003-W2 1A2, 7.00%, 7/25/42 | | |
| | |
Trust 2012-121 NB, 7.00%, 11/25/42 | | |
Trust 2003-W1 2A, 5.224%, | | |
Trust 2003-7 A1, 6.50%, 12/25/42 | | |
Trust 2004-T1 1A2, 6.50%, 1/25/44 | | |
Trust 2004-W2 2A2, 7.00%, 2/25/44 | | |
Trust 2004-W2 5A, 7.50%, 3/25/44 | | |
Trust 2004-W8 3A, 7.50%, 6/25/44 | | |
Trust 2004-W15 1A2, 6.50%, 8/25/44 | | |
Trust 2005-W1 1A3, 7.00%, 10/25/44 | | |
Trust 2001-79 BA, 7.00%, 3/25/45 | | |
Trust 2006-W1 1A1, 6.50%, 12/25/45 | | |
Trust 2006-W1 1A2, 7.00%, 12/25/45 | | |
Trust 2006-W1 1A3, 7.50%, 12/25/45 | | |
Trust 2006-W1 1A4, 8.00%, 12/25/45 | | |
Trust 2007-W10 1A, 6.147%, | | |
Trust 2007-W10 2A, 6.304%, | | |
Trust 2018-28 PT, 3.50%, 5/25/48 | | |
| | |
| | |
| | |
| | |
Series 2456 CJ, 6.50%, 6/15/32 | | |
Series 3312 AB, 6.50%, 6/15/32 | | |
Series T-41 2A, 4.682%, 7/25/32(b) | | |
Series 2587 ZU, 5.50%, 3/15/33 | | |
Series 2610 UA, 4.00%, 5/15/33 | | |
Series T-48 1A, 4.392%, 7/25/33(b) | | |
Series 2708 ZD, 5.50%, 11/15/33 | | |
Series 3204 ZM, 5.00%, 8/15/34 | | |
Series 3330 GZ, 5.50%, 6/15/37 | | |
Series 3427 Z, 5.00%, 3/15/38 | | |
Series T-51 1A, 6.50%, 9/25/43(b) | | |
Series 4283 DW, 4.50%, 12/15/43(b) | | |
PAGE 7 ◾ Dodge & Cox Income FundSee accompanying Notes to Financial Statements
Portfolio of Investments (unaudited) June 30, 2023
Debt Securities (continued) |
| | |
Series 4283 EW, 4.50%, 12/15/43(b) | | |
Series 4281 BC, 4.50%, 12/15/43(b) | | |
Series 4319 MA, 4.50%, 3/15/44(b) | | |
| | |
Series 2014-184 GZ, 3.50%, 12/20/44 | | |
Series 2015-24 Z, 3.50%, 2/20/45 | | |
Series 2015-69 DZ, 3.50%, 5/20/45 | | |
Series 2015-69 KZ, 3.50%, 5/20/45 | | |
United States 30 Day Average SOFR | | |
+0.55%, Series 2022-H04 FG, 5.156%, 2/20/67 | | |
+0.50%, Series 2022-H04 GF, 5.14%, 2/20/67 | | |
+0.50%, Series 2022-H07 FB, 4.764%, 1/20/68 | | |
+0.30%, Series 2022-H06 FA, 4.775%, 2/20/68 | | |
+0.50%, Series 2022-H07 AF, 5.235%, 2/20/68 | | |
+0.50%, Series 2022-H07 BF, 4.843%, 2/20/68 | | |
+0.50%, Series 2022-H07 FH, 4.37%, 6/20/68 | | |
+0.41%, Series 2022-H06 FC, 3.761%, 8/20/68 | | |
+1.30%, Series 2023-H08 EF, 4.241%, 7/20/71 | | |
+1.02%, Series 2023-H08 FE, 3.982%, 8/20/71 | | |
+1.00%, Series 2022-H20 FB, 4.048%, 8/20/71 | | |
+1.45%, Series 2021-H12 EF, 6.091%, 8/20/71 | | |
+0.70%, Series 2021-H17 FA, 4.246%, 11/20/71 | | |
+0.82%, Series 2021-H19 FM, 5.886%, 12/20/71 | | |
+0.80%, Series 2022-H08 FL, 4.451%, 12/20/71 | | |
+0.80%, Series 2022-H02 FC, 5.866%, 1/20/72 | | |
+0.35%, Series 2022-H01 FA, 5.416%, 1/20/72 | | |
+0.82%, Series 2022-H04 HF, 5.886%, 2/20/72 | | |
+0.75%, Series 2022-H07 F, 5.816%, 2/20/72 | | |
+0.75%, Series 2022-H08 FE, 5.681%, 3/20/72 | | |
+0.74%, Series 2022-H09 FC, 5.806%, 4/20/72 | | |
+1.00%, Series 2022-H11 FG, 6.066%, 4/20/72 | | |
+0.95%, Series 2022-H10 FA, 6.016%, 5/20/72 | | |
+0.95%, Series 2022-H11 AF, 6.016%, 5/20/72 | | |
+0.90%, Series 2022-H11 F, 5.966%, 5/20/72 | | |
+0.97%, Series 2022-H11 EF, 6.036%, 5/20/72 | | |
|
| | |
+0.95%, Series 2022-H12 FA, 6.016%, 6/20/72 | | |
+1.10%, Series 2022-H23 FA, 6.166%, 10/20/72 | | |
+1.63%, Series 2023-H08 FG, 4.461%, 2/20/73 | | |
+1.42%, Series 2023-H13 FJ, 6.486%, 2/20/73 | | |
+1.10%, Series 2023-H08 FD, 6.166%, 3/20/73 | | |
| | |
| | |
| | |
| | |
| | |
| | |
| | |
| | |
| | |
| | |
| | |
| | |
| | |
| | |
| | |
| | |
| | |
| | |
| | |
| | |
| | |
| | |
| | |
| | |
| | |
| | |
| | |
| | |
| | |
| | |
| | |
| | |
| | |
| | |
| | |
| | |
| | |
| | |
| | |
| | |
| | |
| | |
| | |
| | |
| | |
| | |
| | |
| | |
| | |
| | |
| | |
| | |
| | |
| | |
See accompanying Notes to Financial StatementsDodge & Cox Income Fund ◾ PAGE 8
Portfolio of Investments (unaudited) June 30, 2023
Debt Securities (continued) |
| | |
| | |
| | |
| | |
| | |
| | |
| | |
| | |
| | |
| | |
| | |
| | |
| | |
| | |
| | |
| | |
| | |
| | |
| | |
| | |
| | |
| | |
| | |
| | |
| | |
| | |
Seasoned Credit Risk Transfer Trust 2017-4 | | |
Series 2017-4 M45T, 4.50%, 6/25/57 | | |
| | |
Federal Agency Mortgage Pass-Through: 33.0% |
| | |
| | |
| | |
| | |
| | |
| | |
| | |
| | |
| | |
| | |
| | |
| | |
| | |
| | |
| | |
| | |
| | |
| | |
| | |
| | |
| | |
| | |
| | |
| | |
| | |
| | |
| | |
| | |
| | |
| | |
| | |
| | |
| | |
|
| | |
| | |
| | |
| | |
| | |
3.62%, 10/1/34 - 8/1/49(b) | | |
| | |
| | |
| | |
| | |
| | |
| | |
| | |
| | |
4.004%, 8/1/35 - 8/1/44(b) | | |
| | |
| | |
| | |
| | |
| | |
| | |
| | |
| | |
| | |
| | |
| | |
| | |
| | |
| | |
| | |
| | |
| | |
| | |
| | |
| | |
| | |
| | |
| | |
| | |
| | |
| | |
| | |
| | |
| | |
| | |
| | |
| | |
| | |
| | |
| | |
3.81%, 9/1/43 - 12/1/43(b) | | |
| | |
| | |
| | |
| | |
| | |
| | |
3.946%, 2/1/44 - 4/1/45(b) | | |
| | |
| | |
| | |
| | |
| | |
| | |
| | |
PAGE 9 ◾ Dodge & Cox Income FundSee accompanying Notes to Financial Statements
Portfolio of Investments (unaudited) June 30, 2023
Debt Securities (continued) |
| | |
| | |
| | |
| | |
3.84%, 7/1/44 - 12/1/44(b) | | |
3.83%, 7/1/44 - 12/1/44(b) | | |
| | |
| | |
| | |
| | |
| | |
| | |
| | |
| | |
| | |
3.85%, 10/1/44 - 12/1/44(b) | | |
| | |
| | |
| | |
3.812%, 11/1/44 - 12/1/44(b) | | |
| | |
| | |
| | |
| | |
| | |
| | |
| | |
| | |
| | |
| | |
6.985%, 3/1/46 - 4/1/46(b) | | |
| | |
| | |
| | |
| | |
| | |
| | |
| | |
| | |
| | |
| | |
| | |
3.146%, 7/1/47 - 8/1/47(b) | | |
| | |
| | |
| | |
| | |
| | |
| | |
| | |
| | |
| | |
| | |
| | |
| | |
| | |
| | |
3.347%, 10/1/48 - 10/1/49(b) | | |
| | |
| | |
| | |
| | |
| | |
| | |
| | |
|
| | |
| | |
| | |
| | |
| | |
4.375%, 2/1/34 - 11/1/34(b) | | |
4.084%, 8/1/34 - 9/1/35(b) | | |
| | |
| | |
| | |
| | |
| | |
| | |
3.875%, 10/1/35 - 11/1/44(b) | | |
| | |
| | |
3.967%, 1/1/36 - 1/1/44(b) | | |
| | |
| | |
| | |
| | |
| | |
| | |
| | |
| | |
| | |
| | |
| | |
| | |
| | |
| | |
| | |
| | |
| | |
| | |
| | |
| | |
| | |
| | |
| | |
| | |
| | |
| | |
| | |
| | |
| | |
| | |
| | |
| | |
3.86%, 8/1/44 - 11/1/44(b) | | |
| | |
3.87%, 9/1/44 - 12/1/44(b) | | |
3.88%, 10/1/44 - 1/1/45(b) | | |
| | |
| | |
3.85%, 11/1/44 - 11/1/44(b) | | |
| | |
| | |
| | |
| | |
| | |
| | |
| | |
| | |
| | |
See accompanying Notes to Financial StatementsDodge & Cox Income Fund ◾ PAGE 10
Portfolio of Investments (unaudited) June 30, 2023
Debt Securities (continued) |
| | |
| | |
| | |
| | |
| | |
| | |
| | |
| | |
| | |
| | |
| | |
| | |
| | |
| | |
| | |
| | |
| | |
| | |
| | |
| | |
| | |
| | |
| | |
Freddie Mac Gold, 15 Year | | |
| | |
| | |
| | |
Freddie Mac Gold, 20 Year | | |
| | |
| | |
| | |
| | |
Freddie Mac Gold, 30 Year | | |
| | |
| | |
| | |
| | |
| | |
| | |
Freddie Mac Pool, 20 Year | | |
| | |
Freddie Mac Pool, 30 Year | | |
| | |
| | |
| | |
| | |
| | |
| | |
| | |
| | |
| | |
| | |
| | |
| | |
| | |
| | |
| | |
| | |
7.50%, 12/15/23 - 5/15/25 | | |
| | |
| | |
|
| | |
Private Label CMO & REMIC: 0.0%* |
GSMPS Mortgage Loan Trust | | |
Series 2004-4 1A4, 8.50%, | | |
| | |
| | |
| | |
|
|
| | |
| | |
| | |
| | |
| | |
| | |
| | |
| | |
| | |
| | |
Barclays PLC (United Kingdom) | | |
| | |
| | |
| | |
| | |
| | |
| | |
| | |
| | |
| | |
| | |
| | |
| | |
| | |
| | |
| | |
| | |
| | |
| | |
| | |
| | |
| | |
| | |
| | |
| | |
Capital One Financial Corp. | | |
| | |
| | |
| | |
| | |
| | |
| | |
| | |
| | |
| | |
| | |
| | |
| | |
| | |
| | |
| | |
| | |
| | |
| | |
| | |
PAGE 11 ◾ Dodge & Cox Income FundSee accompanying Notes to Financial Statements
Portfolio of Investments (unaudited) June 30, 2023
Debt Securities (continued) |
| | |
| | |
+6.37%, 11.643%, 10/30/40(d) | | |
Goldman Sachs Group, Inc. | | |
| | |
HSBC Holdings PLC (United Kingdom) | | |
| | |
| | |
| | |
| | |
| | |
| | |
| | |
| | |
| | |
| | |
| | |
| | |
| | |
| | |
| | |
| | |
| | |
| | |
| | |
| | |
| | |
| | |
Lloyds Banking Group PLC (United Kingdom) | | |
| | |
| | |
| | |
| | |
| | |
NatWest Group PLC (United Kingdom) | | |
| | |
| | |
| | |
| | |
| | |
| | |
UBS Group AG (Switzerland) | | |
| | |
| | |
| | |
| | |
| | |
| | |
| | |
| | |
| | |
| | |
| | |
| | |
| | |
| | |
| | |
| | |
| | |
| | |
|
Anheuser-Busch InBev SA/NV (Belgium) | | |
|
| | |
| | |
| | |
| | |
| | |
| | |
| | |
| | |
| | |
| | |
| | |
| | |
| | |
British American Tobacco PLC (United Kingdom) | | |
| | |
| | |
| | |
| | |
| | |
| | |
| | |
| | |
| | |
Burlington Northern Santa Fe LLC(e) | | |
| | |
| | |
| | |
| | |
| | |
| | |
| | |
| | |
| | |
Charter Communications, Inc. | | |
| | |
| | |
| | |
| | |
| | |
| | |
| | |
| | |
| | |
| | |
| | |
| | |
| | |
| | |
| | |
| | |
| | |
| | |
| | |
| | |
| | |
| | |
| | |
| | |
| | |
| | |
| | |
| | |
| | |
| | |
See accompanying Notes to Financial StatementsDodge & Cox Income Fund ◾ PAGE 12
Portfolio of Investments (unaudited) June 30, 2023
Debt Securities (continued) |
| | |
| | |
| | |
| | |
| | |
| | |
| | |
| | |
| | |
| | |
| | |
| | |
| | |
Elanco Animal Health, Inc. | | |
| | |
| | |
| | |
| | |
| | |
| | |
| | |
Ford Motor Credit Co. LLC(e) | | |
| | |
| | |
| | |
| | |
| | |
| | |
| | |
| | |
| | |
| | |
| | |
| | |
| | |
| | |
| | |
GE HealthCare Technologies, Inc. | | |
| | |
| | |
| | |
| | |
| | |
| | |
| | |
| | |
Imperial Brands PLC (United Kingdom) | | |
| | |
| | |
| | |
| | |
| | |
| | |
| | |
| | |
| | |
| | |
| | |
| | |
| | |
| | |
| | |
| | |
| | |
| | |
|
| | |
| | |
Microchip Technology, Inc. | | |
| | |
| | |
| | |
Occidental Petroleum Corp. | | |
| | |
| | |
| | |
Philip Morris International, Inc. | | |
| | |
| | |
| | |
| | |
| | |
| | |
| | |
| | |
| | |
| | |
| | |
RELX PLC (United Kingdom) | | |
| | |
| | |
| | |
| | |
| | |
| | |
| | |
Telecom Italia SPA (Italy) | | |
| | |
| | |
| | |
| | |
| | |
| | |
| | |
| | |
| | |
The Williams Companies, Inc. | | |
| | |
| | |
| | |
| | |
| | |
| | |
| | |
| | |
| | |
| | |
| | |
| | |
Ultrapar Participacoes SA (Brazil) | | |
| | |
| | |
| | |
| | |
| | |
| | |
Verizon Communications, Inc. | | |
| | |
| | |
| | |
| | |
PAGE 13 ◾ Dodge & Cox Income FundSee accompanying Notes to Financial Statements
Portfolio of Investments (unaudited) June 30, 2023
Debt Securities (continued) |
| | |
| | |
| | |
Vodafone Group PLC (United Kingdom) | | |
| | |
| | |
| | |
| | |
|
American Electric Power Co., Inc | | |
| | |
| | |
| | |
| | |
| | |
| | |
| | |
| | |
| | |
| | |
| | |
| | |
| | |
| | |
| | |
| | |
| | |
| | |
| | |
| | |
| | |
| | |
| | |
Total Debt Securities
(Cost $67,881,862,754) | |
Short-Term Investments: 1.7% |
| | |
Repurchase Agreements: 1.3% |
Fixed Income Clearing Corporation(f) 5.04%, dated 6/30/23, due 7/3/23, maturity value $550,231,000 | | |
Fixed Income Clearing Corporation(f) 2.45%, dated 6/30/23, due 7/3/23, maturity value $193,647,528 | | |
5.05%, dated 6/30/23, due 7/3/23, maturity value $100,042,083 | | |
| | |
|
State Street Institutional U.S. Government Money Market Fund - Premier Class | | |
Total Short-Term Investments
(Cost $1,100,073,084) | |
Total Investments In Securities
(Cost $68,981,935,838) | | |
Other Assets Less Liabilities | | |
| | |
| Security exempt from registration under Rule 144A of the Securities Act of 1933. The security may be resold in transactions exempt from registration, normally to qualified institutional buyers. |
| Variable rate security: interest rate is determined by the interest rates of underlying pool of assets that collateralize the security. The interest rate of the security may change due to a change in the interest rates or the composition of underlying pool of assets. The interest rate shown is the rate as of period end. |
| Variable rate security: fixed-to-float security pays an initial fixed interest rate and will pay a floating interest rate established at a predetermined time in the future. The interest rate shown is the rate as of period end. |
| Hybrid security: characteristics of both a debt and equity security. |
| Subsidiary. Security may be issued by parent company or one of its subsidiaries. (see below) |
| Repurchase agreements are collateralized by:
Fixed Income Clearing Corporation: U.S. Treasury Notes 0.25%-4.50%, 9/30/25- 8/15/39. U.S. Treasury Inflation Indexed Notes 0.125%, 10/15/25. Total collateral value is $758,480,182.
Royal Bank of Canada: U.S. Treasury Notes 0.75%-3.875%, 6/15/25-12/31/27. Total collateral value is $102,042,951. |
| |
| Debt securities are grouped by parent company unless otherwise noted. Actual securities may be issued by the listed parent company or one of its subsidiaries.
The Fund usually classifies a company or issuer based on its country of risk, but may designate a different country in certain circumstances. |
| Debt securities with floating interest rates are linked to the referenced benchmark; the interest rate shown is the rate as of period end. |
| |
ARM: Adjustable Rate Mortgage |
CMBS: Commercial Mortgage-Backed Security |
CMO: Collateralized Mortgage Obligation |
|
|
REMIC: Real Estate Mortgage Investment Conduit |
SOFR: Secured Overnight Financing Rate |
See accompanying Notes to Financial StatementsDodge & Cox Income Fund ◾ PAGE 14
Portfolio of Investments (unaudited) June 30, 2023
Futures Contracts
| | | | Value /
Unrealized
Appreciation/
(Depreciation) |
Ultra 10 Year U.S. Treasury Note Future— Short Position | | | | |
PAGE 15 ◾ Dodge & Cox Income FundSee accompanying Notes to Financial Statements
Statement of Assets and Liabilities (unaudited)
| |
|
Investments in securities, at value (cost $68,981,935,838) | |
Cash pledged as collateral for delayed delivery securities | |
Deposits with broker for futures contracts | |
Receivable for investments sold | |
Receivable for Fund shares sold | |
Dividends and interest receivable | |
Expense reimbursement receivable | |
Prepaid expenses and other assets | |
| |
|
Payable for variation margin for futures contracts | |
Payable for investments purchased | |
Payable for Fund shares redeemed | |
| |
| |
| |
| |
|
| |
| |
| |
|
| |
Shares outstanding (par value $0.01 each, unlimited shares authorized) | |
Net asset value per share | |
|
| |
Shares outstanding (par value $0.01 each, unlimited shares authorized) | |
Net asset value per share | |
Statement of Operations (unaudited)
| Six Months Ended
June 30, 2023 |
| |
| |
| |
| |
| |
| |
Administrative services fees | |
| |
| |
Custody and fund accounting fees | |
| |
| |
| |
| |
| |
| |
Expenses reimbursed by investment manager | |
| |
| |
Realized and Unrealized Gain (Loss): | |
| |
Investments in securities | |
| |
Net change in unrealized appreciation/depreciation | |
Investments in securities | |
| |
Net realized and unrealized gain | |
Net Change in Net Assets From Operations | |
Statement of Changes in Net Assets (unaudited)
| | |
| | |
| | |
| | |
| | |
Net change in unrealized appreciation/depreciation | | |
| | |
Distributions to Shareholders: | | |
| | |
| | |
| | |
| | |
| | |
Proceeds from sales of shares | | |
Reinvestment of distributions | | |
| | |
| | |
Proceeds from sales of shares | | |
Reinvestment of distributions | | |
| | |
Net change from Fund share transactions | | |
Total change in net assets | | |
| | |
| | |
| | |
| | |
| | |
| | |
| | |
| | |
Net change in shares outstanding | | |
| | |
| | |
| | |
| | |
Net change in shares outstanding | | |
See accompanying Notes to Financial StatementsDodge & Cox Income Fund ◾ PAGE 16
Notes to Financial Statements (unaudited)
Note 1: Organization and Significant Accounting Policies
Dodge & Cox Income Fund (the “Fund”) is one of the series constituting the Dodge & Cox Funds (the “Trust” or the “Funds”). The Trust is organized as a Delaware statutory trust and is registered under the Investment Company Act of 1940, as amended, as an open-end management investment company. The Fund commenced operations on January 3, 1989, and seeks high and stable current income consistent with long-term preservation of capital. Risk considerations and investment strategies of the Fund are discussed in the Fund’s Prospectus.
On May 1, 2022, the then-outstanding shares of the Fund were redesignated as Class I Shares, and Class X shares of the Fund were established. The share classes have different eligibility requirements and expense structures due to differing shareholder servicing arrangements. The share classes have the same rights as to redemption, dividends and liquidation proceeds, and voting privileges, except that each class has the exclusive right to vote on matters affecting only its class.
The Fund is an investment company and follows the accounting and reporting guidance issued in Topic 946 by the Financial Accounting Standards Board. The financial statements have been prepared in conformity with accounting principles generally accepted in the United States of America, which require the use of estimates and assumptions by management. Actual results may differ from those estimates. Significant accounting policies are as follows:
Security valuation The Fund’s net assets are normally valued as of the scheduled close of trading on the New York Stock Exchange (NYSE), generally 4 p.m. Eastern Time, each day that the NYSE is open for business.
Debt securities are valued using prices received from independent pricing services which utilize dealer quotes, recent transaction data, pricing models, and other inputs to arrive at market-based valuations. Pricing models may consider quoted prices for similar securities, interest rates, cash flows (including prepayment speeds), and credit risk. Short-term securities less than 60 days to maturity may be valued at amortized cost if amortized cost approximates current value. Mutual funds are valued at their respective net asset values. Security values are not discounted based on the size of the Fund’s position and may differ from the value a Fund receives upon sale of the securities. All securities held by the Fund are denominated in U.S. dollars.
If market quotations are not readily available or if normal valuation procedures produce valuations that are deemed unreliable or inappropriate under the circumstances existing at the time, the investment will be valued at fair value as determined in good faith by Dodge & Cox. The Board of Trustees has appointed Dodge & Cox, the Fund’s investment manager, as its "valuation designee", as permitted by Rule 2a-5 under the Investment Company Act of 1940, to make fair value determinations in accordance with the Dodge & Cox Funds Valuation Policies (“Valuation Policies”), subject to Board oversight. Dodge & Cox has established a Pricing Committee that is comprised of representatives from Treasury, Legal, Compliance, and Operations. The Pricing Committee is responsible for implementing the Valuation Policies, including determining the fair value of securities and other investments when necessary. The Pricing Committee considers rel
evant indications of value that are reasonably available to it in determining the fair value assigned to a particular security, such as the value of similar financial instruments, trading volumes, contractual restrictions on disposition, related corporate actions, and changes in economic conditions. In doing so, the Pricing Committee employs various methods for calibrating fair valuation approaches, including a regular review of key inputs and assumptions, back-testing, and review of any related market activity.
Valuing securities through a fair value determination involves greater reliance on judgment than valuation of securities based on readily available market quotations. In some instances, lack of information and uncertainty as to the significance of information may lead to a conclusion that a prior valuation is the best indication of a security’s value. When fair value pricing is employed, the prices of securities used by the Fund to calculate its net asset value may differ from quoted or published prices for the same securities.
Security transactions, investment income, expenses, and distributions Security transactions are recorded on the trade date. Realized gains and losses on securities sold are determined on the basis of identified cost.
Interest income is recorded on the accrual basis. Interest income includes coupon interest, amortization of premium and accretion of discount on debt securities, and gain/loss on paydowns. The ability of the issuers of the debt securities held by the Fund to meet their obligations may be affected by economic developments in a specific industry, state, or region. Debt obligations may be placed on non-accrual status and related interest income may be reduced by ceasing current accruals and writing off interest receivables when the collection of all or a portion of interest has become doubtful. A debt obligation is removed from non-accrual status when the issuer resumes interest payments or when collectibility of interest is reasonably assured. Dividend income is recorded on the ex-dividend date.
Expenses are recorded on the accrual basis. Some expenses of the Trust can be directly attributed to a specific series. Expenses which cannot be directly attributed are allocated among the Funds in the Trust using methodologies determined by the nature of the expense.
Distributions to shareholders are recorded on the ex-dividend date.
Share class accounting Investment income, realized and unrealized gains and losses and expenses, other than class-specific expenses, are allocated to each share class of the Fund based upon the proportion of net assets of each class.
Repurchase agreements Repurchase agreements are transactions under which a Fund purchases a security from a counterparty and agrees to resell the security to that counterparty on a specified future date at the same price, plus a specified interest rate. The Fund’s repurchase agreements are secured by U.S. government or agency securities. It is the Fund’s policy that its regular custodian or third party custodian take possession of the underlying collateral securities, the fair value of which exceeds the principal amount of the repurchase transaction, including accrued interest, at all times. In the event of default by the counterparty, the Fund has the contractual
PAGE 17 ◾ Dodge & Cox Income Fund
Notes to Financial Statements (unaudited)
right to liquidate the collateral securities and to apply the proceeds in satisfaction of the obligation.
To-Be-Announced securities The Fund may purchase mortgage-related securities on a to-be-announced (“TBA”) basis at a fixed price, with payment and delivery on a scheduled future date beyond the customary settlement period for such securities. The Fund may choose to extend the settlement through a “dollar roll” transaction in which it sells the mortgage-related securities to a dealer and simultaneously agrees to purchase similar securities for future delivery at a predetermined price. The Fund accounts for TBA dollar rolls as purchase and sale transactions.
The Fund may also enter into a Master Securities Forward Transaction Agreement ("MSFTA") with a counterparty to govern transactions of delayed delivery securities, including TBA securities. The MSFTA provides for collateralization requirements and the right to offset amounts due to or from counterparties under specified conditions.
Indemnification Under the Trust’s organizational documents, its officers and trustees are indemnified against certain liabilities arising out of the performance of their duties to the Trust. In addition, in the normal course of business the Trust enters into contracts that provide general indemnities to other parties. The Trust’s maximum exposure under these arrangements is unknown, as this would involve future claims that may be made against the Trust that have not yet occurred.
Note 2: Valuation Measurements
Various inputs are used in determining the value of the Fund’s investments. These inputs are summarized in the three broad levels below.
◾ Level 1: Unadjusted quoted prices in active markets for identical securities
◾ Level 2: Other significant observable inputs (including quoted prices for similar securities, market indices, interest rates, credit risk, forward exchange rates, etc.)
◾ Level 3: Significant unobservable inputs (including Fund management’s assumptions in determining the fair value of investments)
The inputs or methodology used for valuing securities are not necessarily an indication of the risk associated with investing in those securities.
The following is a summary of the inputs used to value the Fund’s holdings at June 30, 2023:
| | LEVEL 2
(Other Significant
Observable Inputs) |
|
|
| | |
| | |
| | |
| | |
|
| | |
| | |
| | |
| | LEVEL 2 (Other Significant Observable Inputs) |
|
|
| | |
| |
| |
| |
Net change in unrealized appreciation/depreciation |
| |
Note 3: Related Party Transactions
Investment advisory fee The Fund pays an investment advisory fee monthly at an annual rate of 0.30% of the Fund’s average daily net assets to Dodge & Cox, investment manager of the Fund. The agreement further provides that Dodge & Cox shall waive its fee to the extent that such fee plus all other ordinary operating expenses of the Fund exceed 1% of the average daily net assets for the year.
Administrative services fee The Fund pays Dodge & Cox a fee for administrative and shareholder services. The fee is accrued daily and paid monthly equal to an annual rate of the average daily net assets of 0.10% for Class I shares and 0.05% for Class X shares. Under this agreement, Dodge & Cox also pays for the Fund's transfer agent fees.
Expense reimbursement Dodge & Cox has contractually agreed to reimburse the Fund for all ordinary expenses to the extent necessary to maintain the ratio of total operating expenses of the Class X shares to average net assets of the Class X shares at 0.33% through April 30, 2026. The term of the agreement will automatically renew for subsequent three-year terms unless terminated with at least 30 days’ written notice by either party prior to the end of the then-current term. For the six months ended June 30, 2023, Dodge & Cox reimbursed expenses of $825,204.
Fund officers and trustees All officers and two of the trustees of the Trust are current or former senior executive officers of Dodge & Cox. The Trust pays a fee only to those trustees who are not affiliated with Dodge & Cox.
Note 4: Income Tax Information and Distributions to Shareholders
A provision for federal income taxes is not required since the Fund intends to continue to qualify as a regulated investment company under Subchapter M of the Internal Revenue Code and distribute all of its taxable income to shareholders. Distributions are determined in accordance with income tax regulations, and such amounts may differ from net investment income and realized gains for financial reporting purposes. The Fund may also designate a portion of the amount paid to redeeming shareholders as a distribution for tax purposes.
Dodge & Cox Income Fund ◾ PAGE 18
Notes to Financial Statements (unaudited)
Financial reporting records are adjusted for permanent book to tax differences at year end to reflect tax character. Book to tax differences are primarily due to differing treatments of distributions.
Distributions during the periods noted below were characterized as follows for federal income tax purposes:
| Six Months Ended
June 30, 2023 | Year Ended
December 31, 2022 |
| | |
| | |
| | |
| | |
| | |
| | |
The components of distributable earnings on a tax basis are reported as of the Fund's most recent year end. At December 31, 2022, the tax basis components of distributable earnings were as follows:
Capital loss carryforward1 | |
Net unrealized depreciation | |
Total distributable earnings | |
| Represents accumulated long-term capital loss as of December 31, 2022, which may be carried forward to offset future capital gains. |
At June 30, 2023, unrealized appreciation and depreciation for investments based on cost for federal income tax purposes were as follows:
| |
| |
| |
Net unrealized appreciation | |
Fund management has reviewed the tax positions for open periods (three years and four years, respectively, from filing the Fund’s Federal and State tax returns) as applicable to the Fund, and has determined that no provision for income tax is required in the Fund’s financial statements.
Note 5: Loan Facilities
Pursuant to an exemptive order issued by the Securities and Exchange Commission (SEC), the Fund may participate in an interfund lending facility (Facility). The Facility allows the Fund to borrow money from or loan money to the Funds. Loans under the Facility are made for temporary or emergency purposes, such as to fund shareholder redemption requests. Interest on borrowings is the average of the current repurchase agreement rate and the bank loan rate. There was no activity in the Facility during the period.
All Funds in the Trust participate in a $500 million committed credit facility (Line of Credit) with State Street Bank and Trust Company, to be utilized for temporary or emergency purposes to fund shareholder redemptions or for other short-term liquidity purposes. The maximum amount available to the Fund is $250 million. Each Fund pays an annual commitment fee on its pro-rata portion of the Line of Credit. For the six months ended June 30, 2023, the Fund’s commitment fee amounted to $168,355 and is reflected as a Miscellaneous Expense in the Statement of Operations. Interest on borrowings is charged at the prevailing rate. There were no borrowings on the Line of Credit during the period.
Note 6: Purchases and Sales of Investments
For the six months ended June 30, 2023, purchases and sales of securities, other than short-term securities and U.S. government securities, aggregated $2,715,253,945 and $2,501,800,552, respectively. For the six months ended June 30, 2023, purchases and sales of U.S. government securities aggregated $26,320,099,830 and $24,144,344,914, respectively.
Note 7: New Accounting Guidance
In March 2020, the Financial Accounting Standards Board (FASB) issued Accounting Standards Update (ASU) No. 2020-04, Reference Rate Reform (Topic 848) – Facilitation of the Effects of Reference Rate Reform on Financial Reporting. The amendments in the ASU provide optional temporary financial reporting relief from the effect of certain types of contract modifications due to the planned discontinuation of the London Interbank Offered Rate and other interbank-offered based reference rates as of the end of 2021. The ASU is effective for certain reference rate-related contract modifications that occur during the period March 12, 2020 through December 31, 2022. In December 2022, the FASB issued ASU No. 2022-06, Reference Rate Reform (Topic 848) - Deferral of the Sunset Date of Topic 848, which extends the period through December 31, 2024. Management has reviewed the requirements and believes the adoption of these ASUs will not have a material impact on the financial statements.
Note 8: Subsequent Events
Fund management has determined that no material events or transactions occurred subsequent to June 30, 2023, and through the date of the Fund’s financial statements issuance, which require disclosure in the Fund’s financial statements.
PAGE 19 ◾ Dodge & Cox Income Fund
Financial Highlights (unaudited)
Selected data and ratios
(for a share outstanding throughout each period) | | |
| | | | | | |
| | | | | | |
Net asset value, beginning of period | | | | | | |
Income from investment operations: | | | | | | |
| | | | | | |
Net realized and unrealized gain (loss) | | | | | | |
Total from investment operations | | | | | | |
Distributions to shareholders from: | | | | | | |
| | | | | | |
| | | | | | |
| | | | | | |
Net asset value, end of period | | | | | | |
| | | | | | |
Ratios/supplemental data: | | | | | | |
Net assets, end of period (millions) | | | | | | |
Ratio of expenses to average net assets | | | | | | |
Ratio of net investment income to average net assets | | | | | | |
| | | | | | |
Portfolio turnover rate excluding TBA rolls(b) | | | | | | |
| | | | | | |
Net asset value, beginning of period | | | | | | |
Income from investment operations: | | | | | | |
| | | | | | |
Net realized and unrealized gain (loss) | | | | | | |
Total from investment operations | | | | | | |
Distributions to shareholders from: | | | | | | |
| | | | | | |
| | | | | | |
| | | | | | |
Net asset value, end of period | | | | | | |
| | | | | | |
Ratios/supplemental data: | | | | | | |
Net assets, end of period (millions) | | | | | | |
Ratio of expenses to average net assets | | | | | | |
Ratio of expenses to average net assets, before reimbursement by investment manager | | | | | | |
Ratio of net investment income to average net assets | | | | | | |
| | | | | | |
Portfolio turnover rate excluding TBA rolls(b) | | | | | | |
| |
| See Note 1 regarding To-Be-Announced securities |
| For 2022, the period covers 5/2/2022 (commencement of operations) to 12/31/2022 |
See accompanying Notes to Financial Statements
Dodge & Cox Income Fund ◾ PAGE 20
Board Approval of Funds’ Investment Advisory Agreement and Investment Advisory Fees
(unaudited)
On June 1, 2023, the Board of Trustees (the “Board”) of the Dodge & Cox Funds (the “Trust”), including the members of the Board who are not “interested persons” of Dodge & Cox (as such term is defined in the Investment Company Act of 1940) (the “Independent Trustees”), voted to continue the Investment Advisory Agreement between Dodge & Cox and the Trust (the “Advisory Agreement”) in effect for an additional year beginning July 1, 2023 for each series of the Trust (each a “Fund”). Prior to the Board’s vote, the Trust’s Contract Review Committee, consisting solely of Independent Trustees, met with independent counsel to the Independent Trustees on May 8 and June 1, 2023, to discuss whether the Investment Advisory Agreement should be continued. At its June 1 meeting, the Board, including the Independent Trustees, concluded that the Investment Advisory Agreement is fair and reasonable. In considering the Investment Advisory Agreement, the Board, including the Independent Trustees, did not identify any single factor or particular information as all-important or controlling. In reaching the decision to continue the Investment Advisory Agreement in effect, the Board considered several factors, and reached the conclusions, described below:
Nature, Extent and Quality of Services Provided by Dodge & Cox
◾ The Board considered the nature, extent, and quality of the services provided by Dodge & Cox to each Fund under the Advisory Agreement. This consideration included, among other things, Dodge & Cox’s investment process and philosophy; the education and experience of the principal personnel of Dodge & Cox who provide such services; the other resources (including technology) that Dodge & Cox uses in managing the Funds’ portfolios; Dodge & Cox’s record of compliance with the Funds’ investment policies and restrictions and relevant regulatory and tax compliance requirements; and such matters as Dodge & Cox’s business continuity planning and insurance coverage.
◾ The Board concluded that the nature, extent, and quality of the services Dodge & Cox provides are consistent with the terms of the Advisory Agreement and support the recommendation to continue the Advisory Agreement in effect for the coming year.
◾ The Board also took note of the nature, extent, and quality of the broad range of services that Dodge & Cox provides to the Funds and their shareholders under a separate Administrative and Shareholder Services Agreement. Although that Agreement does not require Board approval on an annual basis, the services provided thereunder are an important part of the Funds’ overall relationship with Dodge & Cox, and the Board’s understanding and assessment of those services was a factor in its decision to recommend continuation of the Investment Advisory Agreement.
Investment Performance
◾ The Board reviewed information regarding the total return of each Fund over the most recent 1-, 3-, 5-, 10-, and 20-year periods (or since Fund inception, if shorter). The Board compared these returns to those of the Fund’s broad benchmark index and, for the Stock, International Stock, Global Stock, and Balanced Funds, to those of a relevant value-oriented index. The Board also considered the volatility of the Funds’ investment returns over various time horizons, including both volatility data provided by Broadridge Financial Solutions (“Broadridge”) and longer-term volatility measures presented by Dodge & Cox.
◾ In addition, the Board reviewed a report prepared by Broadridge comparing each Fund’s performance with the performance of other mutual funds in such Fund’s broad Morningstar category (as modified by Broadridge to include only those funds that have similar share class and expense characteristics to such Fund’s, the “Morningstar custom category”), as well as with the performance of a smaller peer group of comparable funds identified by Broadridge (such Fund’s “peer group”). The Board received information regarding the methodology and process underlying the construction of the Morningstar custom categories and peer groups, and any changes in the methodology from prior years. The Board also reviewed a report prepared by Dodge & Cox comparing each Fund’s performance to the composite performance of other accounts (if any) managed by Dodge & Cox using the same investment approach as the Fund. This information regarding the performance of other mutual funds and of other accounts managed by Dodge & Cox provided helpful context for the Board’s evaluation of the Funds’ performance.
◾ The Board concluded that the investment performance and volatility experienced by each Fund were consistent with Dodge & Cox’s long-term, research-driven, bottom-up, active investment style and support the recommendation to continue the Advisory Agreement in effect for an additional year.
Fees and Expense Ratios
◾ The Board reviewed a comparison prepared by Broadridge of the net expense ratio of each Fund (including the separate expense ratios of the two share classes of those Funds that have a dual class structure), and the various elements of those expense ratios, to those of mutual funds in (1) the Fund’s Morningstar custom category and (2) the Fund’s peer group.
◾ For each Fund for which such a comparison is relevant, the Board reviewed information regarding the fee rates Dodge & Cox charges for managing other accounts using the same investment approach as the Fund. The Board took note of the broader scope of services that Dodge & Cox provides to the Funds than to separate accounts and sub-advised funds, as well as differences in regulatory, litigation, and other risks associated with sponsoring a mutual fund as compared to managing separate accounts or sub-advising another
PAGE 21 ◾ Dodge & Cox Income Fund
sponsor’s mutual fund, and certain characteristics of the market for institutional separate account management services.
◾ The Board concluded, after discussion and based on all the relevant information it received, that the advisory fee rate that each Fund pays to Dodge & Cox under the Advisory Agreement is reasonable in relation to the scope and quality of the services that Dodge & Cox provides to such Fund thereunder.
◾ In assessing the Funds’ expense ratios and the fees the Funds pay to Dodge & Cox, the Board took note of and discussed with Dodge & Cox changes over the past several years in the competitive landscape for asset management services. The Board anticipates further changes in the competitive landscape and will continue to monitor and assess the Funds’ competitive position.
Costs of Services Provided and Profits Realized by Dodge & Cox from its Relationship to the Funds
◾ Dodge & Cox informed the Board that it operates as a unified business, with most employees providing services to support the firm and its clients across multiple strategies and/or products. Consequently the firm does not utilize cost accounting to allocate expenses across lines of business or across the Funds for management purposes. Also, the firm is owned exclusively by its senior managers and other active employees, and generally distributes substantially all of its net revenues each year to its employees, either as compensation or as distributions with respect to the shares they own in the firm. Accordingly, it is difficult, and in the Board’s view not especially meaningful, to attempt to calculate a specific profit margin associated with Dodge & Cox’s relationship to any particular Fund.
◾ The Board believes that Dodge & Cox’s commitment to employee ownership of the firm enhances its ability to attract and retain key investment and other management professionals and reinforces a long-term perspective on the management of the firm and the Funds, which the Board believe aligns well with the interests of the Funds and their shareholders.
◾ The Board noted that the employee-shareholders of Dodge & Cox give up a substantial stock value (which would be taxed at long-term capital gains rates) as a consequence of the firm’s independence from outside ownership; the estimated market value of the company is substantially in excess of its book value.
◾ The Board also considered that Dodge & Cox’s fee revenues from the Funds fluctuate from year to year based on changes in the aggregate net assets of the Funds, and that the firm has continued to invest in improved systems, additional compliance resources, and enhanced research capabilities despite these fluctuations.
◾ The Board concluded that Dodge & Cox’s profits are a keystone of its independence, stability, and long-term investment performance.
Economies and Benefits of Scale
◾ The Board considered whether there have been economies or benefits of scale as the Funds have grown over the longer term, and whether fee levels reflect economies of scale for the benefit of Fund investors. In the Board’s view any consideration of economies of scale must take account of the relatively low overall fee and expense structure of the Funds. The Funds generally rank favorably when compared to their Broadridge custom categories and peer groups, on a net expense ratio basis.
◾ Dodge & Cox has built economies of scale into its fee structure by charging relatively low fees at the beginning of operations. A comparison of the Funds’ advisory fee rates to those of many otherwise comparable funds that employ fee “breakpoints” shows that the Funds’ advisory fee rates are in general relatively lower from the first dollar. As a result of their straightforward share class and fee structure and relatively low total expenses, the Funds provide small investors with access to professional, active portfolio management and related services at a reasonable cost. In addition to building economies of scale into its fee rates from the first dollar of each Fund’s assets, Dodge & Cox has capped the expenses borne by certain Funds in their early years of operations when those Funds are not yet operating at scale. The Global Bond Fund has benefited from such an expense cap since its inception in 2014, as has the Emerging Markets Stock Fund since its inception in 2021. Dodge & Cox has agreed to continue expense caps for those Funds, and for the X share class of each of the other Funds, through April 30, 2026.
◾ Over the years, Dodge & Cox has voluntarily forgone opportunities for growth in its assets under management and revenues in order to protect the Funds’ ability to achieve investment returns for shareholders. Dodge & Cox closed the International Stock Fund for a number of years beginning in 2015 and previously closed other Funds and limited the growth of its separate account business during periods of high growth--to Dodge & Cox’s economic detriment--and continues to closely monitor the size of the Funds.
◾ The Board also noted that Dodge & Cox has continued to make additional expenditures on staff and information technology to enable it to enhance its investment processes and to implement effectively the Funds’ strategies. The Board also considered that there may be certain diseconomies of scale associated with managing very large asset pools such as several of the Funds, insofar as certain of the costs or risks associated with managing the Funds potentially increase at a rate that exceeds the rate of asset growth.
Dodge & Cox Income Fund ◾ PAGE 22
Fall-Out Benefits
◾ The Board concluded that “fall-out” benefits derived by Dodge & Cox from its relationship with the Funds are not a significant issue.
Fund Holdings
The Fund provides a complete list of its holdings on a quarterly basis by filing the lists with the SEC on Form N-CSR (as of the end of the second and fourth quarters) and on Part F of Form N-PORT (as of the end of the first and third quarters). Shareholders may view the Fund’s Forms N-CSR and Part F of N-PORT on the SEC’s website at sec.gov. A list of the Fund’s quarter-end holdings is also available at dodgeandcox.com on or about the 15th day following each quarter end and remains available on the website until the list is updated for the subsequent quarter.
Proxy Voting
For a free copy of the Fund's proxy voting policies and procedures, please call 800-621-3979, visit the Fund’s website at dodgeandcox.com, or visit the SEC’s website at sec.gov. Information regarding how the Fund voted proxies relating to portfolio securities during the most recent 12-month period ended June 30 is also available at dodgeandcox.com or shareholders may view the Fund's Form N-PX at sec.gov.
Household Mailings
The Fund routinely mails shareholder reports and summary prospectuses to shareholders and, on occasion, proxy statements. In order to reduce the volume of mail, when possible, only one copy of these documents will be sent to shareholders who are part of the same family and share the same residential address.
If you have a direct account with the Funds and you do not want the mailing of shareholder reports and summary prospectuses combined with other members in your household, contact the Funds at 800-621-3979. Your request will be implemented within 30 days.
PAGE 23 ◾ Dodge & Cox Income Fund
dodgeandcox.com
For Fund literature, transactions, and account
information, please visit the Funds’ website.
or write or call:
Dodge & Cox Funds
P.O. Box 219502
Kansas City, Missouri 64121-9502
(800) 621-3979
Investment Manager
Dodge & Cox
555 California Street, 40th Floor
San Francisco, California 94104
(415) 981-1710
Principal Underwriter
Foreside Fund Services, LLC
3 Canal Plaza, Suite 100
Portland, Maine 04101
(866) 251-6920
This report is submitted for the general information of the shareholders of the Fund. The report is not authorized for distribution to prospective investors in the Fund unless it is accompanied by a current prospectus.
This report reflects our views, opinions, and portfolio holdings as of June 30, 2023, the end of the reporting period. Any such views are subject to change at any time based upon market or other conditions and Dodge & Cox disclaims any responsibility to update such views. These views may not be relied on as investment advice and, because investment decisions for a Dodge & Cox Fund are based on numerous factors, may not be relied on as an indication of trading intent on behalf of any Dodge & Cox Fund.
Global Bond Fund | Class I (dodlx) | Class X (doxlx)
ESTABLISHED 2014
06/23 GBF SAR Printed on recycled paper 
To Our Shareholders (unaudited)
The Dodge & Cox Global Bond Fund—Class I had a total return of 5.27% for the six-month period ended June 30, 2023, compared to a return of 2.96% for the Bloomberg Global Aggregate Bond Index USD Hedged (Bloomberg Global Agg).1
Market Commentary
Following the significant rise in government bond yields across almost every major economy in 2022, nuanced and varied market movements in the first half of 2023 have created an attractive environment for bottom-up active investors like Dodge & Cox. During the first six months of 2023, the Fund delivered a high total return of 5.27%, significantly outperforming the Bloomberg Global Agg by 2.31 percentage points.
In the first half of 2023, inflation generally fell from peak levels in most developed markets, but monetary policies and economic conditions varied. In the United States, inflation has remained well above the Federal Reserve’s target. Economic growth and labor market resilience were stronger than expected, despite the U.S. regional banking crisis in March. While the Fed paused its interest rate hikes in June, it indicated tightening is likely to continue. U.S. 10-year Treasury yields ended the first half of the year largely unchanged at 3.8%, but fluctuated between a high of 4.1% in March and a low of 3.3% in April.
Central banks in Europe also increased policy rates, in some cases to levels not seen in over a decade, as they navigated the challenging environment of high inflation, slowing economic activity, and the impacts of the Russia-Ukraine war. Meanwhile, Japan remains a notable outlier: the central bank has maintained a negative policy rate as well as other accommodative monetary policies. Inflation in Japan, which has been above 3%, is near multi-decade highs, and the yen is near multi-decade lows against the U.S. dollar. China is another outlier, as its central bank has intensified monetary easing in the face of a stalling post-pandemic recovery.
Although inflation is often viewed as a higher risk for emerging markets, some of those countries show decelerating inflation. Central banks in Brazil and Mexico were earlier and more aggressive in monetary tightening than developed market counterparts, and these countries are now holding interest rates steady or even expected to reduce them. However, other emerging markets have not fared as well. For example, inflation in countries like Argentina and Turkey (neither of which are exposures in the Fund) is running at triple and double digits, respectively.
The combination of economic uncertainty, banking system shocks, and political uncertainties spurred volatility in global credit spreads during the first half of 2023. The failure of Silicon Valley Bank in the United States, combined with the takeover of Credit Suisse in Europe, led to a sharp rise in credit spreads in March. As fears of a systemic banking crisis and a U.S. debt ceiling crisis abated, however, this selloff reversed course. Overall, global credit spreads declined during the period, led by the lower-rated (including below investment-grade) segments of the market.
Over the first half of the year, the U.S. dollar depreciated modestly, while the performance of individual currencies varied widely. The Colombian peso, Mexican peso, and Brazilian real—all held in the Fund—appreciated by 16%, 14%, and 10%, respectively.
These currencies benefited from proactive central banks as well as undervalued starting valuations. Conversely, continuing low interest rates in Japan contributed to the yen depreciating by 10%, and the currencies of several emerging markets facing political and/or economic stress depreciated markedly.
Investment Strategy
The interest rate landscape has changed dramatically over the past two years, with the yield of the Bloomberg Global Agg rising from 1.1% to 3.8%. Over the long run, starting yield is a key contributor to fixed income total returns, improving overall return prospects meaningfully relative to the low-yield environment of years past.
Our Investment Committee has made a number of decisions to navigate the Fund through these volatile market conditions. Our deep bench of Global Industry, Credit, and Macro Analysts enables us to identify attractive risk/reward opportunities across credit, currency, and interest rates. We reduced the Fund’s corporate weighting2 by five percentage points, trimming aggressively before the March volatility, and then took advantage of broad market dislocations in the spring to identify new investment opportunities. Meanwhile, we reduced the Fund’s non-U.S. currency exposure by nearly three percentage points and rotated from emerging market to developed market currencies. The Fund’s overall duration3 remained relatively unchanged.
Credit: Leaning Out and In as Opportunities Shifted
Reflecting our disciplined investment approach, we are consistently focused on weighing risk versus reward within credit. Thus, the market volatility in recent months has led us to make a number of changes in the Fund’s portfolio. After increasing the Fund’s corporate bond exposure by 11 percentage points in 2022, to take advantage of numerous opportunities, we reversed course during the first half of 2023 and reduced the Fund’s corporate bond exposure by five percentage points. Early in the year, when valuations had tightened meaningfully and no longer warranted as large of an exposure, we pruned holdings in several issuers, including T-Mobile US, Cemex, Oracle, and AT&T.4 In March, amidst spread volatility due to regional bank stress, we quickly shifted from trimming credit5 to taking advantage of opportunities. This included selectively adding to a variety of bank holdings, such as Citigroup, HSBC, Bank of America, Wells Fargo, and BNP Paribas. These additions to the Fund proved beneficial as valuations for credit, particularly Financials, recovered quickly. We also initiated positions in four new issuers that our investment team found attractive despite the rise in overall credit market valuations: American Electric Power, Charles Schwab, Foundry JV Holdco, and UBS Group.
We believe our focus on assessing relative value—both across and within asset classes, countries, and issuers—enables us to generate value for our shareholders across market cycles. For example, we increased the Fund’s exposure to Cemex, a Mexico-domiciled cement company, by initiating a position in subordinated (or hybrid) bonds, partially offset by trimming senior bonds. This decision was underpinned by our view that the additional yield offered by the hybrid securities was attractive, particularly given Cemex’s
PAGE 1 ◾ Dodge & Cox Global Bond Fund
deleveraging trajectory and commitment to achieving an upgrade to investment grade. Similarly, after comparing our risk and return views for a number of Colombian assets, we purchased U.S. dollar-denominated Colombia sovereign bonds and reduced Colombian peso-denominated sovereign bonds.
Currency: Disparate Performance Drove Portfolio Shifts
In response to the sharp 8% rise in the broad trade-weighted U.S. dollar6 in 2022 and the opportunities we saw in individual currency pairs, we increased the Fund’s foreign currency exposure to nearly 25% at year-end 2022, its highest level since 2015. But in the first six months of 2023, we reduced the Fund’s foreign currency exposure to 22% by trimming a number of emerging market currency holdings that had performed well and no longer justified their position size. One such example was the Mexican peso, which appreciated almost 14% over the first half of 2023. That said, we remain optimistic about the potential for further appreciation versus the U.S. dollar over our investment horizon.
While price discipline led us to reduce the Fund’s overall foreign currency weight, we made select additions, primarily in developed market currencies that we believed to be undervalued. The Fund’s developed market currency exposure, which is comprised of five currencies, increased from zero at the end of 2019, to 8.0% at the end of 2022, to 9.6% on June 30, 2023. For example, we added to the Norwegian krone, which appears undervalued and is supported by both strong external accounts and AAA-rated government finances.
Rates: More Opportunities in a World of Higher Rates
The Fund’s overall duration is 4.7 years, with the majority of that interest rate exposure from the United States. We expect the Fed will maintain restrictive policies until there is clear progress on inflation or a visible easing in labor markets, and this is likely to be followed by stable or slightly lower interest rates over our investment horizon. However, uncertainty remains. On the one hand, inflation and interest rates may remain higher for longer. Conversely, rates may decline materially if there is a deeper-than-anticipated recession.
For many years, the Fund essentially had no developed market duration exposure outside the United States due to historically low—and even negative yields—in many developed market countries. However, with recent increases in yields, we are beginning to find more opportunities abroad. During the second quarter, for example, we increased the Fund’s UK duration by removing the interest rate hedges on our sterling-denominated credit holdings. While UK 10-year yields reached decade highs amidst stronger than expected growth and inflation data, we believe forthcoming interest rate increases by the Bank of England and a relatively weak growth outlook are likely to drive a decline in yields over our investment horizon.
The Fund remains highly selective in where it takes emerging market duration exposure. We are focused on countries with credible central banks, attractive real yields, and downward trends in inflation. Currently, the Fund’s largest emerging market interest rates exposures are in local government bonds from Mexico, Brazil, and Malaysia. We selectively trimmed duration exposure from Indonesia and Colombia.
In Closing
We are optimistic about the return outlook for the Fund given elevated yield levels, our carefully underwritten credit portfolio, and the array of attractive opportunities for non-U.S. currency and interest rate markets. The Fund offers a powerful combination of diversification, flexibility, and a strong performance track record, and we believe it is positioned to fare well across a broad range of economic scenarios.
Thank you for your continued confidence in Dodge & Cox. As always, we welcome your comments and questions.
For the Board of Trustees, | |
| |
Dana M. Emery,
Chair and President | |
July 31, 2023
| All returns are stated in U.S. dollars, unless otherwise noted. The Funds’ total returns include the reinvestment of dividend and capital gain distributions, but have not been adjusted for any income taxes payable by shareholders on these distributions or on Fund share redemptions. Index returns include dividend and/or interest income but, unlike Fund returns, do not reflect fees or expenses. The Bloomberg Global Aggregate Bond Index is a widely recognized, unmanaged index of multi-currency, investment-grade fixed income securities. Bloomberg calculates a USD hedged return by applying one-month forward rates to seek to eliminate the effect of non- USD exposures. |
| Unless otherwise specified, all weightings include accrued interest and weightings and characteristics are as of June 30, 2023. |
| Duration is a measure of a bond’s (or a bond portfolio’s) price sensitivity to changes in interest rates. |
| The use of specific examples does not imply that they are more or less attractive investments than the Fund’s other holdings. |
| Credit refers to corporate bonds and government-related securities, as classified by Bloomberg, as well as Rio Oil Finance Trust, an asset-backed security that we group as a credit investment. |
| As measured by the Trade-Weighted U.S. Dollar Index, a measure of the value of the United States dollar relative to other world currencies. |
Dodge & Cox Global Bond Fund ◾ PAGE 2
Year-to-Date Performance Review for the Fund's Class I Shares (unaudited)
The Fund returned 5.27% year to date.
Key contributors included the Fund's:
◾ Exposure to interest rates in the United States and several Latin American countries, notably Colombia and Brazil;
◾ High allocation to Corporate bonds (54%), with British American Tobacco, TC Energy, and Telecom Italia among stronger-performing holdings; and
◾ Exposure to several Latin American currencies, notably the Mexican peso, Brazilian real, and Colombian peso.
Key detractors included the Fund's:
◾ Exposure to depreciating currencies, including the Japanese
yen, Norwegian krone, and Malaysian ringgit.
Key Characteristics of Dodge & Cox
Independent Organization
Dodge & Cox is one of the largest privately owned investment managers in the world. We remain committed to independence, with a goal of providing the highest-quality investment management service to our existing clients.
Over 90 Years of Investment Experience
Dodge & Cox was founded in 1930. We have a stable and well-qualified team of investment professionals, most of whom have spent their entire careers at Dodge & Cox.
Experienced Investment Team
The Global Fixed Income Investment Committee, which is the decision-making body for the Global Bond Fund, is a seven-member committee with an average tenure of 20 years at Dodge & Cox.
One Business with a Single Decision-Making Office
Dodge & Cox manages equity (domestic, international, and global), fixed income (domestic and global), and balanced investments, all from one office in San Francisco.
Consistent Investment Approach
Our team decision-making process involves thorough, bottom-up fundamental analysis of each investment.
Long-Term Focus and Low Expenses
We invest with a three- to five-year investment horizon. We manage Funds that maintain low expense ratios.
Risks: The yields and market values of the instruments in which the Fund invests may fluctuate. Accordingly, an investment may be worth more or less than its original cost. Debt securities are subject to interest rate risk, credit risk, and prepayment and call risk, all of which could have adverse effects on the value of the Fund. A low interest rate environment creates an elevated risk of future negative returns. Financial intermediaries may restrict their market making activities for certain debt securities, which may reduce the liquidity and increase the volatility of such securities. Investing in non-U.S. securities may entail risk due to foreign economic and political developments; this risk may be increased when investing in emerging markets. The Fund is also subject to currency risk. Please read the prospectus and summary prospectus for specific details regarding the Fund's risk profile.
Fund holdings and sector allocations are subject to change at any time and should not be considered recommendations to buy or sell any security. Please see the Portfolio of Investments section in this report for a complete list of fund holdings.
PAGE 3 ◾ Dodge & Cox Global Bond Fund
Growth of $10,000 Over 10 Years (unaudited)
For an Investment Made on June 30, 2013 
Average Annual Total Return
For Periods Ended June 30, 2023
| | | | |
Dodge & Cox Global Bond Fund | | | | |
| | | | |
| | | | |
Bloomberg Global Aggregate Bond Index (USD Hedged) | | | | |
Expense Ratios
Per the Prospectus Dated May 1, 2023
| | |
Dodge & Cox Global Bond Fund | | |
| | |
| | |
| The Class X shares inception date is May 2, 2022. The returns shown prior to that date are for the Class I shares. |
| Dodge & Cox has contractually agreed to reimburse the Fund for all ordinary expenses to the extent necessary to maintain Total Annual Fund Operating Expenses of the Class I shares at 0.45% and the Class X shares at 0.37% until April 30, 2026. These agreements cannot be terminated prior to April 30, 2026 other than by resolution of the Fund’s Board of Trustees. For purposes of the foregoing, ordinary expenses shall not include nonrecurring shareholder account fees, fees and expenses associated with Fund shareholder meetings, fees on portfolio transactions such as exchange fees, dividends and interest on short positions, fees and expenses of pooled investment vehicles that are held by the Fund, interest expenses and other fees and expenses related to any borrowings, taxes, brokerage fees and commissions and other costs and expenses relating to the acquisition and disposition of Fund investments, other expenditures which are capitalized in accordance with generally accepted accounting principles, and other nonroutine expenses or extraordinary expenses not incurred in the ordinary course of the Fund’s business, such as litigation expenses. The term of the agreement will automatically renew for subsequent three-year terms unless terminated with at least 30 days’ written notice by either party prior to the end of the then-current term. The agreement does not permit Dodge & Cox to recoup any fees waived or payments made to the Fund for a prior year. |
Returns represent past performance and do not guarantee future results. Investment return and share price will fluctuate with market conditions, and investors may have a gain or loss when shares are sold. Fund performance changes over time and currently may be significantly lower than stated. Performance is updated and published monthly. Visit the Fund's website at dodgeandcox.com or call 800-621-3979 for current performance figures.
A private fund managed and funded by Dodge & Cox (the "Private Fund") was reorganized into the Fund and the Fund commenced operations on May 1, 2014. The Private Fund commenced operations on December 5, 2012 and had an investment objective, policies, and strategies that were, in all material respects, the same as those of the Fund, and was managed in a manner that, in all material respects, complied with the investment guidelines and restrictions of the Fund. However, the Private Fund was not registered as an investment company under the Investment Company Act of 1940 (the "1940 Act"), and therefore was not subject to certain investment limitations, diversification requirements, liquidity requirements, and other restrictions imposed by the 1940 Act and the Internal Revenue Code, which, if applicable, may have adversely affected its performance.
The Fund's total returns include the reinvestment of dividend and capital gain distributions, but have not been adjusted for any income taxes payable by shareholders on these distributions or on Fund share redemptions. Index returns include interest income but, unlike Fund returns, do not reflect fees or expenses. The Bloomberg Global Aggregate Bond Index (Bloomberg Global Agg) is a widely recognized, unmanaged index of multi-currency, investment-grade fixed income securities. Bloomberg calculates a USD hedged return by applying one-month forward rates to seek to eliminate the effect of non-USD exposures.
Bloomberg is a registered trademark of Bloomberg Finance L.P. and its affiliates. For more information about this index, visit: www.dodgeandcox.com/globalbondfund
Dodge & Cox Global Bond Fund ◾ PAGE 4
Portfolio Information (unaudited) June 30, 2023
Five Largest Countries(b),(c) | |
| |
| |
| |
| |
| |
| Net Cash & Other includes cash, short-term investments, unrealized gain (loss) on derivatives, receivables, and payables. |
| The Fund usually classifies a company or issuer based on its country of risk, but may designate a different country in certain circumstances. |
| Excludes currency and interest rate derivatives. |
Fund Expense Example (unaudited)
As a Fund shareholder, you incur ongoing Fund costs, including management fees and other Fund expenses. All mutual funds have ongoing costs, sometimes referred to as operating expenses. The following example shows ongoing costs of investing in the Fund and can help you understand these costs and compare them with those of other mutual funds. The example assumes a $1,000 investment held for the six months indicated.
Actual Expenses
The first line of each share class in the table below provides information about actual account values and expenses based on the actual returns of the share class. You may use the information in this line, together with your account balance, to estimate the expenses that you paid over the period. Simply divide your account value by $1,000 (for example, an $8,600 account value divided by $1,000 = 8.6), then multiply the result by the number in the first line under the heading “Expenses Paid During Period” to estimate the expenses you paid on your account during this period.
Hypothetical Example for Comparison with Other Mutual Funds
Information on the second line of each share class in the table can help you compare ongoing costs of investing in the Fund with those of other mutual funds. This information may not be used to estimate the actual ending account balance or expenses you paid during the period. The hypothetical “Ending Account Value” is based on the actual expense ratio of the share class and an assumed 5% annual rate of return before expenses (not the actual return of the share class). The amount under the heading “Expenses Paid During Period” shows the hypothetical expenses your account would have incurred under this scenario. You can compare this figure with the 5% hypothetical examples that appear in shareholder reports of other mutual funds.
Six Months Ended
June 30, 2023 | Beginning Account Value
1/1/2023 | Ending Account Value
6/30/2023 | Expenses Paid
During Period* | |
| | | | |
| | | | |
Based on hypothetical 5% yearly return | | | | |
| | | | |
| | | | |
Based on hypothetical 5% yearly return | | | | |
| Expenses are equal to the annualized expense ratio, multiplied by the average account value over the period, multiplied by 181/365 (to reflect the one-half year period). |
The expenses shown in the table highlight ongoing costs only and do not reflect any transactional fees or account maintenance fees. Though other mutual funds may charge such fees, please note that the Fund does not charge transaction fees (e.g., redemption fees, sales loads) or universal account maintenance fees (e.g., small account fees).
PAGE 5 ◾ Dodge & Cox Global Bond Fund
Consolidated Portfolio of Investments (unaudited) June 30, 2023
|
| | | |
|
Brazil Government (Brazil) | | |
| | | |
| | | |
| | | |
Colombia Government (Colombia) | | |
| | | |
| | | |
Hungary Government (Hungary) | | |
| | | |
Indonesia Government (Indonesia) | | |
| | | |
| | |
| | | |
Malaysia Government (Malaysia) | | |
| | | |
| | | |
Mexico Government (Mexico) | | |
| | | |
| | | |
| | | |
Norway Government (Norway) | | |
| | | |
| | |
| | | |
South Africa Government (South Africa) | | |
| | | |
South Korea Government (South Korea) | | |
| | | |
U.S. Treasury Note/Bond (United States) | | |
| | | |
| | | |
| | | |
| | | |
| | | |
| | | |
|
Chicago Transit Authority RB (United States) | | |
| | | |
| | | |
Colombia Government (Colombia) | | |
| | | |
| | | |
| | | |
| | | |
Indonesia Government (Indonesia) | | |
| | | |
Kommuninvest Cooperative Society (Sweden) | | |
| | | |
New South Wales Treasury Corp (Australia) | | |
| | | |
Petroleo Brasileiro SA (Brazil) | | |
| | | |
| | | |
| | | |
Petroleos Mexicanos (Mexico) | | |
| | | |
| | | |
|
| | | |
| | | |
State of Illinois GO (United States) | | |
| | | |
| | | |
|
|
|
Rio Oil Finance Trust (Brazil) | | |
| | | |
| | | |
| | | |
| | | |
|
Navient Student Loan Trust (United States) | | |
| |
| | | |
| | | |
| | | |
| | | |
Navient Student Loan Trust (Private Loans) (United States) | | |
| | | |
| | | |
SLM Student Loan Trust (United States) | | |
| |
| | | |
| |
+0.11% 5.662%, 12/15/32(b) | | | |
+0.45% 6.002%, 12/15/32(b) | | | |
| | | |
SMB Private Education Loan Trust (Private Loans) (United States) | | |
Series 2017-B A2A, 2.82%, | | | |
| | | |
Series 2021-A APT2, 1.07%, | | | |
| | | |
| | | |
| | | |
| | | |
|
|
Freddie Mac Military Housing Trust Multifamily (United States) | | |
| | | |
| | | |
| | | |
|
Federal Agency CMO & REMIC: 0.9% |
Fannie Mae (United States) | | |
Trust 2004-W9 1A3, 6.05%, 2/25/44 | | | |
Freddie Mac (United States) | | |
See accompanying Notes to Consolidated Financial StatementsDodge & Cox Global Bond Fund ◾ PAGE 6
Consolidated Portfolio of Investments (unaudited) June 30, 2023
Debt Securities (continued) |
| | | |
| | | |
| | | |
Ginnie Mae (United States) | | |
Series 2010-169 JZ, 4.00%, 12/20/40 | | | |
Series 2014-184 GZ, 3.50%, 12/20/44 | | | |
United States 30 Day Average SOFR | |
+0.85% Series 2023-H04 FC, 5.916%, 1/20/73 | | | |
| | | |
Federal Agency Mortgage Pass-Through: 12.0% |
Fannie Mae, 15 Year (United States) |
| | | |
Fannie Mae, 30 Year (United States) |
| | | |
| | | |
| | | |
| | | |
| | | |
| | | |
| | | |
Fannie Mae, 40 Year (United States) |
| | | |
Fannie Mae, Hybrid ARM (United States) |
| | | |
Freddie Mac, Hybrid ARM (United States) |
| | | |
| | | |
| | | |
Freddie Mac Gold, 30 Year (United States) |
| | | |
| | | |
Freddie Mac Pool, 30 Year (United States) |
| | | |
| | | |
| | | |
| | | |
| | | |
|
| |
Bank of America Corp. (United States) | | |
| | | |
| | | |
| | | |
| | | |
Barclays PLC (United Kingdom) | | |
| | | |
| | | |
| | | |
| | | |
| | | |
| | | |
| | |
| | | |
| | | |
| | | |
| | | |
Boston Properties, Inc. (United States) | | |
| | | |
| | | |
|
| | | |
| | | |
| | | |
Capital One Financial Corp. (United States) | | |
| | | |
| | | |
| | | |
| | | |
| | | |
Charles Schwab Corp. (United States) | | |
| | | |
| | | |
Citigroup, Inc. (United States) | | |
| | | |
| | | |
| | | |
| |
| | | |
Goldman Sachs Group, Inc. (United States) | | |
| | | |
HSBC Holdings PLC (United Kingdom) | | |
| | | |
| | | |
| | | |
| | | |
| | | |
JPMorgan Chase & Co. (United States) | | |
| | | |
| | | |
| | | |
| | | |
| | | |
Lloyds Banking Group PLC (United Kingdom) | | |
| | | |
| | | |
| | | |
| | | |
NatWest Group PLC (United Kingdom) | | |
| | | |
| | | |
| | | |
| | | |
Navient Corp. (United States) | | |
| | | |
UBS Group AG (Switzerland) | | |
| | | |
| | |
| | | |
Wells Fargo & Co. (United States) | | |
| | | |
| | | |
| | | |
| | | |
| | | |
| | | |
| | | |
| |
Altria Group, Inc. (United States) | | |
| | | |
PAGE 7 ◾ Dodge & Cox Global Bond FundSee accompanying Notes to Consolidated Financial Statements
Consolidated Portfolio of Investments (unaudited) June 30, 2023
Debt Securities (continued) |
| | | |
AT&T, Inc. (United States) | | |
| | | |
| | | |
| | |
3.125%, 11/12/79(c)(e)(f) | | | |
| | | |
British American Tobacco PLC (United Kingdom) | | |
| | | |
| | |
| | | |
| | | |
Charter Communications, Inc. (United States) | | |
| | | |
| | | |
| | | |
| | | |
CVS Health Corp. (United States) | | |
| | | |
Elanco Animal Health, Inc. (United States) | | |
| | | |
Ford Motor Credit Co. LLC(h) (United States) | | |
| | | |
| | | |
| | | |
| | | |
| | | |
| | | |
| | | |
Foundry JV Holdco LLC(h) (United States) | | |
| | | |
GE HealthCare Technologies, Inc. (United States) | | |
| | | |
| | | |
Grupo Televisa SAB (Mexico) | | |
| | | |
| | | |
HCA Healthcare, Inc. (United States) | | |
| | | |
Holcim, Ltd. (Switzerland) | | |
| | | |
| | | |
| | | |
Imperial Brands PLC (United Kingdom) | | |
| | | |
Kinder Morgan, Inc. (United States) | | |
| | | |
| | | |
| | | |
Millicom International Cellular SA (Guatemala) | | |
| | | |
MTN Group, Ltd. (South Africa) | | |
| | | |
News Corp. (United States) | | |
| | | |
Occidental Petroleum Corp. (United States) | | |
| | | |
|
| | | |
| | |
| | | |
| | | |
| | | |
| | | |
| | | |
QVC, Inc.(h) (United States) | | |
| | | |
| | |
| | | |
| | | |
| | | |
| | | |
| | | |
Telecom Italia SPA (Italy) | | |
| | | |
| | | |
| | | |
The Williams Companies, Inc. (United States) | | |
| | | |
| | | |
T-Mobile U.S., Inc. (United States) | | |
| | | |
| | | |
Ultrapar Participacoes SA (Brazil) | | |
| | | |
| | | |
VMware, Inc. (United States) | | |
| | | |
Vodafone Group PLC (United Kingdom) | | |
| | | |
| | | |
| | | |
| |
American Electric Power Co., Inc (United States) | | |
| | | |
Dominion Energy (United States) | | |
| | | |
| | | |
| | |
| | | |
| | | |
NextEra Energy, Inc. (United States) | | |
| | | |
| | | |
| | | |
The Southern Co. (United States) | | |
| | | |
| | | |
| | | |
| | | |
| | | |
Total Debt Securities
(Cost $2,092,535,005) | | | |
See accompanying Notes to Consolidated Financial StatementsDodge & Cox Global Bond Fund ◾ PAGE 8
Consolidated Portfolio of Investments (unaudited) June 30, 2023
Short-Term Investments: 3.4% |
| | | |
Repurchase Agreements: 3.0% |
Fixed Income Clearing 2.45%, dated 6/30/23,
due 7/3/23, maturity value $8,170,668 | | | |
Fixed Income Clearing 5.04%, dated 6/30/23,
due 7/3/23, maturity value $52,021,840 | | | |
| | | |
|
State Street Institutional U.S. Government Money Market Fund - Premier Class
| | | |
Total Short-Term Investments
(Cost $68,163,482) | |
Total Investments in Securities
(Cost $2,160,698,487) | | | |
Other Assets Less Liabilities | | | |
| | | |
| |
| Security exempt from registration under Rule 144A of the Securities Act of 1933. The security may be resold in transactions exempt from registration, normally to qualified institutional buyers. |
| Security exempt from registration pursuant to Regulation S under the Securities Act of 1933, as amended. Regulation S securities are subject to restrictions on resale in the United States. |
| Variable rate security: interest rate is determined by the interest rates of underlying pool of assets that collateralize the security. The interest rate of the security may change due to a change in the interest rates or the composition of underlying pool of assets. The interest rate shown is the rate as of period end. |
| Variable rate security: fixed-to-float security pays an initial fixed interest rate and will pay a floating interest rate established at a predetermined time in the future. The interest rate shown is the rate as of period end. |
| Hybrid security: characteristics of both a debt and equity security. |
| Perpetual security: no stated maturity date. |
| Subsidiary. Security may be issued by parent company or one of its subsidiaries. (see below) |
| Repurchase agreement is collateralized by U.S. Treasury Notes 1.125%-4.25%, 10/15/25-8/15/40. Total collateral value is $61,372,477. |
| Debt securities are grouped by parent company unless otherwise noted. Actual securities may be issued by the listed parent company or one of its subsidiaries.
The Fund usually classifies a company or issuer based on its country of risk, but may designate a different country in certain circumstances. |
| Debt securities with floating interest rates are linked to the referenced benchmark; the interest rate shown is the rate as of period end. |
| |
ARM: Adjustable Rate Mortgage |
CMBS: Commercial Mortgage-Backed Security |
CMO: Collateralized Mortgage Obligation |
|
|
REMIC: Real Estate Mortgage Investment Conduit |
SOFR: Secured Overnight Financing Rate |
|
|
|
|
|
|
|
|
|
|
|
|
|
|
USD: United States Dollar |
|
PAGE 9 ◾ Dodge & Cox Global Bond FundSee accompanying Notes to Consolidated Financial Statements
Consolidated Portfolio of Investments (unaudited) June 30, 2023
Futures Contracts
| | | | Value /
Unrealized
Appreciation/
(Depreciation) |
Euro-Bobl Future— Short Position | | | | |
Euro-Bund Future— Short Position | | | | |
| | | | |
Currency Forward Contracts
| | | | Unrealized Appreciation
(Depreciation) |
|
| | | | | | |
| | | | | | |
| | | | | | |
| | | | | | |
|
| | | | | | |
| | | | | | |
|
| | | | | | |
| | | | | | |
| | | | | | |
| | | | | | |
| | | | | | |
|
| | | | | | |
|
| | | | | | |
| | | | | | |
| | | | | | |
| | | | | | |
| | | | | | |
Unrealized gain on currency forward contracts | | | |
Unrealized loss on currency forward contracts | | | |
Net unrealized gain on currency forward contracts | | | | |
The listed counterparty may be the parent company or one of its subsidiaries.
See accompanying Notes to Consolidated Financial StatementsDodge & Cox Global Bond Fund ◾ PAGE 10
Consolidated
Statement of Assets and Liabilities (unaudited)
| |
|
Investments in securities, at value (cost $2,160,698,487) | |
Unrealized appreciation on currency forward contracts | |
Cash pledged as collateral for currency forward contracts | |
| |
Cash denominated in foreign currency (cost $10,608) | |
Deposits with broker for futures contracts | |
Receivable for investments sold | |
Receivable for Fund shares sold | |
Dividends and interest receivable | |
Expense reimbursement receivable | |
Prepaid expenses and other assets | |
| |
|
Unrealized depreciation on currency forward contracts | |
Cash received as collateral for currency forward contracts | |
Payable for variation margin for futures contracts | |
Payable for investments purchased | |
Payable for Fund shares redeemed | |
Deferred foreign capital gains tax | |
| |
| |
| |
| |
|
| |
| |
| |
|
| |
Shares outstanding (par value $0.01 each, unlimited shares authorized) | |
Net asset value per share | |
|
| |
Shares outstanding (par value $0.01 each, unlimited shares authorized) | |
Net asset value per share | |
Consolidated
Statement of Operations (unaudited)
| Six Months Ended
June 30, 2023 |
| |
| |
Interest (net of foreign taxes of $3,842) | |
| |
| |
| |
Administrative services fees | |
| |
| |
Custody and fund accounting fees | |
| |
| |
| |
| |
| |
| |
Expenses reimbursed by investment manager | |
| |
| |
Realized and Unrealized Gain (Loss): | |
| |
Investments in securities (net of foreign capital gains tax of $21,011) | |
| |
Currency forward contracts | |
Foreign currency transactions | |
Net change in unrealized appreciation/depreciation | |
Investments in securities (net of change in deferred foreign capital gains tax of $11,784) | |
| |
Currency forward contracts | |
Foreign currency translation | |
Net realized and unrealized gain | |
Net Change in Net Assets From Operations | |
PAGE 11 ◾ Dodge & Cox Global Bond FundSee accompanying Notes to Consolidated Financial Statements
Consolidated
Statement of Changes in Net Assets (unaudited)
| | |
| | |
| | |
| | |
| | |
Net change in unrealized appreciation/depreciation | | |
| | |
Distributions to Shareholders: | | |
| | |
| | |
| | |
| | |
| | |
Proceeds from sales of shares | | |
Reinvestment of distributions | | |
| | |
| | |
Proceeds from sales of shares | | |
Reinvestment of distributions | | |
| | |
Net change from Fund share transactions | | |
Total change in net assets | | |
| | |
| | |
| | |
| | |
| | |
| | |
| | |
| | |
Net change in shares outstanding | | |
| | |
| | |
| | |
| | |
Net change in shares outstanding | | |
See accompanying Notes to Consolidated Financial StatementsDodge & Cox Global Bond Fund ◾ PAGE 12
Notes to Consolidated Financial Statements (unaudited)
Note 1: Organization and Significant Accounting Policies
Dodge & Cox Global Bond Fund (the “Fund”) is one of the series constituting the Dodge & Cox Funds (the “Trust” or the “Funds”). The Trust is organized as a Delaware statutory trust and is registered under the Investment Company Act of 1940, as amended, as an open-end management investment company. The Fund commenced operations on May 1, 2014, and seeks a high rate of total return consistent with long-term preservation of capital. Foreign investing, especially in developing countries, has special risks such as currency and market volatility and political and social instability. These and other risk considerations are discussed in the Fund’s Prospectus.
On May 1, 2022, the then-outstanding shares of the Fund were redesignated as Class I Shares, and Class X shares of the Fund were established. The share classes have different eligibility requirements and expense structures due to differing shareholder servicing arrangements. The share classes have the same rights as to redemption, dividends and liquidation proceeds, and voting privileges, except that each class has the exclusive right to vote on matters affecting only its class.
The Fund is an investment company and follows the accounting and reporting guidance issued in Topic 946 by the Financial Accounting Standards Board. The financial statements have been prepared in conformity with accounting principles generally accepted in the United States of America, which require the use of estimates and assumptions by management. Actual results may differ from those estimates. Significant accounting policies are as follows:
Security valuation The Fund’s net assets are normally valued as of the scheduled close of trading on the New York Stock Exchange (NYSE), generally 4 p.m. Eastern Time, each day that the NYSE is open for business.
Debt securities are valued using prices received from independent pricing services which utilize dealer quotes, recent transaction data, pricing models, and other inputs to arrive at market-based valuations. Pricing models may consider quoted prices for similar securities, interest rates, cash flows (including prepayment speeds), and credit risk. Exchange-traded derivatives are valued at the settlement price determined by the relevant exchange. Short-term securities less than 60 days to maturity may be valued at amortized cost if amortized cost approximates current value. Mutual funds are valued at their respective net asset values. Security values are not discounted based on the size of the Fund’s position and may differ from the value a Fund receives upon sale of the securities.
Investments initially valued in currencies other than the U.S. dollar are converted to the U.S. dollar using prevailing exchange rates. Currency forward contracts are valued based on the prevailing forward exchange rates of the underlying currencies. As a result, the Fund’s net assets may be affected by changes in the value of currencies in relation to the U.S. dollar.
If market quotations are not readily available or if normal valuation procedures produce valuations that are deemed unreliable or inappropriate under the circumstances existing at the time, the investment will be valued at fair value as determined in good faith by Dodge & Cox. The Board of Trustees has appointed Dodge & Cox, the Fund’s investment manager, as its "valuation designee", as permitted
by Rule 2a-5 under the Investment Company Act of 1940, to make fair value determinations in accordance with the Dodge & Cox Funds Valuation Policies (“Valuation Policies”), subject to Board oversight. Dodge & Cox has established a Pricing Committee that is comprised of representatives from Treasury, Legal, Compliance, and Operations. The Pricing Committee is responsible for implementing the Valuation Policies, including determining the fair value of securities and other investments when necessary. The Pricing Committee considers relevant indications of value that are reasonably available to it in determining the fair value assigned to a particular security, such as the value of similar financial instruments, trading volumes, contractual restrictions on disposition, related corporate actions, and changes in economic conditions. In doing so, the Pricing Committee employs various methods for calibrating fair valuation approaches, including a regular review of key inputs and assumptions, back-testing, and review of any related market activity.
Valuing securities through a fair value determination involves greater reliance on judgment than valuation of securities based on readily available market quotations. In some instances, lack of information and uncertainty as to the significance of information may lead to a conclusion that a prior valuation is the best indication of a security’s value. When fair value pricing is employed, the prices of securities used by the Fund to calculate its net asset value may differ from quoted or published prices for the same securities.
Security transactions, investment income, expenses, and distributions Security transactions are recorded on the trade date. Realized gains and losses on securities sold are determined on the basis of identified cost.
Interest income is recorded on the accrual basis. Interest income includes coupon interest, amortization of premium and accretion of discount on debt securities, gain/loss on paydowns, and inflation adjustments to the principal amount of inflation-indexed securities. The ability of the issuers of the debt securities held by the Fund to meet their obligations may be affected by economic developments in a specific industry, state, region, or country. Debt obligations may be placed on non-accrual status and related interest income may be reduced by ceasing current accruals and writing off interest receivables when the collection of all or a portion of interest has become doubtful. A debt obligation is removed from non-accrual status when the issuer resumes interest payments or when collectability of interest is reasonably assured. Dividend income is recorded on the ex-dividend date.
Expenses are recorded on the accrual basis. Some expenses of the Trust can be directly attributed to a specific series. Expenses which cannot be directly attributed are allocated among the Funds in the Trust using methodologies determined by the nature of the expense.
Distributions to shareholders are recorded on the ex-dividend date.
Share class accounting Investment income, realized and unrealized gains and losses and expenses, other than class-specific expenses, are allocated to each share class of the Fund based upon the proportion of net assets of each class.
PAGE 13 ◾ Dodge & Cox Global Bond Fund
Notes to Consolidated Financial Statements (unaudited)
Foreign taxes The Fund is subject to foreign taxes which may be imposed by certain countries in which the Fund invests. The Fund endeavors to record foreign taxes based on applicable foreign tax law. Withholding taxes are incurred on certain foreign receipts and are accrued at the time the associated interest income is recorded.
Capital gains taxes are incurred upon disposition of certain foreign securities. Expected capital gains taxes on appreciated securities, if any, are accrued as unrealized losses and incurred capital gains taxes are reflected as realized losses upon the sale of the related security. Currency taxes may be incurred when the Fund purchases certain foreign currencies related to securities transactions and are recorded as realized losses on foreign currency transactions.
Foreign currency translation The books and records of the Fund are maintained in U.S. dollars. Foreign currency amounts are translated into U.S. dollars at the prevailing exchange rates of such currencies against the U.S. dollar. The market value of investment securities and other assets and liabilities are translated at the exchange rate as of the valuation date. Purchases and sales of investment securities, income, and expenses are translated at the exchange rate prevailing on the transaction date.
Reported realized and unrealized gain (loss) on investments include foreign currency gain (loss) related to investment transactions.
Reported realized and unrealized gain (loss) on foreign currency transactions and translation include the following: holding/disposing of foreign currency, the difference in exchange rate between the trade and settlement dates on securities transactions, the difference in exchange rate between the accrual and payment dates on interest, and currency losses on the purchase of foreign currency in certain countries that impose taxes on such transactions.
Repurchase agreements Repurchase agreements are transactions under which a Fund purchases a security from a counterparty and agrees to resell the security to that counterparty on a specified future date at the same price, plus a specified interest rate. The Fund’s repurchase agreements are secured by U.S. government or agency securities. It is the Fund’s policy that its regular custodian or third party custodian take possession of the underlying collateral securities, the fair value of which exceeds the principal amount of the repurchase transaction, including accrued interest, at all times. In the event of default by the counterparty, the Fund has the contractual right to liquidate the collateral securities and to apply the proceeds in satisfaction of the obligation.
To-Be-Announced securities The Fund may purchase mortgage-related securities on a to-be-announced (“TBA”) basis at a fixed price, with payment and delivery on a scheduled future date beyond the customary settlement period for such securities. The Fund may choose to extend the settlement through a “dollar roll” transaction in which it sells the mortgage-related securities to a dealer and simultaneously agrees to purchase similar securities for future delivery at a predetermined price. The Fund accounts for TBA dollar rolls as purchase and sale transactions.
The Fund may also enter into a Master Securities Forward Transaction Agreement ("MSFTA") with a counterparty to govern transactions of delayed delivery securities, including TBA securities. The
MSFTA provides for collateralization requirements and the right to offset amounts due to or from counterparties under specified conditions.
Consolidation The Fund may invest in certain securities through its wholly owned subsidiary, Dodge & Cox Global Bond Fund Cayman, Ltd. (the “Subsidiary”). The Subsidiary is a Cayman Islands exempted company and invests in certain securities consistent with the investment objective of the Fund. The Fund’s Consolidated Financial Statements, including the Consolidated Portfolio of Investments, consist of the holdings and accounts of the Fund and the Subsidiary. All intercompany transactions and balances have been eliminated. At June 30, 2023, the Subsidiary had net assets of $100, which represented less than 0.01% of the Fund’s consolidated net assets.
Indemnification Under the Trust’s organizational documents, its officers and trustees are indemnified against certain liabilities arising out of the performance of their duties to the Trust. In addition, in the normal course of business the Trust enters into contracts that provide general indemnities to other parties. The Trust’s maximum exposure under these arrangements is unknown, as this would involve future claims that may be made against the Trust that have not yet occurred.
Note 2: Valuation Measurements
Various inputs are used in determining the value of the Fund’s investments. These inputs are summarized in the three broad levels below.
◾ Level 1: Unadjusted quoted prices in active markets for identical securities
◾ Level 2: Other significant observable inputs (including quoted prices for similar securities, market indices, interest rates, credit risk, forward exchange rates, etc.)
◾ Level 3: Significant unobservable inputs (including Fund management’s assumptions in determining the fair value of investments)
The inputs or methodology used for valuing securities are not necessarily an indication of the risk associated with investing in those securities.
The following is a summary of the inputs used to value the Fund’s holdings at June 30, 2023:
| | LEVEL 2
(Other Significant
Observable Inputs) |
|
|
| | |
| | |
| | |
| | |
|
| | |
| | |
| | |
|
|
| | |
Dodge & Cox Global Bond Fund ◾ PAGE 14
Notes to Consolidated Financial Statements (unaudited)
| | LEVEL 2 (Other Significant Observable Inputs) |
Currency Forward Contracts |
| | |
| | |
Note 3: Derivative Instruments
The Fund may use derivatives either to minimize the impact of certain risks to one or more of its investments (as a ‘‘hedging technique’’) or to implement its investment strategy. A derivative is a financial instrument whose value is derived from a security, currency, interest rate, index, or other financial instrument.
Futures contracts Futures contracts involve an obligation to purchase or sell (depending on whether the Fund has entered a long or short futures contract, respectively) an asset at a future date, at a price set at the time the contract is purchased. Futures contracts are exchange-traded. Upon entering into a futures contract, the Fund is required to deposit an amount of cash or liquid assets (referred to as "initial margin") in a segregated account with the clearing broker to secure the Fund's obligation to perform. Initial margin is returned to the Fund when the futures contract is closed. Subsequent payments (referred to as "variation margin") are made to or received from the clearing broker on a daily basis based on changes in the market value of the contract. Changes in the market value of open futures contracts are recorded as unrealized appreciation or depreciation in the Consolidated Statement of Operations. Realized gains and losses on futures contracts are recorded in the Consolidated Statement of Operations at the closing or expiration of the contracts. Cash deposited with a broker as initial margin is recorded in the Consolidated Statement of Assets and Liabilities. A receivable and/or payable to brokers for daily variation margin is also recorded in the Consolidated Statement of Assets and Liabilities.
Investments in futures contracts may include certain risks, which may be different from, and potentially greater than, those of the underlying securities. To the extent the Fund uses futures, it is exposed to additional volatility and potential losses resulting from leverage.
The Fund used long and short government debt futures contracts to adjust the overall interest rate exposure and duration of the portfolio.
Currency forward contracts Currency forward contracts are agreements to purchase or sell a specific currency at a specified future date and price. Currency forward contracts are traded over-the-counter. The values of currency forward contracts change daily based on the prevailing forward exchange rates of the underlying currencies. Changes in the value of open contracts are recorded as unrealized appreciation or depreciation in the Consolidated Statement of Operations. When a currency forward contract is closed, the Fund records a realized gain or loss in the Consolidated Statement of Operations equal to the difference between the value at the time the contract was opened and the value at the time it was closed.
Losses from these transactions may arise from unfavorable changes in currency values or if a counterparty does not perform under a contract’s terms.
The Fund used short currency forward contracts to hedge direct and/or indirect foreign currency exposure. The Fund used long currency forward contracts to create exposure to the Hungarian forint.
Additional derivative information The following identifies the location on the Consolidated Statement of Assets and Liabilities and values of the Fund's derivative instruments categorized by primary underlying risk exposure.
| | Foreign
Exchange
Derivatives | |
| | | |
Unrealized appreciation on currency forward contracts | | | |
| | | |
| | | |
| | | |
Unrealized depreciation on currency forward contracts | | | |
| Includes cumulative appreciation (depreciation). Only the current day’s variation margin is reported in the Consolidated Statement of Assets and Liabilities. |
The following summarizes the effect of derivative instruments on the Consolidated Statement of Operations, categorized by primary underlying risk exposure.
| | Foreign
Exchange
Derivatives | |
| | | |
| | | |
Currency forward contracts | | | |
| | | |
Net change in unrealized appreciation/depreciation |
| | | |
Currency forward contracts | | | |
| | | |
The following summarizes the range of volume in the Fund's derivative instruments during the six months ended June 30, 2023.
| | |
| | |
Currency forward contracts | | |
The Fund may enter into various over-the-counter derivative contracts governed by International Swaps and Derivatives Association master agreements (“ISDA agreements”). The Fund’s ISDA agreements, which are separately negotiated with each dealer counterparty, specify (i) events of default and other events permitting a party to terminate some or all of the contracts thereunder and (ii) the process by which those contracts will be valued for purposes of determining termination payments. If some or all of the contracts under a master agreement are terminated because of an event of default or similar event, the values of all terminated contracts must be netted to determine a single payment owed by one party to the other. To the extent amounts owed to the Fund by its counterparties are not collateralized, the Fund is at risk of those counterparties’ non-
PAGE 15 ◾ Dodge & Cox Global Bond Fund
Notes to Consolidated Financial Statements (unaudited)
performance. The Fund attempts to mitigate counterparty credit risk by entering into contracts only with counterparties it believes to be of good credit quality, by exchanging collateral, and by monitoring the financial stability of those counterparties.
For financial reporting purposes, the Fund does not offset assets and liabilities that are subject to a master netting arrangement in the Consolidated Statement of Assets and Liabilities.
The Fund’s ability to net assets and liabilities and to offset collateral pledged or received is based on contractual netting/offset provisions in the ISDA agreements. The following table presents the Fund’s net exposure to each counterparty for derivatives that are subject to enforceable master netting arrangements as of June 30, 2023.
| Gross
Amount of
Recognized
Assets | Gross
Amount of
Recognized
Liabilities | | |
| | | | |
| | | | |
| | | | |
| | | | |
| | | | |
| | | | |
| | | | |
| | | | |
| Cash collateral pledged/(received) in excess of derivative assets/liabilities is not presented in this table. The total cash collateral is presented on the Fund's Consolidated Statement of Assets and Liabilities. |
| Represents the net amount receivable from (payable to) the counterparty in the event of a default. |
Note 4: Related Party Transactions
Investment advisory fee The Fund pays an investment advisory fee monthly at an annual rate of 0.35% of the Fund’s average daily net assets to Dodge & Cox, investment manager of the Fund.
Administrative services fee The Fund pays Dodge & Cox a fee for administrative and shareholder services. The fee is accrued daily and paid monthly equal to an annual rate of the average daily net assets of 0.10% for Class I shares and 0.05% for Class X shares. Under this agreement, Dodge & Cox also pays for the Fund's transfer agent fees.
Expense reimbursement Dodge & Cox has contractually agreed to reimburse the Fund for all ordinary expenses to the extent necessary to maintain the ratio of total operating expenses of the Class I shares to average net assets of the Class I shares at 0.45% through April 30, 2026. Dodge & Cox has contractually agreed to reimburse the Fund for all ordinary expenses to the extent necessary to maintain the ratio of total operating expenses of the Class X shares to average net assets of the Class X shares at 0.37% through April 30, 2026. The term of the agreement will automatically renew for subsequent three-year terms unless terminated with at least 30 days’ written notice by either party prior to the end of the then-current term. For the six months ended June 30, 2023, Dodge & Cox reimbursed expenses of $676,061 and $48,597 to Class I and Class X, respectively.
Fund officers and trustees All officers and two of the trustees of the Trust are current or former senior executive officers of Dodge & Cox. The Trust pays a fee only to those trustees who are not affiliated with Dodge & Cox.
Note 5: Income Tax Information and Distributions to Shareholders
A provision for federal income taxes is not required since the Fund intends to continue to qualify as a regulated investment company under Subchapter M of the Internal Revenue Code and distribute all of its taxable income to shareholders. Distributions are determined in accordance with income tax regulations, and such amounts may differ from net investment income and realized gains for financial reporting purposes. The Fund may also designate a portion of the amount paid to redeeming shareholders as a distribution for tax purposes. Financial reporting records are adjusted for permanent book to tax differences at year end to reflect tax character. Book to tax differences are primarily due to differing treatments of wash sales, foreign currency realized gain (loss), foreign capital gains tax, straddles, derivatives, and distributions.
Distributions during the periods noted below were characterized as follows for federal income tax purposes:
| Six Months Ended
June 30, 2023 | Year Ended
December 31, 2022 |
| | |
| | |
| | |
| | |
| | |
| | |
The components of distributable earnings on a tax basis are reported as of the Fund's most recent year end. At December 31, 2022, the tax basis components of distributable earnings were as follows:
Capital loss carryforward1 | |
| |
Net unrealized depreciation | |
Total distributable earnings | |
| Represents accumulated long-term capital loss as of December 31, 2022, which may be carried forward to offset future capital gains. |
| Represents capital loss incurred between November 1, 2022 and December 31, 2022. As permitted by tax regulation, the Fund has elected to treat this loss as arising in 2023. |
At June 30, 2023, unrealized appreciation and depreciation for investments and derivatives based on cost for federal income tax purposes were as follows:
| |
| |
| |
Net unrealized appreciation | |
Dodge & Cox Global Bond Fund ◾ PAGE 16
Notes to Consolidated Financial Statements (unaudited)
Fund management has reviewed the tax positions for open periods (three years and four years, respectively, from filing the Fund’s Federal and State tax returns) as applicable to the Fund, and has determined that no provision for income tax is required in the Fund’s financial statements.
Note 6: Loan Facilities
Pursuant to an exemptive order issued by the Securities and Exchange Commission (SEC), the Fund may participate in an interfund lending facility (Facility). The Facility allows the Fund to borrow money from or loan money to the Funds. Loans under the Facility are made for temporary or emergency purposes, such as to fund shareholder redemption requests. Interest on borrowings is the average of the current repurchase agreement rate and the bank loan rate. There was no activity in the Facility during the period.
All Funds in the Trust participate in a $500 million committed credit facility (Line of Credit) with State Street Bank and Trust Company, to be utilized for temporary or emergency purposes to fund shareholder redemptions or for other short-term liquidity purposes. The maximum amount available to the Fund is $250 million. Each Fund pays an annual commitment fee on its pro-rata portion of the Line of Credit. For the six months ended June 30, 2023, the Fund’s commitment fee amounted to $4,531 and is reflected as a Miscellaneous Expense in the Consolidated Statement of Operations. Interest on borrowings is charged at the prevailing rate. There were no borrowings on the Line of Credit during the period.
Note 7: Purchases and Sales of Investments
For the six months ended June 30, 2023, purchases and sales of securities, other than short-term securities and U.S. government
securities, aggregated $329,708,108 and $169,500,152, respectively. For the six months ended June 30, 2023, purchases and sales of U.S. government securities aggregated $581,537,553 and $407,110,962, respectively.
Note 8: New Accounting Guidance
In March 2020, the Financial Accounting Standards Board (FASB) issued Accounting Standards Update (ASU) No. 2020-04, Reference Rate Reform (Topic 848) – Facilitation of the Effects of Reference Rate Reform on Financial Reporting. The amendments in the ASU provide optional temporary financial reporting relief from the effect of certain types of contract modifications due to the planned discontinuation of the London Interbank Offered Rate and other interbank-offered based reference rates as of the end of 2021. The ASU is effective for certain reference rate-related contract modifications that occur during the period March 12, 2020 through December 31, 2022. In December 2022, the FASB issued ASU No. 2022-06, Reference Rate Reform (Topic 848) - Deferral of the Sunset Date of Topic 848, which extends the period through December 31, 2024. Management has reviewed the requirements and believes the adoption of these ASUs will not have a material impact on the financial statements.
Note 9: Subsequent Events
Fund management has determined that no material events or transactions occurred subsequent to June 30, 2023, and through the date of the Fund’s financial statements issuance, which require disclosure in the Fund’s financial statements.
PAGE 17 ◾ Dodge & Cox Global Bond Fund
Consolidated Financial Highlights (unaudited)
Selected data and ratios
(for a share outstanding throughout each period) | | |
| | | | | | |
| | | | | | |
Net asset value, beginning of period | | | | | | |
Income from investment operations: | | | | | | |
| | | | | | |
Net realized and unrealized gain (loss) | | | | | | |
Total from investment operations | | | | | | |
Distributions to shareholders from: | | | | | | |
| | | | | | |
| | | | | | |
| | | | | | |
Net asset value, end of period | | | | | | |
| | | | | | |
Ratios/supplemental data: | | | | | | |
Net assets, end of period (millions) | | | | | | |
Ratio of expenses to average net assets | | | | | | |
Ratio of expenses to average net assets, before reimbursement by investment manager | | | | | | |
Ratio of net investment income to average net assets | | | | | | |
| | | | | | |
Portfolio turnover rate excluding TBA rolls(b) | | | | | | |
| | | | | | |
Net asset value, beginning of period | | | | | | |
Income from investment operations: | | | | | | |
| | | | | | |
Net realized and unrealized gain (loss) | | | | | | |
Total from investment operations | | | | | | |
Distributions to shareholders from: | | | | | | |
| | | | | | |
| | | | | | |
| | | | | | |
Net asset value, end of period | | | | | | |
| | | | | | |
Ratios/supplemental data: | | | | | | |
Net assets, end of period (millions) | | | | | | |
Ratio of expenses to average net assets | | | | | | |
Ratio of expenses to average net assets, before reimbursement by investment manager | | | | | | |
Ratio of net investment income to average net assets | | | | | | |
| | | | | | |
Portfolio turnover rate excluding TBA rolls(b) | | | | | | |
| |
| See Note 1 regarding To-Be-Announced securities |
| For 2022, the period covers 5/2/2022 (commencement of operations) to 12/31/2022 |
See accompanying Notes to Consolidated Financial Statements
Dodge & Cox Global Bond Fund ◾ PAGE 18
Board Approval of Funds’ Investment Advisory Agreement and Investment Advisory Fees
(unaudited)
On June 1, 2023, the Board of Trustees (the “Board”) of the Dodge & Cox Funds (the “Trust”), including the members of the Board who are not “interested persons” of Dodge & Cox (as such term is defined in the Investment Company Act of 1940) (the “Independent Trustees”), voted to continue the Investment Advisory Agreement between Dodge & Cox and the Trust (the “Advisory Agreement”) in effect for an additional year beginning July 1, 2023 for each series of the Trust (each a “Fund”). Prior to the Board’s vote, the Trust’s Contract Review Committee, consisting solely of Independent Trustees, met with independent counsel to the Independent Trustees on May 8 and June 1, 2023, to discuss whether the Investment Advisory Agreement should be continued. At its June 1 meeting, the Board, including the Independent Trustees, concluded that the Investment Advisory Agreement is fair and reasonable. In considering the Investment Advisory Agreement, the Board, including the Independent Trustees, did not identify any single factor or particular information as all-important or controlling. In reaching the decision to continue the Investment Advisory Agreement in effect, the Board considered several factors, and reached the conclusions, described below:
Nature, Extent and Quality of Services Provided by Dodge & Cox
◾ The Board considered the nature, extent, and quality of the services provided by Dodge & Cox to each Fund under the Advisory Agreement. This consideration included, among other things, Dodge & Cox’s investment process and philosophy; the education and experience of the principal personnel of Dodge & Cox who provide such services; the other resources (including technology) that Dodge & Cox uses in managing the Funds’ portfolios; Dodge & Cox’s record of compliance with the Funds’ investment policies and restrictions and relevant regulatory and tax compliance requirements; and such matters as Dodge & Cox’s business continuity planning and insurance coverage.
◾ The Board concluded that the nature, extent, and quality of the services Dodge & Cox provides are consistent with the terms of the Advisory Agreement and support the recommendation to continue the Advisory Agreement in effect for the coming year.
◾ The Board also took note of the nature, extent, and quality of the broad range of services that Dodge & Cox provides to the Funds and their shareholders under a separate Administrative and Shareholder Services Agreement. Although that Agreement does not require Board approval on an annual basis, the services provided thereunder are an important part of the Funds’ overall relationship with Dodge & Cox, and the Board’s understanding and assessment of those services was a factor in its decision to recommend continuation of the Investment Advisory Agreement.
Investment Performance
◾ The Board reviewed information regarding the total return of each Fund over the most recent 1-, 3-, 5-, 10-, and 20-year periods (or since Fund inception, if shorter). The Board compared these returns to those of the Fund’s broad benchmark index and, for the Stock, International Stock, Global Stock, and Balanced Funds, to those of a relevant value-oriented index. The Board also considered the volatility of the Funds’ investment returns over various time horizons, including both volatility data provided by Broadridge Financial Solutions (“Broadridge”) and longer-term volatility measures presented by Dodge & Cox.
◾ In addition, the Board reviewed a report prepared by Broadridge comparing each Fund’s performance with the performance of other mutual funds in such Fund’s broad Morningstar category (as modified by Broadridge to include only those funds that have similar share class and expense characteristics to such Fund’s, the “Morningstar custom category”), as well as with the performance of a smaller peer group of comparable funds identified by Broadridge (such Fund’s “peer group”). The Board received information regarding the methodology and process underlying the construction of the Morningstar custom categories and peer groups, and any changes in the methodology from prior years. The Board also reviewed a report prepared by Dodge & Cox comparing each Fund’s performance to the composite performance of other accounts (if any) managed by Dodge & Cox using the same investment approach as the Fund. This information regarding the performance of other mutual funds and of other accounts managed by Dodge & Cox provided helpful context for the Board’s evaluation of the Funds’ performance.
◾ The Board concluded that the investment performance and volatility experienced by each Fund were consistent with Dodge & Cox’s long-term, research-driven, bottom-up, active investment style and support the recommendation to continue the Advisory Agreement in effect for an additional year.
Fees and Expense Ratios
◾ The Board reviewed a comparison prepared by Broadridge of the net expense ratio of each Fund (including the separate expense ratios of the two share classes of those Funds that have a dual class structure), and the various elements of those expense ratios, to those of mutual funds in (1) the Fund’s Morningstar custom category and (2) the Fund’s peer group.
◾ For each Fund for which such a comparison is relevant, the Board reviewed information regarding the fee rates Dodge & Cox charges for managing other accounts using the same investment approach as the Fund. The Board took note of the broader scope of services that Dodge & Cox provides to the Funds than to separate accounts and sub-advised funds, as well as differences in regulatory, litigation, and other risks associated with sponsoring a mutual fund as compared to managing separate accounts or sub-advising another
PAGE 19 ◾ Dodge & Cox Global Bond Fund
sponsor’s mutual fund, and certain characteristics of the market for institutional separate account management services.
◾ The Board concluded, after discussion and based on all the relevant information it received, that the advisory fee rate that each Fund pays to Dodge & Cox under the Advisory Agreement is reasonable in relation to the scope and quality of the services that Dodge & Cox provides to such Fund thereunder.
◾ In assessing the Funds’ expense ratios and the fees the Funds pay to Dodge & Cox, the Board took note of and discussed with Dodge & Cox changes over the past several years in the competitive landscape for asset management services. The Board anticipates further changes in the competitive landscape and will continue to monitor and assess the Funds’ competitive position.
Costs of Services Provided and Profits Realized by Dodge & Cox from its Relationship to the Funds
◾ Dodge & Cox informed the Board that it operates as a unified business, with most employees providing services to support the firm and its clients across multiple strategies and/or products. Consequently the firm does not utilize cost accounting to allocate expenses across lines of business or across the Funds for management purposes. Also, the firm is owned exclusively by its senior managers and other active employees, and generally distributes substantially all of its net revenues each year to its employees, either as compensation or as distributions with respect to the shares they own in the firm. Accordingly, it is difficult, and in the Board’s view not especially meaningful, to attempt to calculate a specific profit margin associated with Dodge & Cox’s relationship to any particular Fund.
◾ The Board believes that Dodge & Cox’s commitment to employee ownership of the firm enhances its ability to attract and retain key investment and other management professionals and reinforces a long-term perspective on the management of the firm and the Funds, which the Board believe aligns well with the interests of the Funds and their shareholders.
◾ The Board noted that the employee-shareholders of Dodge & Cox give up a substantial stock value (which would be taxed at long-term capital gains rates) as a consequence of the firm’s independence from outside ownership; the estimated market value of the company is substantially in excess of its book value.
◾ The Board also considered that Dodge & Cox’s fee revenues from the Funds fluctuate from year to year based on changes in the aggregate net assets of the Funds, and that the firm has continued to invest in improved systems, additional compliance resources, and enhanced research capabilities despite these fluctuations.
◾ The Board concluded that Dodge & Cox’s profits are a keystone of its independence, stability, and long-term investment performance.
Economies and Benefits of Scale
◾ The Board considered whether there have been economies or benefits of scale as the Funds have grown over the longer term, and whether fee levels reflect economies of scale for the benefit of Fund investors. In the Board’s view any consideration of economies of scale must take account of the relatively low overall fee and expense structure of the Funds. The Funds generally rank favorably when compared to their Broadridge custom categories and peer groups, on a net expense ratio basis.
◾ Dodge & Cox has built economies of scale into its fee structure by charging relatively low fees at the beginning of operations. A comparison of the Funds’ advisory fee rates to those of many otherwise comparable funds that employ fee “breakpoints” shows that the Funds’ advisory fee rates are in general relatively lower from the first dollar. As a result of their straightforward share class and fee structure and relatively low total expenses, the Funds provide small investors with access to professional, active portfolio management and related services at a reasonable cost. In addition to building economies of scale into its fee rates from the first dollar of each Fund’s assets, Dodge & Cox has capped the expenses borne by certain Funds in their early years of operations when those Funds are not yet operating at scale. The Global Bond Fund has benefited from such an expense cap since its inception in 2014, as has the Emerging Markets Stock Fund since its inception in 2021. Dodge & Cox has agreed to continue expense caps for those Funds, and for the X share class of each of the other Funds, through April 30, 2026.
◾ Over the years, Dodge & Cox has voluntarily forgone opportunities for growth in its assets under management and revenues in order to protect the Funds’ ability to achieve investment returns for shareholders. Dodge & Cox closed the International Stock Fund for a number of years beginning in 2015 and previously closed other Funds and limited the growth of its separate account business during periods of high growth--to Dodge & Cox’s economic detriment--and continues to closely monitor the size of the Funds.
◾ The Board also noted that Dodge & Cox has continued to make additional expenditures on staff and information technology to enable it to enhance its investment processes and to implement effectively the Funds’ strategies. The Board also considered that there may be certain diseconomies of scale associated with managing very large asset pools such as several of the Funds, insofar as certain of the costs or risks associated with managing the Funds potentially increase at a rate that exceeds the rate of asset growth.
Dodge & Cox Global Bond Fund ◾ PAGE 20
Fall-Out Benefits
◾ The Board concluded that “fall-out” benefits derived by Dodge & Cox from its relationship with the Funds are not a significant issue.
Fund Holdings
The Fund provides a complete list of its holdings on a quarterly basis by filing the lists with the SEC on Form N-CSR (as of the end of the second and fourth quarters) and on Part F of Form N-PORT (as of the end of the first and third quarters). Shareholders may view the Fund’s Forms N-CSR and Part F of N-PORT on the SEC’s website at sec.gov. A list of the Fund’s quarter-end holdings is also available at dodgeandcox.com on or about the 15th day following each quarter end and remains available on the website until the list is updated for the subsequent quarter.
Proxy Voting
For a free copy of the Fund’s proxy voting policies and procedures, please call 800-621-3979, visit the Fund’s website at www.dodgeandcox.com, or visit the SEC’s website at sec.gov. Information regarding how the Fund voted proxies relating to portfolio securities during the most recent 12-month period ended June 30 is also available at dodgeandcox.com or shareholders may view the Fund's Form N-PX at sec.gov.
Household Mailings
The Fund routinely mails shareholder reports and summary prospectuses to shareholders and, on occasion, proxy statements. In order to reduce the volume of mail, when possible, only one copy of these documents will be sent to shareholders who are part of the same family and share the same residential address.
If you have a direct account with the Funds and you do not want the mailing of shareholder reports and summary prospectuses combined with other members in your household, contact the Funds at 800-621-3979. Your request will be implemented within 30 days.
PAGE 21 ◾ Dodge & Cox Global Bond Fund
dodgeandcox.com
For Fund literature, transactions, and account
information, please visit the Funds’ website.
or write or call:
Dodge & Cox Funds
P.O. Box 219502
Kansas City, Missouri 64121-9502
(800) 621-3979
Investment Manager
Dodge & Cox
555 California Street, 40th Floor
San Francisco, California 94104
(415) 981-1710
Principal Underwriter
Foreside Fund Services, LLC
3 Canal Plaza, Suite 100
Portland, Maine 04101
(866) 251-6920
This report is submitted for the general information of the shareholders of the Fund. The report is not authorized for distribution to prospective investors in the Fund unless it is accompanied by a current prospectus.
This report reflects our views, opinions, and portfolio holdings as of June 30, 2023, the end of the reporting period. Any such views are subject to change at any time based upon market or other conditions and Dodge & Cox disclaims any responsibility to update such views. These views may not be relied on as investment advice and, because investment decisions for a Dodge & Cox Fund are based on numerous factors, may not be relied on as an indication of trading intent on behalf of any Dodge & Cox Fund.
(b) Not applicable.
ITEM 2. CODE OF ETHICS.
Not applicable for semi-annual report filings.
ITEM 3. AUDIT COMMITTEE FINANCIAL EXPERT.
Not applicable for semi-annual report filings.
ITEM 4. PRINCIPAL ACCOUNTANT FEES AND SERVICES.
Not applicable for semi-annual report filings.
ITEM 5. AUDIT COMMITTEE OF LISTED REGISTRANTS.
Not applicable.
ITEM 6. INVESTMENTS.
(a) The complete schedule of investments is included in Item 1(a) of this Form N-CSR.
(b) Not applicable.
ITEM 7. DISCLOSURE OF PROXY VOTING POLICIES AND PROCEDURES FOR CLOSED-END MANAGEMENT INVESTMENT COMPANIES.
Not applicable.
ITEM 8. PORTFOLIO MANAGERS OF CLOSED-END MANAGEMENT INVESTMENT COMPANIES.
Not applicable.
ITEM 9. PURCHASES OF EQUITY SECURITIES BY CLOSED-END MANAGEMENT INVESTMENT COMPANY AND AFFILIATED PURCHASERS.
Not applicable.
ITEM 10. SUBMISSION OF MATTERS TO A VOTE OF SECURITY HOLDERS.
There have been no material changes to the procedures by which shareholders may recommend nominees to the registrant’s
Board of Trustees.
ITEM 11. CONTROLS AND PROCEDURES.
(a) An evaluation was performed within 90 days of the filing of this report, under the supervision and with the participation of the registrant’s management, including the principal executive officer and principal financial officer, of the effectiveness of the design and operation of the registrant’s disclosure controls and procedures. Based on that evaluation, the principal executive officer and principal financial officer concluded that the registrant’s disclosure controls and procedures were effective.
(b) The registrant’s principal executive officer and principal financial officer are aware of no changes in the registrant’s internal control over financial reporting that occurred during the period covered by this report that have materially affected, or is reasonably likely to materially affect, the registrant’s internal control over financial reporting.
ITEM 12. DISCLOSURE OF SECURITIES LENDING ACTIVITIES FOR CLOSED-END MANAGEMENT INVESTMENT COMPANIES.
Not applicable.
ITEM 13. EXHIBITS.
(a)(1) Not applicable for semi-annual report filings.
(a)(2) Certifications pursuant to Section 302 of the Sarbanes-Oxley Act of 2002 are attached. (EX.99A)
(b) Certifications pursuant to Section 906 of the Sarbanes-Oxley Act of 2002 are attached. (EX.99B)
SIGNATURES
Pursuant to the requirements of the Securities Exchange Act of 1934 and the Investment Company Act of 1940, the registrant has duly caused this report to be signed on its behalf by the undersigned, thereunto duly authorized.
| | |
| Dodge & Cox Funds |
| |
| By | | /s/ Dana M. Emery |
| | Dana M. Emery |
| | Chair and President - Principal Executive Officer |
Date: August 31, 2023
Pursuant to the requirements of the Securities Exchange Act of 1934 and the Investment Company Act of 1940, this report has been signed below by the following persons on behalf of the registrant and in the capacities and on the dates indicated.
| | |
| Dodge & Cox Funds |
| |
| By | | /s/ Dana M. Emery |
| | Dana M. Emery |
| | Chair and President - Principal Executive Officer |
| |
| By | | /s/ Shelly Chu |
| | Shelly Chu |
| | Treasurer - Principal Financial Officer |
Date: August 31, 2023


