
Earnings Conference Call Second Quarter 2020 July 22, 2020 – 8:00am CT
2 Forward-Looking Statements and Non-GAAP Measures We want to remind everyone that our comments may contain forward-looking statements that are inherently subject to uncertainties and risks, including the impacts of the novel coronavirus (COVID-19) on the global economy and on our customers, suppliers, employees, operations, business, liquidity and cash flow. We caution everyone to be guided in their analysis of Dover Corporation by referring to the documents we file from time to time with the SEC, including our Form 10-K for 2019 and Form 10-Q for the second quarter of 2020, for a list of factors that could cause our results to differ from those anticipated in any such forward-looking statements. We would also direct your attention to our website, dovercorporation.com, where considerably more information can be found. In addition to financial measures based on U.S. GAAP, Dover provides supplemental non-GAAP financial information. Management uses non-GAAP measures in addition to GAAP measures to understand and compare operating results across periods, make resource allocation decisions, and for forecasting and other purposes. Management believes these non-GAAP measures reflect results in a manner that enables, in many instances, more meaningful analysis of trends and facilitates comparison of results across periods and to those of peer companies. These non-GAAP financial measures have no standardized meaning presented in U.S. GAAP and may not be comparable to other similarly titled measures used by other companies due to potential differences between the companies in calculations. The use of these non-GAAP measures has limitations and they should not be considered as substitutes for measures of financial performance and financial position as prepared in accordance with U.S. GAAP. Reconciliations and definitions are included either in this presentation or in Dover’s earnings release and investor supplement for the second quarter, which are available on Dover’s website.
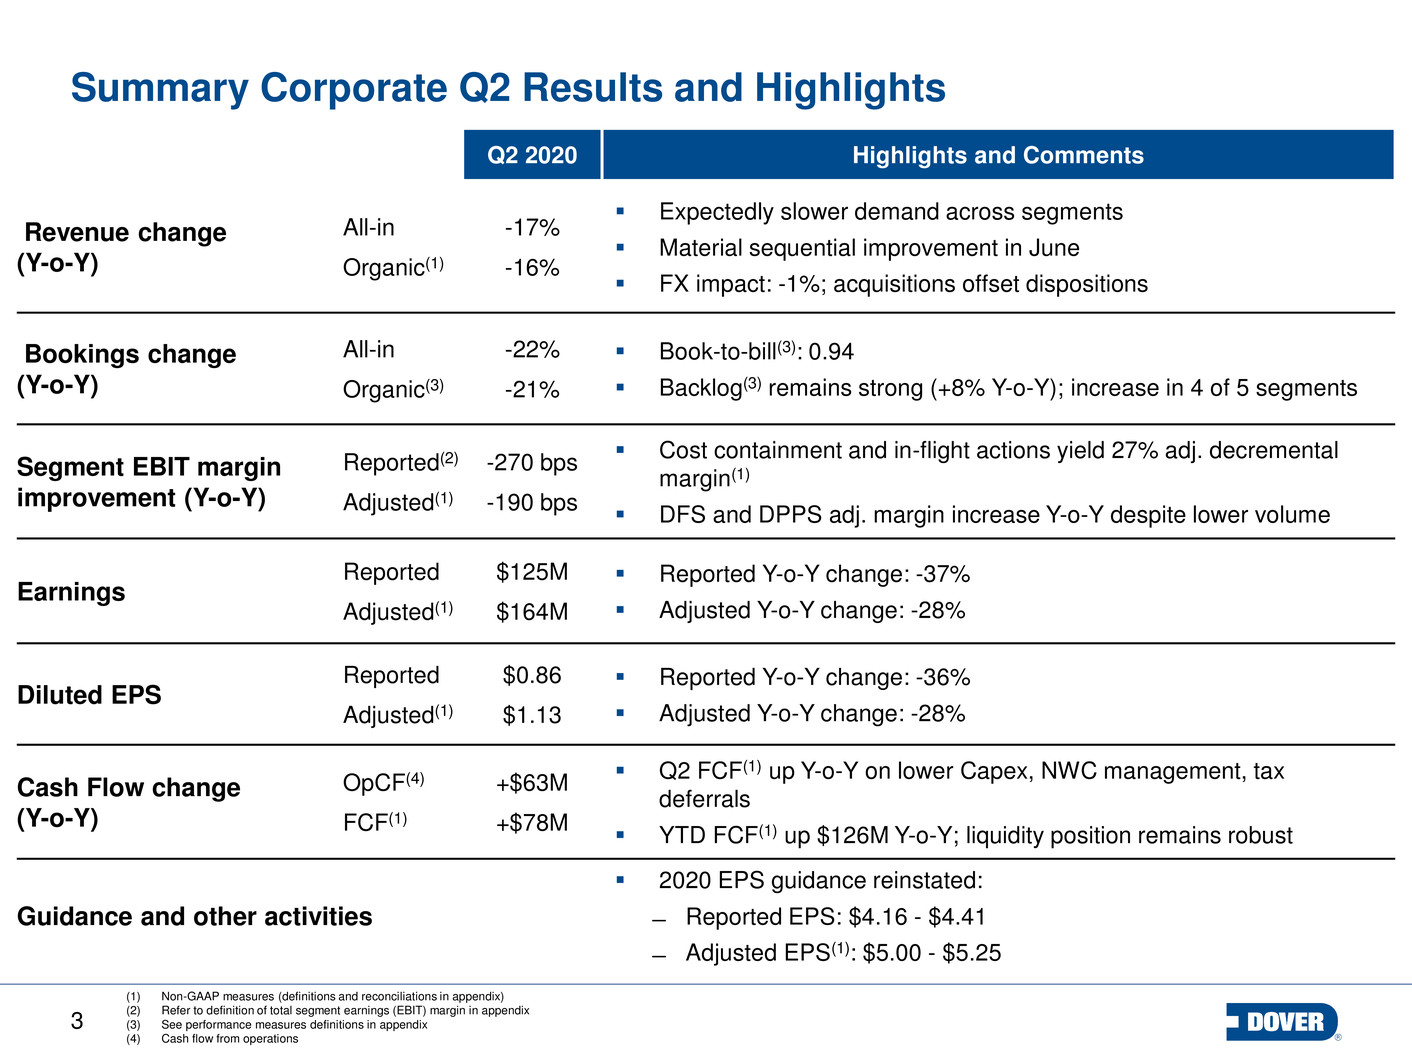
3 Summary Corporate Q2 Results and Highlights Q2 2020 Highlights and Comments Revenue change (Y-o-Y) All-in Organic(1) -17% -16% Expectedly slower demand across segments Material sequential improvement in June FX impact: -1%; acquisitions offset dispositions Bookings change (Y-o-Y) All-in Organic(3) -22% -21% Book-to-bill(3): 0.94 Backlog(3) remains strong (+8% Y-o-Y); increase in 4 of 5 segments Segment EBIT margin improvement (Y-o-Y) Reported(2) Adjusted(1) -270 bps -190 bps Cost containment and in-flight actions yield 27% adj. decremental margin(1) DFS and DPPS adj. margin increase Y-o-Y despite lower volume Earnings Reported Adjusted(1) $125M $164M Reported Y-o-Y change: -37% Adjusted Y-o-Y change: -28% Diluted EPS Reported Adjusted(1) $0.86 $1.13 Reported Y-o-Y change: -36% Adjusted Y-o-Y change: -28% Cash Flow change (Y-o-Y) OpCF(4) FCF(1) +$63M +$78M Q2 FCF(1) up Y-o-Y on lower Capex, NWC management, tax deferrals YTD FCF(1) up $126M Y-o-Y; liquidity position remains robust Guidance and other activities 2020 EPS guidance reinstated: ̶ Reported EPS: $4.16 - $4.41 ̶ Adjusted EPS(1): $5.00 - $5.25 (1) Non-GAAP measures (definitions and reconciliations in appendix) (2) Refer to definition of total segment earnings (EBIT) margin in appendix (3) See performance measures definitions in appendix (4) Cash flow from operations
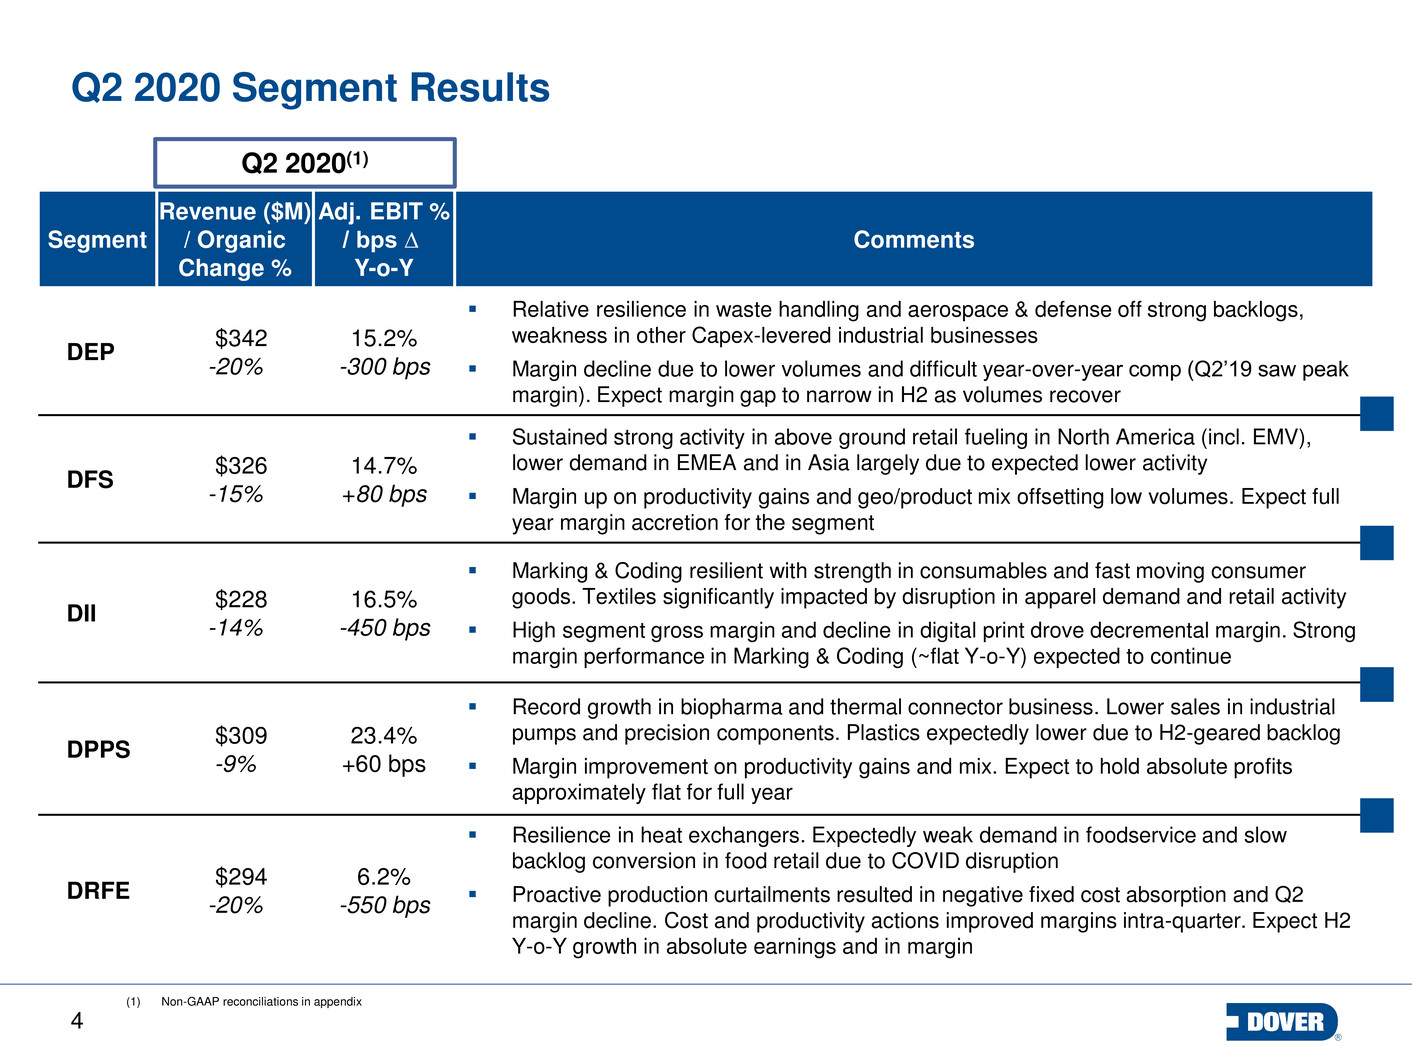
4 Segment Revenue ($M) / Organic Change % Adj. EBIT % / bps ∆ Y-o-Y Comments DEP $342 -20% 15.2% -300 bps Relative resilience in waste handling and aerospace & defense off strong backlogs, weakness in other Capex-levered industrial businesses Margin decline due to lower volumes and difficult year-over-year comp (Q2’19 saw peak margin). Expect margin gap to narrow in H2 as volumes recover DFS $326 -15% 14.7% +80 bps Sustained strong activity in above ground retail fueling in North America (incl. EMV), lower demand in EMEA and in Asia largely due to expected lower activity Margin up on productivity gains and geo/product mix offsetting low volumes. Expect full year margin accretion for the segment DII $228 -14% 16.5% -450 bps Marking & Coding resilient with strength in consumables and fast moving consumer goods. Textiles significantly impacted by disruption in apparel demand and retail activity High segment gross margin and decline in digital print drove decremental margin. Strong margin performance in Marking & Coding (~flat Y-o-Y) expected to continue DPPS $309 -9% 23.4% +60 bps Record growth in biopharma and thermal connector business. Lower sales in industrial pumps and precision components. Plastics expectedly lower due to H2-geared backlog Margin improvement on productivity gains and mix. Expect to hold absolute profits approximately flat for full year DRFE $294 -20% 6.2% -550 bps Resilience in heat exchangers. Expectedly weak demand in foodservice and slow backlog conversion in food retail due to COVID disruption Proactive production curtailments resulted in negative fixed cost absorption and Q2 margin decline. Cost and productivity actions improved margins intra-quarter. Expect H2 Y-o-Y growth in absolute earnings and in margin Q2 2020 Segment Results Q2 2020(1) (1) Non-GAAP reconciliations in appendix
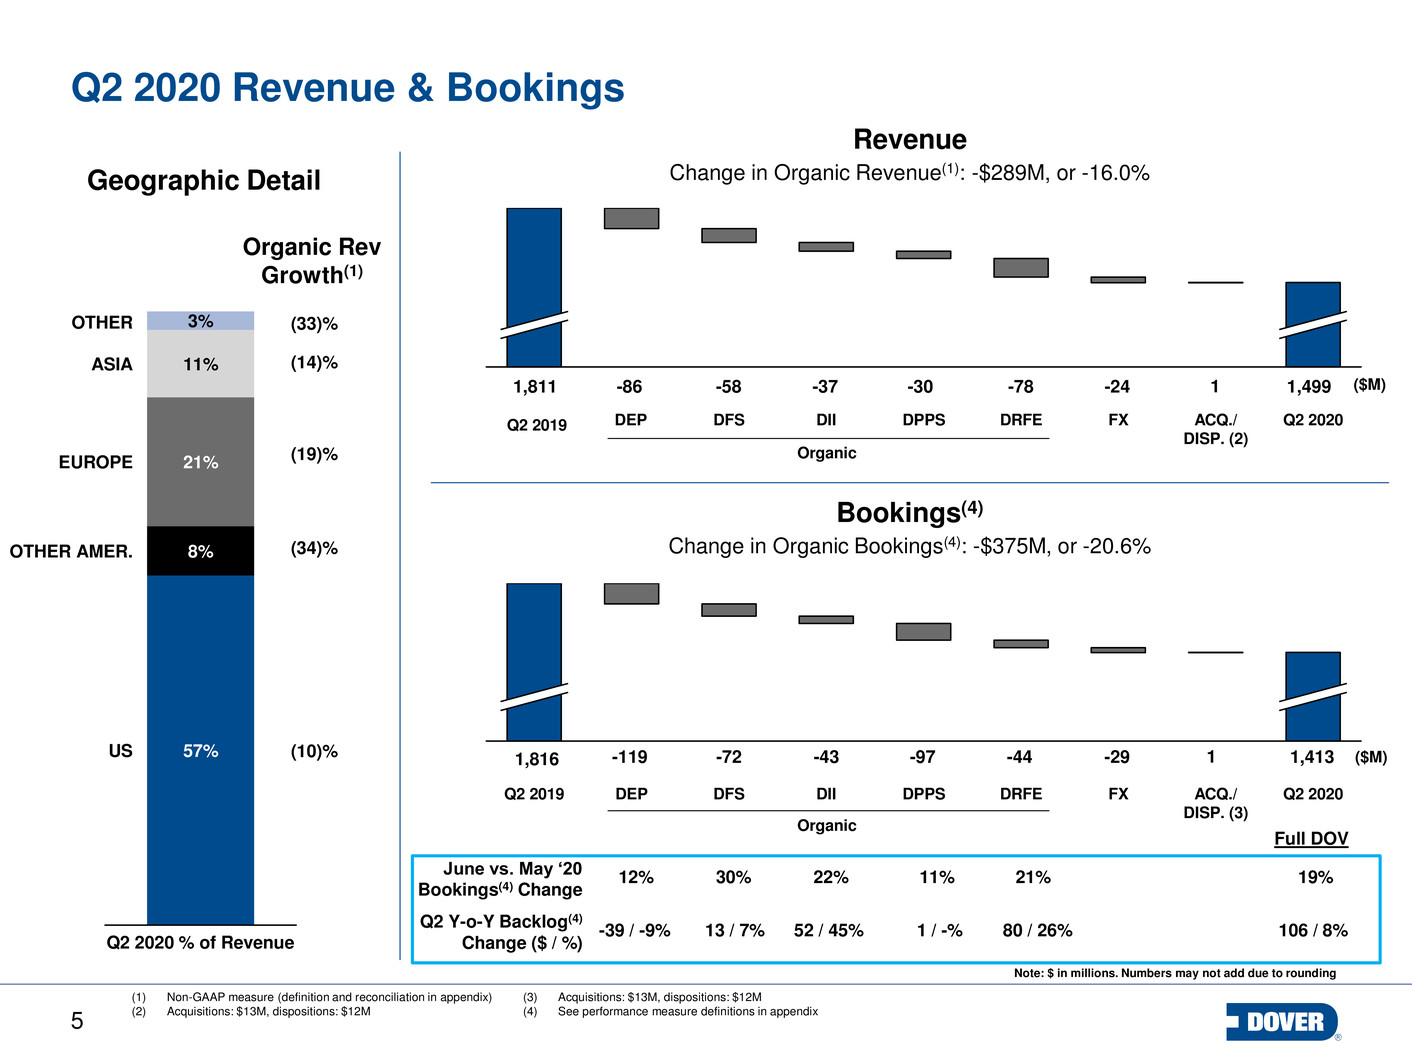
5 Q2 2019 Q2 2020 Revenue & Bookings Revenue Change in Organic Revenue(1): -$289M, or -16.0% DIIDFS DPPS DRFE FX ACQ./ DISP. (2) Q2 2020 Geographic Detail Q2 2019 DEP DFS DII DPPS DRFE FX ACQ./ DISP. (3) Q2 2020 Note: $ in millions. Numbers may not add due to rounding Bookings(4) Change in Organic Bookings(4): -$375M, or -20.6% (1) Non-GAAP measure (definition and reconciliation in appendix) (2) Acquisitions: $13M, dispositions: $12M DEP ($M)1,811 -58 -24 1,499-78-86 -30-37 ($M) 1 -72 -29 1,413-44-119 -97-43 11,816 Q2 2020 % of Revenue 3% 21% 11%ASIA 8% 57% OTHER EUROPE OTHER AMER. US (33)% (14)% (19)% (34)% (10)% Organic Rev Growth(1) Organic Organic (3) Acquisitions: $13M, dispositions: $12M (4) See performance measure definitions in appendix June vs. May ‘20 Bookings(4) Change Q2 Y-o-Y Backlog(4) Change ($ / %) 12% 30% 22% 11% 21% 19% -39 / -9% 13 / 7% 52 / 45% 1 / -% 80 / 26% 106 / 8% Full DOV
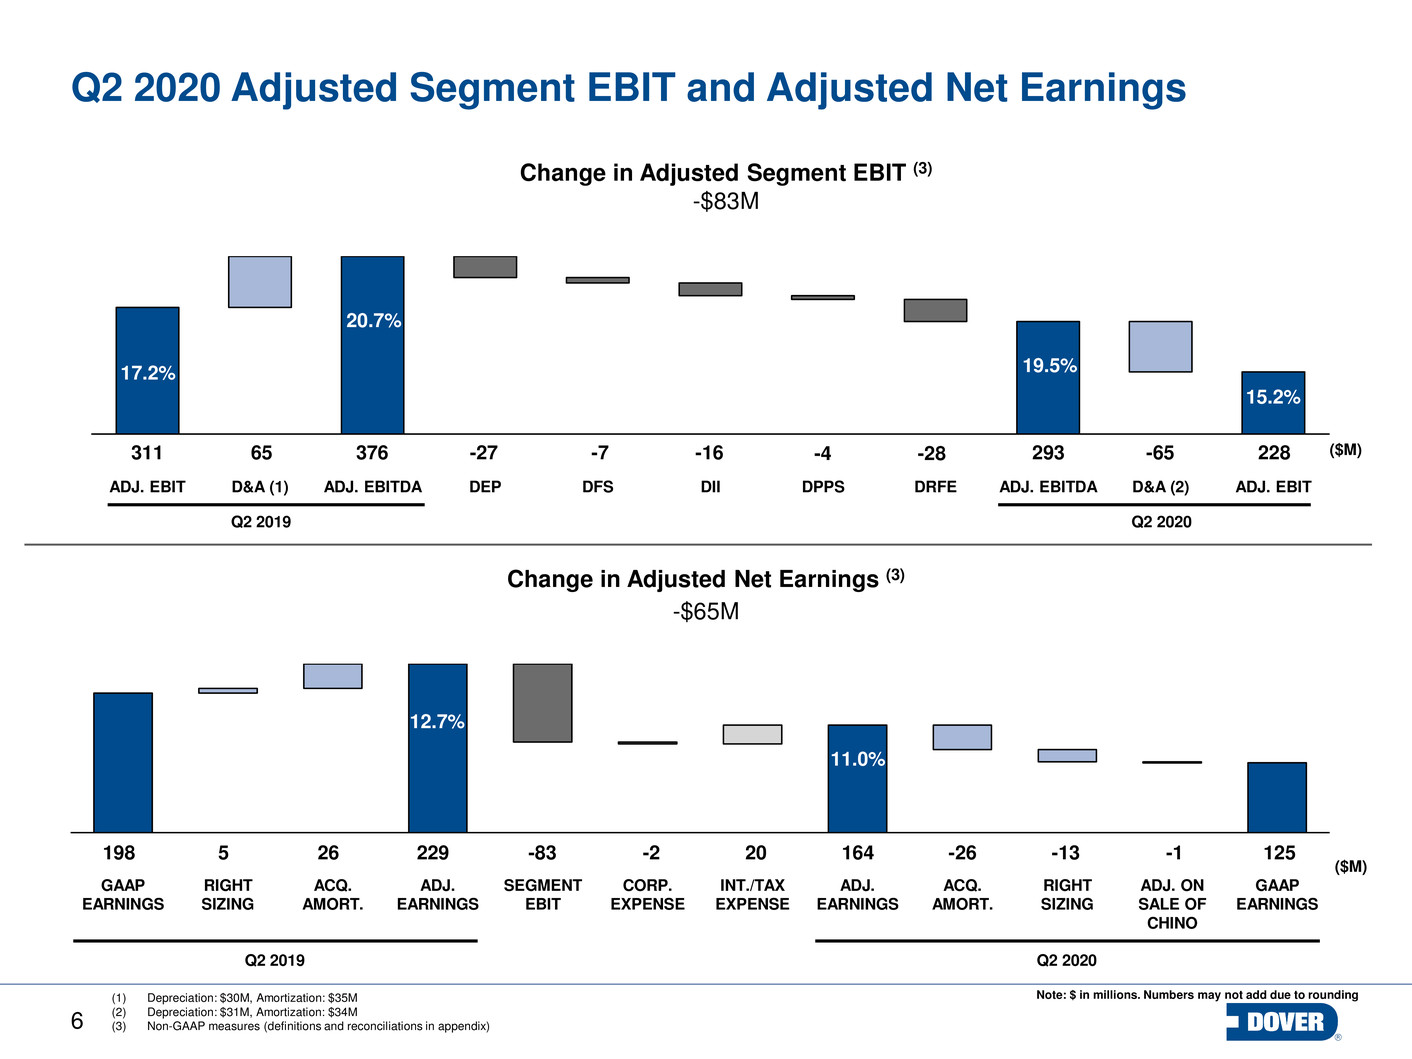
6 Q2 2020 Adjusted Segment EBIT and Adjusted Net Earnings GAAP EARNINGS RIGHT SIZING INT./TAX EXPENSE ACQ. AMORT. CORP. EXPENSE SEGMENT EBIT ADJ. EARNINGS ADJ. EARNINGS ACQ. AMORT. RIGHT SIZING ADJ. ON SALE OF CHINO GAAP EARNINGS Change in Adjusted Net Earnings (3) -$65M 198 5 26 229 -83 -2 20 164 -26 -13 Q2 2019 Q2 2020 ($M) Note: $ in millions. Numbers may not add due to rounding 125-1 DPPSDIIADJ. EBIT DFSD&A (1) DEPADJ. EBITDA DRFE ADJ. EBITDA D&A (2) ADJ. EBIT 20.7% 15.2% Change in Adjusted Segment EBIT (3) -$83M Q2 2020 311 376 -16-27 228 ($M)-4 17.2% Q2 2019 -65-7 -28 19.5% 29365 (1) Depreciation: $30M, Amortization: $35M (2) Depreciation: $31M, Amortization: $34M (3) Non-GAAP measures (definitions and reconciliations in appendix) 12.7% 11.0%

7 Year-to-Date Free Cash Flow 12.3% (1) Includes gain on disposition and loss on assets held for sale (2) Includes stock-based compensation and changes in other current and non-current assets and liabilities (3) Non-GAAP measures (reconciliation on this slide, definitions in appendix) $M YTD ’20 YTD ’19 ∆ Net earnings 301 304 -3 Adjustments for (gains) losses(1) (6) 47 -53 D&A 136 136 +1 Change in working capital (80) (164) +84 Change in other(2) (4) (89) +85 Cash flow from operations 348 233 +114 Capex (79) (91) 12 Free cash flow(3) 269 142 +126 FCF % of revenue(3) 8.5% 4.0% +450 bps FCF % of adj. earnings(3) 73.0% 34.5% +3,850 bps Note: Numbers may not add due to rounding NWC management led to improved FCF conversion Q2 benefited by ~$40M of deferred US tax payments (to be paid in Q3) Capex on “in-flight” committed projects largely completed in H1 ’20
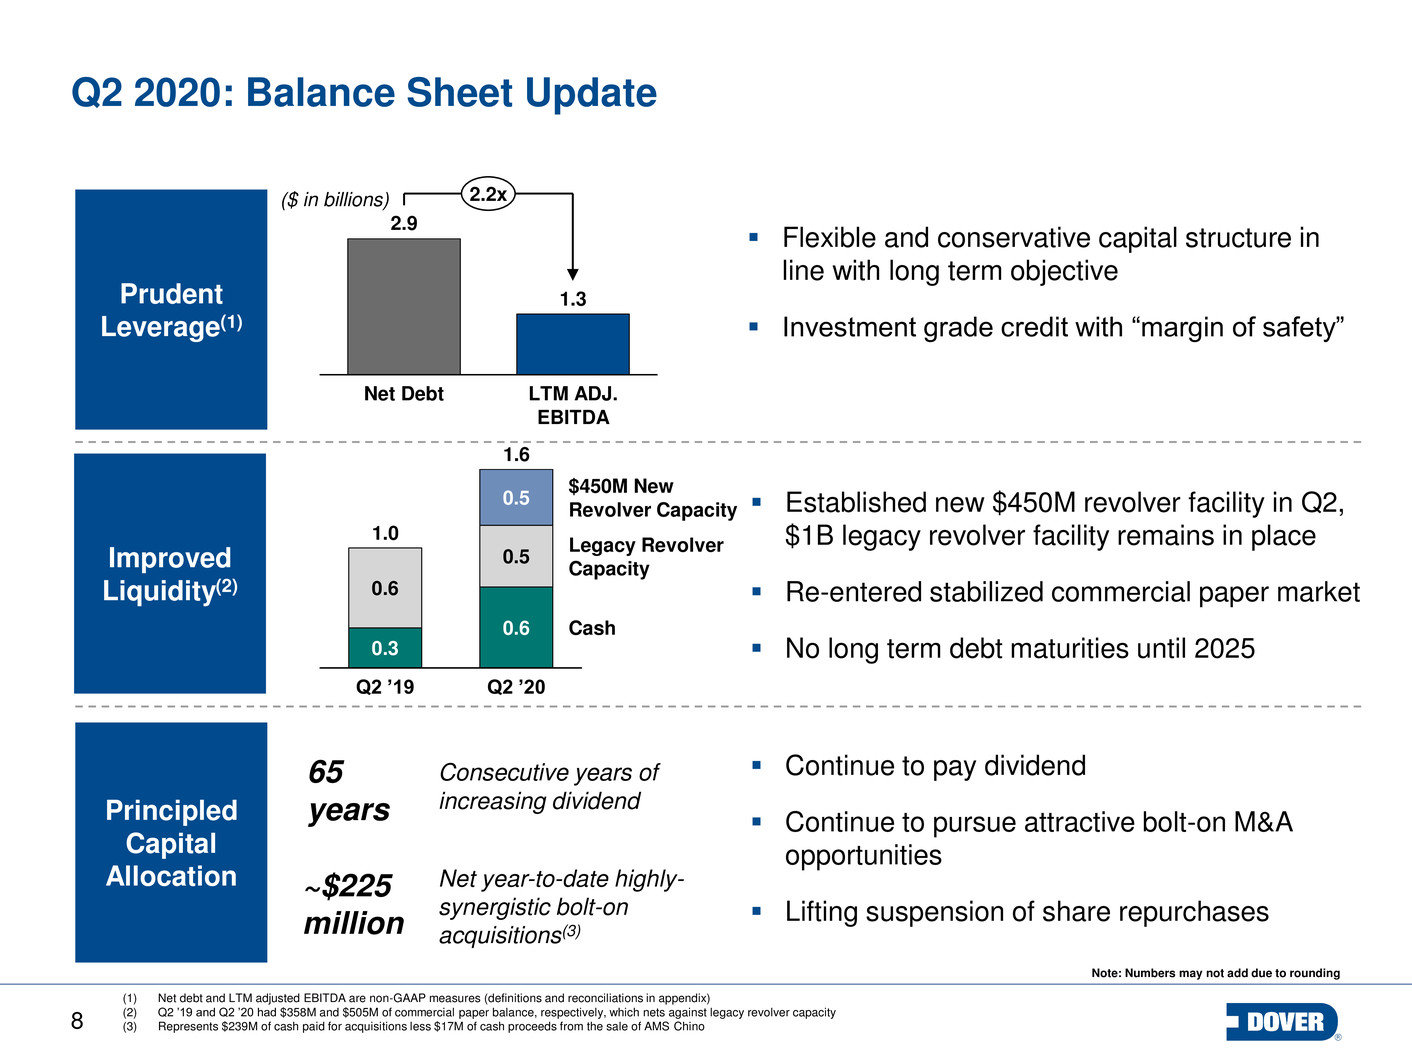
8 Principled Capital Allocation Q2 2020: Balance Sheet Update Note: Numbers may not add due to rounding Prudent Leverage(1) ($ in billions) Flexible and conservative capital structure in line with long term objective Investment grade credit with “margin of safety” 2.9 1.3 Net Debt LTM ADJ. EBITDA 2.2x Improved Liquidity(2) 0.3 0.6 0.6 0.5 0.5 Legacy Revolver Capacity Q2 ’19 1.6 Q2 ’20 1.0 $450M New Revolver Capacity Cash Established new $450M revolver facility in Q2, $1B legacy revolver facility remains in place Re-entered stabilized commercial paper market No long term debt maturities until 2025 (1) Net debt and LTM adjusted EBITDA are non-GAAP measures (definitions and reconciliations in appendix) (2) Q2 ’19 and Q2 ’20 had $358M and $505M of commercial paper balance, respectively, which nets against legacy revolver capacity (3) Represents $239M of cash paid for acquisitions less $17M of cash proceeds from the sale of AMS Chino 65 years ~$225 million Consecutive years of increasing dividend Net year-to-date highly- synergistic bolt-on acquisitions(3) Continue to pay dividend Continue to pursue attractive bolt-on M&A opportunities Lifting suspension of share repurchases
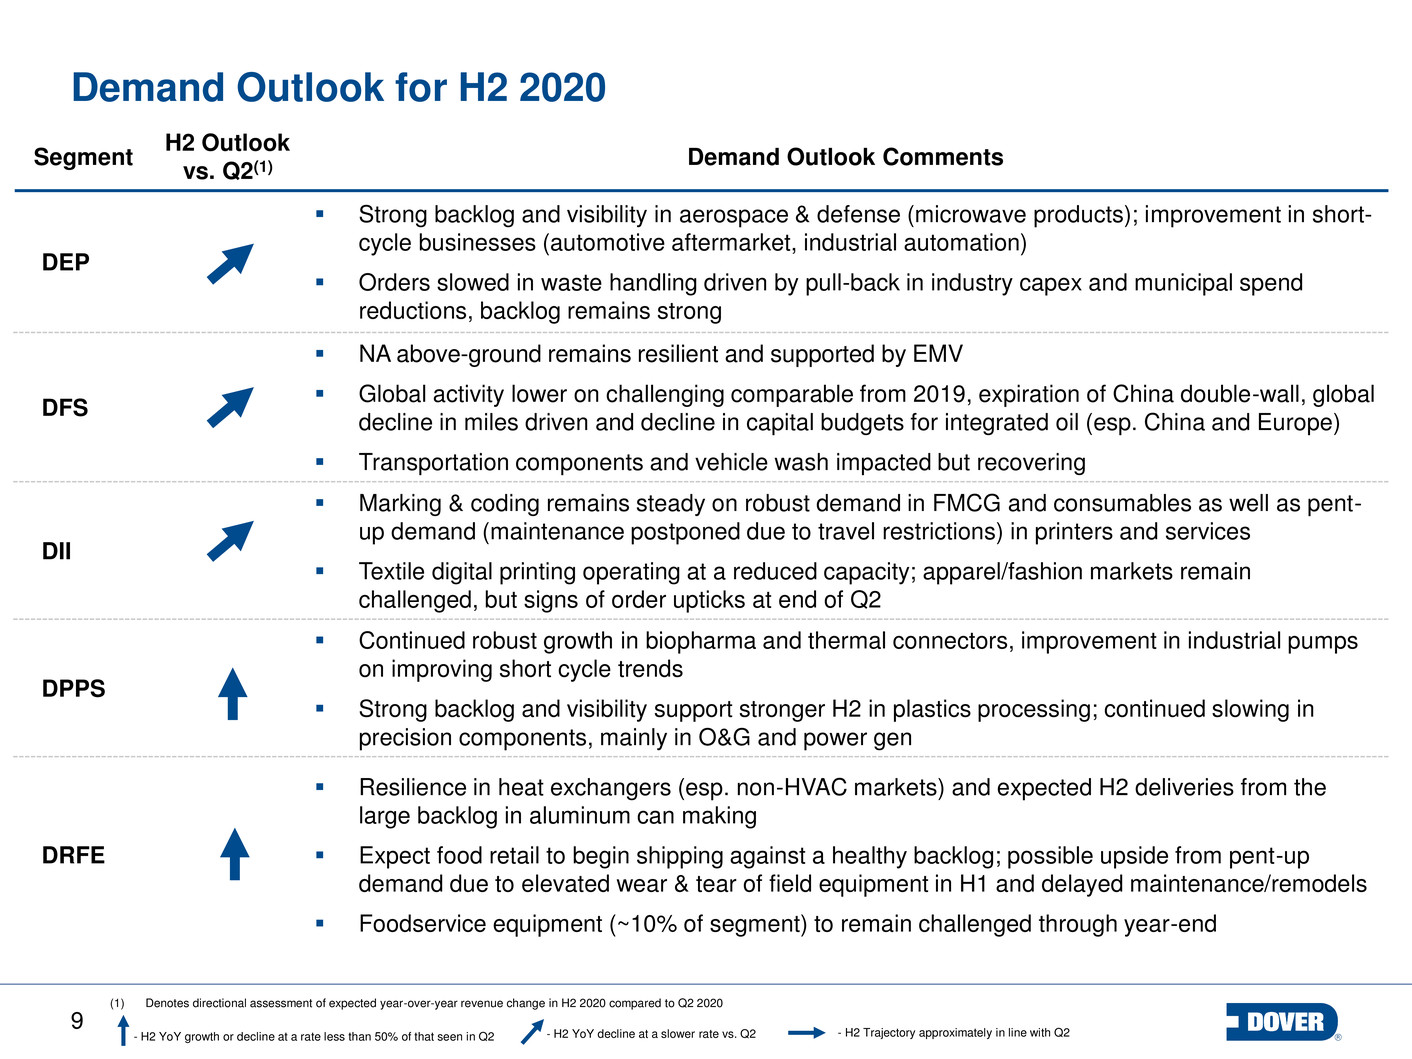
9 Demand Outlook for H2 2020 Segment H2 Outlook vs. Q2(1) Demand Outlook Comments DEP Strong backlog and visibility in aerospace & defense (microwave products); improvement in short- cycle businesses (automotive aftermarket, industrial automation) Orders slowed in waste handling driven by pull-back in industry capex and municipal spend reductions, backlog remains strong DFS NA above-ground remains resilient and supported by EMV Global activity lower on challenging comparable from 2019, expiration of China double-wall, global decline in miles driven and decline in capital budgets for integrated oil (esp. China and Europe) Transportation components and vehicle wash impacted but recovering DII Marking & coding remains steady on robust demand in FMCG and consumables as well as pent- up demand (maintenance postponed due to travel restrictions) in printers and services Textile digital printing operating at a reduced capacity; apparel/fashion markets remain challenged, but signs of order upticks at end of Q2 DPPS Continued robust growth in biopharma and thermal connectors, improvement in industrial pumps on improving short cycle trends Strong backlog and visibility support stronger H2 in plastics processing; continued slowing in precision components, mainly in O&G and power gen DRFE Resilience in heat exchangers (esp. non-HVAC markets) and expected H2 deliveries from the large backlog in aluminum can making Expect food retail to begin shipping against a healthy backlog; possible upside from pent-up demand due to elevated wear & tear of field equipment in H1 and delayed maintenance/remodels Foodservice equipment (~10% of segment) to remain challenged through year-end (1) Denotes directional assessment of expected year-over-year revenue change in H2 2020 compared to Q2 2020 - H2 YoY growth or decline at a rate less than 50% of that seen in Q2 - H2 YoY decline at a slower rate vs. Q2 - H2 Trajectory approximately in line with Q2
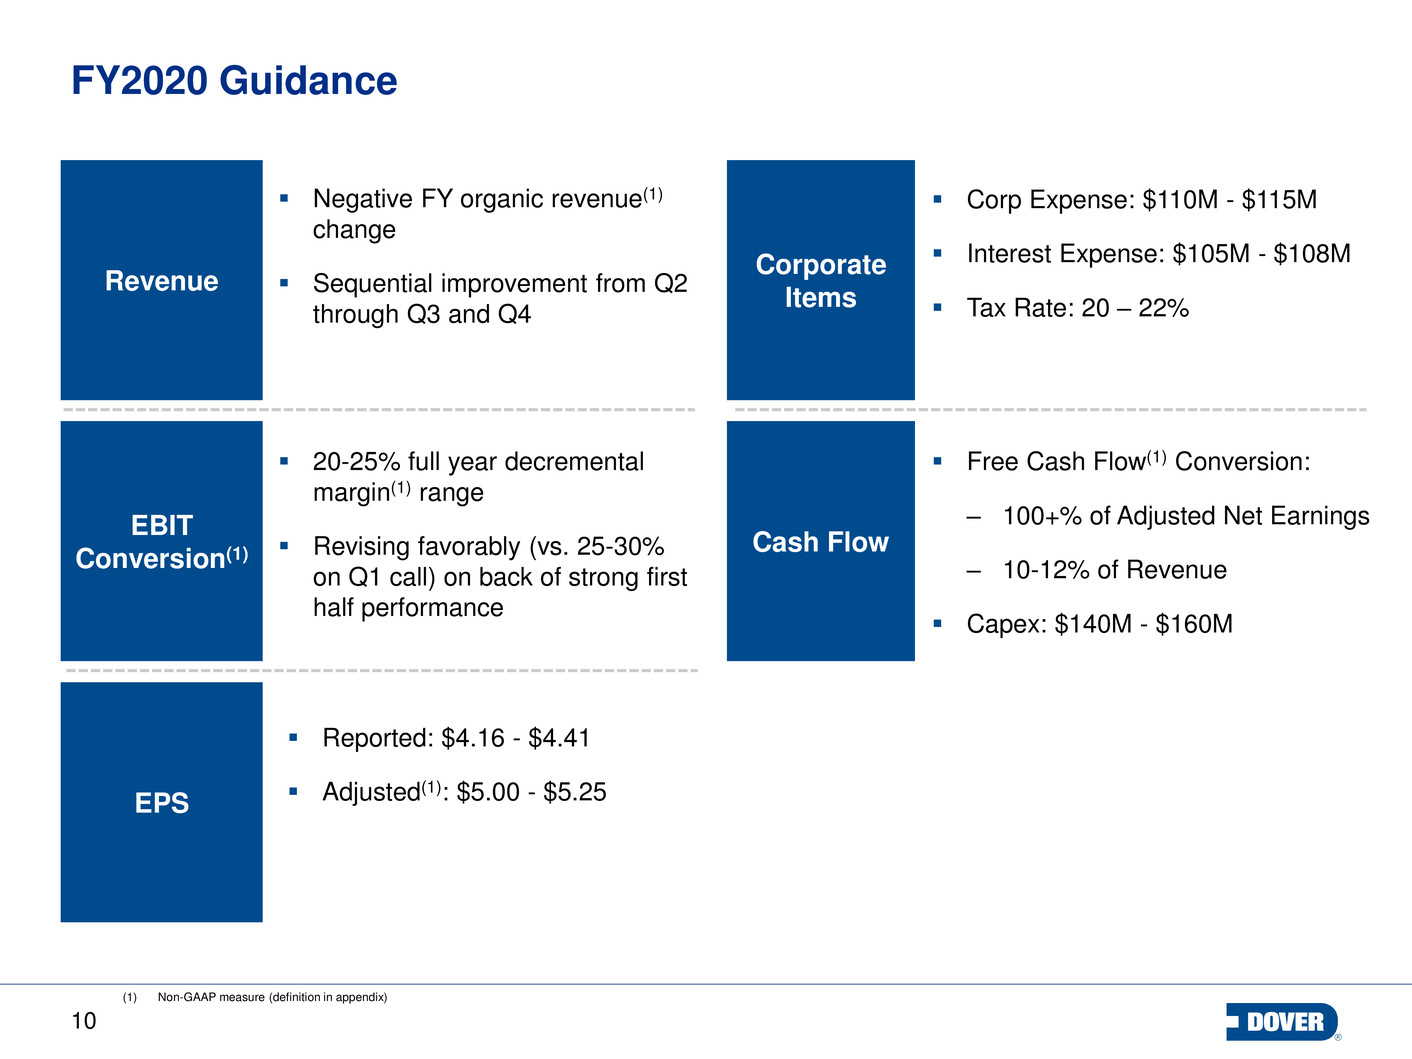
10 FY2020 Guidance Negative FY organic revenue(1) change Sequential improvement from Q2 through Q3 and Q4 Revenue (1) Non-GAAP measure (definition in appendix) EBIT Conversion(1) EPS Corporate Items Cash Flow 20-25% full year decremental margin(1) range Revising favorably (vs. 25-30% on Q1 call) on back of strong first half performance Reported: $4.16 - $4.41 Adjusted(1): $5.00 - $5.25 Corp Expense: $110M - $115M Interest Expense: $105M - $108M Tax Rate: 20 – 22% Free Cash Flow(1) Conversion: – 100+% of Adjusted Net Earnings – 10-12% of Revenue Capex: $140M - $160M
11 Appendix
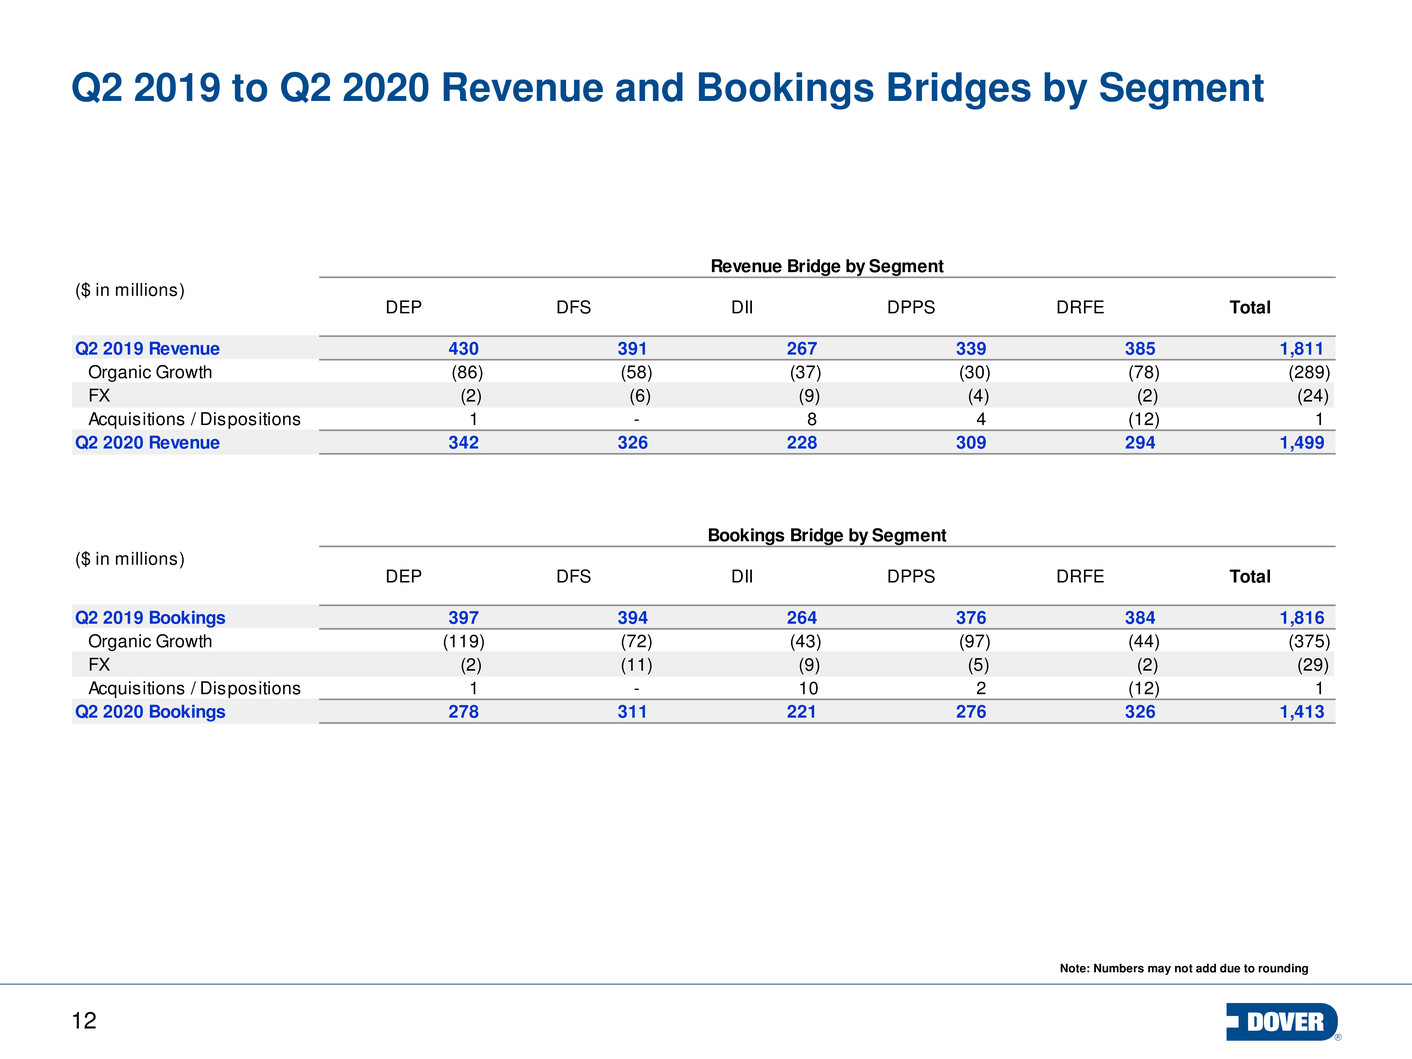
12 Q2 2019 to Q2 2020 Revenue and Bookings Bridges by Segment Note: Numbers may not add due to rounding DEP DFS DII DPPS DRFE Total 430 391 267 339 385 1,811 (86) (58) (37) (30) (78) (289) (2) (6) (9) (4) (2) (24) 1 - 8 4 (12) 1 342 326 228 309 294 1,499 DEP DFS DII DPPS DRFE Total 397 394 264 376 384 1,816 (119) (72) (43) (97) (44) (375) (2) (11) (9) (5) (2) (29) 1 - 10 2 (12) 1 278 311 221 276 326 1,413 FX Q2 2020 Bookings Q2 2019 Bookings Organic Growth Acquisitions / Dispositions ($ in millions) Q2 2019 Revenue Bookings Bridge by Segment ($ in millions) Acquisitions / Dispositions Q2 2020 Revenue Organic Growth FX Revenue Bridge by Segment
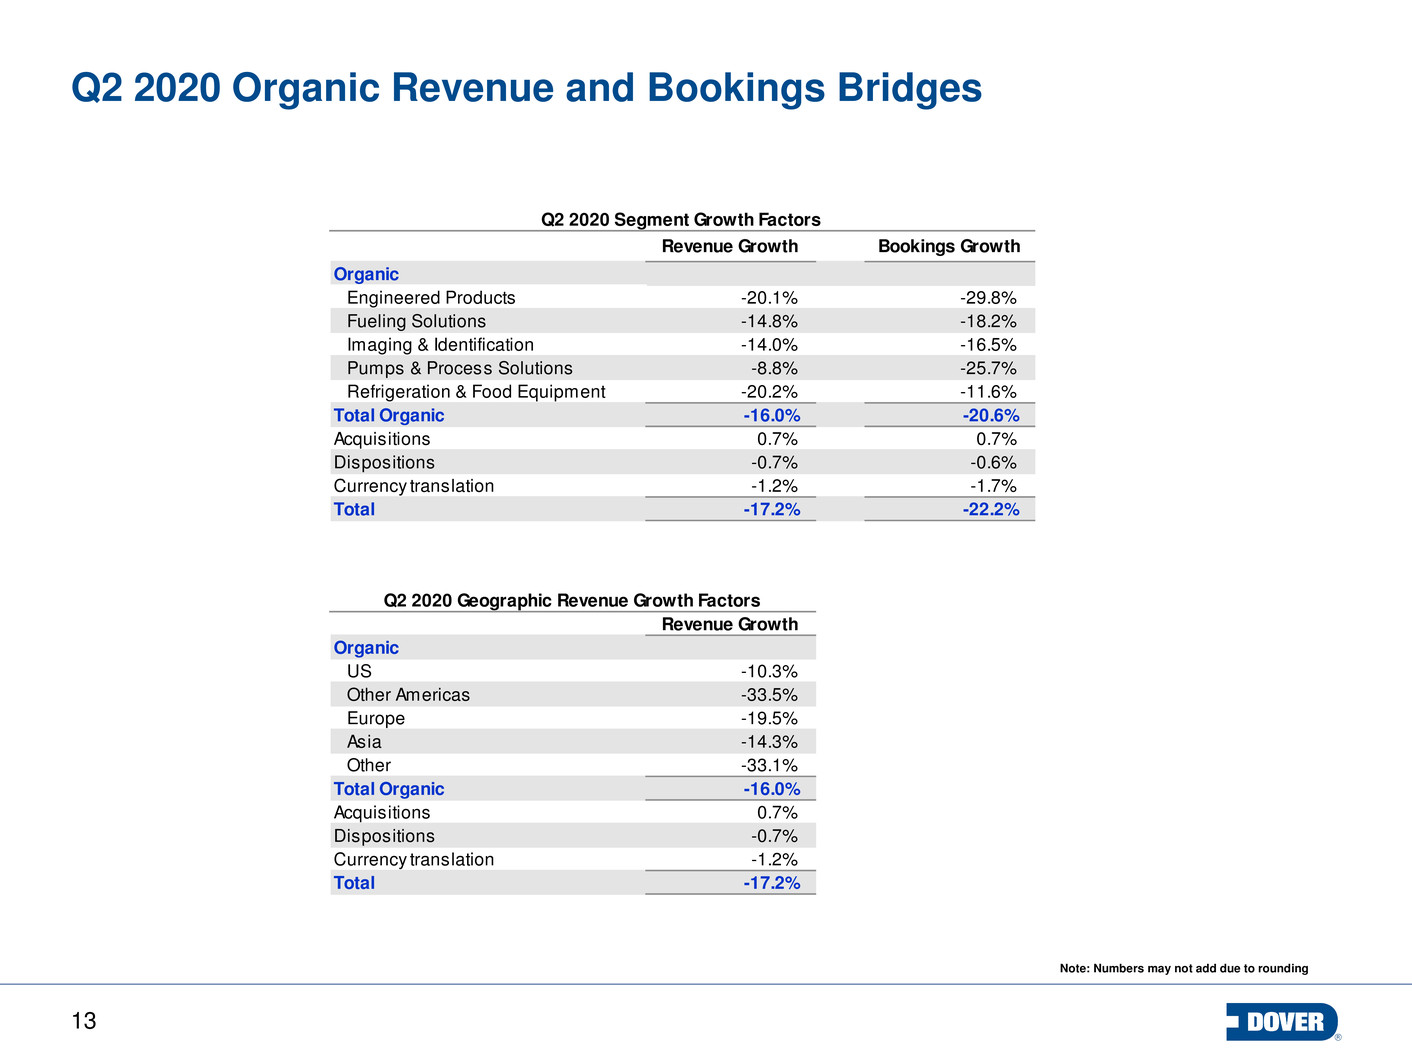
13 Q2 2020 Organic Revenue and Bookings Bridges Note: Numbers may not add due to rounding Q2 2020 Segment Growth Factors Revenue Growth Bookings Growth -20.1% -29.8% -14.8% -18.2% -14.0% -16.5% -8.8% -25.7% -20.2% -11.6% -16.0% -20.6% 0.7% 0.7% -0.7% -0.6% -1.2% -1.7% Total -17.2% -22.2% Q2 2020 Geographic Revenue Growth Factors Revenue Growth -10.3% -33.5% -19.5% -14.3% -33.1% -16.0% 0.7% -0.7% -1.2% Total -17.2% Acquisitions Dispositions Currency translation Organic US Other Americas Europe Asia Other Total Organic Acquisitions Dispositions Currency translation Organic Refrigeration & Food Equipment Total Organic Engineered Products Pumps & Process Solutions Fueling Solutions Imaging & Identification
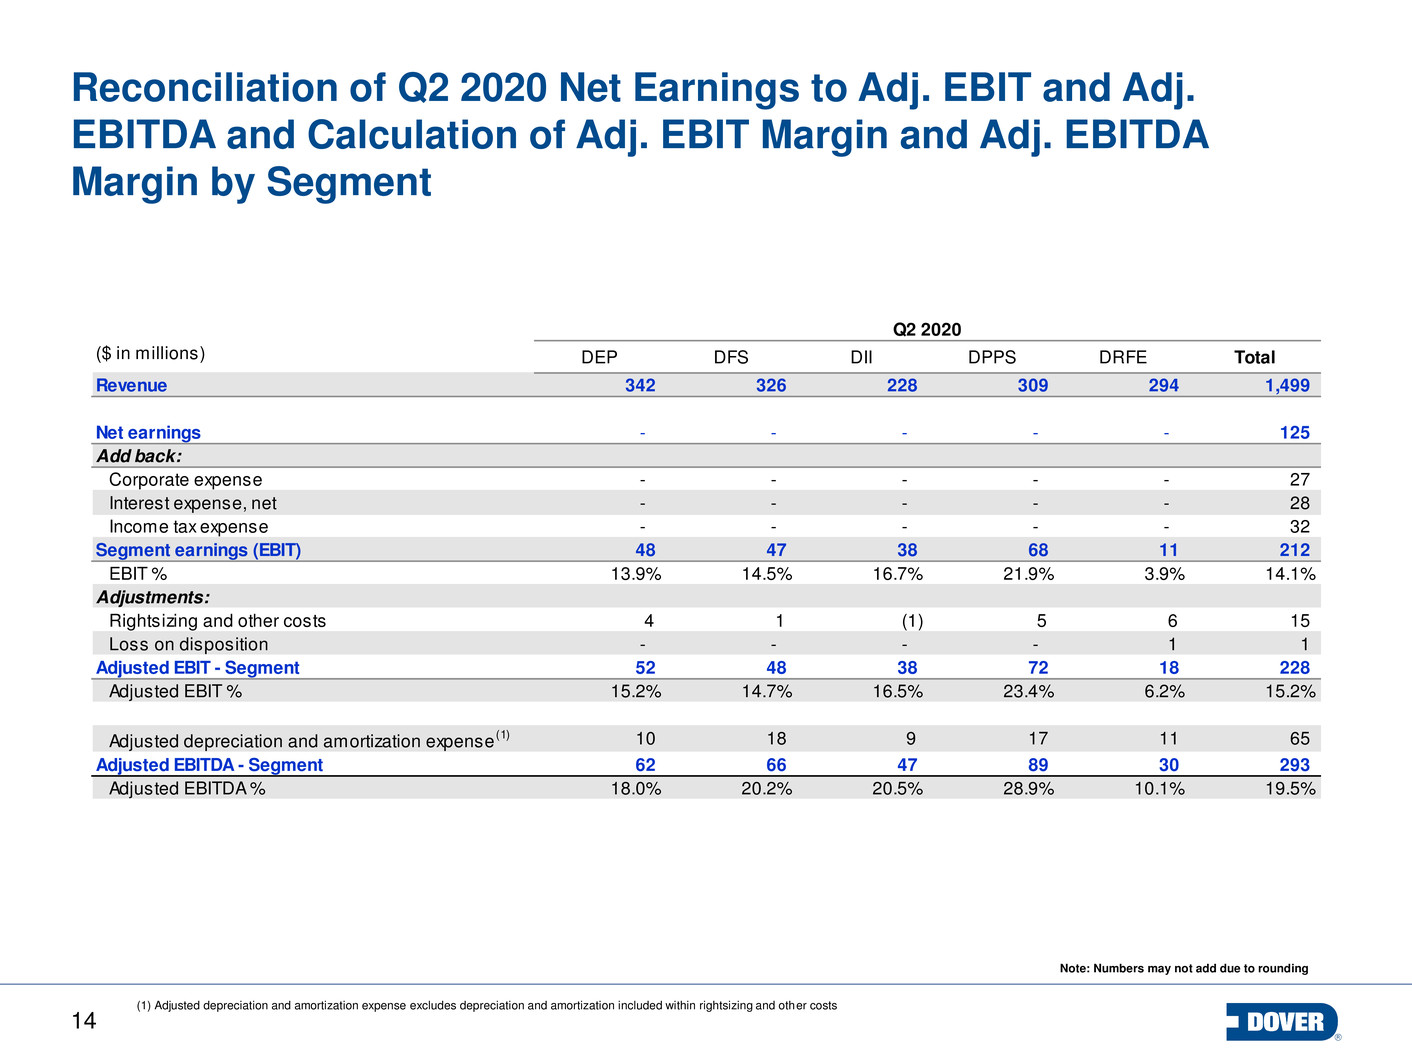
14 Reconciliation of Q2 2020 Net Earnings to Adj. EBIT and Adj. EBITDA and Calculation of Adj. EBIT Margin and Adj. EBITDA Margin by Segment Note: Numbers may not add due to rounding (1) Adjusted depreciation and amortization expense excludes depreciation and amortization included within rightsizing and other costs DEP DFS DII DPPS DRFE Total 342 326 228 309 294 1,499 - - - - - 125 - - - - - 27 - - - - - 28 - - - - - 32 48 47 38 68 11 212 13.9% 14.5% 16.7% 21.9% 3.9% 14.1% 4 1 (1) 5 6 15 - - - - 1 1 52 48 38 72 18 228 15.2% 14.7% 16.5% 23.4% 6.2% 15.2% 10 18 9 17 11 65 62 66 47 89 30 293 18.0% 20.2% 20.5% 28.9% 10.1% 19.5% Q2 2020 ($ in millions) Revenue Net earnings Add back: Adjusted EBITDA - Segment Adjusted EBITDA % Income tax expense Segment earnings (EBIT) EBIT % Adjustments: Rightsizing and other costs Corporate expense Adjusted EBIT - Segment Adjusted EBIT % Adjusted depreciation and amortization expense (1) Interest expense, net Loss on disposition

15 Reconciliation of Q2 2019 Net Earnings to Adj. EBIT and Adj. EBITDA and Calculation of Adj. EBIT Margin and Adj. EBITDA Margin by Segment Note: Numbers may not add due to rounding DEP DFS DII DPPS DRFE Total 430 391 267 339 385 1,811 - - - - - 198 - - - - - 25 - - - - - 31 - - - - - 52 77 53 55 76 44 305 17.9% 13.5% 20.5% 22.5% 11.5% 16.8% 1 2 1 1 1 6 78 54 56 77 45 311 18.2% 13.9% 21.0% 22.8% 11.7% 17.2% 10 19 7 16 13 65 88 73 63 93 58 376 20.5% 18.8% 23.7% 27.6% 15.0% 20.7% Q2 2019 ($ in millions) Revenue Net earnings Add back: Adjusted EBITDA - Segment Adjusted EBITDA % Income tax expense Segment earnings (EBIT) EBIT % Adjustments: Rightsizing and other costs Corporate expense Adjusted EBIT - Segment Adjusted EBIT % Adjusted depreciation and amortization expense (1) Interest expense, net (1) Adjusted depreciation and amortization expense excludes depreciation and amortization included within rightsizing and other costs
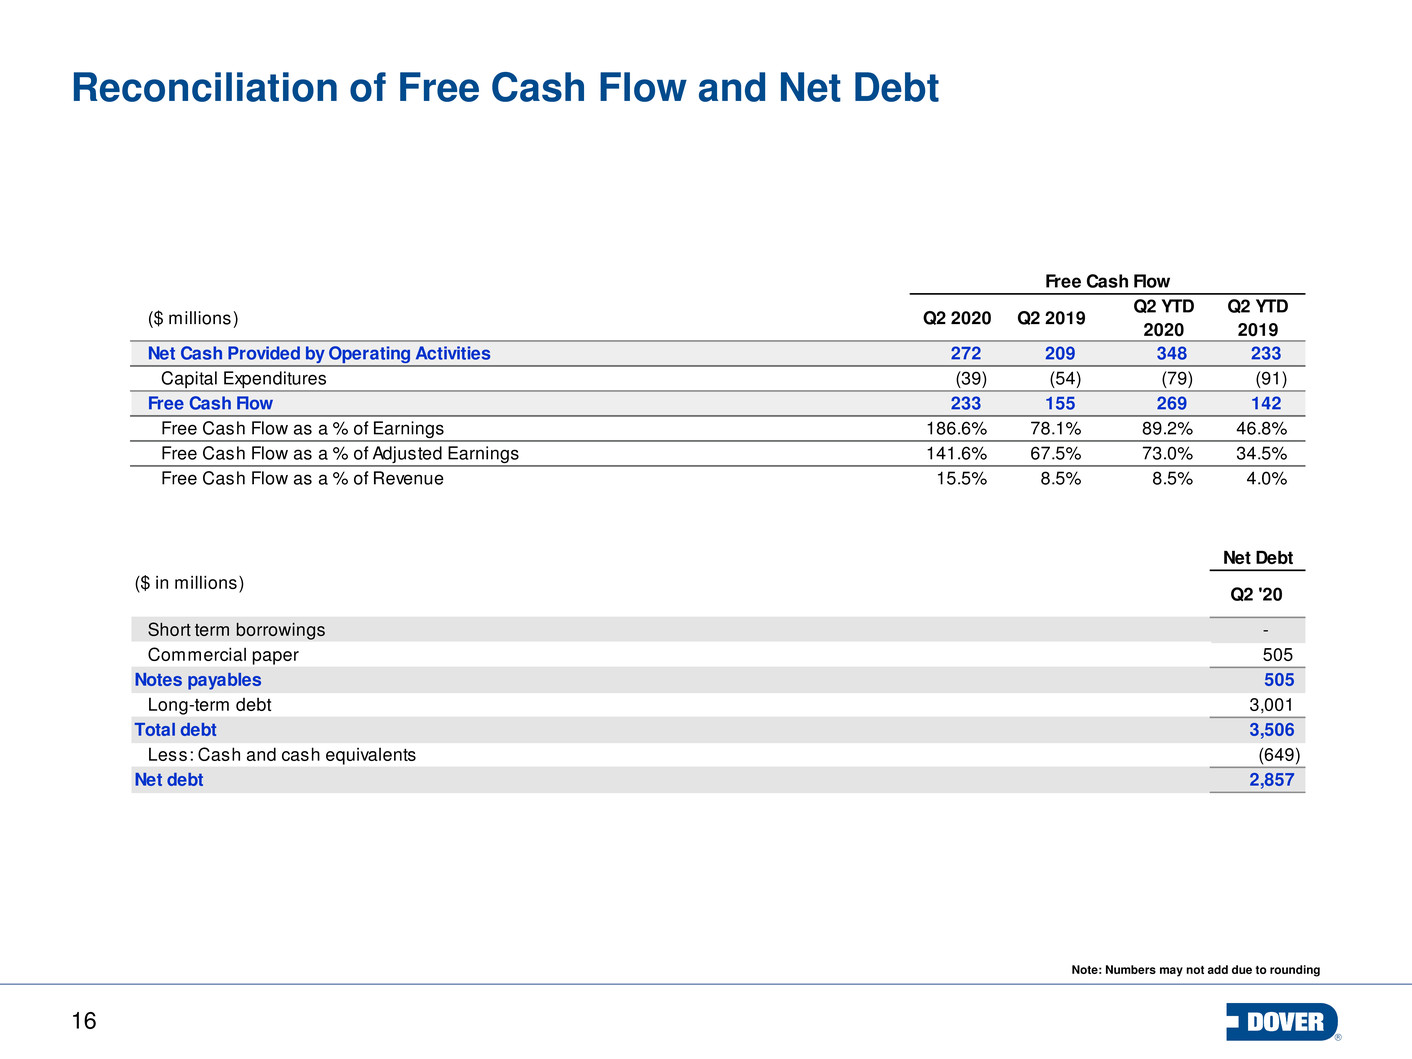
16 Reconciliation of Free Cash Flow and Net Debt Note: Numbers may not add due to rounding ($ millions) Q2 2020 Q2 2019 Q2 YTD 2020 Q2 YTD 2019 Net Cash Provided by Operating Activities 272 209 348 233 Capital Expenditures (39) (54) (79) (91) Free Cash Flow 233 155 269 142 Free Cash Flow as a % of Earnings 186.6% 78.1% 89.2% 46.8% Free Cash Flow as a % of Adjusted Earnings 141.6% 67.5%18 .4% 73.0% 34.5% Free Cash Flow as a % of Revenue 15.5% 8.5%18 .4% 8.5% 4.0% Net Debt Q2 '20 - 505 505 3,001 3,506 (649) 2,857 Notes payables Long-term debt Total debt Less: Cash and cash equivalents Net debt Free Cash Flow ($ in millions) Short term borrowings Commercial paper
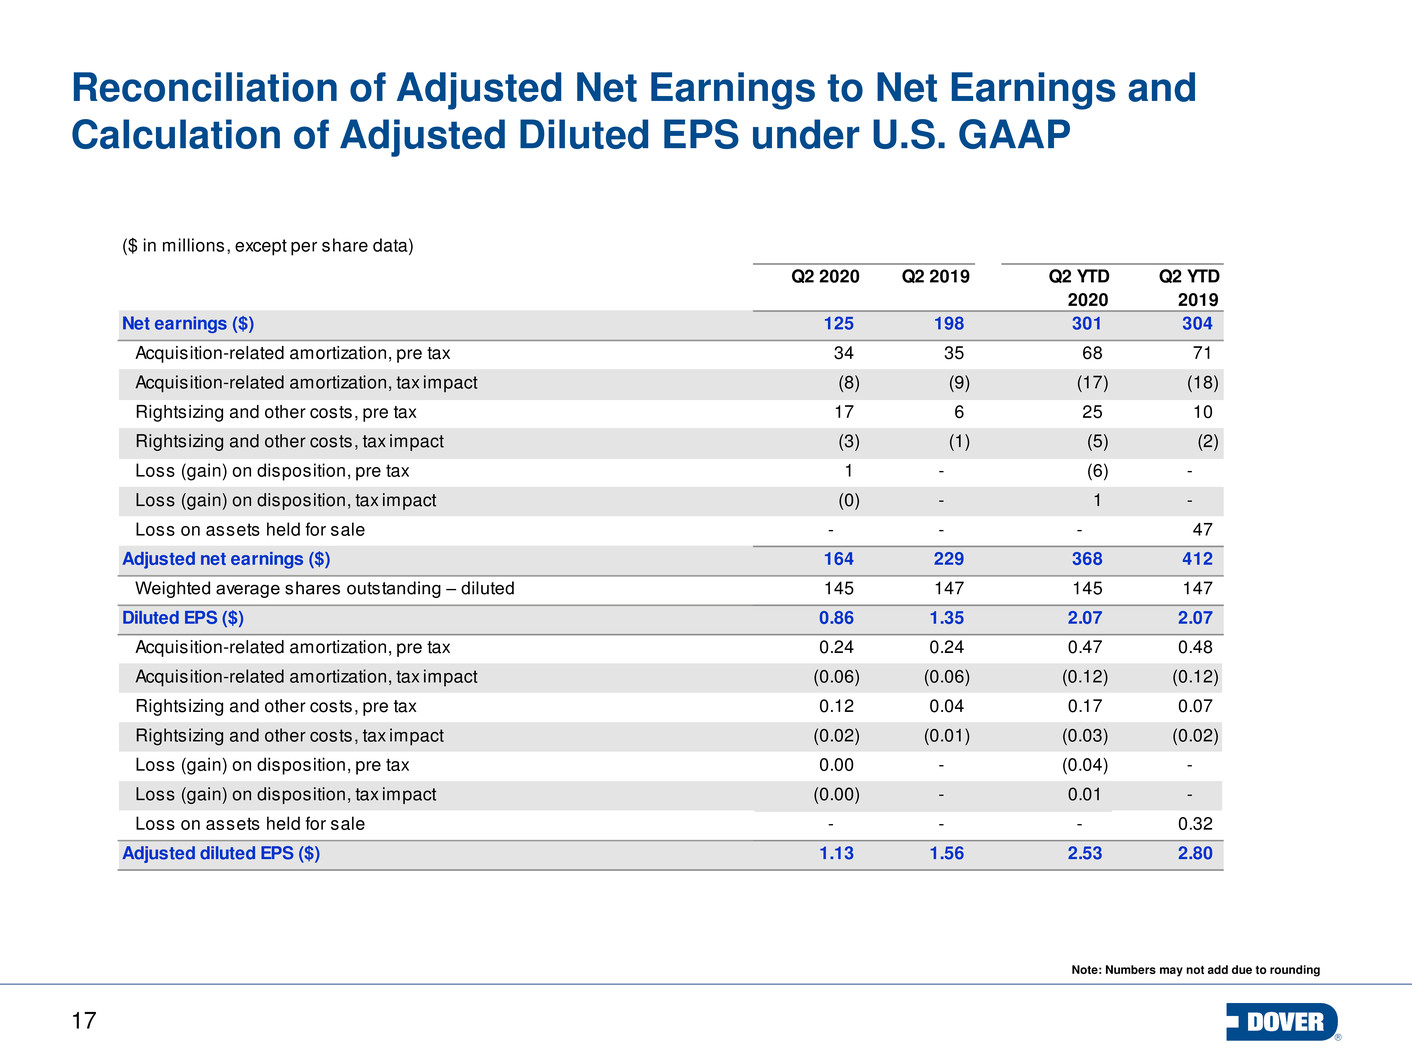
17 Reconciliation of Adjusted Net Earnings to Net Earnings and Calculation of Adjusted Diluted EPS under U.S. GAAP Note: Numbers may not add due to rounding ($ in millions, except per share data) Q2 2020 Q2 2019 Q2 YTD 2020 Q2 YTD 2019 Net earnings ($) 125 198 301 304 Acquisition-related amortization, pre tax 34 35 68 71 Acquisition-related amortization, tax impact (8) (9) (17) (18) Rightsizing and other costs, pre tax 17 6 25 10 Rightsizing and other costs, tax impact (3) (1) (5) (2) Loss (gain) on disposition, pre tax 1 - (6) - Loss (gain) on disposition, tax impact (0) - 1 - Loss on assets held for sale - - - 47 Adjusted net earnings ($) 164 229 368 412 Weighted average shares outstanding – diluted 145 147 145 147 Diluted EPS ($) 0.86 1.35 2.07 2.07 Acquisition-related amortization, pre tax 0.24 0.24 0.47 0.48 Acquisition-related amortization, tax impact (0.06) (0.06) (0.12) (0.12) Rightsizing and other costs, pre tax 0.12 0.04 0.17 0.07 Rightsizing and other costs, tax impact (0.02) (0.01) (0.03) (0.02) Loss (gain) on disposition, pre tax 0.00 - (0.04) - Loss (gain) on disposition, tax impact (0.00) - 0.01 - Loss on assets held for sale - - - 0.32 Adjusted diluted EPS ($) 1.13 1.56 2.53 2.80
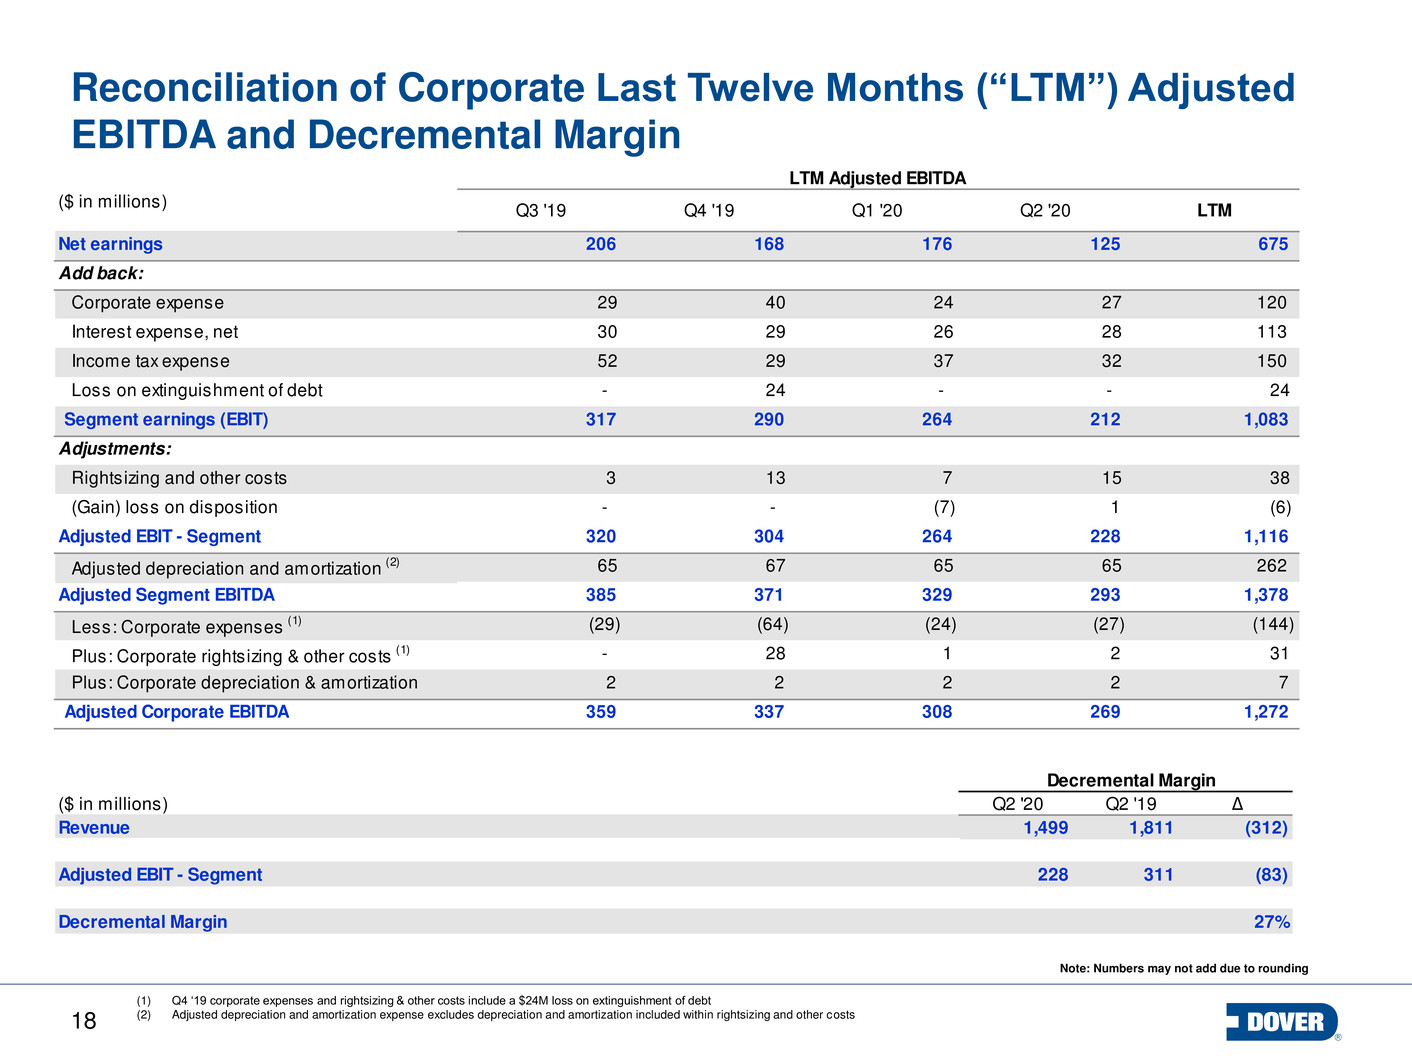
18 Reconciliation of Corporate Last Twelve Months (“LTM”) Adjusted EBITDA and Decremental Margin Note: Numbers may not add due to rounding Q3 '19 Q4 '19 Q1 '20 Q2 '20 LTM 206 168 176 125 675 29 40 24 27 120 30 29 26 28 113 52 29 37 32 150 - 24 - - 24 317 290 264 212 1,083 3 13 7 15 38 - - (7) 1 (6) 320 304 264 228 1,116 65 67 65 65 262 385 371 329 293 1,378 (29) (64) (24) (27) (144) - 28 1 2 31 2 2 2 2 7 359 337 308 269 1,272 Adjustments: Rightsizing and other costs Adjusted EBIT - Segment Adjusted depreciation and amortization (2) (Gain) loss on disposition Plus: Corporate depreciation & amortization Adjusted Corporate EBITDA Adjusted Segment EBITDA Less: Corporate expenses (1) LTM Adjusted EBITDA ($ in millions) Plus: Corporate rightsizing & other costs (1) Net earnings Add back: Corporate expense Interest expense, net Income tax expense Loss on extinguishment of debt Segment earnings (EBIT) (1) Q4 ‘19 corporate expenses and rightsizing & other costs include a $24M loss on extinguishment of debt (2) Adjusted depreciation and amortization expense excludes depreciation and amortization included within rightsizing and other costs Decremental Margin Q2 '20 Q2 '19 ∆ 1,499 1,811 (312) 228 311 (83) 27%Decremental Margin ($ in millions) Revenue Adjusted EBIT - Segment
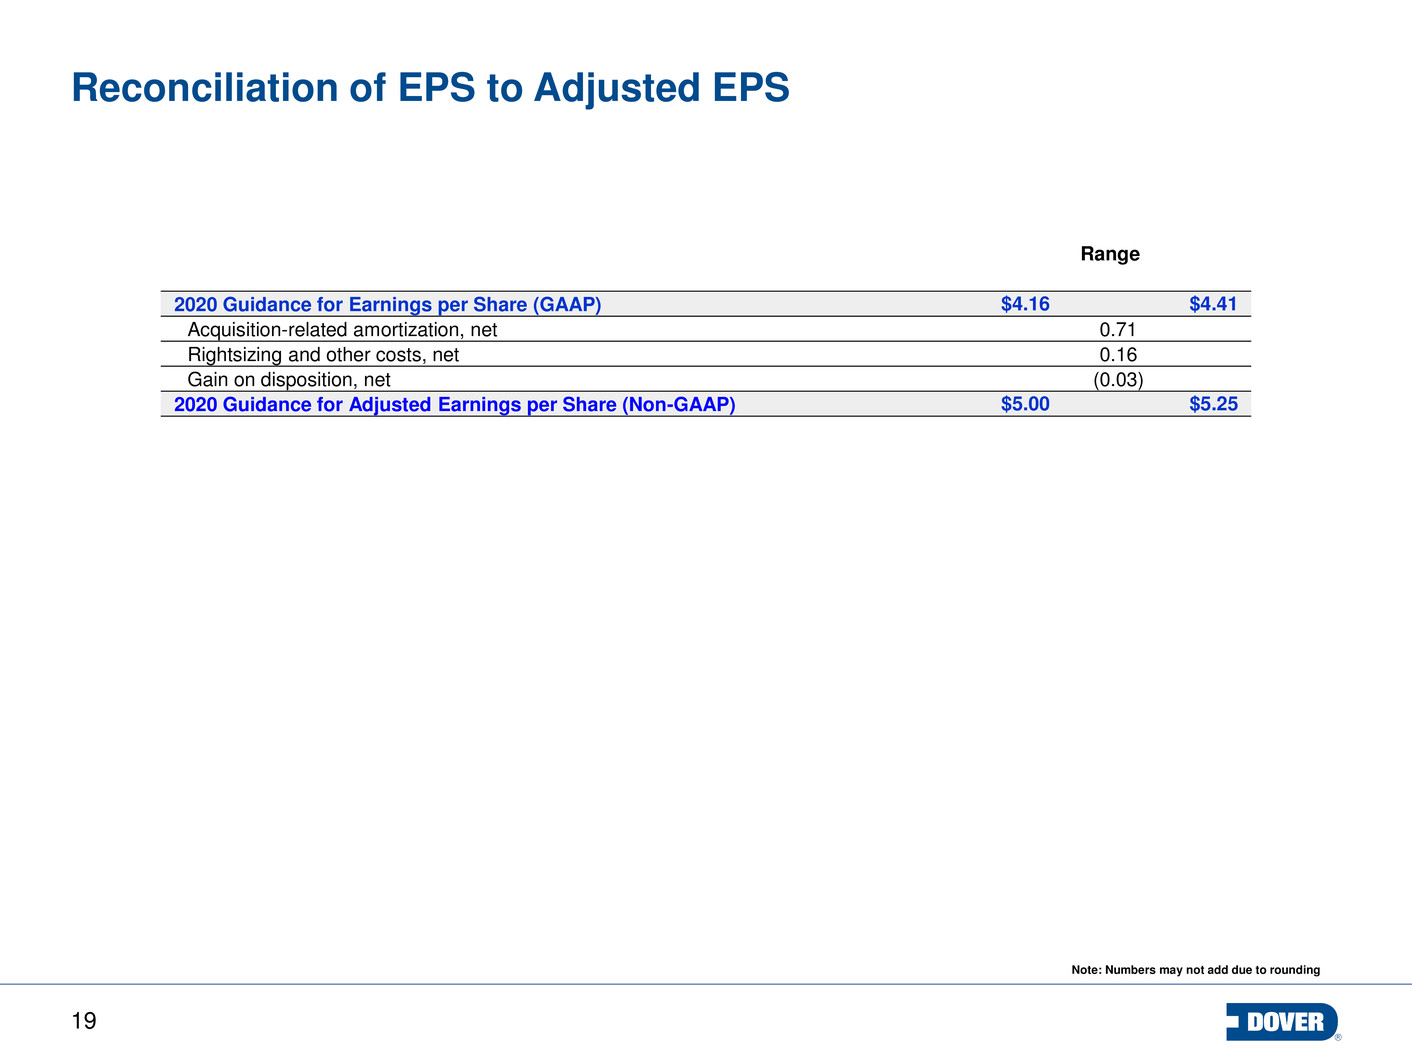
19 Reconciliation of EPS to Adjusted EPS Range 2020 Guidance for Earnings per Share (GAAP) $4.16 $4.41 Acquisition-related amortization, net 0.71- Rightsizing and other costs, net 0.16- Gain on disposition, net (0.03) 2020 Guidance for Adjusted Earnings per Share (Non-GAAP) $5.00 $5.25 Note: Numbers may not add due to rounding
20 Non-GAAP Definitions Definitions of Non-GAAP Measures: Adjusted Net Earnings: is defined as net earnings adjusted for the effect of acquisition-related amortization, rightsizing and other costs, a 2019 loss on assets held for sale and a 2020 gain on disposition. Adjusted Diluted Net Earnings Per Share: is defined as adjusted net earnings divided by average diluted shares. Total segment earnings (EBIT): is defined as net earnings before income taxes, net interest expense and corporate expenses. Total segment earnings (EBIT) margin: is defined as total segment earnings (EBIT) divided by revenue. Adjusted EBIT by Segment: is defined as net earnings before income taxes, net interest expense, corporate expenses, rightsizing and other costs, a 2019 loss on assets held for sale and a 2020 gain/loss on disposition. Adjusted EBIT Margin by Segment: is defined as adjusted EBIT by segment divided by segment revenue. The bps change Y-o-Y is calculated as the difference between adjusted EBIT margin for the current period and the prior period. Adjusted EBITDA by Segment: is defined as adjusted EBIT by segment plus depreciation and amortization, excluding depreciation and amortization included within rightsizing and other costs. Adjusted EBITDA Margin by Segment: is defined as adjusted EBITDA by segment divided by segment revenue. EBIT Conversion / Decremental Margin: is defined as the change in total adjusted segment earnings (EBIT) divided by the change in revenue. Free Cash Flow: is defined as net cash provided by operating activities minus capital expenditures. Free cash flow as a percentage of revenue equals free cash flow divided by revenue. Free cash flow as a percentage of net earnings equals free cash flow divided by net earnings. Free cash flow as a percentage of adjusted net earnings equals free cash flow divided by adjusted net earnings. Organic Revenue Growth: is defined as revenue growth excluding the impact of foreign currency exchange rates and the impact of acquisitions and dispositions. Net debt: is defined as total debt minus cash and cash equivalents. LTM Adjusted EBITDA: is defined as adjusted segment EBITDA, less corporate expenses, plus corporate rightsizing and other costs and corporate depreciation and amortization. The tables included in this presentation provide reconciliations of the non-GAAP measures used in this presentation to the most directly comparable U.S. GAAP measures. Further information regarding management’s use of these non-GAAP measures is included in Dover’s earnings release and investor supplement for the second quarter.
21 Performance Measure Definitions Definitions of Performance Measures: Bookings represent total orders received from customers in the current reporting period. This metric is an important measure of performance and an indicator of revenue order trends. Organic Bookings represent total orders received from customers in the current reporting period excluding the impact of foreign currency exchange rates and the impact of acquisitions and dispositions. This metric is an important measure of performance and an indicator of revenue order trends. Backlog represents an estimate of the total remaining bookings at a point in time for which performance obligations have not yet been satisfied. This metric is useful as it represents the aggregate amount we expect to recognize as revenue in the future. Book-to-bill is a ratio of the amount of bookings received from customers during a period divided by the amount of revenue recorded during that same period. This metric is a useful indicator of demand. We use the above operational metrics in monitoring the performance of the business. We believe the operational metrics are useful to investors and other users of our financial information in assessing the performance of our segments.
