Earnings Conference Call Fourth Quarter and Full Year 2021 January 27, 2022 – 8:30am CT Exhibit 99.2
2 Forward-Looking Statements and Non-GAAP Measures We want to remind everyone that our comments may contain forward-looking statements that are inherently subject to uncertainties and risks, including the impacts of the novel coronavirus (COVID-19) on the global economy and on our customers, suppliers, employees, operations, business, liquidity and cash flow, supply chain constraints and labor shortages that could result in production stoppages, and inflation in material input costs and freight logistics. We caution everyone to be guided in their analysis of Dover Corporation by referring to the documents we file from time to time with the SEC, including our Annual Report on Form 10-K and Quarterly Reports on Form 10-Q, for a list of factors that could cause our results to differ from those anticipated in any such forward-looking statements. We would also direct your attention to our website, dovercorporation.com, where considerably more information can be found. In addition to financial measures based on U.S. GAAP, Dover provides supplemental non-GAAP financial information. Management uses non-GAAP measures in addition to GAAP measures to understand and compare operating results across periods, make resource allocation decisions, and for forecasting and other purposes. Management believes these non-GAAP measures reflect results in a manner that enables, in many instances, more meaningful analysis of trends and facilitates comparison of results across periods and to those of peer companies. These non-GAAP financial measures have no standardized meaning presented in U.S. GAAP and may not be comparable to other similarly titled measures used by other companies due to potential differences between the companies in calculations. The use of these non-GAAP measures has limitations and they should not be considered as substitutes for measures of financial performance and financial position as prepared in accordance with U.S. GAAP. Reconciliations and definitions are included either in this presentation or in Dover’s earnings release and investor supplement for the fourth quarter, which are available on Dover’s website.
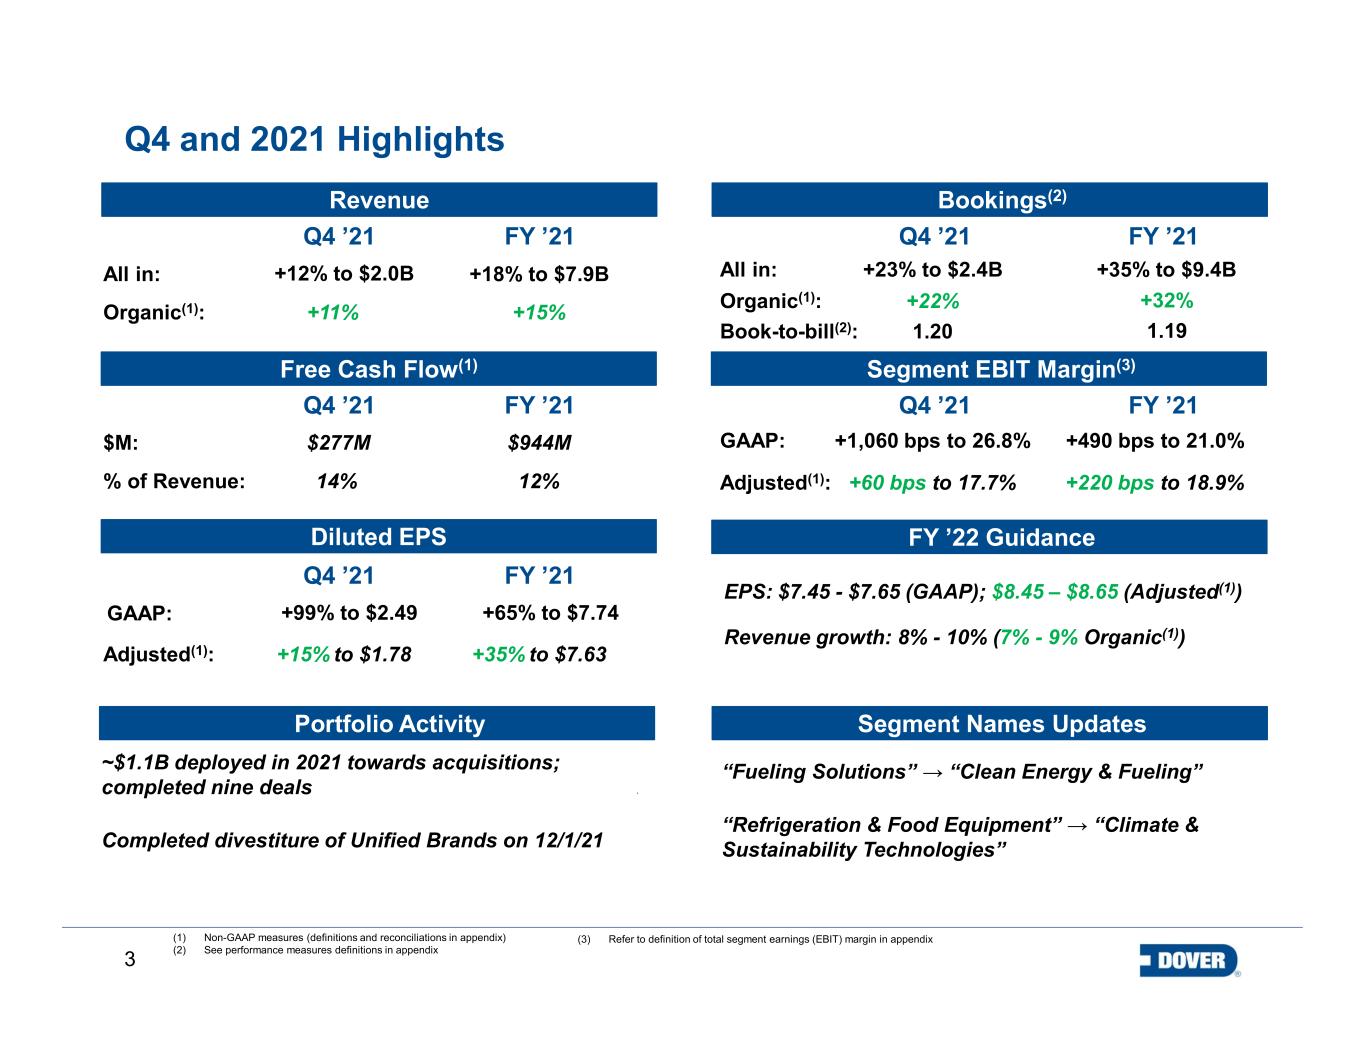
3 Free Cash Flow(1) +60 bps to 17.7% $277M Q4 and 2021 Highlights (1) Non-GAAP measures (definitions and reconciliations in appendix) (2) See performance measures definitions in appendix EPS: $7.45 - $7.65 (GAAP); $8.45 – $8.65 (Adjusted(1)) Revenue growth: 8% - 10% (7% - 9% Organic(1)) Revenue +22%Organic(1): Diluted EPS +15% to $1.78 Bookings(2) +23% to $2.4B Segment EBIT Margin(3) +1,060 bps to 26.8% 14% +99% to $2.49 Portfolio Activity Segment Names Updates “Fueling Solutions” → “Clean Energy & Fueling” “Refrigeration & Food Equipment” → “Climate & Sustainability Technologies” (3) Refer to definition of total segment earnings (EBIT) margin in appendix FY ’22 Guidance ~$1.1B deployed in 2021 towards acquisitions; completed nine deals Completed divestiture of Unified Brands on 12/1/21 Q4 ’21 FY ’21 All in: +15% +18% to $7.9B Q4 ’21 FY ’21 Q4 ’21 FY ’21 Organic(1): All in: Book-to-bill(2): Q4 ’21 FY ’21 Q4 ’21 FY ’21 Adjusted(1): GAAP: +220 bps to 18.9% +490 bps to 21.0% +35% to $9.4B +32% 1.19 Adjusted(1): GAAP: $944M 12% +35% to $7.63 +65% to $7.74 +12% to $2.0B +11% % of Revenue: $M: 1.20
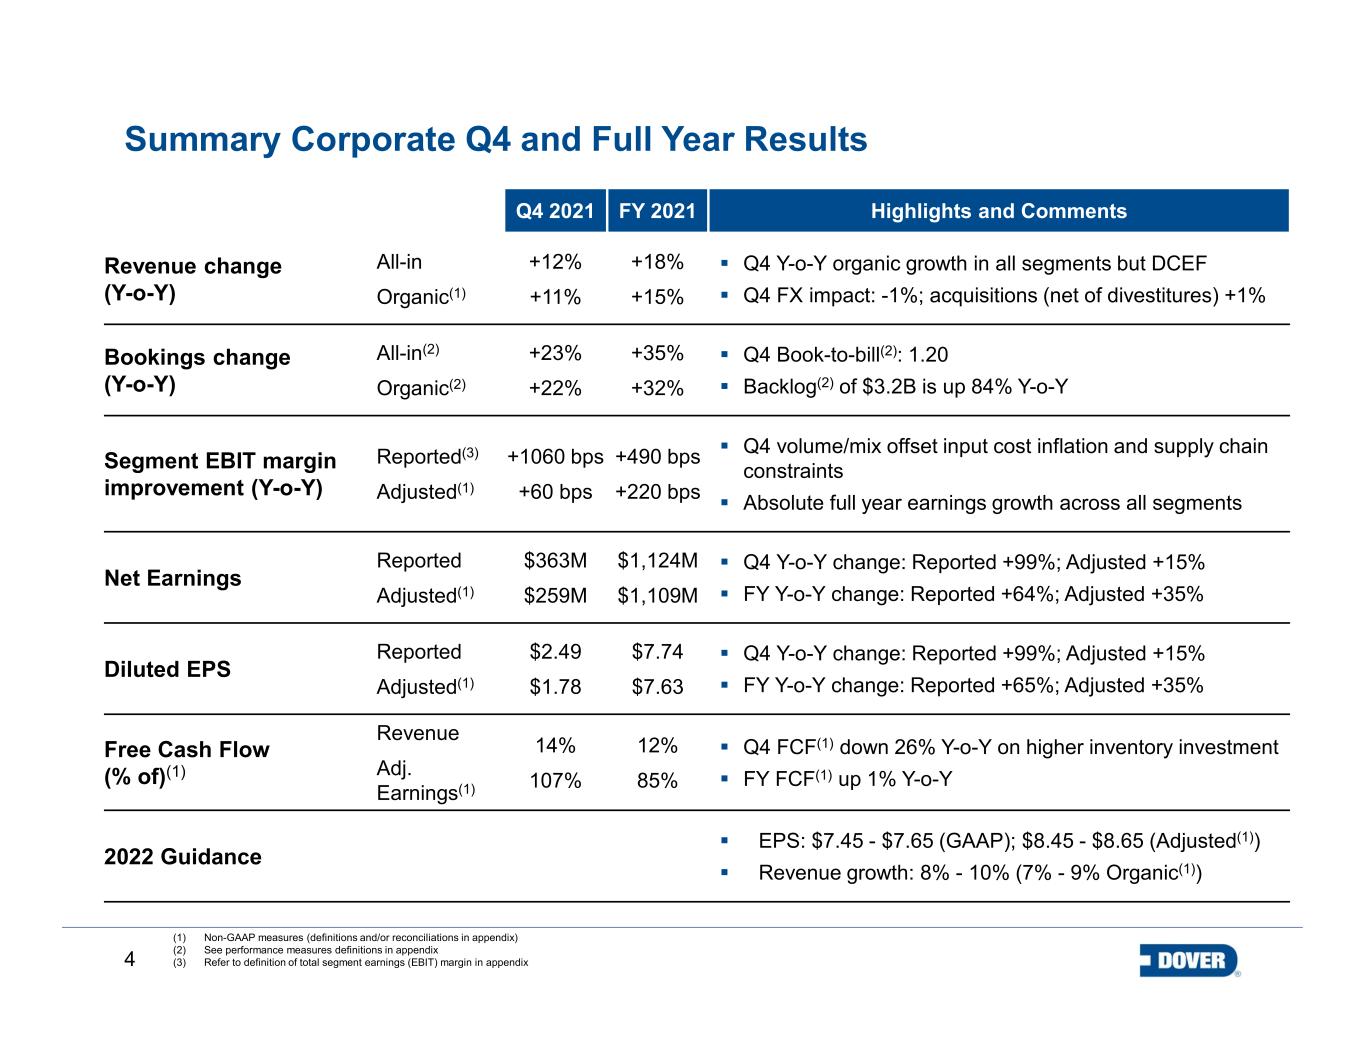
4 Summary Corporate Q4 and Full Year Results Q4 2021 FY 2021 Highlights and Comments Revenue change (Y-o-Y) All-in Organic(1) +12% +11% +18% +15% Q4 Y-o-Y organic growth in all segments but DCEF Q4 FX impact: -1%; acquisitions (net of divestitures) +1% Bookings change (Y-o-Y) All-in(2) Organic(2) +23% +22% +35% +32% Q4 Book-to-bill(2): 1.20 Backlog(2) of $3.2B is up 84% Y-o-Y Segment EBIT margin improvement (Y-o-Y) Reported(3) Adjusted(1) +1060 bps +60 bps +490 bps +220 bps Q4 volume/mix offset input cost inflation and supply chain constraints Absolute full year earnings growth across all segments Net Earnings Reported Adjusted(1) $363M $259M $1,124M $1,109M Q4 Y-o-Y change: Reported +99%; Adjusted +15% FY Y-o-Y change: Reported +64%; Adjusted +35% Diluted EPS Reported Adjusted(1) $2.49 $1.78 $7.74 $7.63 Q4 Y-o-Y change: Reported +99%; Adjusted +15% FY Y-o-Y change: Reported +65%; Adjusted +35% Free Cash Flow (% of)(1) Revenue Adj. Earnings(1) 14% 107% 12% 85% Q4 FCF(1) down 26% Y-o-Y on higher inventory investment FY FCF(1) up 1% Y-o-Y 2022 Guidance EPS: $7.45 - $7.65 (GAAP); $8.45 - $8.65 (Adjusted(1)) Revenue growth: 8% - 10% (7% - 9% Organic(1)) (1) Non-GAAP measures (definitions and/or reconciliations in appendix) (2) See performance measures definitions in appendix (3) Refer to definition of total segment earnings (EBIT) margin in appendix
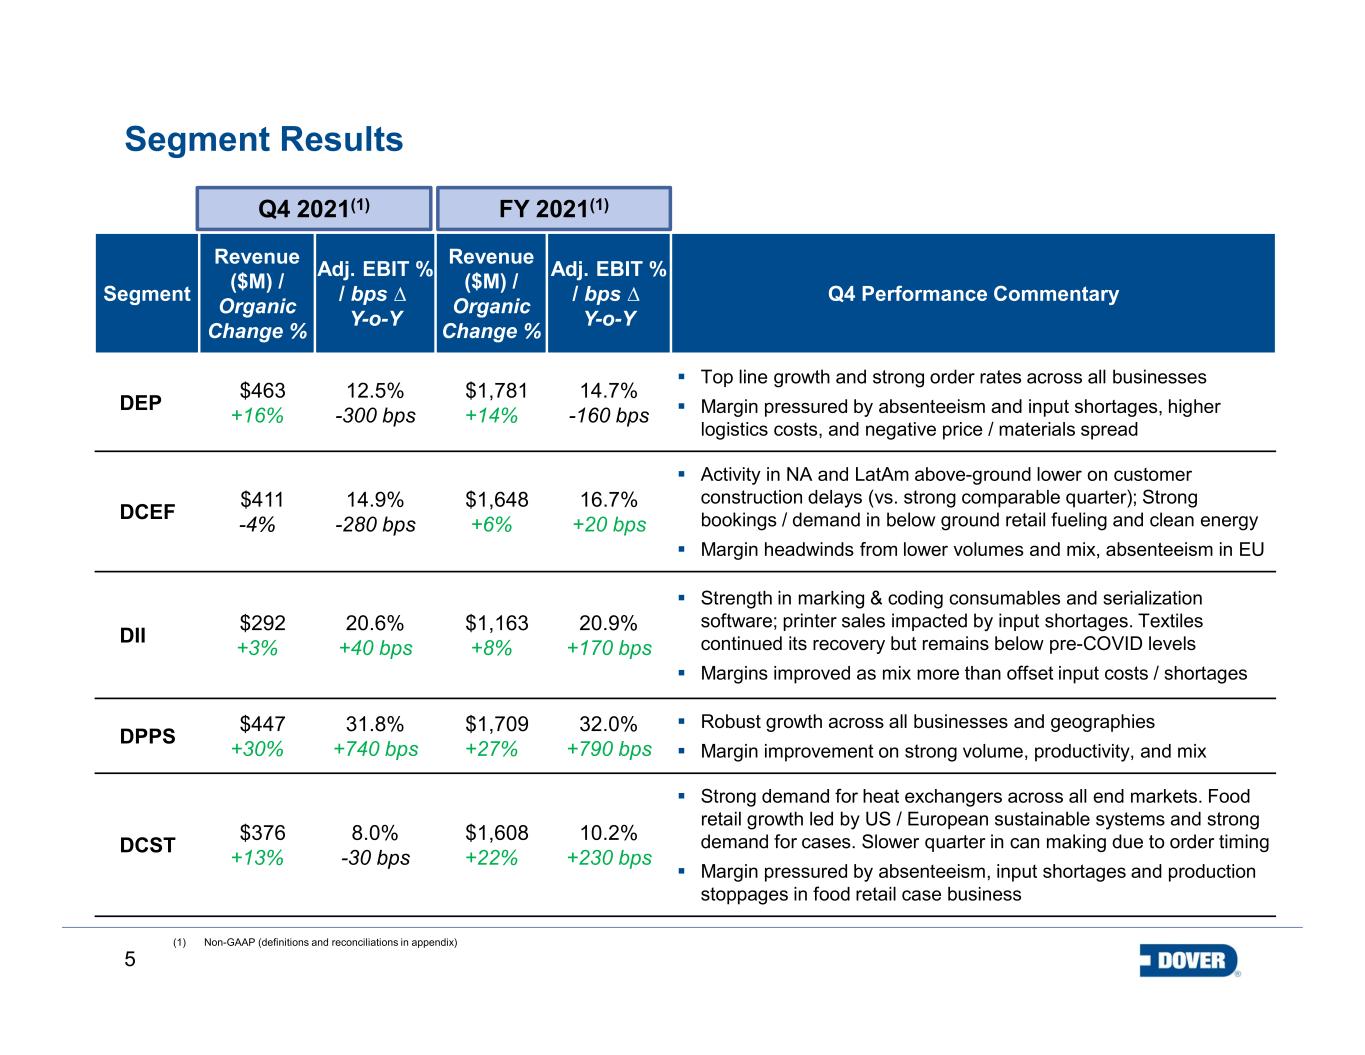
5 Segment Revenue ($M) / Organic Change % Adj. EBIT % / bps ∆ Y-o-Y Revenue ($M) / Organic Change % Adj. EBIT % / bps ∆ Y-o-Y Q4 Performance Commentary DEP $463 +16% 12.5% -300 bps $1,781 +14% 14.7% -160 bps Top line growth and strong order rates across all businesses Margin pressured by absenteeism and input shortages, higher logistics costs, and negative price / materials spread DCEF $411 -4% 14.9% -280 bps $1,648 +6% 16.7% +20 bps Activity in NA and LatAm above-ground lower on customer construction delays (vs. strong comparable quarter); Strong bookings / demand in below ground retail fueling and clean energy Margin headwinds from lower volumes and mix, absenteeism in EU DII $292 +3% 20.6% +40 bps $1,163 +8% 20.9% +170 bps Strength in marking & coding consumables and serialization software; printer sales impacted by input shortages. Textiles continued its recovery but remains below pre-COVID levels Margins improved as mix more than offset input costs / shortages DPPS $447 +30% 31.8% +740 bps $1,709 +27% 32.0% +790 bps Robust growth across all businesses and geographies Margin improvement on strong volume, productivity, and mix DCST $376 +13% 8.0% -30 bps $1,608 +22% 10.2% +230 bps Strong demand for heat exchangers across all end markets. Food retail growth led by US / European sustainable systems and strong demand for cases. Slower quarter in can making due to order timing Margin pressured by absenteeism, input shortages and production stoppages in food retail case business Segment Results Q4 2021(1) (1) Non-GAAP (definitions and reconciliations in appendix) FY 2021(1)
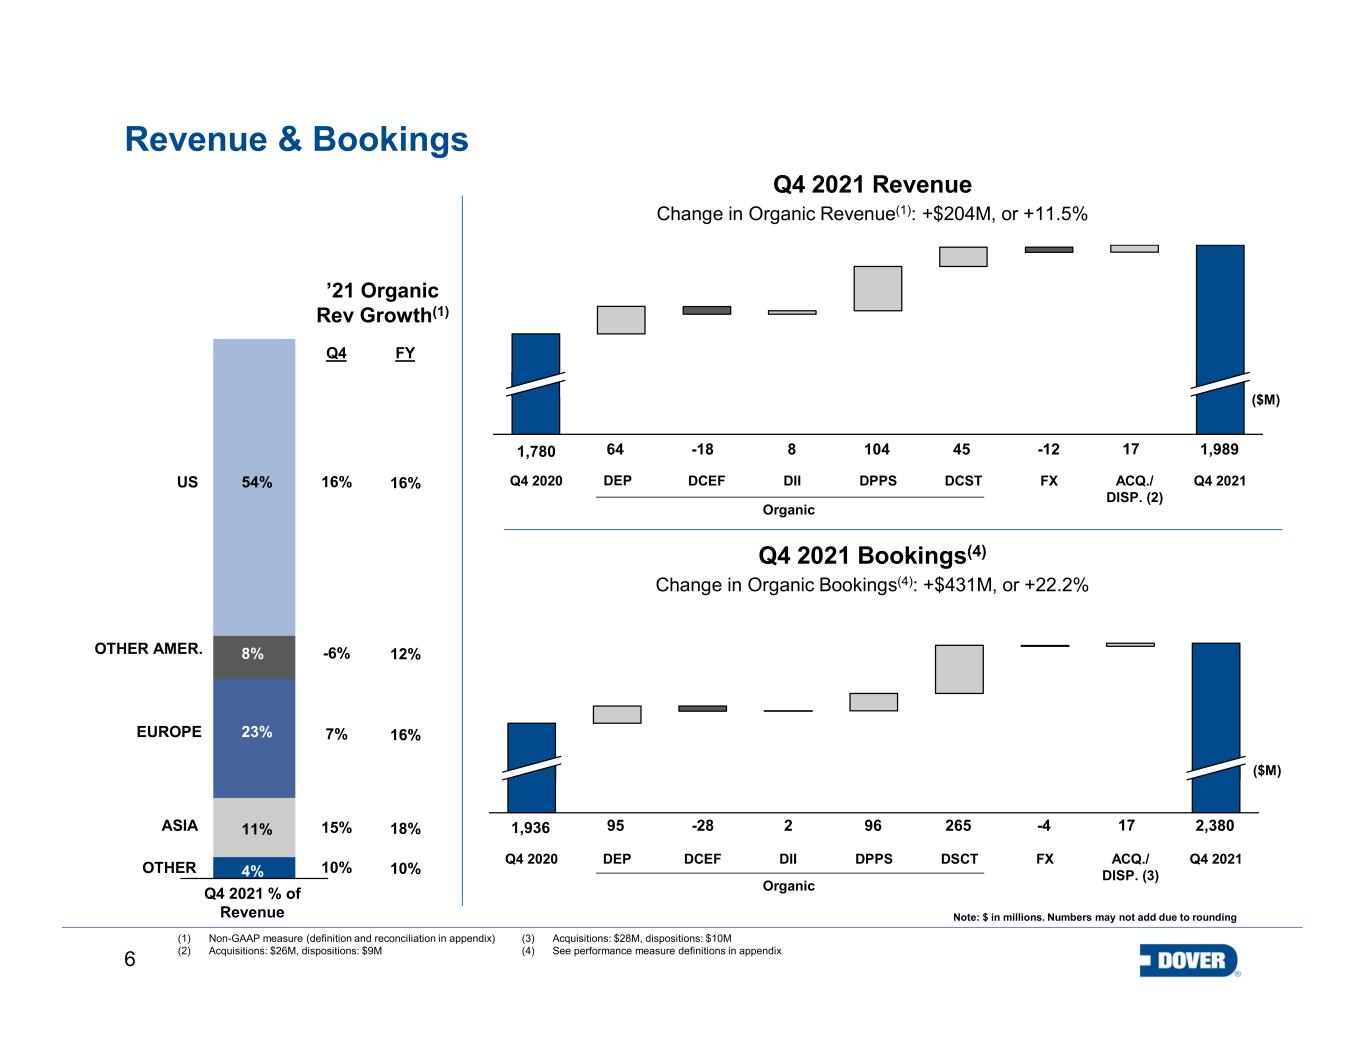
6 Q4 2020 Revenue & Bookings Q4 2021 Revenue Change in Organic Revenue(1): +$204M, or +11.5% Q4 2021DIIDCEF DPPS DCST FX ACQ./ DISP. (2) Q4 2020 DEP DCEF DII DPPS DSCT FX ACQ./ DISP. (3) Q4 2021 Note: $ in millions. Numbers may not add due to rounding Q4 2021 Bookings(4) Change in Organic Bookings(4): +$431M, or +22.2% (1) Non-GAAP measure (definition and reconciliation in appendix) (2) Acquisitions: $26M, dispositions: $9M DEP ($M) 1,780 -18 -12 1,9894564 1048 ($M) 17 -28 -4 2,38026595 962 171,936 Q4 2021 % of Revenue 8% 23% 4% 54% 11%ASIA OTHER EUROPE OTHER AMER. US 10% 15% 7% -6% 16% ’21 Organic Rev Growth(1) Organic Organic (3) Acquisitions: $28M, dispositions: $10M (4) See performance measure definitions in appendix Q4 FY 10% 18% 16% 12% 16%
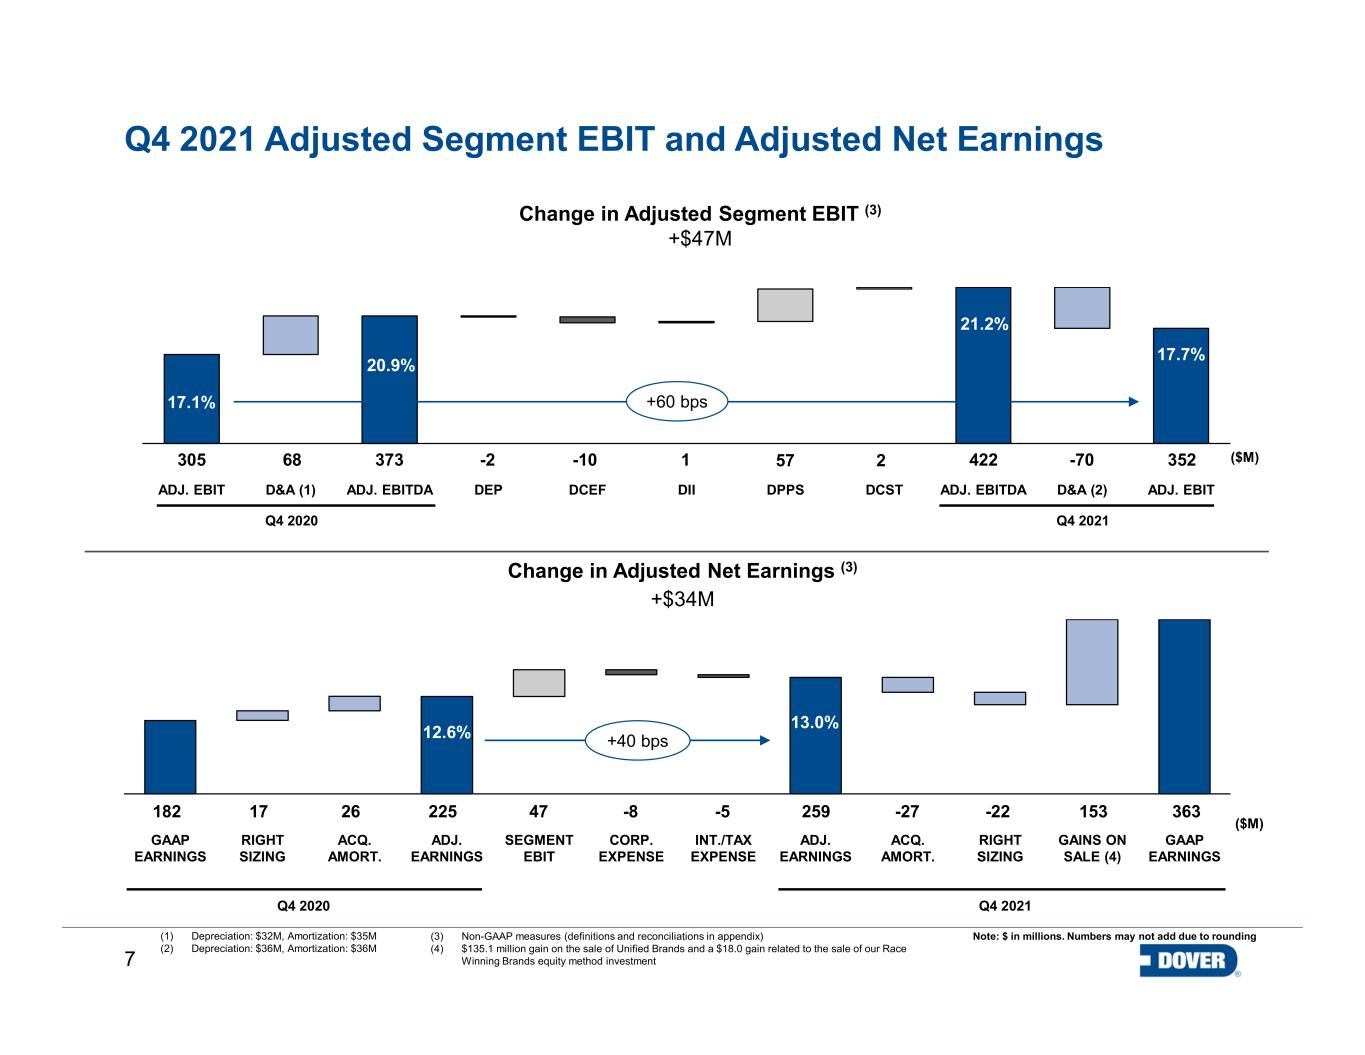
7 Q4 2021 Adjusted Segment EBIT and Adjusted Net Earnings CORP. EXPENSE GAAP EARNINGS SEGMENT EBIT GAINS ON SALE (4) RIGHT SIZING ADJ. EARNINGS ACQ. AMORT. INT./TAX EXPENSE ADJ. EARNINGS ACQ. AMORT. RIGHT SIZING GAAP EARNINGS Change in Adjusted Net Earnings (3) +$34M 182 17 26 225 47 -8 -5 259 -27 -22 Q4 2020 Q4 2021 ($M) Note: $ in millions. Numbers may not add due to rounding 363153 ADJ. EBIT D&A (1) DEPADJ. EBITDA DCEF DII DPPS DCST ADJ. EBITDA D&A (2) ADJ. EBIT 20.9% 17.7% Change in Adjusted Segment EBIT (3) +$47M Q4 2021 305 373 1-2 352 ($M)57 17.1% Q4 2020 -70-10 2 21.2% 42268 (1) Depreciation: $32M, Amortization: $35M (2) Depreciation: $36M, Amortization: $36M +60 bps +40 bps (3) Non-GAAP measures (definitions and reconciliations in appendix) (4) $135.1 million gain on the sale of Unified Brands and a $18.0 gain related to the sale of our Race Winning Brands equity method investment 12.6% 13.0%
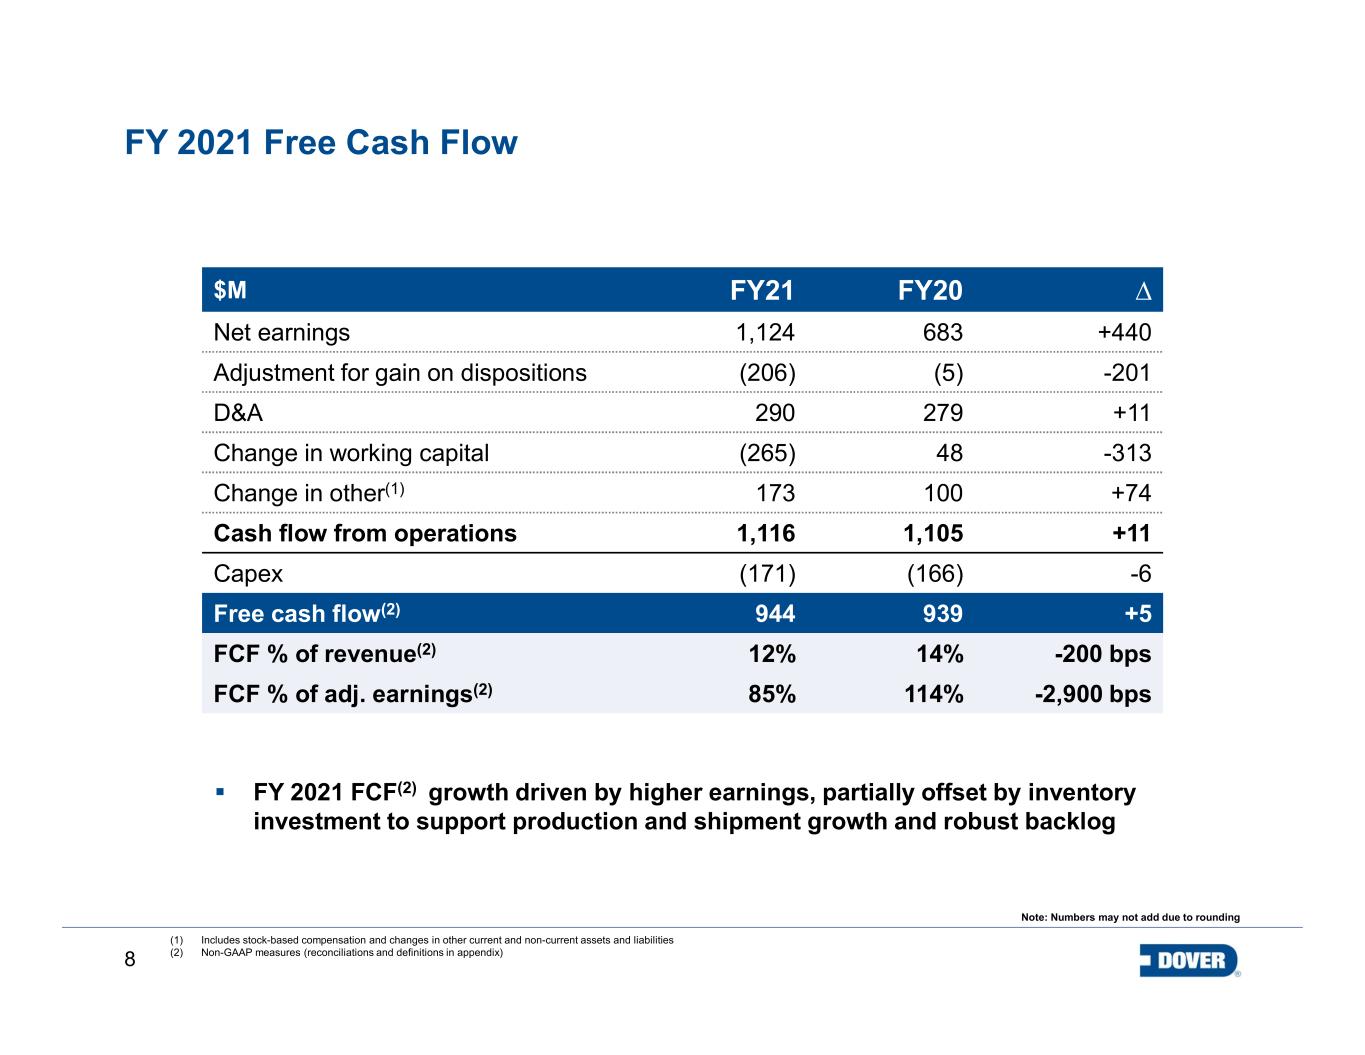
8 FY 2021 Free Cash Flow 12.3% (1) Includes stock-based compensation and changes in other current and non-current assets and liabilities (2) Non-GAAP measures (reconciliations and definitions in appendix) Note: Numbers may not add due to rounding $M FY21 FY20 ∆ Net earnings 1,124 683 +440 Adjustment for gain on dispositions (206) (5) -201 D&A 290 279 +11 Change in working capital (265) 48 -313 Change in other(1) 173 100 +74 Cash flow from operations 1,116 1,105 +11 Capex (171) (166) -6 Free cash flow(2) 944 939 +5 FCF % of revenue(2) 12% 14% -200 bps FCF % of adj. earnings(2) 85% 114% -2,900 bps FY 2021 FCF(2) growth driven by higher earnings, partially offset by inventory investment to support production and shipment growth and robust backlog
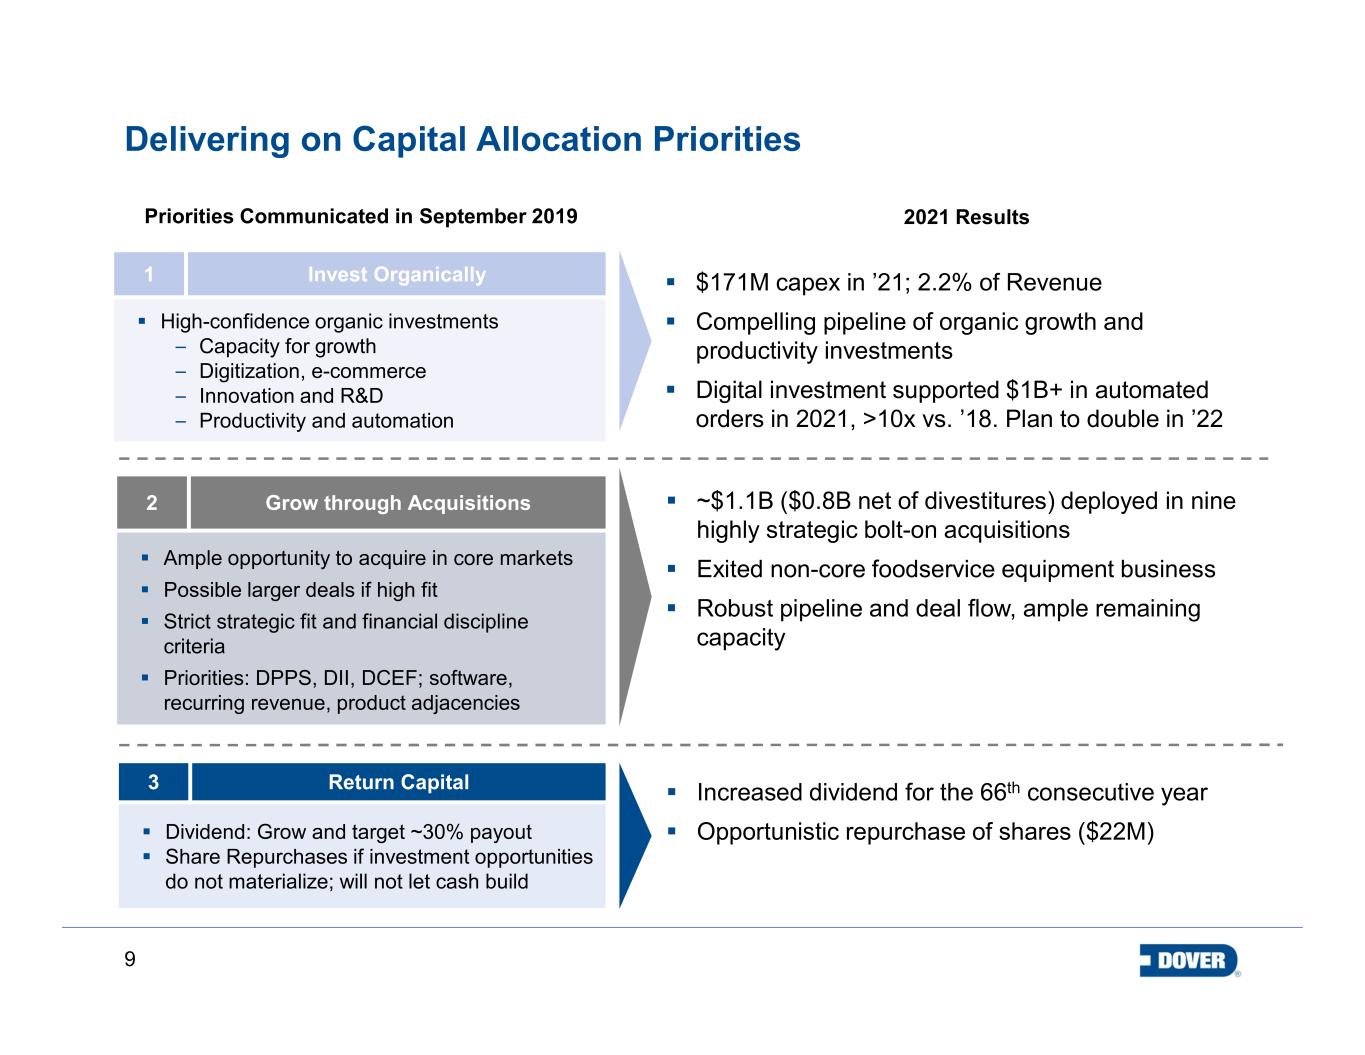
9 2 Grow through Acquisitions Ample opportunity to acquire in core markets Possible larger deals if high fit Strict strategic fit and financial discipline criteria Priorities: DPPS, DII, DCEF; software, recurring revenue, product adjacencies 3 Return Capital Dividend: Grow and target ~30% payout Share Repurchases if investment opportunities do not materialize; will not let cash build $171M capex in ’21; 2.2% of Revenue Compelling pipeline of organic growth and productivity investments Digital investment supported $1B+ in automated orders in 2021, >10x vs. ’18. Plan to double in ’22 Increased dividend for the 66th consecutive year Opportunistic repurchase of shares ($22M) 1 Invest Organically High-confidence organic investments – Capacity for growth – Digitization, e-commerce – Innovation and R&D – Productivity and automation Delivering on Capital Allocation Priorities Priorities Communicated in September 2019 2021 Results ~$1.1B ($0.8B net of divestitures) deployed in nine highly strategic bolt-on acquisitions Exited non-core foodservice equipment business Robust pipeline and deal flow, ample remaining capacity
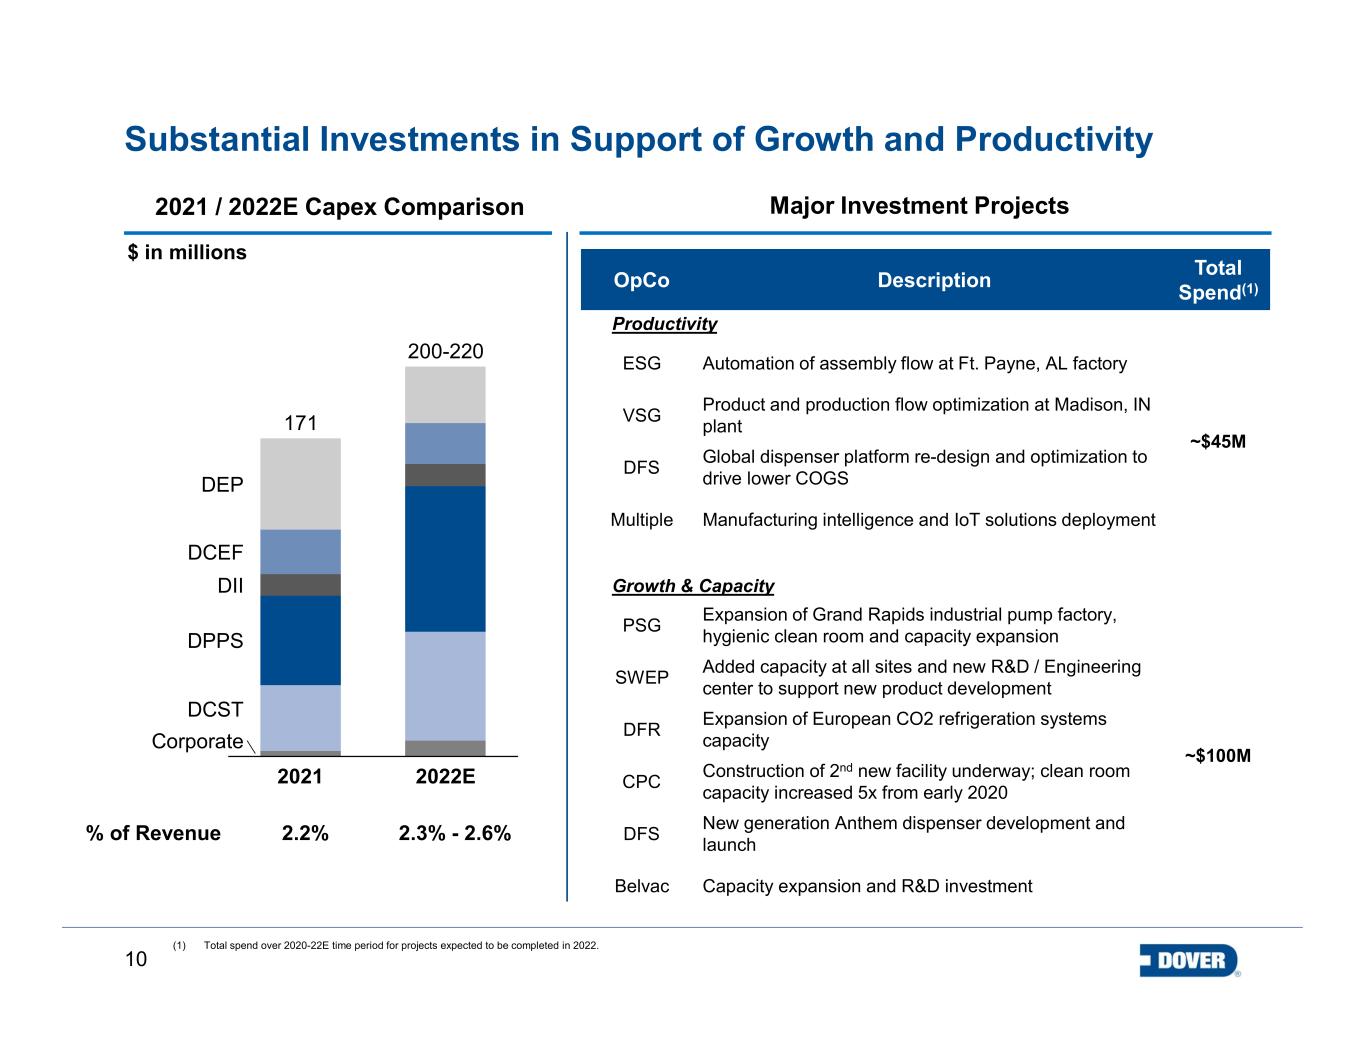
10 Substantial Investments in Support of Growth and Productivity DPPS 2021 2022E DII DEP DCEF 171 Corporate DCST 200-220 $ in millions 2021 / 2022E Capex Comparison Major Investment Projects % of Revenue 2.2% 2.3% - 2.6% (1) Total spend over 2020-22E time period for projects expected to be completed in 2022. OpCo Description Total Spend(1) Productivity ESG Automation of assembly flow at Ft. Payne, AL factory ~$45M VSG Product and production flow optimization at Madison, IN plant DFS Global dispenser platform re-design and optimization to drive lower COGS Multiple Manufacturing intelligence and IoT solutions deployment Growth & Capacity PSG Expansion of Grand Rapids industrial pump factory, hygienic clean room and capacity expansion ~$100M SWEP Added capacity at all sites and new R&D / Engineering center to support new product development DFR Expansion of European CO2 refrigeration systems capacity CPC Construction of 2nd new facility underway; clean room capacity increased 5x from early 2020 DFS New generation Anthem dispenser development and launch Belvac Capacity expansion and R&D investment

11 Segment Demand trends ’22 Organic Growth(1) Outlook Price – Cost Inputs availability Comments DEP HSD- LDD Favorable market outlook, strong bookings and healthy backlog across all businesses COVID protocol absenteeism and logistics costs continue to impact H1 margins along with price / materials spread, which is expected to improve through 2022 DCEF LSD Difficult top-line comparable in H1 on US EMV sunset, offset by strength in other businesses and geographies. Clean energy acquisitions off to a strong start Expect operating margin impact in H1 on lower volumes, COVID-protocol absenteeism, and AD&A(2) from recent deals. Margin will improve sequentially into H2 on productivity and mix. Full year conversion margin (excl. incremental AD&A(2)) within target range for portfolio DII MSD- HSD Continued stable growth in marking & coding. Strong outlook for serialization / brand protection. Prolonged improvement in textiles Expect robust FY margin conversion driven by improved volumes and price / cost spread as supply chains normalize DPPS HSD - LDD Strong demand trends across all businesses and end markets; capacity expansions in biopharma and industrial pumps Margin performance expected to remain robust on solid volume growth and operational execution DCST HSD Record backlogs and sustained bookings levels drive positive top-line outlook across food retail, sustainable beverage packaging and heat exchangers for high efficiency heat pumps Margins expected to remain impacted in Q1 on input constraints and resulting inefficiencies; expect solid full year conversion on improving price / material and normalizing supply chain Business Outlook (1) Non-GAAP measures (reconciliations and definitions in appendix). Reflects directional contribution from each segment to absolute year over year change in Adjusted EBITDA. (2) Acquisition-related depreciation and amortization Revenue Profitability
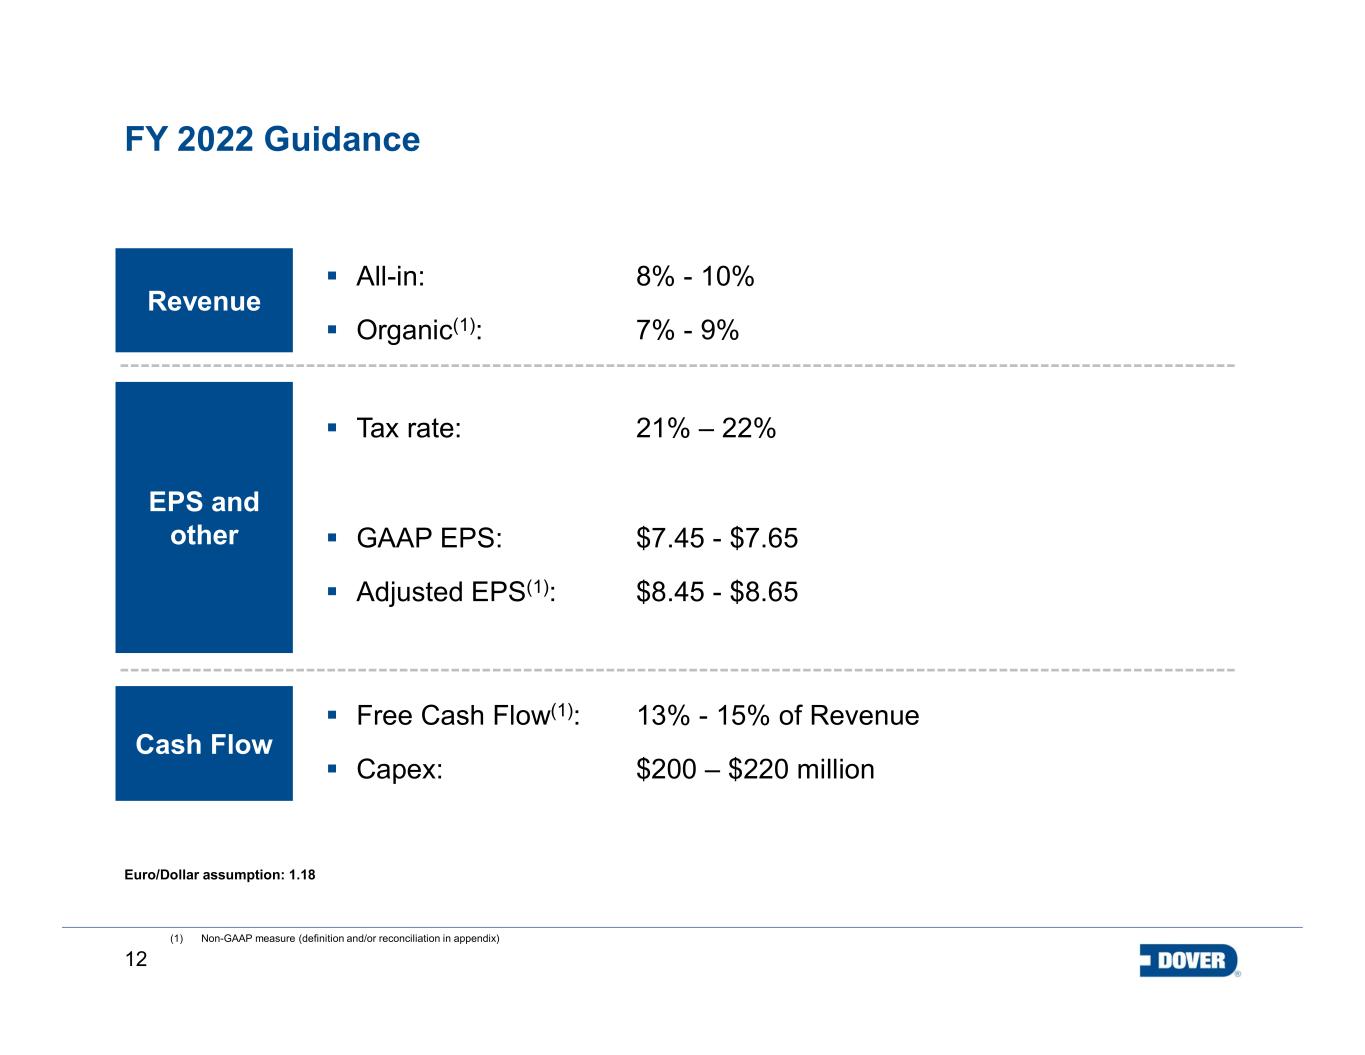
12 FY 2022 Guidance (1) Non-GAAP measure (definition and/or reconciliation in appendix) EPS and other Cash Flow Free Cash Flow(1): 13% - 15% of Revenue Capex: $200 – $220 million GAAP EPS: $7.45 - $7.65 Adjusted EPS(1): $8.45 - $8.65 Revenue All-in: 8% - 10% Organic(1): 7% - 9% Tax rate: 21% – 22% Euro/Dollar assumption: 1.18
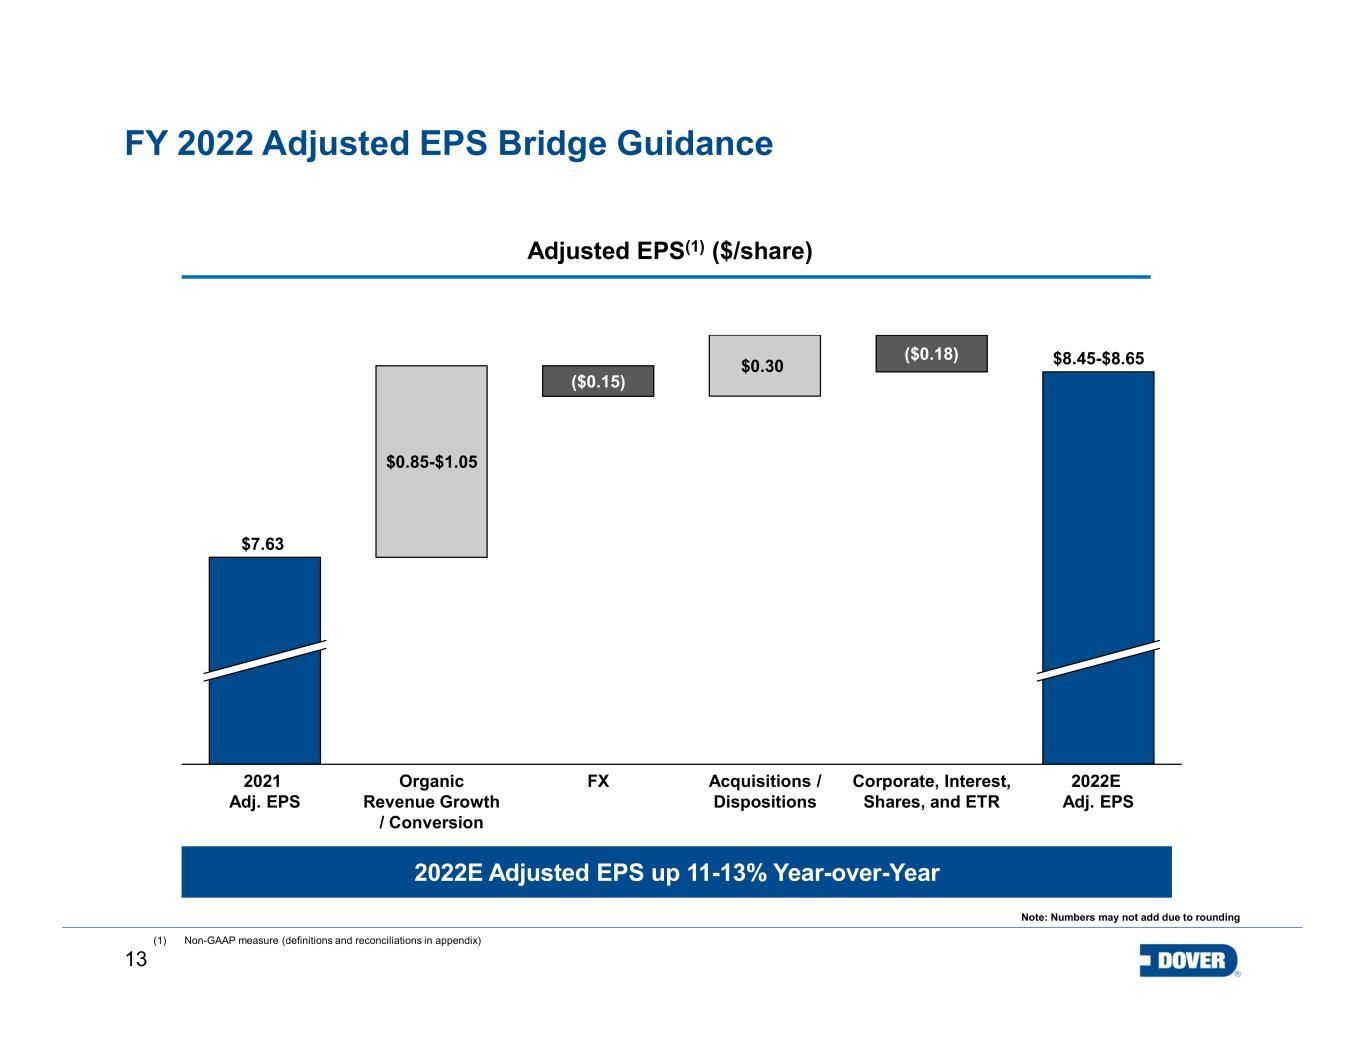
13 $0.30 $0.85-$1.05 2021 Adj. EPS Organic Revenue Growth / Conversion ($0.15) FX $8.45-$8.65 $7.63 Acquisitions / Dispositions ($0.18) Corporate, Interest, Shares, and ETR 2022E Adj. EPS Adjusted EPS(1) ($/share) 2022E Adjusted EPS up 11-13% Year-over-Year FY 2022 Adjusted EPS Bridge Guidance (1) Non-GAAP measure (definitions and reconciliations in appendix) Note: Numbers may not add due to rounding
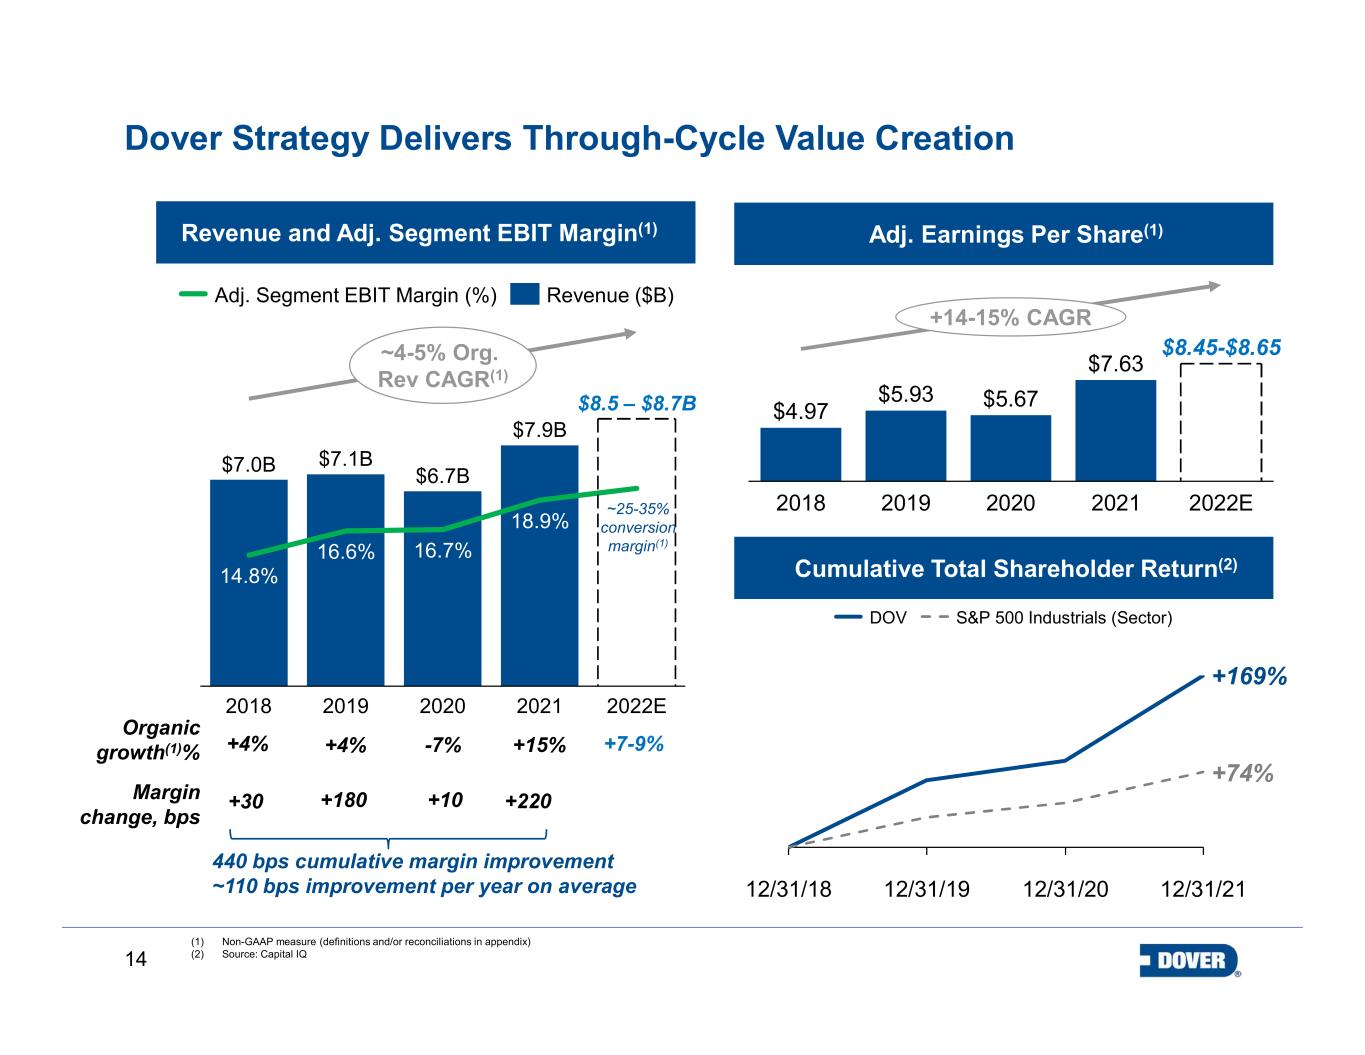
14 Dover Strategy Delivers Through-Cycle Value Creation $7.0B $7.1B $6.7B $7.9B 18.9% 20202018 2021 14.8% 16.7%16.6% 2019 2022E $8.5 – $8.7B ~4-5% Org. Rev CAGR(1) Adj. Segment EBIT Margin (%) Revenue ($B) $4.97 $5.93 $5.67 $7.63 2018 2019 2020 2021 2022E $8.45-$8.65 +14-15% CAGR (1) Non-GAAP measure (definitions and/or reconciliations in appendix) (2) Source: Capital IQ +30 +180 +10Margin change, bps +4% +4% -7% +7-9% Organic growth(1)% ~25-35% conversion margin(1) 12/31/1912/31/18 12/31/2112/31/20 DOV S&P 500 Industrials (Sector) +169% +74% Revenue and Adj. Segment EBIT Margin(1) Cumulative Total Shareholder Return(2) Adj. Earnings Per Share(1) +15% +220 440 bps cumulative margin improvement ~110 bps improvement per year on average
15 Appendix
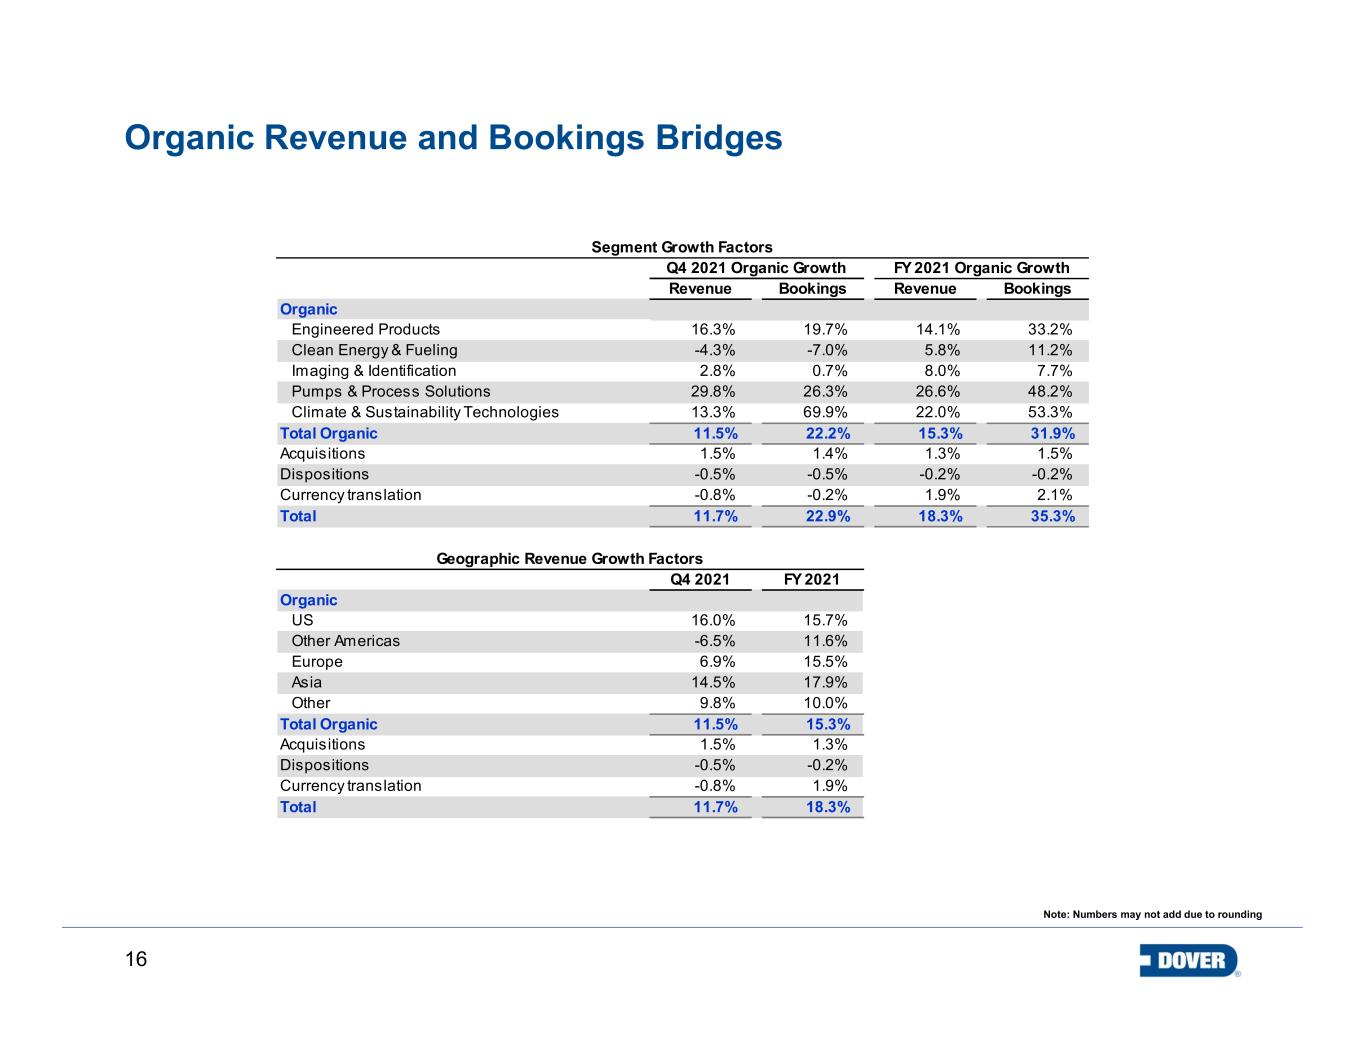
16 Organic Revenue and Bookings Bridges Note: Numbers may not add due to rounding Revenue Bookings Revenue Bookings 16.3% 19.7% 14.1% 33.2% -4.3% -7.0% 5.8% 11.2% 2.8% 0.7% 8.0% 7.7% 29.8% 26.3% 26.6% 48.2% 13.3% 69.9% 22.0% 53.3% 11.5% 22.2% 15.3% 31.9% 1.5% 1.4% 1.3% 1.5% -0.5% -0.5% -0.2% -0.2% -0.8% -0.2% 1.9% 2.1% Total 11.7% 22.9% 18.3% 35.3% Q4 2021 FY 2021 16.0% 15.7% -6.5% 11.6% 6.9% 15.5% 14.5% 17.9% 9.8% 10.0% 11.5% 15.3% 1.5% 1.3% -0.5% -0.2% -0.8% 1.9% Total 11.7% 18.3% FY 2021 Organic Growth Segment Growth Factors Currency translation Organic Climate & Sustainability Technologies Total Organic Engineered Products Pumps & Process Solutions Clean Energy & Fueling Imaging & Identification Q4 2021 Organic Growth Geographic Revenue Growth Factors Acquisitions Dispositions Currency translation Organic US Other Americas Europe Asia Other Total Organic Acquisitions Dispositions
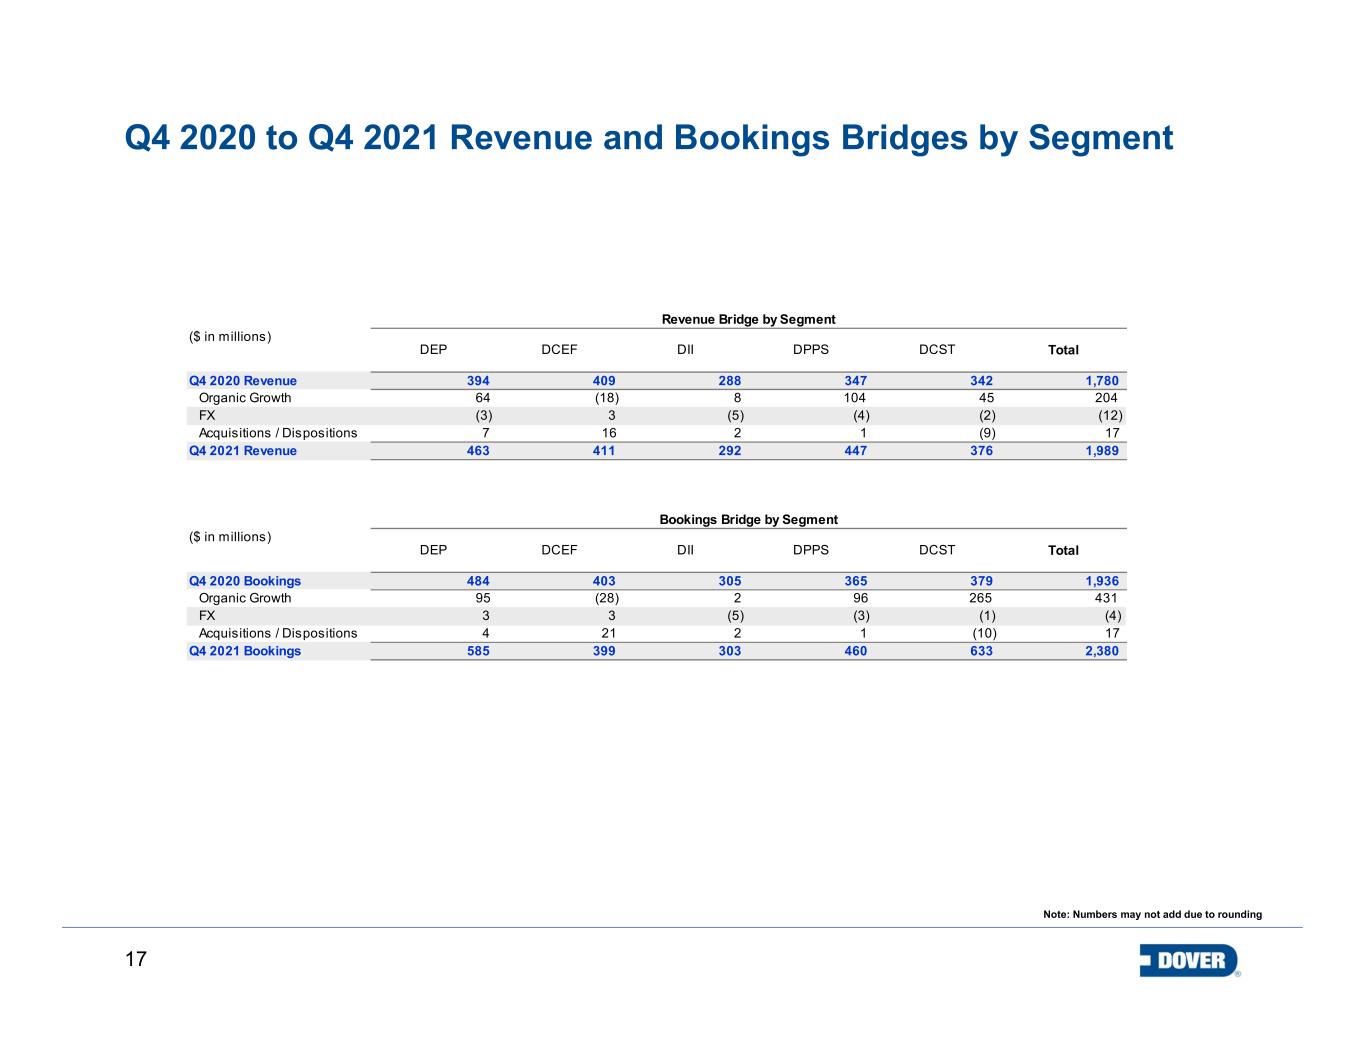
17 Q4 2020 to Q4 2021 Revenue and Bookings Bridges by Segment Note: Numbers may not add due to rounding DEP DCEF DII DPPS DCST Total 394 409 288 347 342 1,780 64 (18) 8 104 45 204 (3) 3 (5) (4) (2) (12) 7 16 2 1 (9) 17 463 411 292 447 376 1,989 DEP DCEF DII DPPS DCST Total 484 403 305 365 379 1,936 95 (28) 2 96 265 431 3 3 (5) (3) (1) (4) 4 21 2 1 (10) 17 585 399 303 460 633 2,380 ($ in millions) Q4 2020 Revenue Bookings Bridge by Segment ($ in millions) Acquisitions / Dispositions Q4 2021 Revenue Organic Growth FX Revenue Bridge by Segment FX Q4 2021 Bookings Q4 2020 Bookings Organic Growth Acquisitions / Dispositions
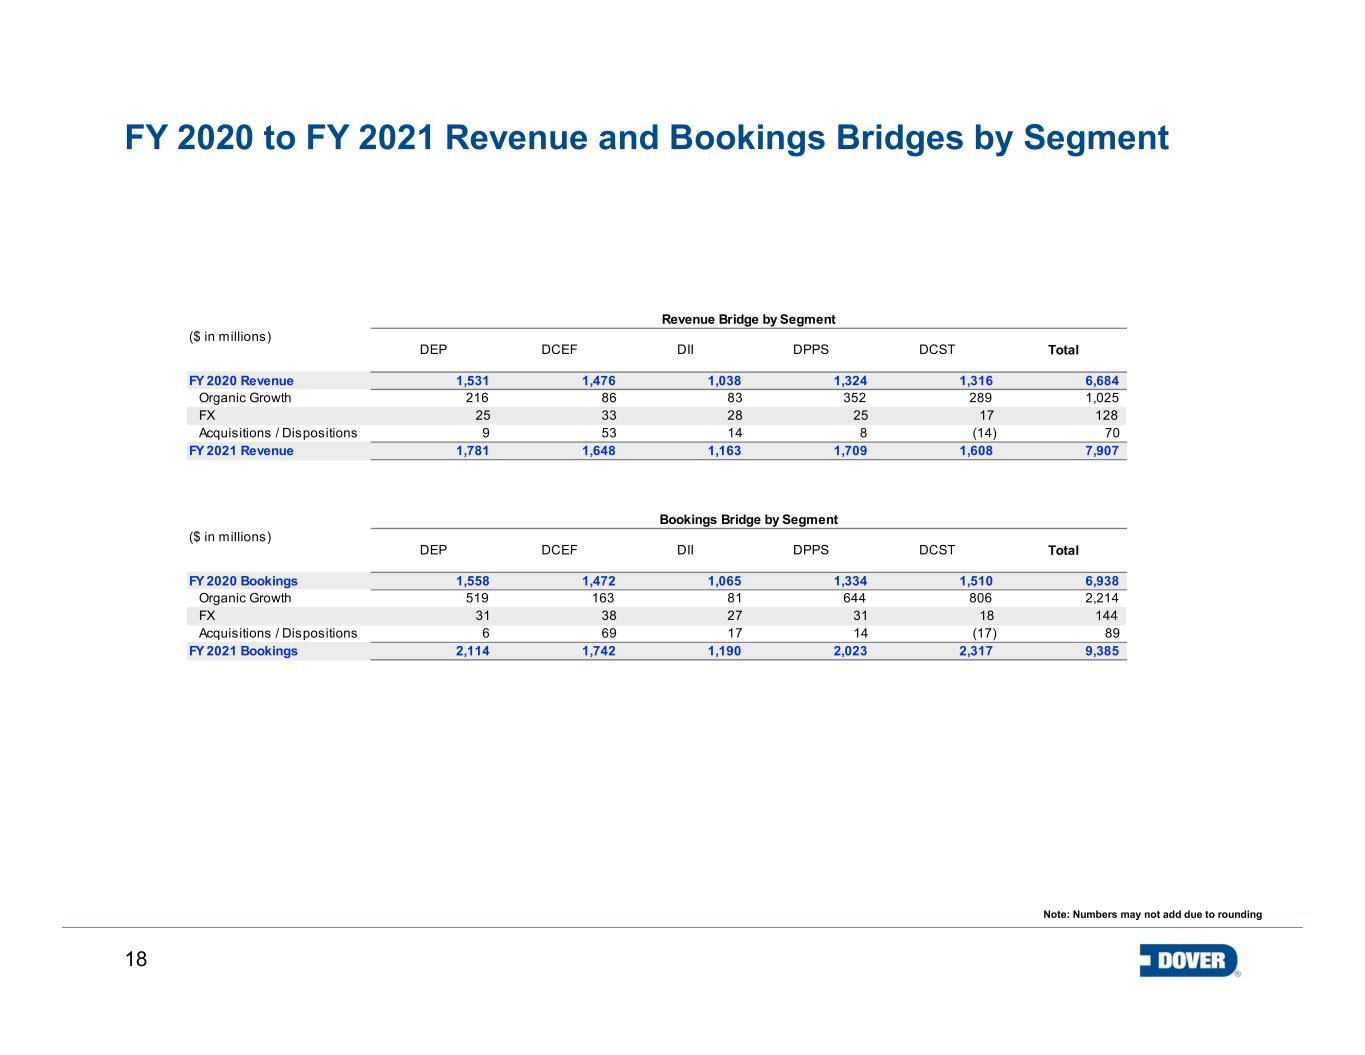
18 FY 2020 to FY 2021 Revenue and Bookings Bridges by Segment Note: Numbers may not add due to rounding DEP DCEF DII DPPS DCST Total 1,531 1,476 1,038 1,324 1,316 6,684 216 86 83 352 289 1,025 25 33 28 25 17 128 9 53 14 8 (14) 70 1,781 1,648 1,163 1,709 1,608 7,907 DEP DCEF DII DPPS DCST Total 1,558 1,472 1,065 1,334 1,510 6,938 519 163 81 644 806 2,214 31 38 27 31 18 144 6 69 17 14 (17) 89 2,114 1,742 1,190 2,023 2,317 9,385 FX FY 2021 Bookings FY 2020 Bookings Organic Growth Acquisitions / Dispositions ($ in millions) FY 2020 Revenue Bookings Bridge by Segment ($ in millions) Acquisitions / Dispositions FY 2021 Revenue Organic Growth FX Revenue Bridge by Segment
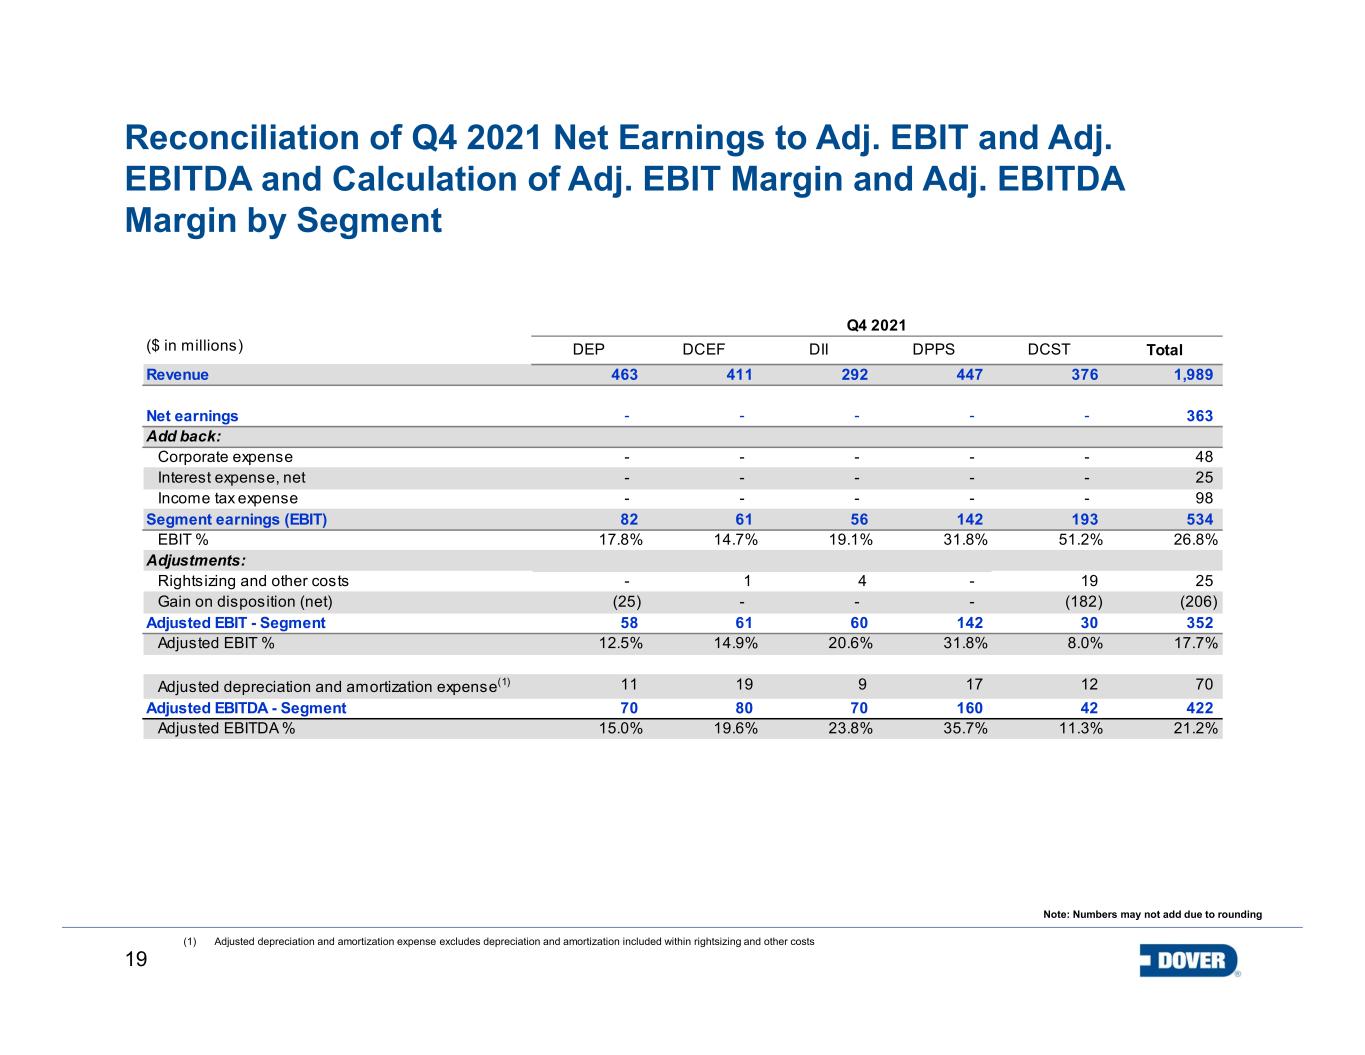
19 Reconciliation of Q4 2021 Net Earnings to Adj. EBIT and Adj. EBITDA and Calculation of Adj. EBIT Margin and Adj. EBITDA Margin by Segment (1) Adjusted depreciation and amortization expense excludes depreciation and amortization included within rightsizing and other costs Note: Numbers may not add due to rounding DEP DCEF DII DPPS DCST Total 463 411 292 447 376 1,989 - - - - - 363 - - - - - 48 - - - - - 25 - - - - - 98 82 61 56 142 193 534 17.8% 14.7% 19.1% 31.8% 51.2% 26.8% - 1 4 - 19 25 (25) - - - (182) (206) 58 61 60 142 30 352 12.5% 14.9% 20.6% 31.8% 8.0% 17.7% 11 19 9 17 12 70 70 80 70 160 42 422 15.0% 19.6% 23.8% 35.7% 11.3% 21.2% Q4 2021 ($ in millions) Revenue Net earnings Add back: Adjusted EBITDA - Segment Adjusted EBITDA % Income tax expense Segment earnings (EBIT) EBIT % Adjustments: Rightsizing and other costs Corporate expense Adjusted EBIT % Adjusted depreciation and amortization expense(1) Interest expense, net Adjusted EBIT - Segment Gain on disposition (net)
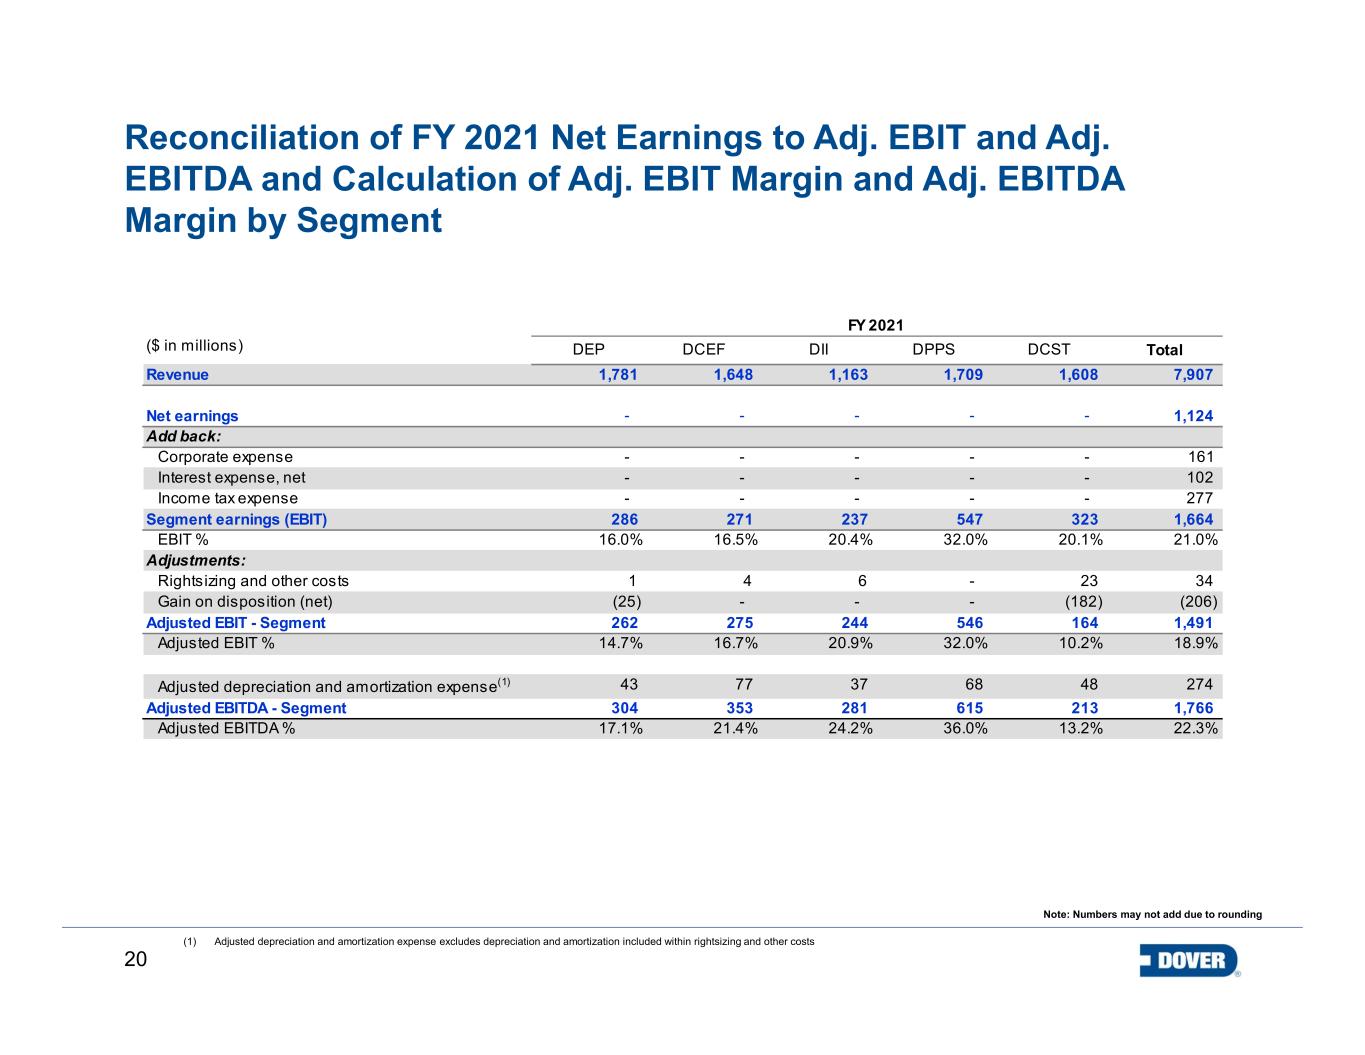
20 Reconciliation of FY 2021 Net Earnings to Adj. EBIT and Adj. EBITDA and Calculation of Adj. EBIT Margin and Adj. EBITDA Margin by Segment (1) Adjusted depreciation and amortization expense excludes depreciation and amortization included within rightsizing and other costs Note: Numbers may not add due to rounding DEP DCEF DII DPPS DCST Total 1,781 1,648 1,163 1,709 1,608 7,907 - - - - - 1,124 - - - - - 161 - - - - - 102 - - - - - 277 286 271 237 547 323 1,664 16.0% 16.5% 20.4% 32.0% 20.1% 21.0% 1 4 6 - 23 34 (25) - - - (182) (206) 262 275 244 546 164 1,491 14.7% 16.7% 20.9% 32.0% 10.2% 18.9% 43 77 37 68 48 274 304 353 281 615 213 1,766 17.1% 21.4% 24.2% 36.0% 13.2% 22.3% Corporate expense Adjusted EBIT % Adjusted depreciation and amortization expense(1) Interest expense, net Adjusted EBIT - Segment Gain on disposition (net) FY 2021 ($ in millions) Revenue Net earnings Add back: Adjusted EBITDA - Segment Adjusted EBITDA % Income tax expense Segment earnings (EBIT) EBIT % Adjustments: Rightsizing and other costs
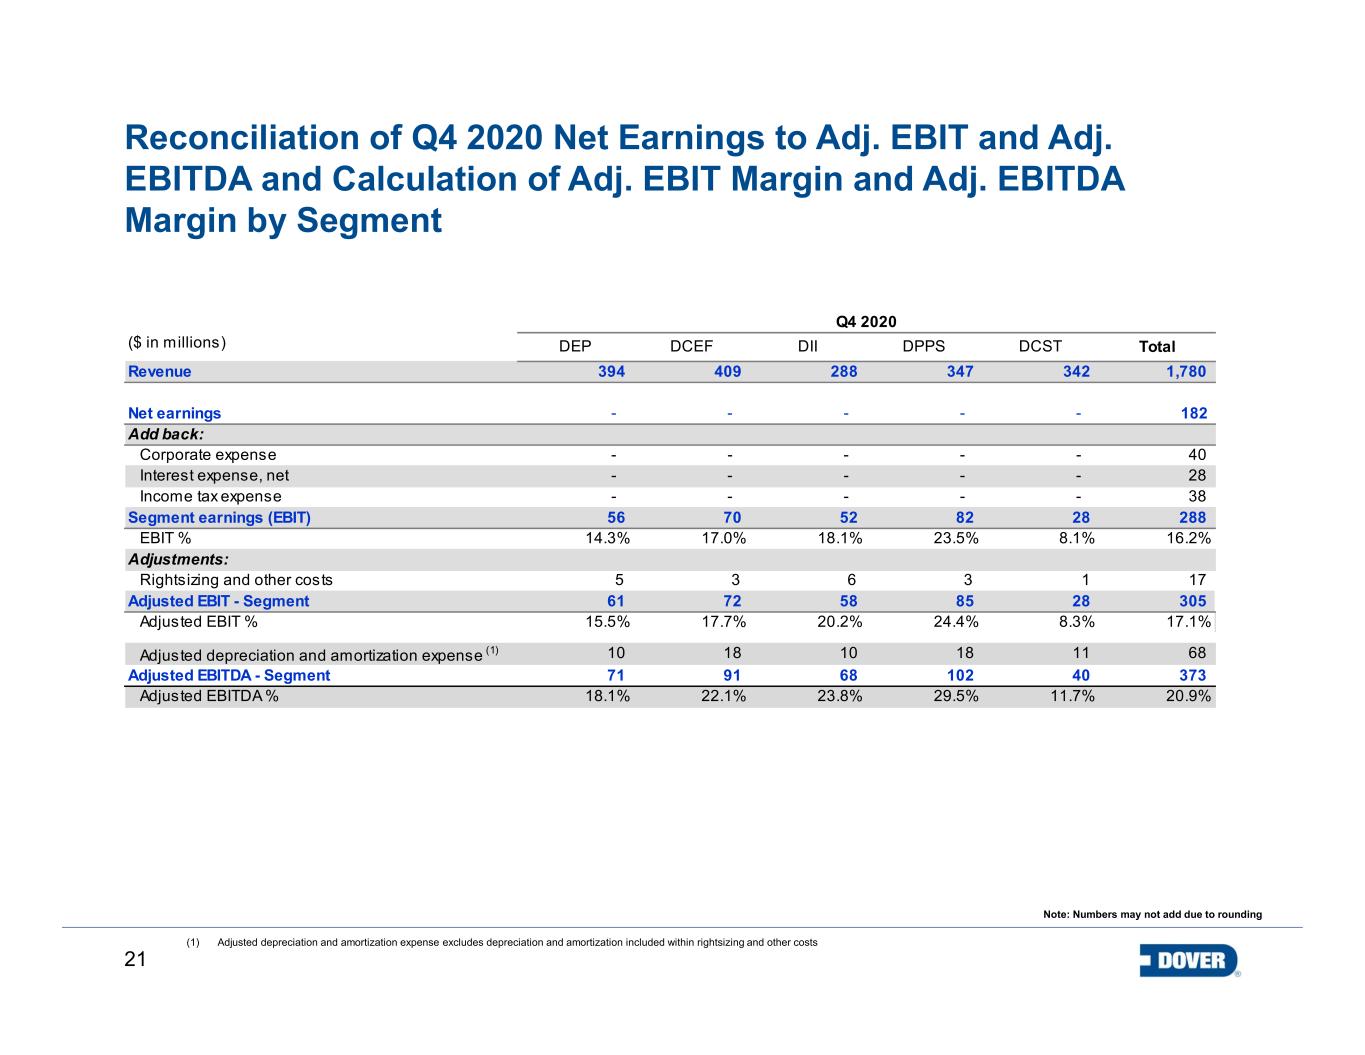
21 Reconciliation of Q4 2020 Net Earnings to Adj. EBIT and Adj. EBITDA and Calculation of Adj. EBIT Margin and Adj. EBITDA Margin by Segment (1) Adjusted depreciation and amortization expense excludes depreciation and amortization included within rightsizing and other costs Note: Numbers may not add due to rounding DEP DCEF DII DPPS DCST Total 394 409 288 347 342 1,780 - - - - - 182 - - - - - 40 - - - - - 28 - - - - - 38 56 70 52 82 28 288 14.3% 17.0% 18.1% 23.5% 8.1% 16.2% 5 3 6 3 1 17 61 72 58 85 28 305 15.5% 17.7% 20.2% 24.4% 8.3% 17.1% 10 18 10 18 11 68 71 91 68 102 40 373 18.1% 22.1% 23.8% 29.5% 11.7% 20.9% Interest expense, net Adjusted EBIT - Segment Adjusted EBIT % Adjusted depreciation and amortization expense (1) Q4 2020 ($ in millions) Revenue Net earnings Add back: Adjusted EBITDA - Segment Adjusted EBITDA % Income tax expense Segment earnings (EBIT) EBIT % Adjustments: Rightsizing and other costs Corporate expense
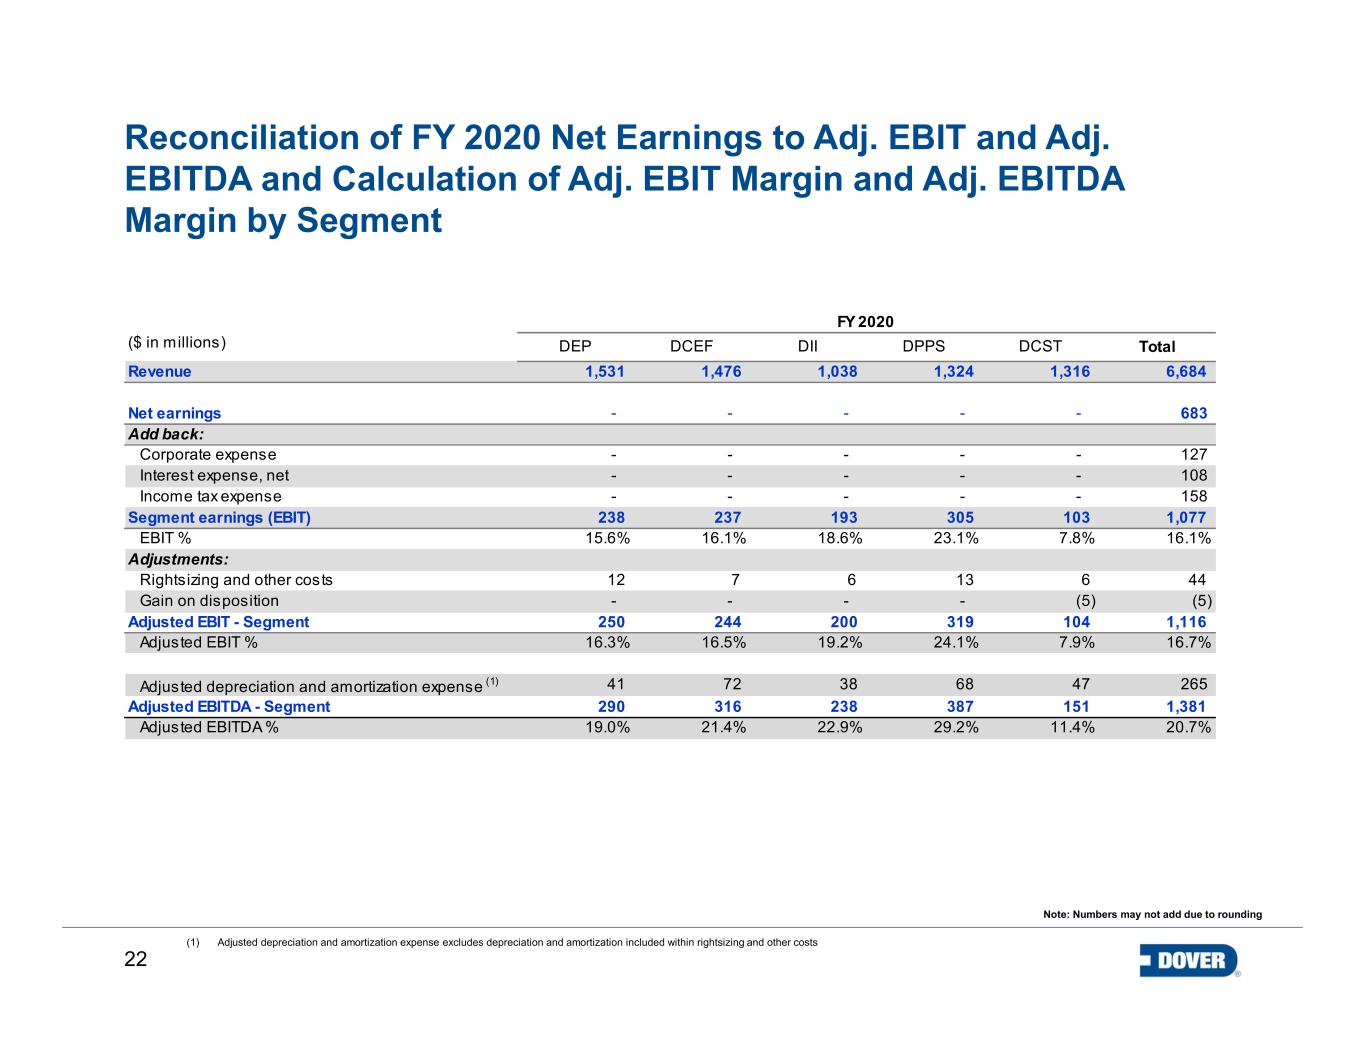
22 Reconciliation of FY 2020 Net Earnings to Adj. EBIT and Adj. EBITDA and Calculation of Adj. EBIT Margin and Adj. EBITDA Margin by Segment (1) Adjusted depreciation and amortization expense excludes depreciation and amortization included within rightsizing and other costs Note: Numbers may not add due to rounding DEP DCEF DII DPPS DCST Total 1,531 1,476 1,038 1,324 1,316 6,684 - - - - - 683 - - - - - 127 - - - - - 108 - - - - - 158 238 237 193 305 103 1,077 15.6% 16.1% 18.6% 23.1% 7.8% 16.1% 12 7 6 13 6 44 - - - - (5) (5) 250 244 200 319 104 1,116 16.3% 16.5% 19.2% 24.1% 7.9% 16.7% 41 72 38 68 47 265 290 316 238 387 151 1,381 19.0% 21.4% 22.9% 29.2% 11.4% 20.7% Interest expense, net Adjusted EBIT - Segment Gain on disposition Adjusted EBIT % Adjusted depreciation and amortization expense (1) FY 2020 ($ in millions) Revenue Net earnings Add back: Adjusted EBITDA - Segment Adjusted EBITDA % Income tax expense Segment earnings (EBIT) EBIT % Adjustments: Rightsizing and other costs Corporate expense
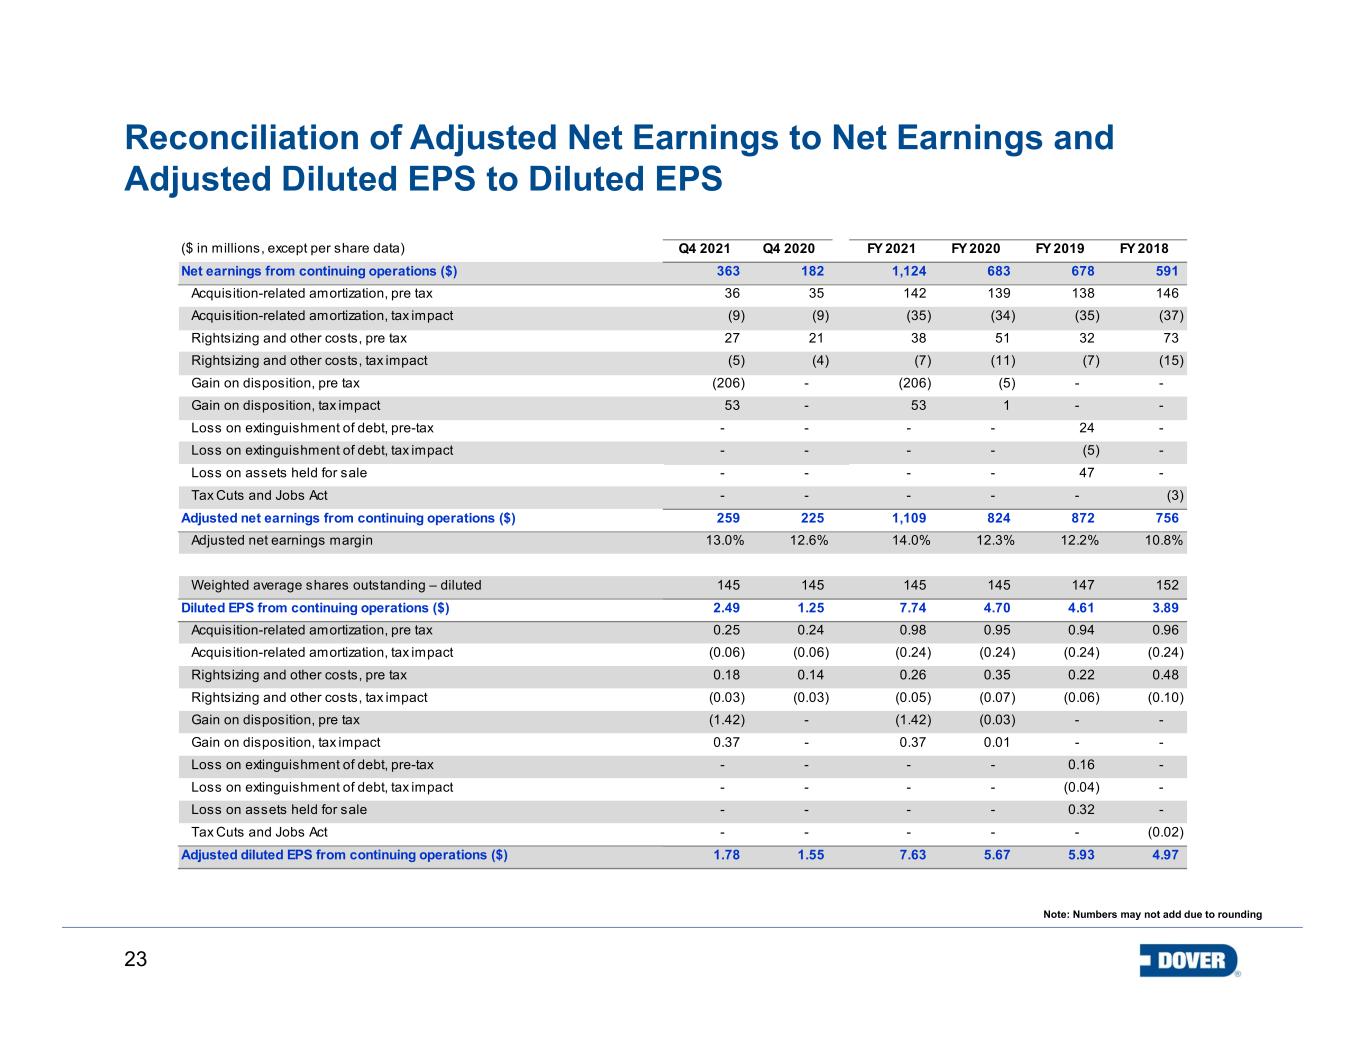
23 Reconciliation of Adjusted Net Earnings to Net Earnings and Adjusted Diluted EPS to Diluted EPS Note: Numbers may not add due to rounding ($ in millions, except per share data) Q4 2021 Q4 2020 FY 2021 FY 2020 FY 2019 FY 2018 Net earnings from continuing operations ($) 363 182 1,124 683 678 591 Acquisition-related amortization, pre tax 36 35 142 139 138 146 Acquisition-related amortization, tax impact (9) (9) (35) (34) (35) (37) Rightsizing and other costs, pre tax 27 21 38 51 32 73 Rightsizing and other costs, tax impact (5) (4) (7) (11) (7) (15) Gain on disposition, pre tax (206) - (206) (5) - - Gain on disposition, tax impact 53 - 53 1 - - Loss on extinguishment of debt, pre-tax - - - - 24 - Loss on extinguishment of debt, tax impact - - - - (5) - Loss on assets held for sale - - - - 47 - Tax Cuts and Jobs Act - - - - - (3) Adjusted net earnings from continuing operations ($) 259 225 1,109 824 872 756 Adjusted net earnings margin 13.0% 12.6% 14.0% 12.3% 12.2% 10.8% Weighted average shares outstanding – diluted 145 145 145 145 147 152 Diluted EPS from continuing operations ($) 2.49 1.25 7.74 4.70 4.61 3.89 Acquisition-related amortization, pre tax 0.25 0.24 0.98 0.95 0.94 0.96 Acquisition-related amortization, tax impact (0.06) (0.06) (0.24) (0.24) (0.24) (0.24) Rightsizing and other costs, pre tax 0.18 0.14 0.26 0.35 0.22 0.48 Rightsizing and other costs, tax impact (0.03) (0.03) (0.05) (0.07) (0.06) (0.10) Gain on disposition, pre tax (1.42) - (1.42) (0.03) - - Gain on disposition, tax impact 0.37 - 0.37 0.01 - - Loss on extinguishment of debt, pre-tax - - - - 0.16 - Loss on extinguishment of debt, tax impact - - - - (0.04) - Loss on assets held for sale - - - - 0.32 - Tax Cuts and Jobs Act - - - - - (0.02) Adjusted diluted EPS from continuing operations ($) 1.78 1.55 7.63 5.67 5.93 4.97
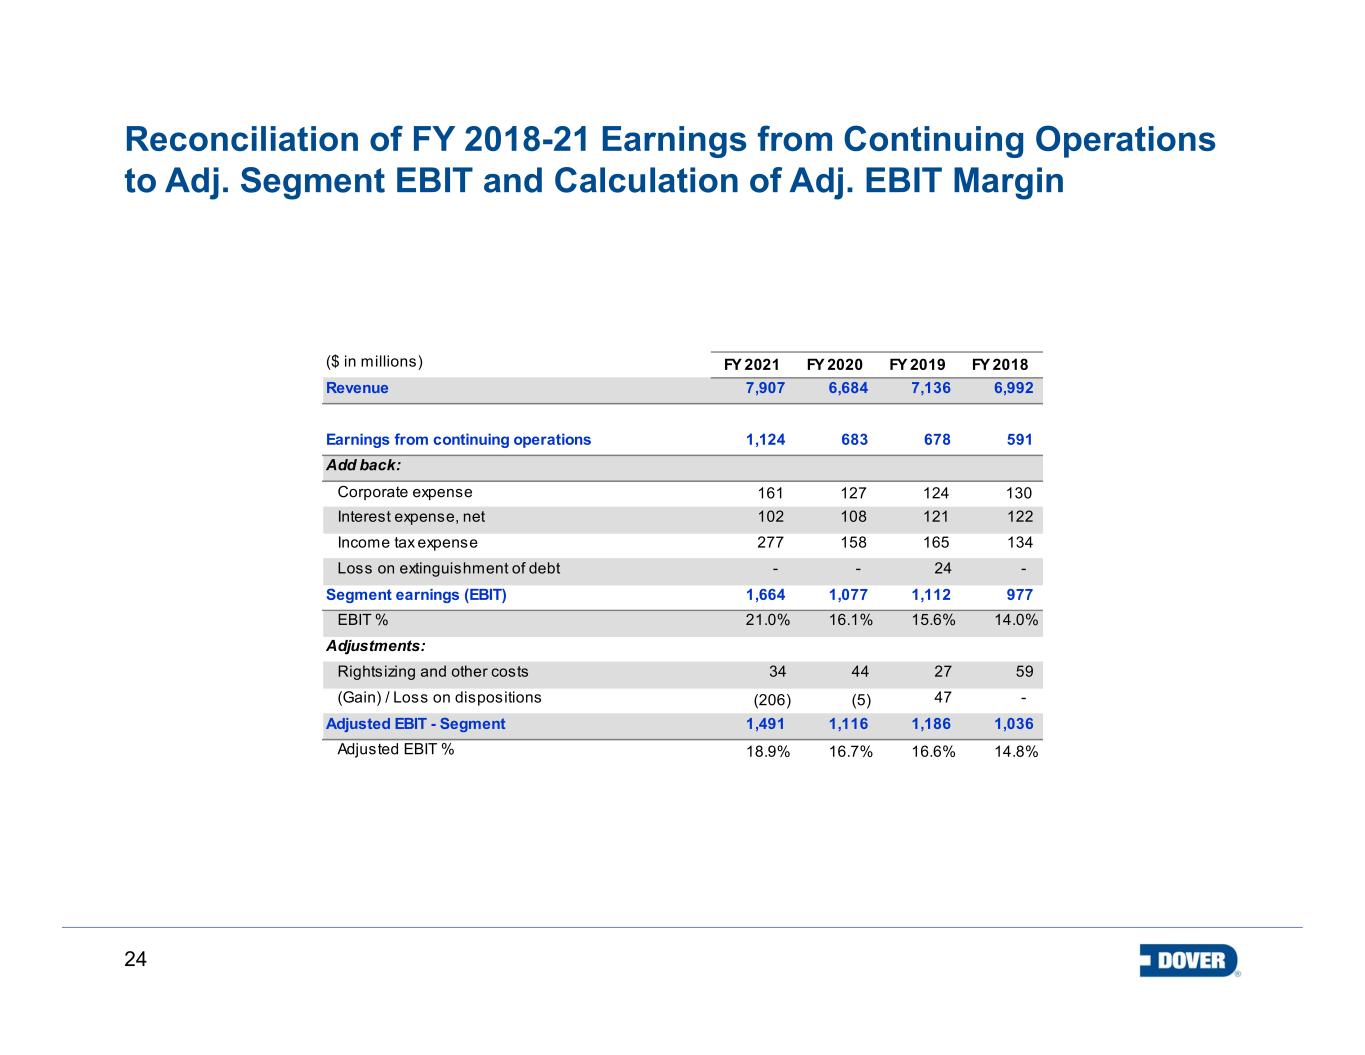
24 Reconciliation of FY 2018-21 Earnings from Continuing Operations to Adj. Segment EBIT and Calculation of Adj. EBIT Margin FY 2021 FY 2020 FY 2019 FY 2018 7,907 6,684 7,136 6,992 1,124 683 678 591 161 127 124 130 102 108 121 122 277 158 165 134 Loss on extinguishment of debt - - 24 - 1,664 1,077 1,112 977 21.0% 16.1% 15.6% 14.0% 34 44 27 59 (206) (5) 47 - 1,491 1,116 1,186 1,036 18.9% 16.7% 16.6% 14.8% Interest expense, net ($ in millions) Revenue Earnings from continuing operations Add back: Corporate expense Adjusted EBIT - Segment Adjusted EBIT % Income tax expense Segment earnings (EBIT) EBIT % Adjustments: Rightsizing and other costs (Gain) / Loss on dispositions
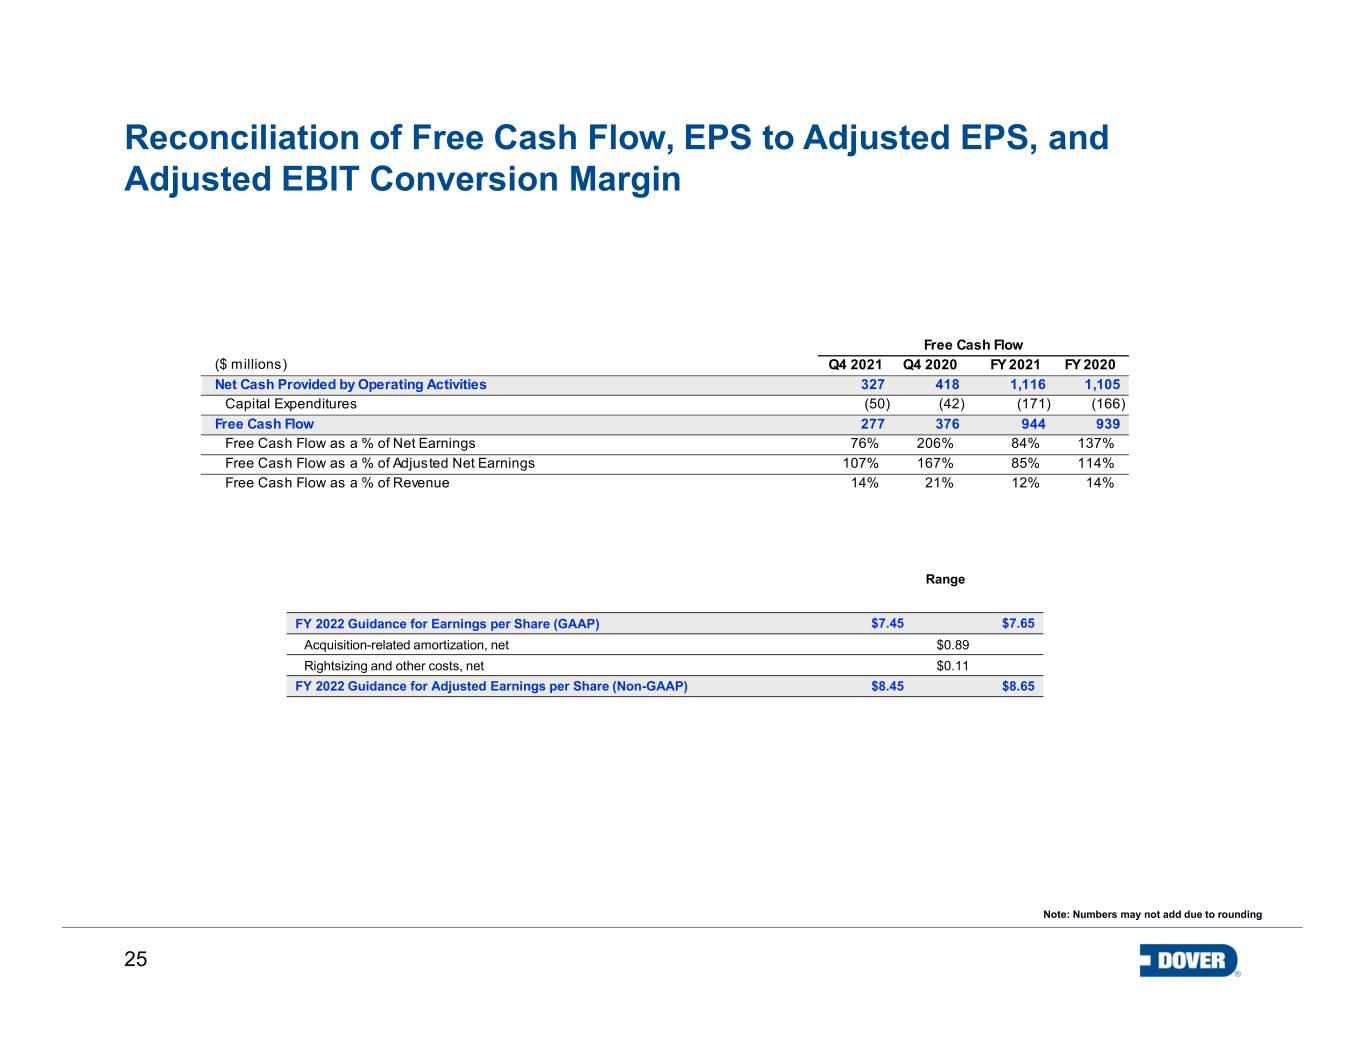
25 Reconciliation of Free Cash Flow, EPS to Adjusted EPS, and Adjusted EBIT Conversion Margin Range FY 2022 Guidance for Earnings per Share (GAAP) $7.45 $7.65 Acquisition-related amortization, net $0.89 Rightsizing and other costs, net $0.11 FY 2022 Guidance for Adjusted Earnings per Share (Non-GAAP) $8.45 $8.65 Note: Numbers may not add due to rounding ($ millions) Q4 2021 Q4 2020 FY 2021 FY 2020 Net Cash Provided by Operating Activities 327 418 1,116 1,105 Capital Expenditures (50) (42) (171) (166) Free Cash Flow 277 376 944 939 Free Cash Flow as a % of Net Earnings 76% 206% 84% 137% Free Cash Flow as a % of Adjusted Net Earnings 107% 167% 85% 114% Free Cash Flow as a % of Revenue 14% 21% 12% 14% Free Cash Flow
26 Non-GAAP Definitions Definitions of Non-GAAP Measures: Adjusted Net Earnings: is defined as net earnings adjusted for the effect of acquisition-related amortization, rightsizing and other costs/benefits, gain/loss on dispositions, loss on extinguishment of debt, loss on assets held for sale, and the Tax Cuts and Jobs Act. Adjusted Net Earnings Margin: is defined as adjusted net earnings divided by revenue. Adjusted Diluted Net Earnings Per Share: is defined as adjusted net earnings divided by average diluted shares. Total Segment Earnings (EBIT): is defined as net earnings before income taxes, net interest expense and corporate expenses. Total Segment Earnings (EBIT) Margin: is defined as total segment earnings (EBIT) divided by revenue. Adjusted EBIT by Segment: is defined as net earnings before income taxes, net interest expense, corporate expenses, rightsizing and other costs/benefits, and gain on dispositions Adjusted EBIT Margin by Segment: is defined as adjusted EBIT by segment divided by segment revenue. The bps change Y-o-Y is calculated as the difference between adjusted EBIT margin for the current period and the prior period. Adjusted EBITDA by Segment: is defined as adjusted EBIT by segment plus depreciation and amortization, excluding depreciation and amortization included within rightsizing and other costs. Adjusted EBITDA Margin by Segment: is defined as adjusted EBITDA by segment divided by segment revenue. Adjusted EBIT Conversion Margin: is defined as the change in total adjusted segment earnings (EBIT) divided by the change in revenue. Free Cash Flow: is defined as net cash provided by operating activities minus capital expenditures. Free cash flow as a percentage of revenue equals free cash flow divided by revenue. Free cash flow as a percentage of net earnings equals free cash flow divided by net earnings. Free cash flow as a percentage of adjusted net earnings equals free cash flow divided by adjusted net earnings. Organic Revenue Growth: is defined as revenue growth excluding the impact of foreign currency exchange rates and the impact of acquisitions and dispositions. The tables included in this presentation provide reconciliations of the non-GAAP measures used in this presentation to the most directly comparable U.S. GAAP measures. Further information regarding management’s use of these non-GAAP measures is included in Dover’s earnings release and investor supplement for the fourth quarter.
27 Performance Measure Definitions Definitions of Performance Measures: Bookings represent total orders received from customers in the current reporting period. This metric is an important measure of performance and an indicator of revenue order trends. Organic Bookings represent total orders received from customers in the current reporting period excluding the impact of foreign currency exchange rates and the impact of acquisitions and dispositions. This metric is an important measure of performance and an indicator of revenue order trends. Backlog represents an estimate of the total remaining bookings at a point in time for which performance obligations have not yet been satisfied. This metric is useful as it represents the aggregate amount we expect to recognize as revenue in the future. Book-to-Bill is a ratio of the amount of bookings received from customers during a period divided by the amount of revenue recorded during that same period. This metric is a useful indicator of demand. We use the above operational metrics in monitoring the performance of the business. We believe the operational metrics are useful to investors and other users of our financial information in assessing the performance of our segments.


