Earnings Conference Call First Quarter 2022 April 21, 2022 – 8:00am CT Exhibit 99.2
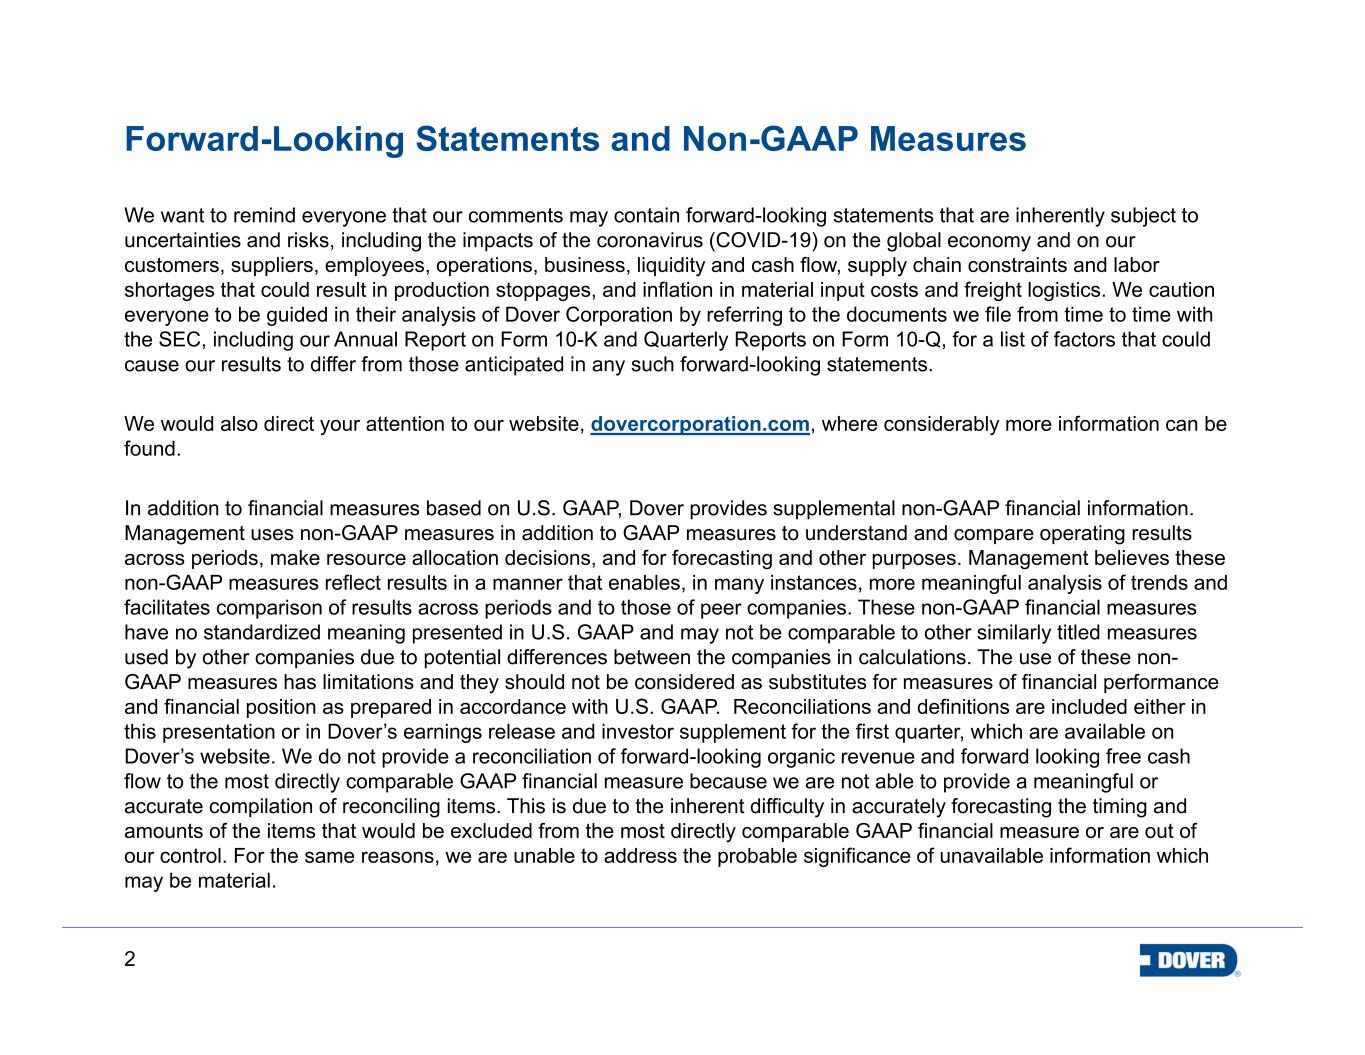
2 Forward-Looking Statements and Non-GAAP Measures We want to remind everyone that our comments may contain forward-looking statements that are inherently subject to uncertainties and risks, including the impacts of the coronavirus (COVID-19) on the global economy and on our customers, suppliers, employees, operations, business, liquidity and cash flow, supply chain constraints and labor shortages that could result in production stoppages, and inflation in material input costs and freight logistics. We caution everyone to be guided in their analysis of Dover Corporation by referring to the documents we file from time to time with the SEC, including our Annual Report on Form 10-K and Quarterly Reports on Form 10-Q, for a list of factors that could cause our results to differ from those anticipated in any such forward-looking statements. We would also direct your attention to our website, dovercorporation.com, where considerably more information can be found. In addition to financial measures based on U.S. GAAP, Dover provides supplemental non-GAAP financial information. Management uses non-GAAP measures in addition to GAAP measures to understand and compare operating results across periods, make resource allocation decisions, and for forecasting and other purposes. Management believes these non-GAAP measures reflect results in a manner that enables, in many instances, more meaningful analysis of trends and facilitates comparison of results across periods and to those of peer companies. These non-GAAP financial measures have no standardized meaning presented in U.S. GAAP and may not be comparable to other similarly titled measures used by other companies due to potential differences between the companies in calculations. The use of these non- GAAP measures has limitations and they should not be considered as substitutes for measures of financial performance and financial position as prepared in accordance with U.S. GAAP. Reconciliations and definitions are included either in this presentation or in Dover’s earnings release and investor supplement for the first quarter, which are available on Dover’s website. We do not provide a reconciliation of forward-looking organic revenue and forward looking free cash flow to the most directly comparable GAAP financial measure because we are not able to provide a meaningful or accurate compilation of reconciling items. This is due to the inherent difficulty in accurately forecasting the timing and amounts of the items that would be excluded from the most directly comparable GAAP financial measure or are out of our control. For the same reasons, we are unable to address the probable significance of unavailable information which may be material.
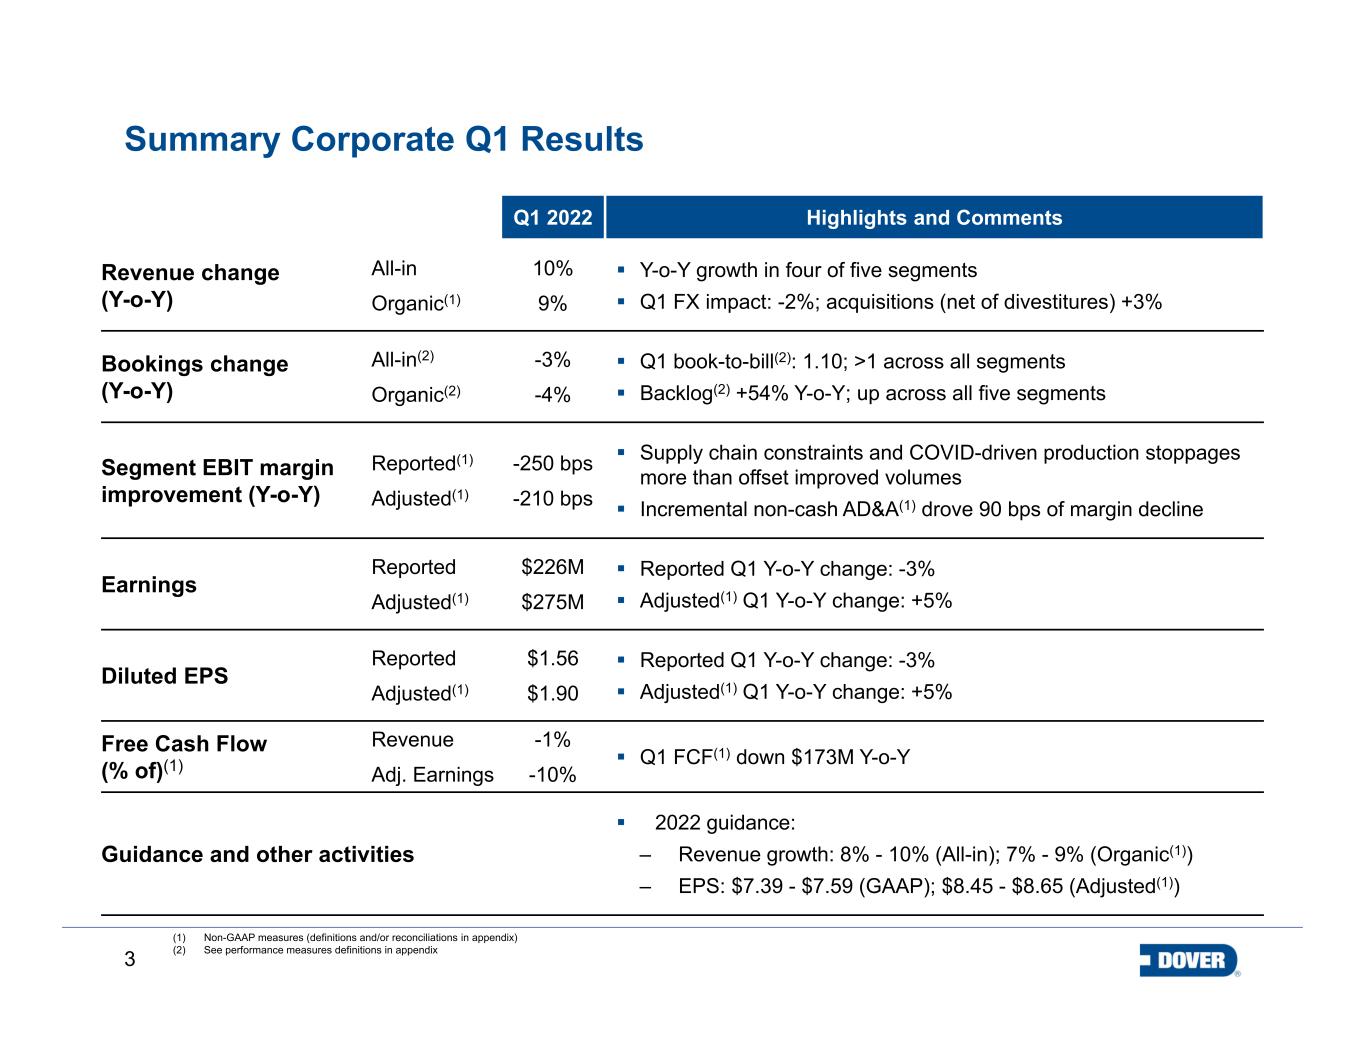
3 Summary Corporate Q1 Results Q1 2022 Highlights and Comments Revenue change (Y-o-Y) All-in Organic(1) 10% 9% Y-o-Y growth in four of five segments Q1 FX impact: -2%; acquisitions (net of divestitures) +3% Bookings change (Y-o-Y) All-in(2) Organic(2) -3% -4% Q1 book-to-bill(2): 1.10; >1 across all segments Backlog(2) +54% Y-o-Y; up across all five segments Segment EBIT margin improvement (Y-o-Y) Reported(1) Adjusted(1) -250 bps -210 bps Supply chain constraints and COVID-driven production stoppages more than offset improved volumes Incremental non-cash AD&A(1) drove 90 bps of margin decline Earnings Reported Adjusted(1) $226M $275M Reported Q1 Y-o-Y change: -3% Adjusted(1) Q1 Y-o-Y change: +5% Diluted EPS Reported Adjusted(1) $1.56 $1.90 Reported Q1 Y-o-Y change: -3% Adjusted(1) Q1 Y-o-Y change: +5% Free Cash Flow (% of)(1) Revenue Adj. Earnings -1% -10% Q1 FCF(1) down $173M Y-o-Y Guidance and other activities 2022 guidance: ‒ Revenue growth: 8% - 10% (All-in); 7% - 9% (Organic(1)) ‒ EPS: $7.39 - $7.59 (GAAP); $8.45 - $8.65 (Adjusted(1)) (1) Non-GAAP measures (definitions and/or reconciliations in appendix) (2) See performance measures definitions in appendix

4 Free Cash Flow(1) Incremental non-cash AD&A(1) drove 90 bps of margin decline -10% of Adjusted earnings(1) Q1 2022 Performance Highlights Organic(1) Revenue growth: 7% - 9% Adjusted Diluted EPS(1): $8.45 - $8.65 Organic Revenue(1) Book-to-bill(2): 1.10, >1 across all segmentsOrganic growth in four of five segments Adj. Diluted EPS(1) Adjusted Diluted EPS(1) includes $0.07(3) of discrete taxes +9% Y-o-Y Org. Bookings(2) -4% Y-o-Y Adj. Segment EBIT Margin(1) -210 bps Y-o-Y to 17.0% -1% of Revenue +5% Y-o-Y to $1.90 Backlog(2) +54% Y-o-Y to $3.4B FY ’22 GuidancePortfolio Activity Acquired IP related to electric-powered waste hauling applications from Boivin Evolution Inc. on April 6th +5% sequential quarterly growth (1) Non-GAAP measures (definitions and reconciliations in appendix) (2) See performance measures definitions in appendix (3) Comprised of $10M in discrete taxes divided by 145.3M diluted shares outstanding
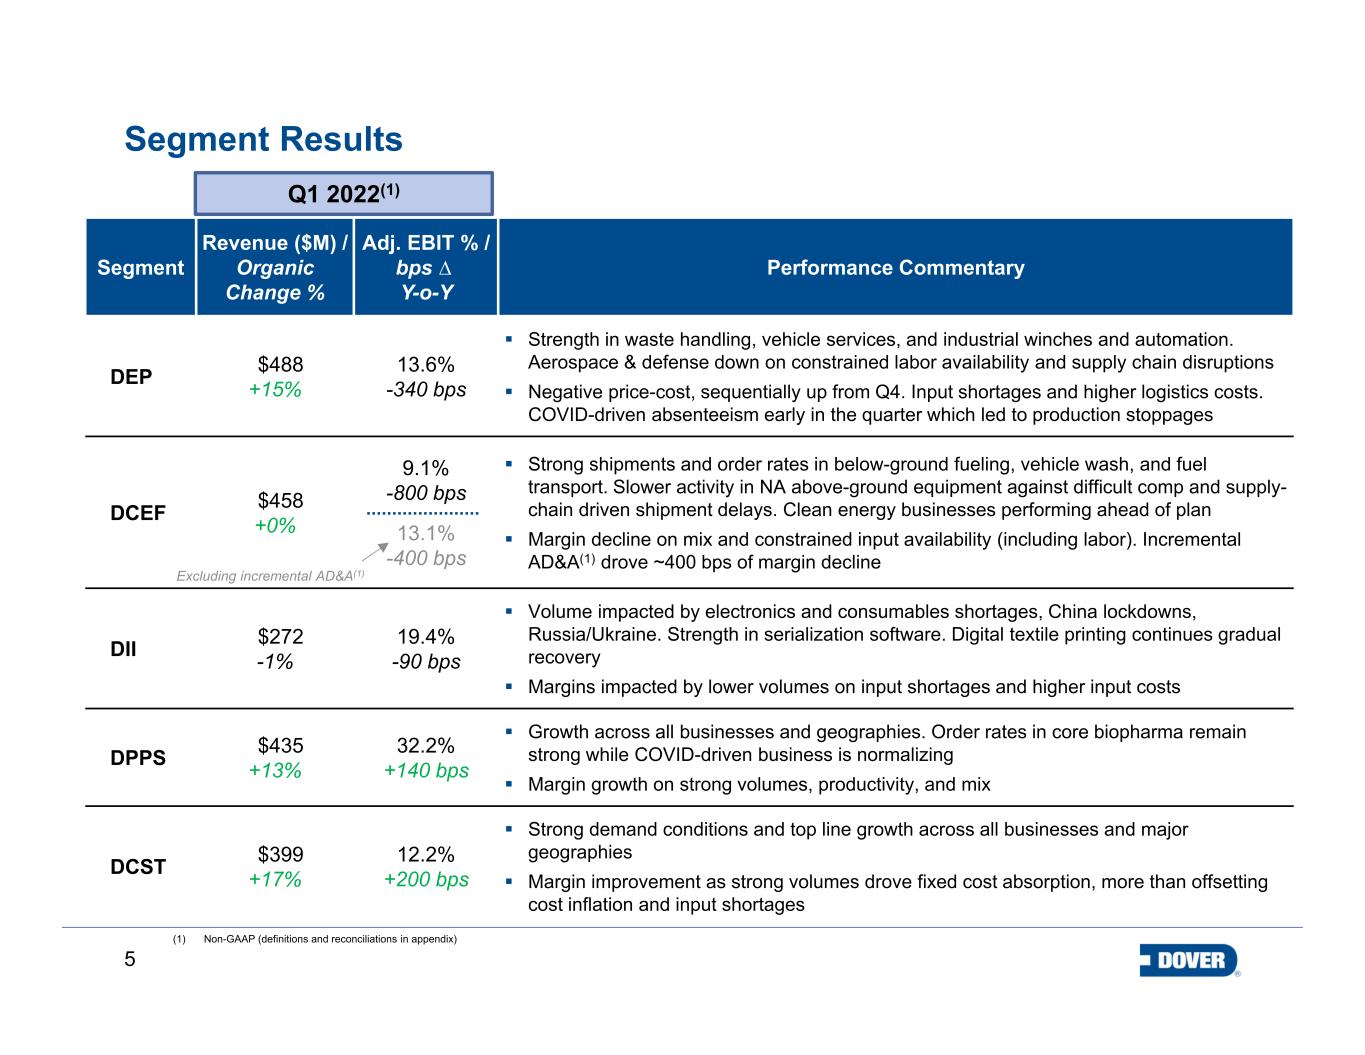
5 Segment Revenue ($M) / Organic Change % Adj. EBIT % / bps ∆ Y-o-Y Performance Commentary DEP $488 +15% 13.6% -340 bps Strength in waste handling, vehicle services, and industrial winches and automation. Aerospace & defense down on constrained labor availability and supply chain disruptions Negative price-cost, sequentially up from Q4. Input shortages and higher logistics costs. COVID-driven absenteeism early in the quarter which led to production stoppages DCEF $458 +0% 9.1% -800 bps 13.1% -400 bps Strong shipments and order rates in below-ground fueling, vehicle wash, and fuel transport. Slower activity in NA above-ground equipment against difficult comp and supply- chain driven shipment delays. Clean energy businesses performing ahead of plan Margin decline on mix and constrained input availability (including labor). Incremental AD&A(1) drove ~400 bps of margin decline DII $272 -1% 19.4% -90 bps Volume impacted by electronics and consumables shortages, China lockdowns, Russia/Ukraine. Strength in serialization software. Digital textile printing continues gradual recovery Margins impacted by lower volumes on input shortages and higher input costs DPPS $435 +13% 32.2% +140 bps Growth across all businesses and geographies. Order rates in core biopharma remain strong while COVID-driven business is normalizing Margin growth on strong volumes, productivity, and mix DCST $399 +17% 12.2% +200 bps Strong demand conditions and top line growth across all businesses and major geographies Margin improvement as strong volumes drove fixed cost absorption, more than offsetting cost inflation and input shortages Segment Results Q1 2022(1) (1) Non-GAAP (definitions and reconciliations in appendix) Excluding incremental AD&A(1)
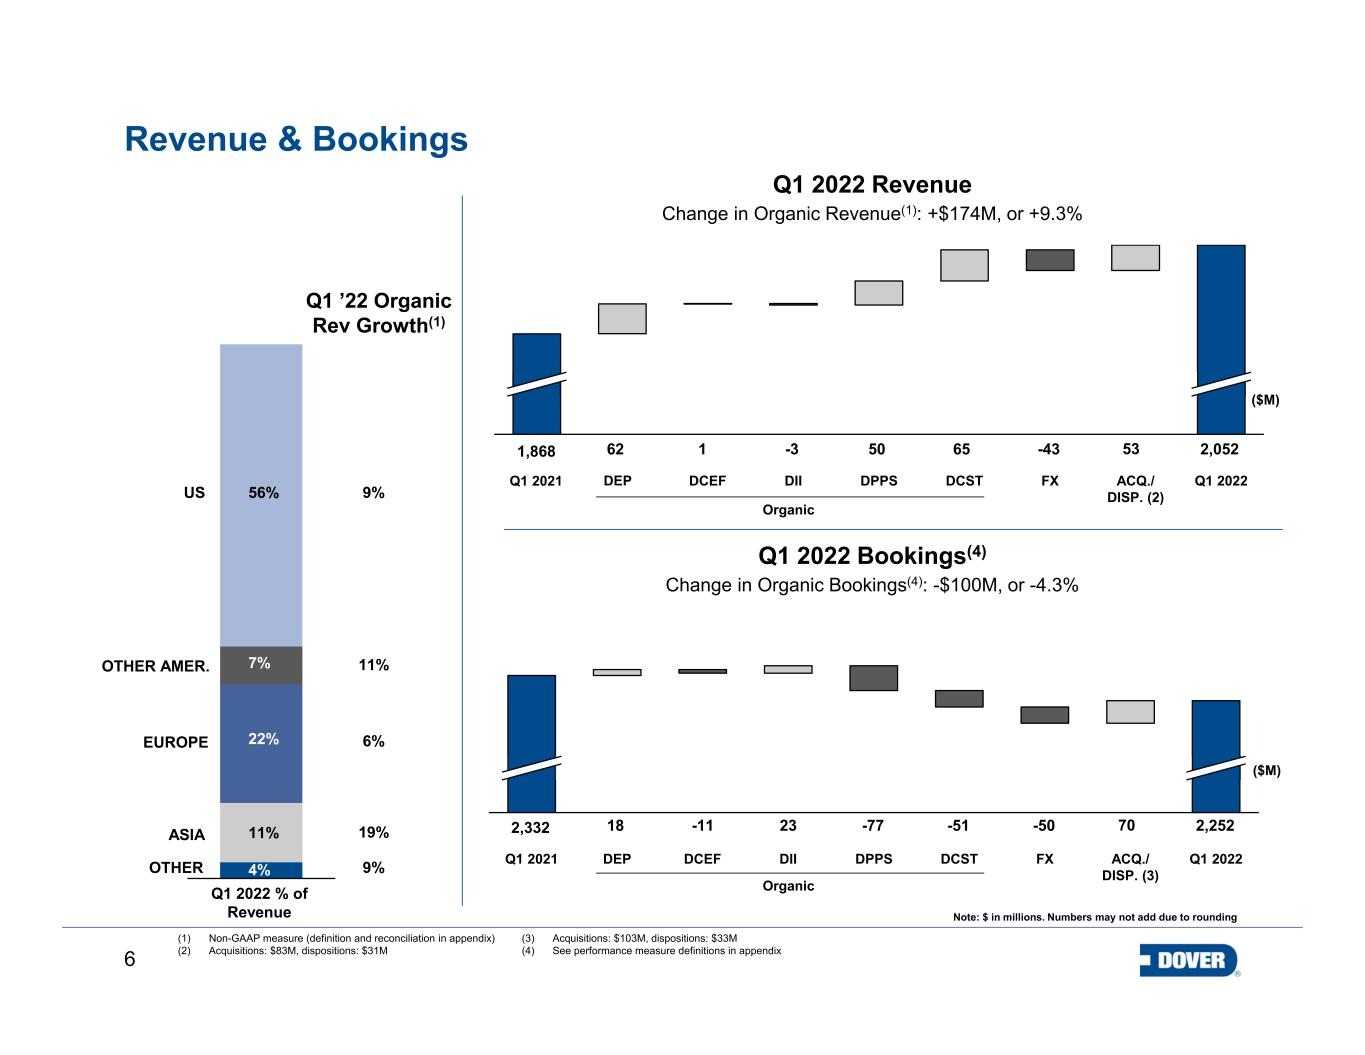
6 Q1 2021 Revenue & Bookings Q1 2022 Revenue Change in Organic Revenue(1): +$174M, or +9.3% FXDII Q1 2022DCEF DPPS DCST ACQ./ DISP. (2) ACQ./ DISP. (3) Q1 2021 DEP DPPSDCEF DII DCST FX Q1 2022 Note: $ in millions. Numbers may not add due to rounding Q1 2022 Bookings(4) Change in Organic Bookings(4): -$100M, or -4.3% (1) Non-GAAP measure (definition and reconciliation in appendix) (2) Acquisitions: $83M, dispositions: $31M DEP ($M) 1,868 1 -43 2,0526562 50-3 ($M) 53 -11 -50 2,252-5118 -7723 702,332 Q1 2022 % of Revenue 7% 22% 4% 56% 11%ASIA OTHER EUROPE OTHER AMER. US 9% 19% 6% 11% 9% Q1 ’22 Organic Rev Growth(1) Organic Organic (3) Acquisitions: $103M, dispositions: $33M (4) See performance measure definitions in appendix
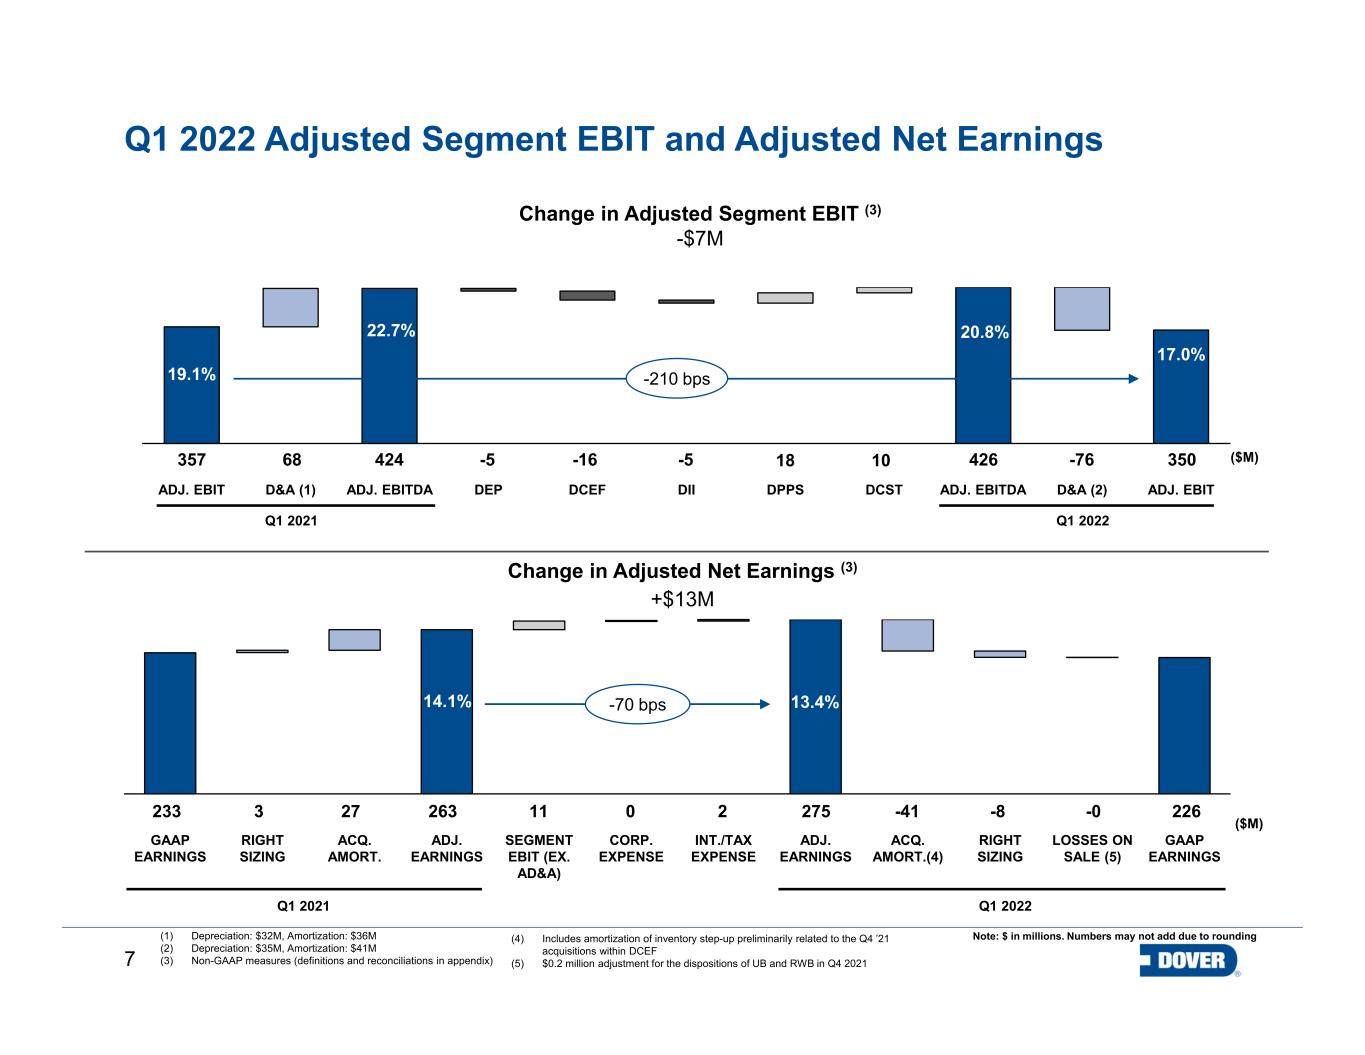
7 ADJ. EBIT DPPSD&A (1) ADJ. EBITDA DEP DCEF D&A (2)DCSTDII ADJ. EBITDA ADJ. EBIT Q1 2022 Adjusted Segment EBIT and Adjusted Net Earnings GAAP EARNINGS RIGHT SIZING ACQ. AMORT. ADJ. EARNINGS SEGMENT EBIT (EX. AD&A) RIGHT SIZING CORP. EXPENSE INT./TAX EXPENSE ADJ. EARNINGS ACQ. AMORT.(4) LOSSES ON SALE (5) GAAP EARNINGS Change in Adjusted Net Earnings (3) +$13M 233 3 27 263 11 0 2 275 -41 -8 Q1 2021 Q1 2022 ($M) Note: $ in millions. Numbers may not add due to rounding 226-0 22.7% 17.0% Change in Adjusted Segment EBIT (3) -$7M Q1 2022 357 424 -5-5 350 ($M)18 19.1% Q1 2021 -76-16 10 20.8% 42668 (1) Depreciation: $32M, Amortization: $36M (2) Depreciation: $35M, Amortization: $41M (3) Non-GAAP measures (definitions and reconciliations in appendix) -210 bps -70 bps (4) Includes amortization of inventory step-up preliminarily related to the Q4 ’21 acquisitions within DCEF (5) $0.2 million adjustment for the dispositions of UB and RWB in Q4 2021 14.1% 13.4%
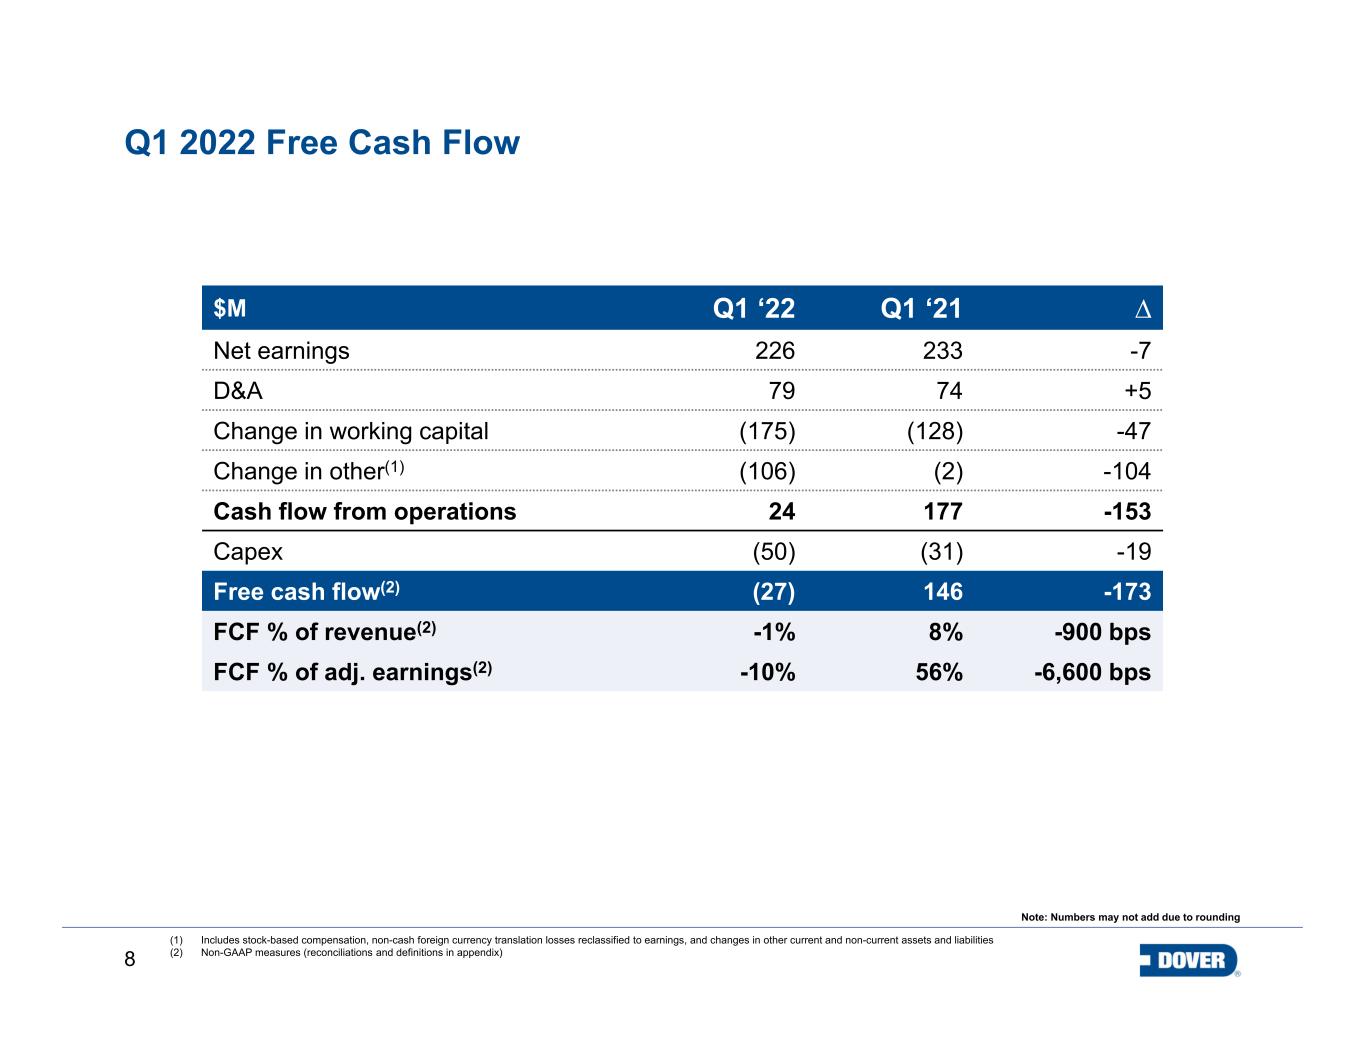
8 Q1 2022 Free Cash Flow 12.3% (1) Includes stock-based compensation, non-cash foreign currency translation losses reclassified to earnings, and changes in other current and non-current assets and liabilities (2) Non-GAAP measures (reconciliations and definitions in appendix) Note: Numbers may not add due to rounding $M Q1 ‘22 Q1 ‘21 ∆ Net earnings 226 233 -7 D&A 79 74 +5 Change in working capital (175) (128) -47 Change in other(1) (106) (2) -104 Cash flow from operations 24 177 -153 Capex (50) (31) -19 Free cash flow(2) (27) 146 -173 FCF % of revenue(2) -1% 8% -900 bps FCF % of adj. earnings(2) -10% 56% -6,600 bps
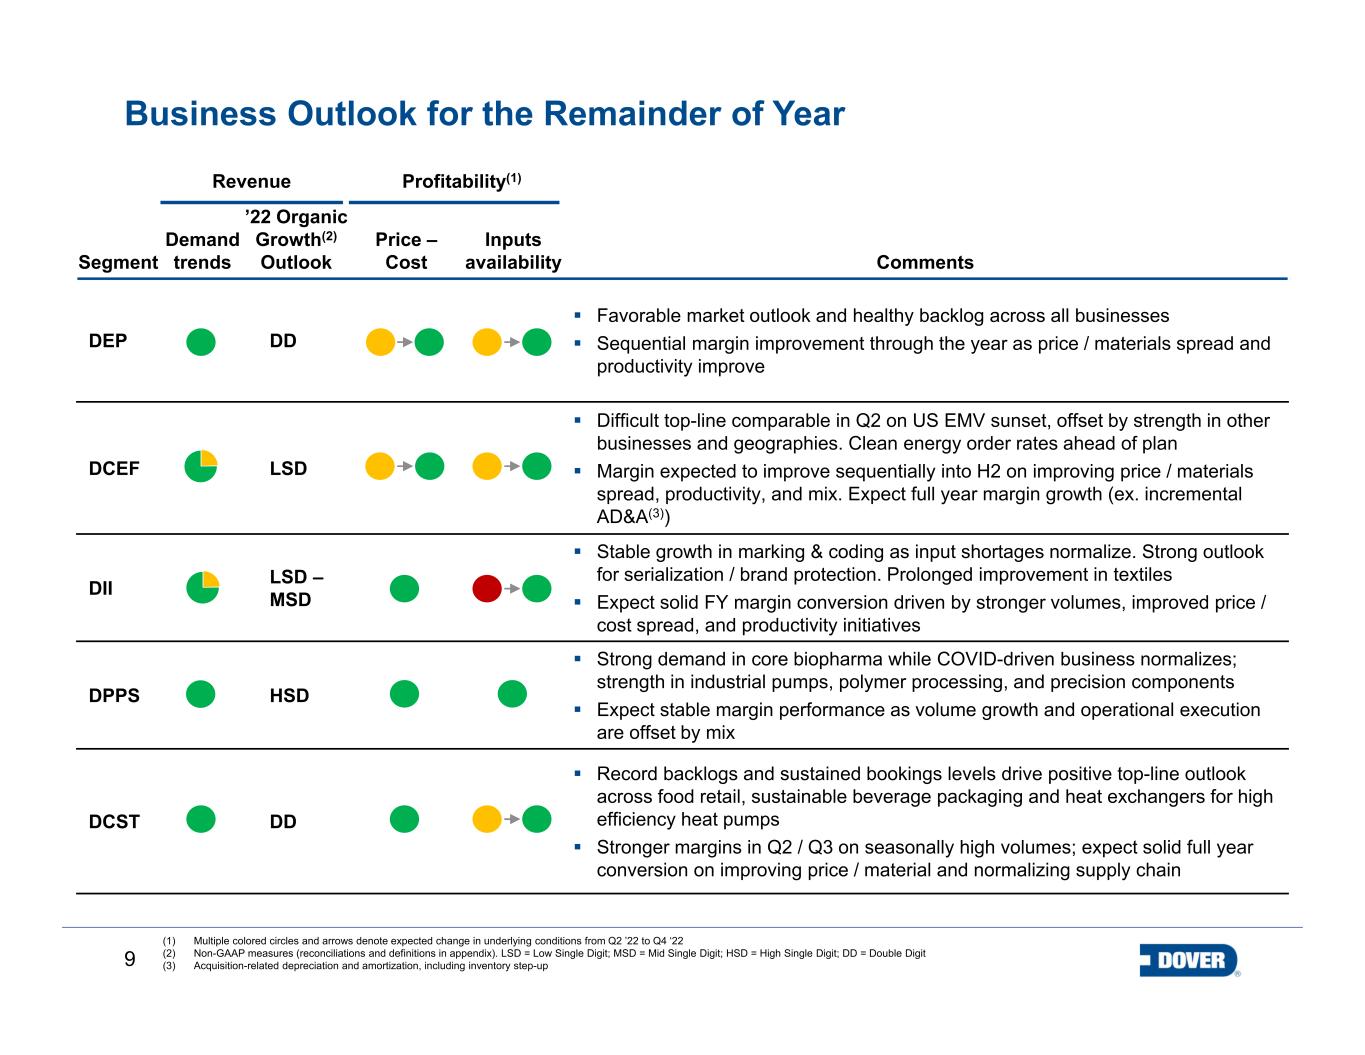
9 Segment Demand trends ’22 Organic Growth(2) Outlook Price – Cost Inputs availability Comments DEP DD Favorable market outlook and healthy backlog across all businesses Sequential margin improvement through the year as price / materials spread and productivity improve DCEF LSD Difficult top-line comparable in Q2 on US EMV sunset, offset by strength in other businesses and geographies. Clean energy order rates ahead of plan Margin expected to improve sequentially into H2 on improving price / materials spread, productivity, and mix. Expect full year margin growth (ex. incremental AD&A(3)) DII LSD – MSD Stable growth in marking & coding as input shortages normalize. Strong outlook for serialization / brand protection. Prolonged improvement in textiles Expect solid FY margin conversion driven by stronger volumes, improved price / cost spread, and productivity initiatives DPPS HSD Strong demand in core biopharma while COVID-driven business normalizes; strength in industrial pumps, polymer processing, and precision components Expect stable margin performance as volume growth and operational execution are offset by mix DCST DD Record backlogs and sustained bookings levels drive positive top-line outlook across food retail, sustainable beverage packaging and heat exchangers for high efficiency heat pumps Stronger margins in Q2 / Q3 on seasonally high volumes; expect solid full year conversion on improving price / material and normalizing supply chain Business Outlook for the Remainder of Year (1) Multiple colored circles and arrows denote expected change in underlying conditions from Q2 ’22 to Q4 ‘22 (2) Non-GAAP measures (reconciliations and definitions in appendix). LSD = Low Single Digit; MSD = Mid Single Digit; HSD = High Single Digit; DD = Double Digit (3) Acquisition-related depreciation and amortization, including inventory step-up Revenue Profitability(1)
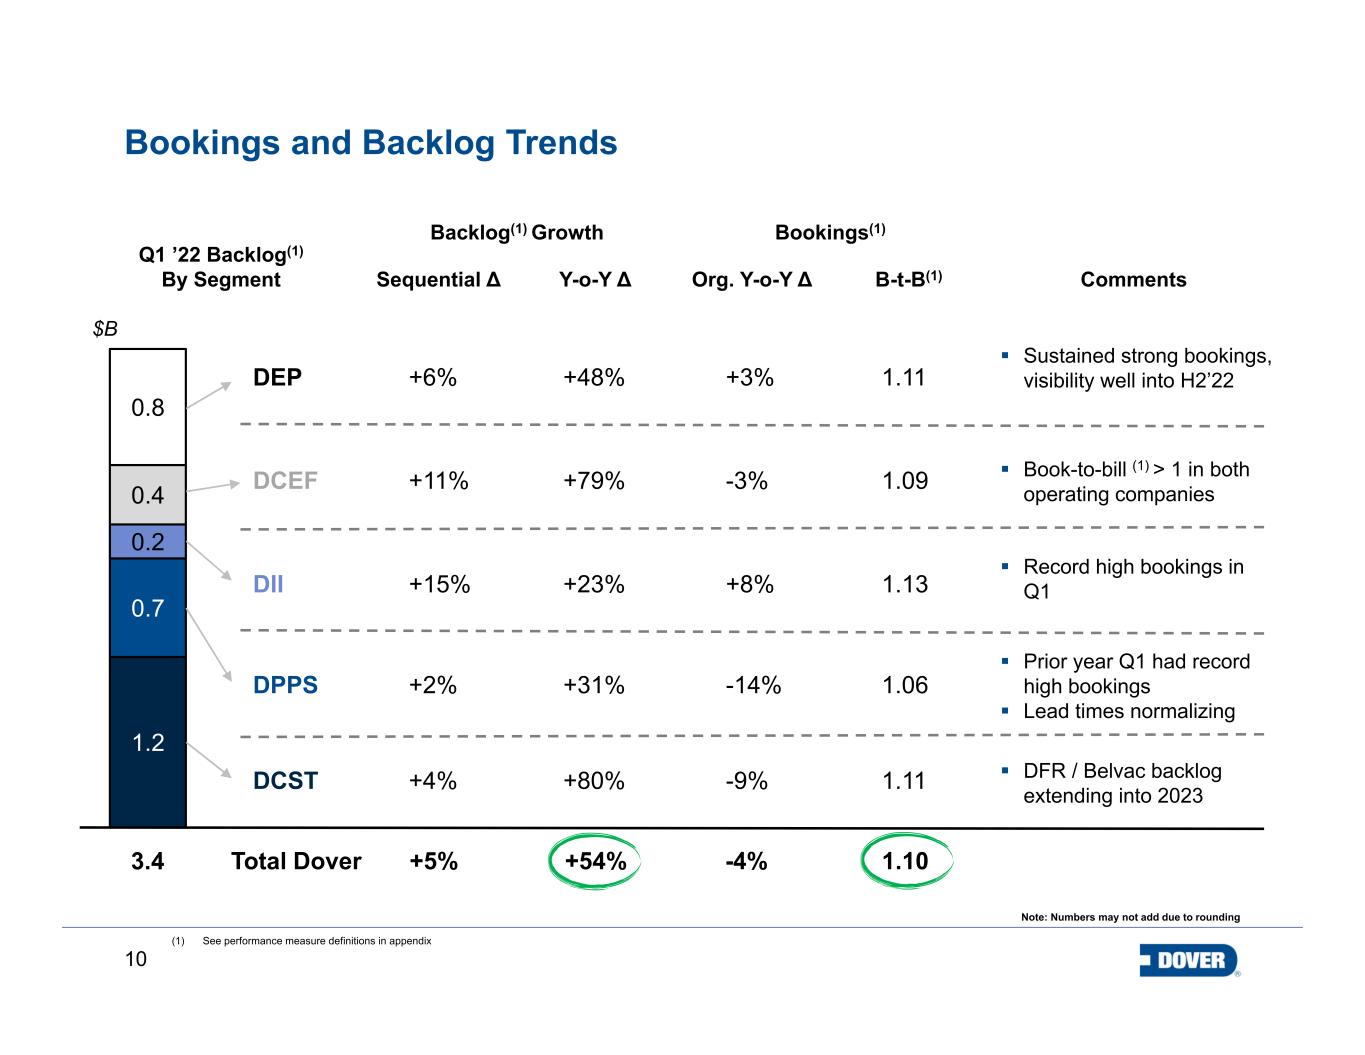
10 1.2 0.7 0.2 0.4 0.8 Bookings and Backlog Trends (1) See performance measure definitions in appendix Note: Numbers may not add due to rounding Backlog(1) Growth 3.4 $B Sequential Δ Y-o-Y Δ DEP +6% +48% +3% 1.11 Q1 ’22 Backlog(1) By Segment Bookings(1) Org. Y-o-Y Δ B-t-B(1) Comments DCEF +11% +79% -3% 1.09 DII +15% +23% +8% 1.13 DPPS +2% +31% -14% 1.06 DCST +4% +80% -9% 1.11 Total Dover +5% +54% -4% 1.10 Sustained strong bookings, visibility well into H2’22 Record high bookings in Q1 Prior year Q1 had record high bookings Lead times normalizing DFR / Belvac backlog extending into 2023 Book-to-bill (1) > 1 in both operating companies
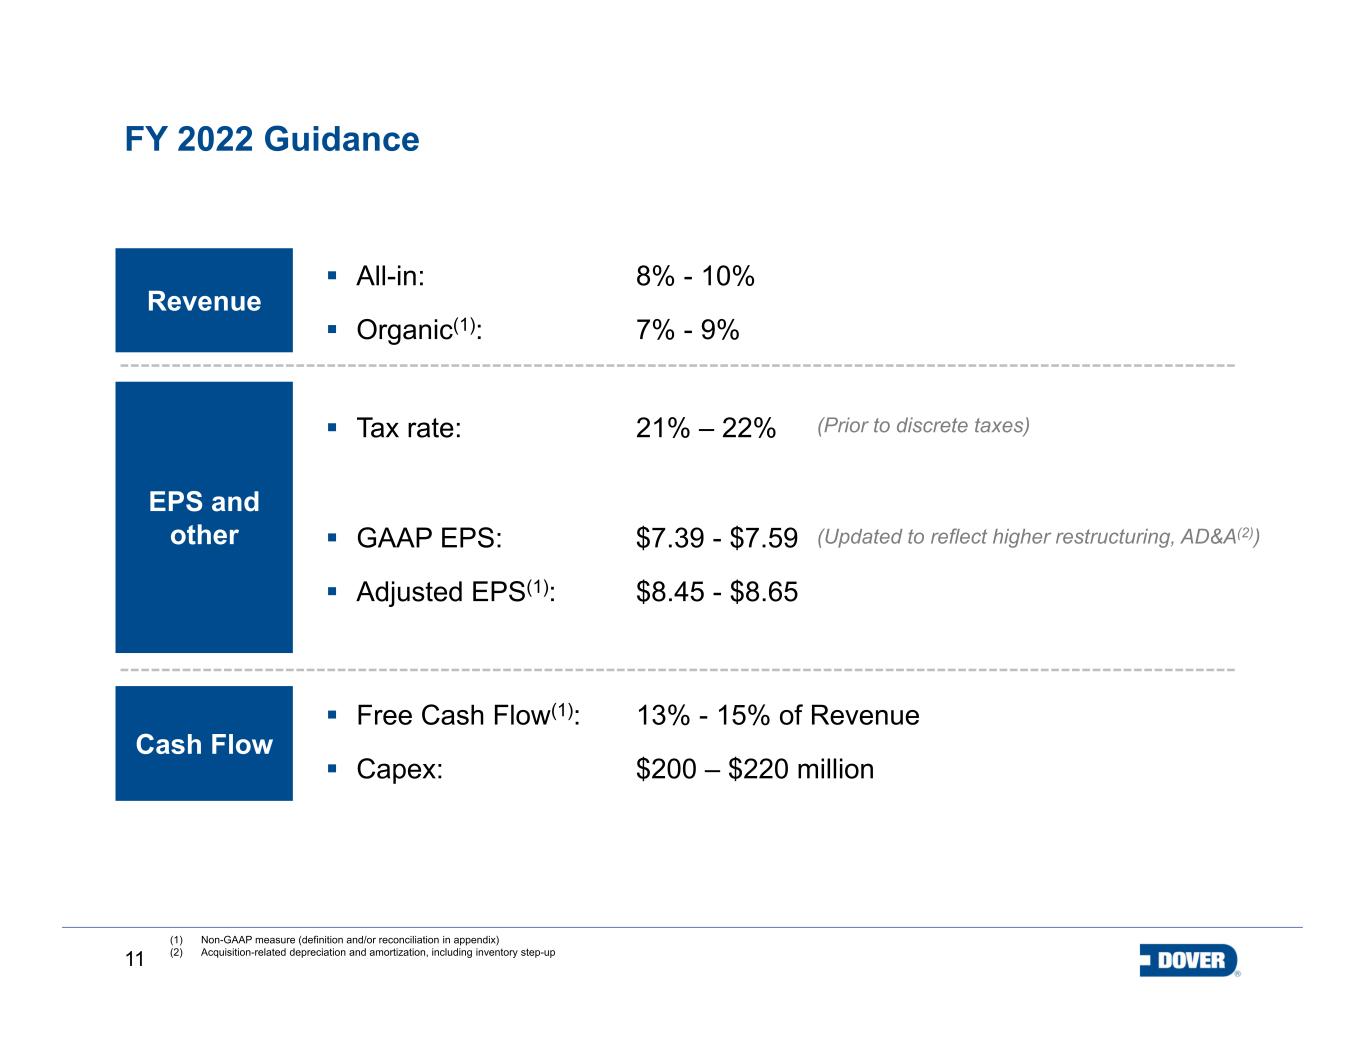
11 FY 2022 Guidance (1) Non-GAAP measure (definition and/or reconciliation in appendix) (2) Acquisition-related depreciation and amortization, including inventory step-up EPS and other Cash Flow Free Cash Flow(1): 13% - 15% of Revenue Capex: $200 – $220 million GAAP EPS: $7.39 - $7.59 Adjusted EPS(1): $8.45 - $8.65 Revenue All-in: 8% - 10% Organic(1): 7% - 9% Tax rate: 21% – 22% (Prior to discrete taxes) (Updated to reflect higher restructuring, AD&A(2))
12 Appendix
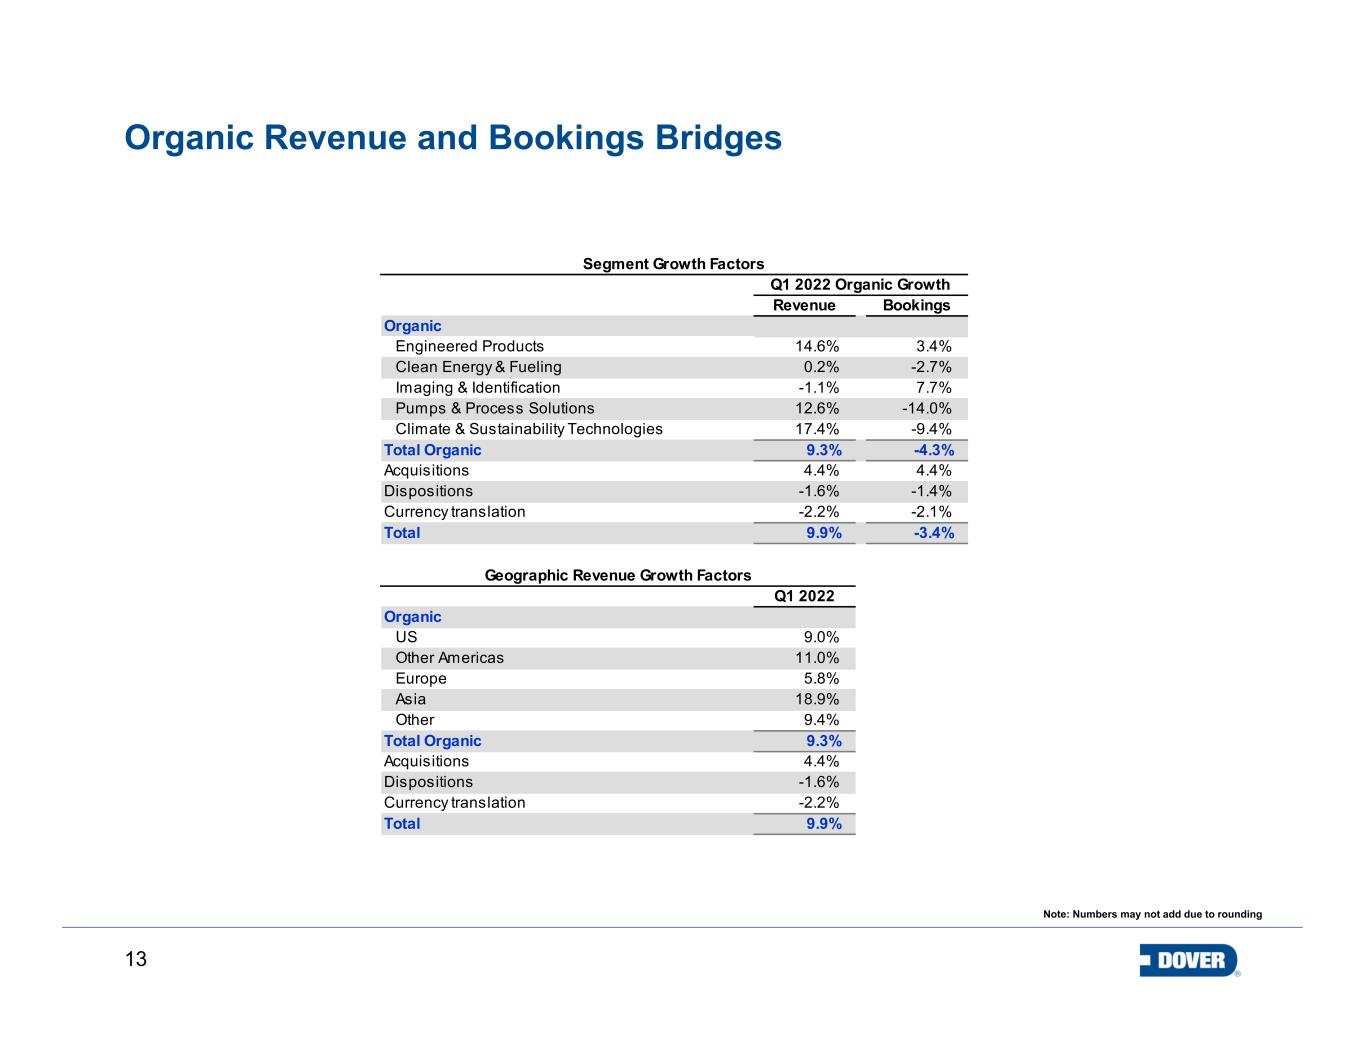
13 Organic Revenue and Bookings Bridges Note: Numbers may not add due to rounding Revenue Bookings 14.6% 3.4% 0.2% -2.7% -1.1% 7.7% 12.6% -14.0% 17.4% -9.4% 9.3% -4.3% 4.4% 4.4% -1.6% -1.4% -2.2% -2.1% Total 9.9% -3.4% Geographic Revenue Growth Factors Q1 2022 9.0% 11.0% 5.8% 18.9% 9.4% 9.3% 4.4% -1.6% -2.2% Total 9.9% Acquisitions Dispositions Currency translation Organic US Other Americas Europe Asia Other Total Organic Acquisitions Dispositions Segment Growth Factors Currency translation Organic Climate & Sustainability Technologies Total Organic Engineered Products Pumps & Process Solutions Clean Energy & Fueling Imaging & Identification Q1 2022 Organic Growth
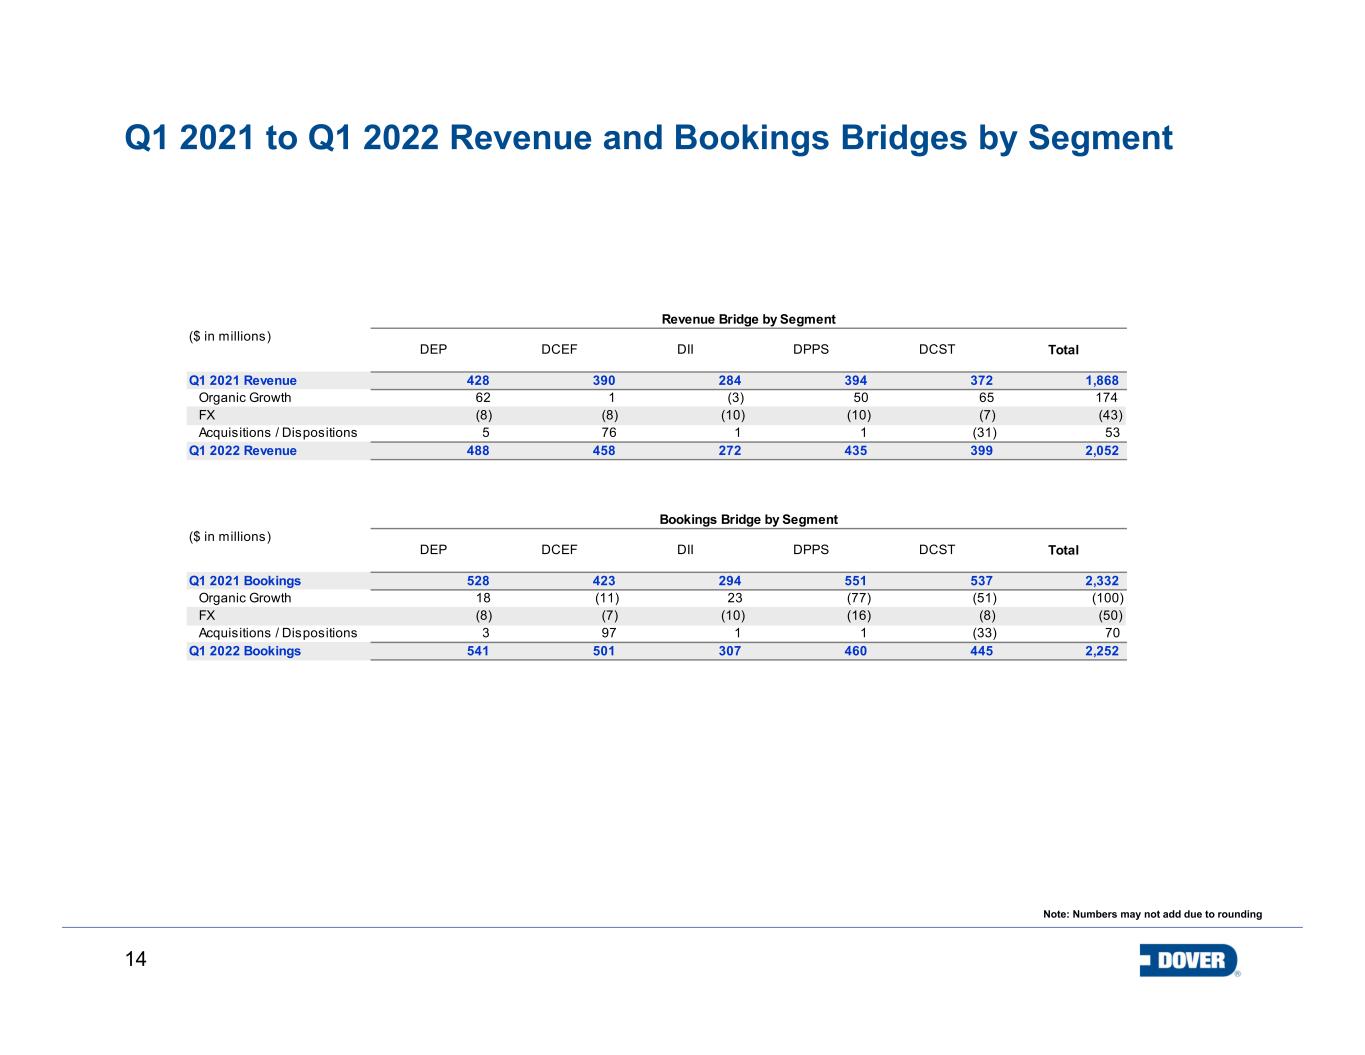
14 Q1 2021 to Q1 2022 Revenue and Bookings Bridges by Segment Note: Numbers may not add due to rounding DEP DCEF DII DPPS DCST Total 428 390 284 394 372 1,868 62 1 (3) 50 65 174 (8) (8) (10) (10) (7) (43) 5 76 1 1 (31) 53 488 458 272 435 399 2,052 DEP DCEF DII DPPS DCST Total 528 423 294 551 537 2,332 18 (11) 23 (77) (51) (100) (8) (7) (10) (16) (8) (50) 3 97 1 1 (33) 70 541 501 307 460 445 2,252 FX Q1 2022 Bookings Q1 2021 Bookings Organic Growth Acquisitions / Dispositions ($ in millions) Q1 2021 Revenue Bookings Bridge by Segment ($ in millions) Acquisitions / Dispositions Q1 2022 Revenue Organic Growth FX Revenue Bridge by Segment
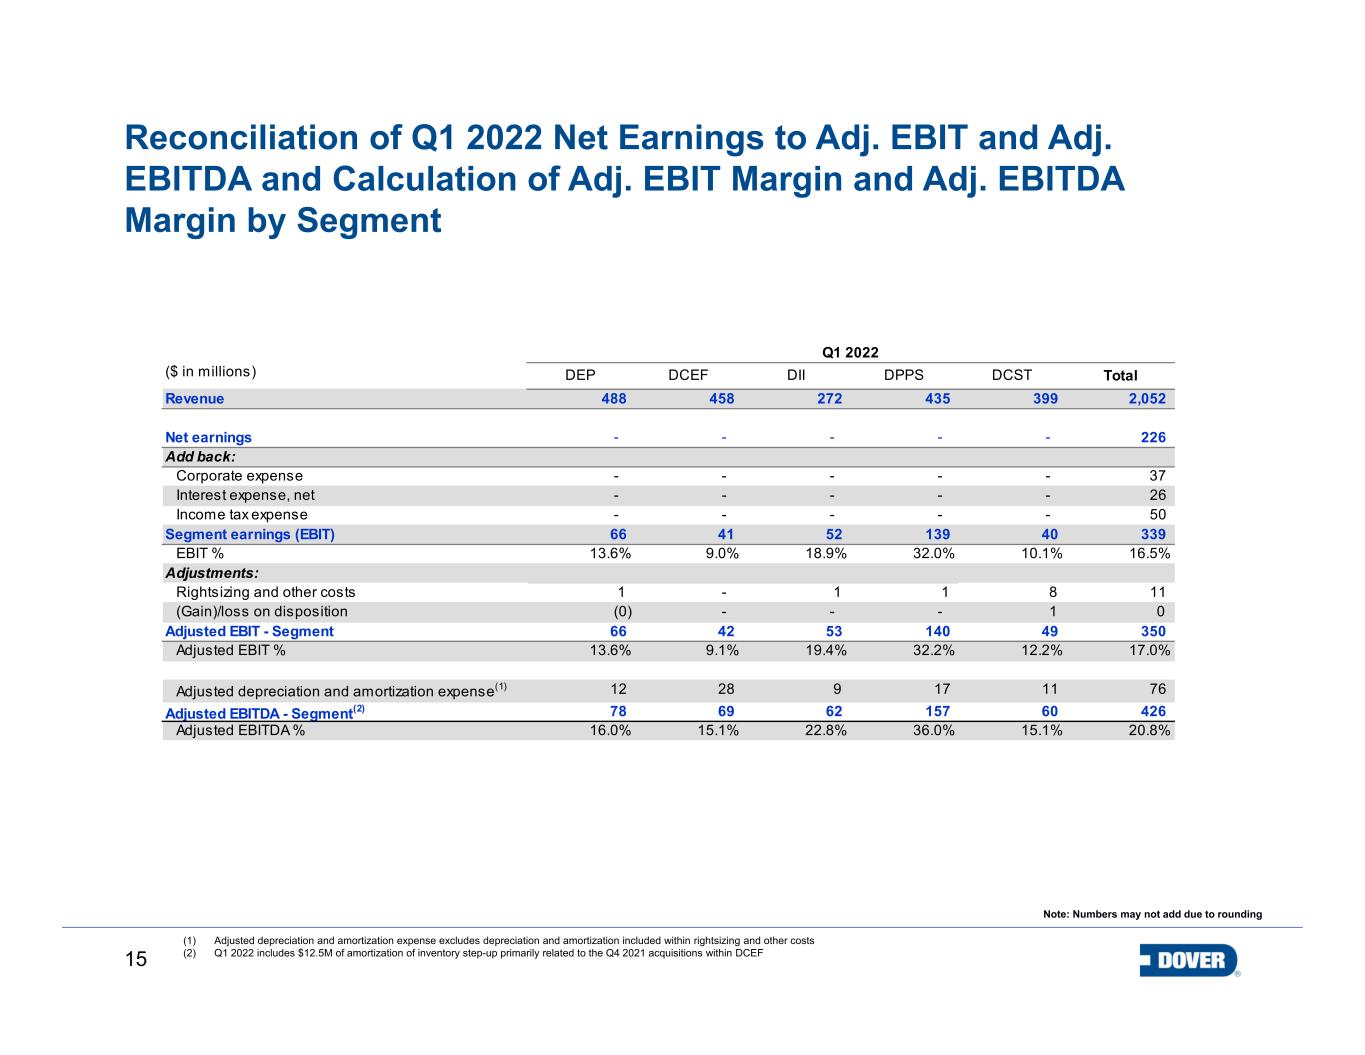
15 Reconciliation of Q1 2022 Net Earnings to Adj. EBIT and Adj. EBITDA and Calculation of Adj. EBIT Margin and Adj. EBITDA Margin by Segment (1) Adjusted depreciation and amortization expense excludes depreciation and amortization included within rightsizing and other costs (2) Q1 2022 includes $12.5M of amortization of inventory step-up primarily related to the Q4 2021 acquisitions within DCEF Note: Numbers may not add due to rounding DEP DCEF DII DPPS DCST Total 488 458 272 435 399 2,052 - - - - - 226 - - - - - 37 - - - - - 26 - - - - - 50 66 41 52 139 40 339 13.6% 9.0% 18.9% 32.0% 10.1% 16.5% 1 - 1 1 8 11 (0) - - - 1 0 66 42 53 140 49 350 13.6% 9.1% 19.4% 32.2% 12.2% 17.0% 12 28 9 17 11 76 78 69 62 157 60 426 16.0% 15.1% 22.8% 36.0% 15.1% 20.8% Corporate expense Adjusted EBIT % Adjusted depreciation and amortization expense(1) Interest expense, net Adjusted EBIT - Segment (Gain)/loss on disposition Q1 2022 ($ in millions) Revenue Net earnings Add back: Adjusted EBITDA - Segment(2) Adjusted EBITDA % Income tax expense Segment earnings (EBIT) EBIT % Adjustments: Rightsizing and other costs
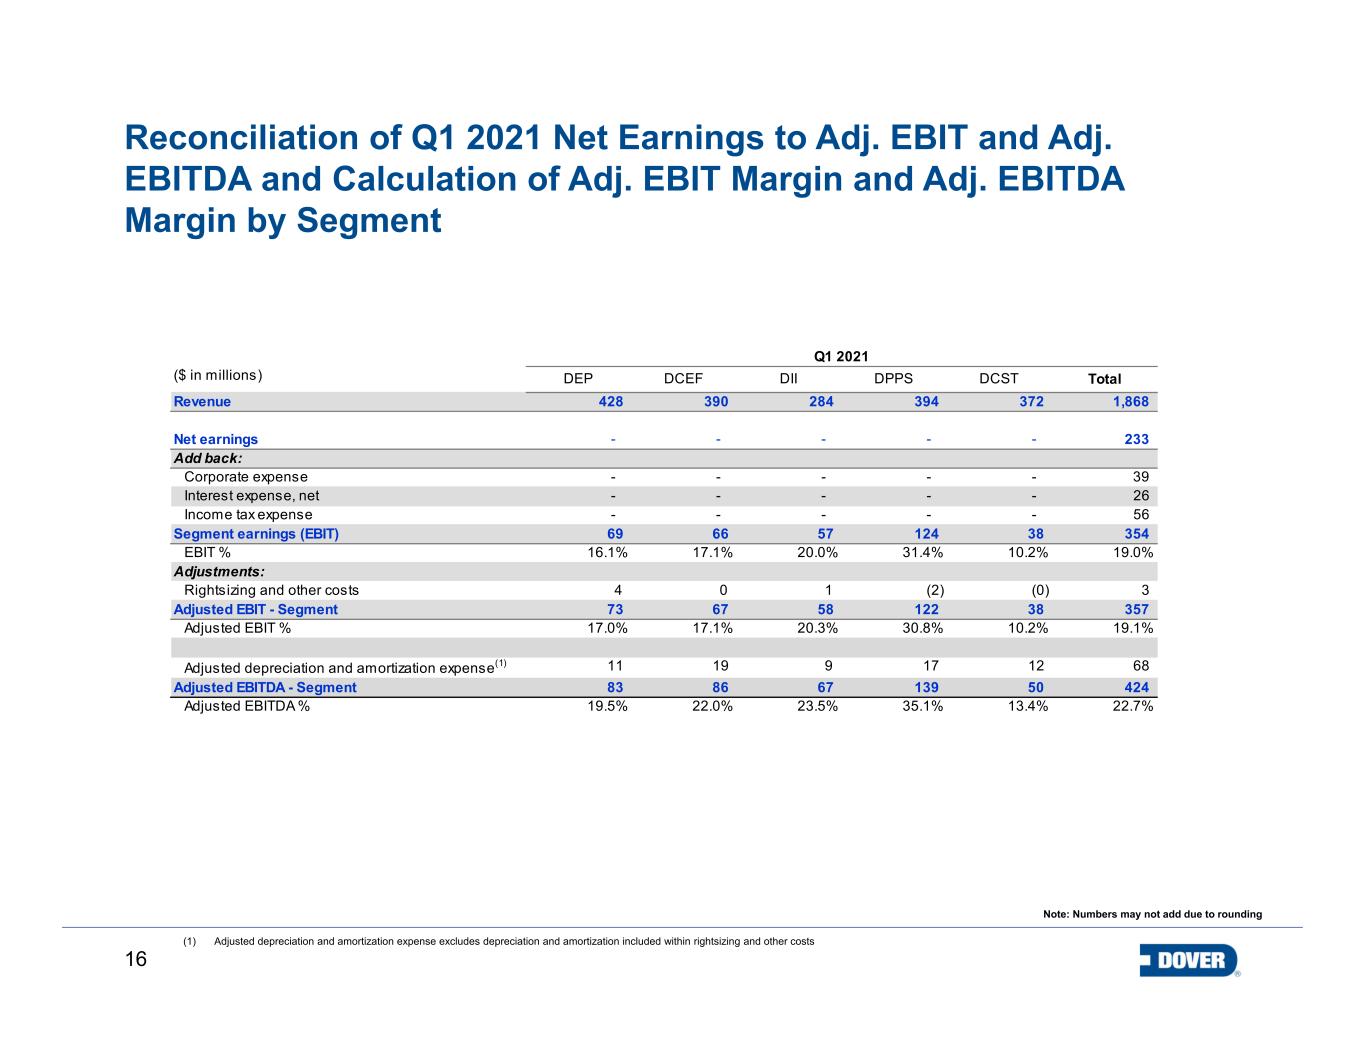
16 Reconciliation of Q1 2021 Net Earnings to Adj. EBIT and Adj. EBITDA and Calculation of Adj. EBIT Margin and Adj. EBITDA Margin by Segment (1) Adjusted depreciation and amortization expense excludes depreciation and amortization included within rightsizing and other costs DEP DCEF DII DPPS DCST Total 428 390 284 394 372 1,868 - - - - - 233 - - - - - 39 - - - - - 26 - - - - - 56 69 66 57 124 38 354 16.1% 17.1% 20.0% 31.4% 10.2% 19.0% 4 0 1 (2) (0) 3 73 67 58 122 38 357 17.0% 17.1% 20.3% 30.8% 10.2% 19.1% 11 19 9 17 12 68 83 86 67 139 50 424 19.5% 22.0% 23.5% 35.1% 13.4% 22.7% Corporate expense Adjusted EBIT % Adjusted depreciation and amortization expense(1) Interest expense, net Adjusted EBIT - Segment Q1 2021 ($ in millions) Revenue Net earnings Add back: Adjusted EBITDA - Segment Adjusted EBITDA % Income tax expense Segment earnings (EBIT) EBIT % Adjustments: Rightsizing and other costs Note: Numbers may not add due to rounding
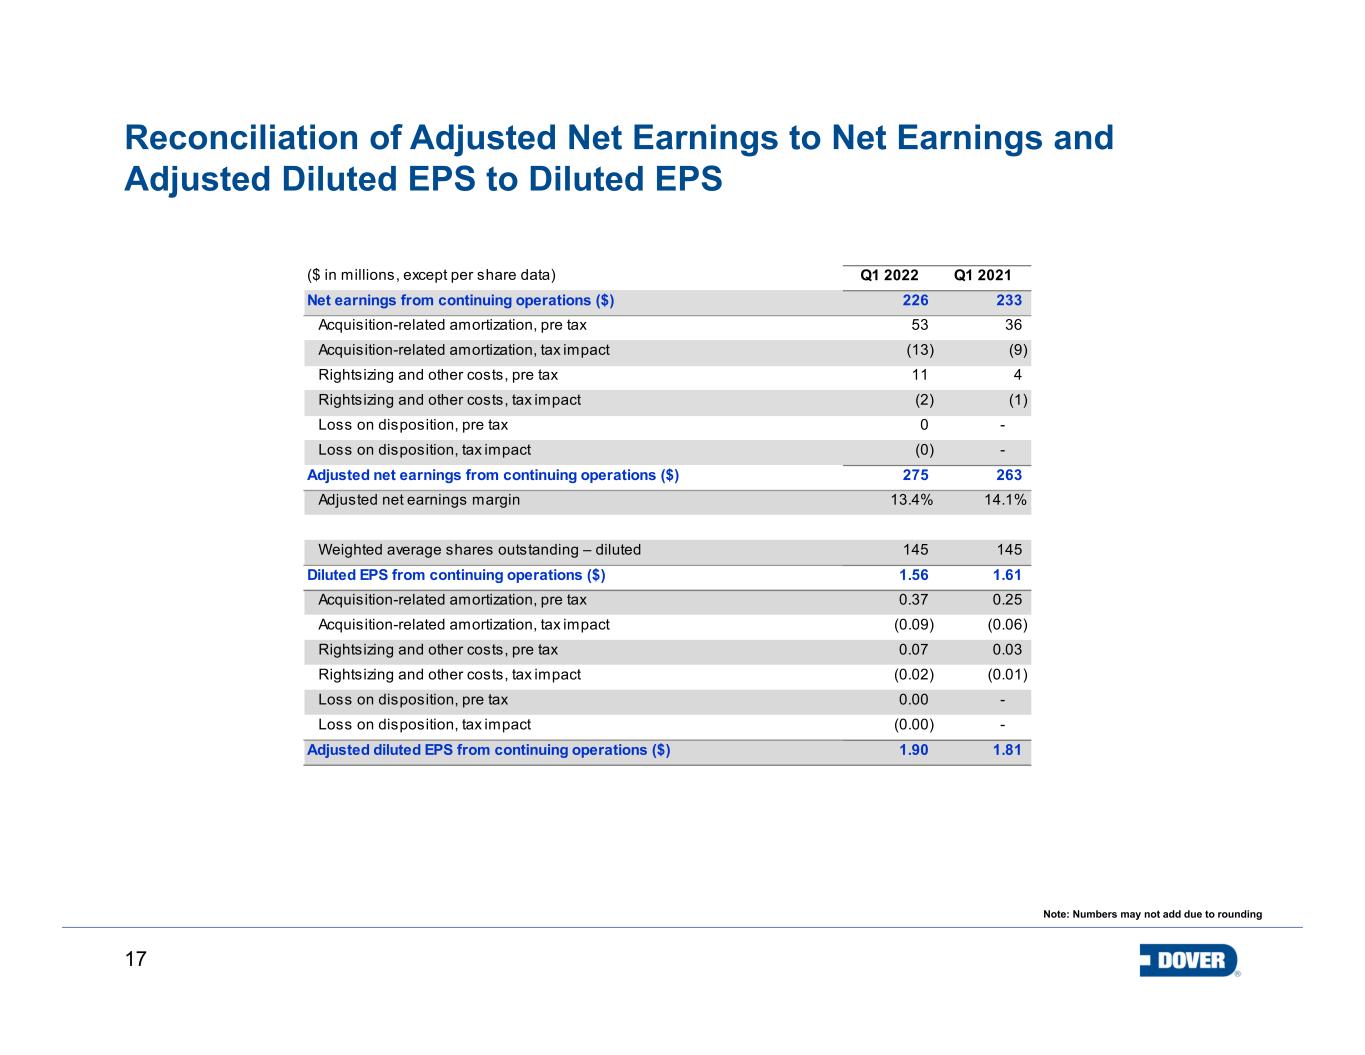
17 Reconciliation of Adjusted Net Earnings to Net Earnings and Adjusted Diluted EPS to Diluted EPS Note: Numbers may not add due to rounding ($ in millions, except per share data) Q1 2022 Q1 2021 Net earnings from continuing operations ($) 226 233 Acquisition-related amortization, pre tax 53 36 Acquisition-related amortization, tax impact (13) (9) Rightsizing and other costs, pre tax 11 4 Rightsizing and other costs, tax impact (2) (1) Loss on disposition, pre tax 0 - Loss on disposition, tax impact (0) - Adjusted net earnings from continuing operations ($) 275 263 Adjusted net earnings margin 13.4% 14.1% Weighted average shares outstanding – diluted 145 145 Diluted EPS from continuing operations ($) 1.56 1.61 Acquisition-related amortization, pre tax 0.37 0.25 Acquisition-related amortization, tax impact (0.09) (0.06) Rightsizing and other costs, pre tax 0.07 0.03 Rightsizing and other costs, tax impact (0.02) (0.01) Loss on disposition, pre tax 0.00 - Loss on disposition, tax impact (0.00) - Adjusted diluted EPS from continuing operations ($) 1.90 1.81
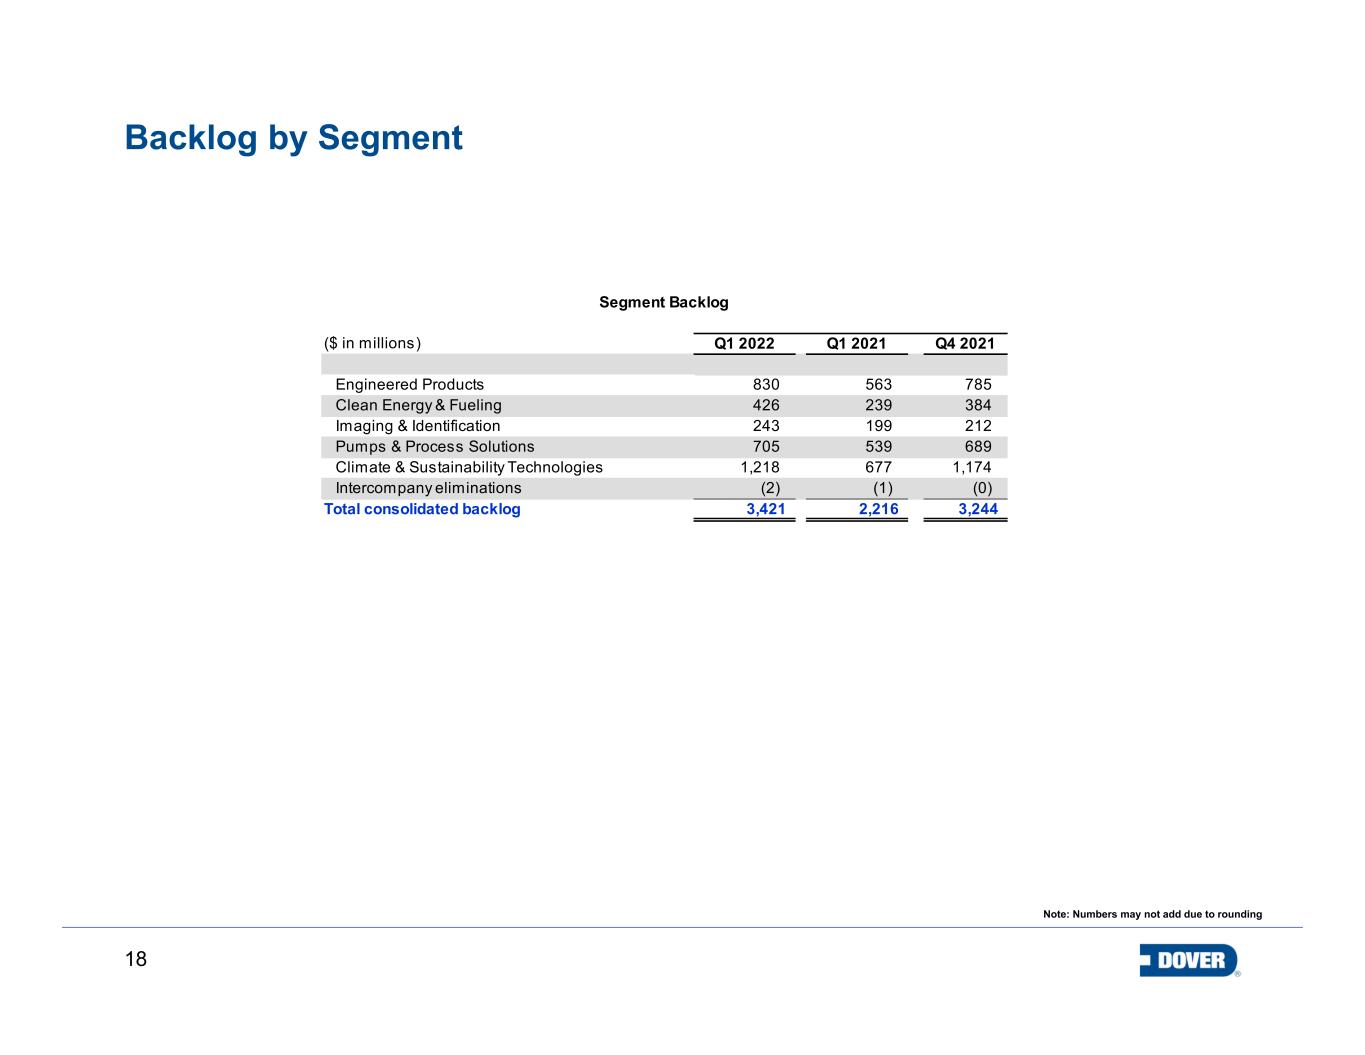
18 Backlog by Segment Note: Numbers may not add due to rounding ($ in millions) Q1 2022 Q1 2021 Q4 2021 830 563 785 426 239 384 243 199 212 705 539 689 1,218 677 1,174 (2) (1) (0) 3,421 2,216 3,244 Total consolidated backlog Climate & Sustainability Technologies Intercompany eliminations Engineered Products Pumps & Process Solutions Clean Energy & Fueling Imaging & Identification Segment Backlog
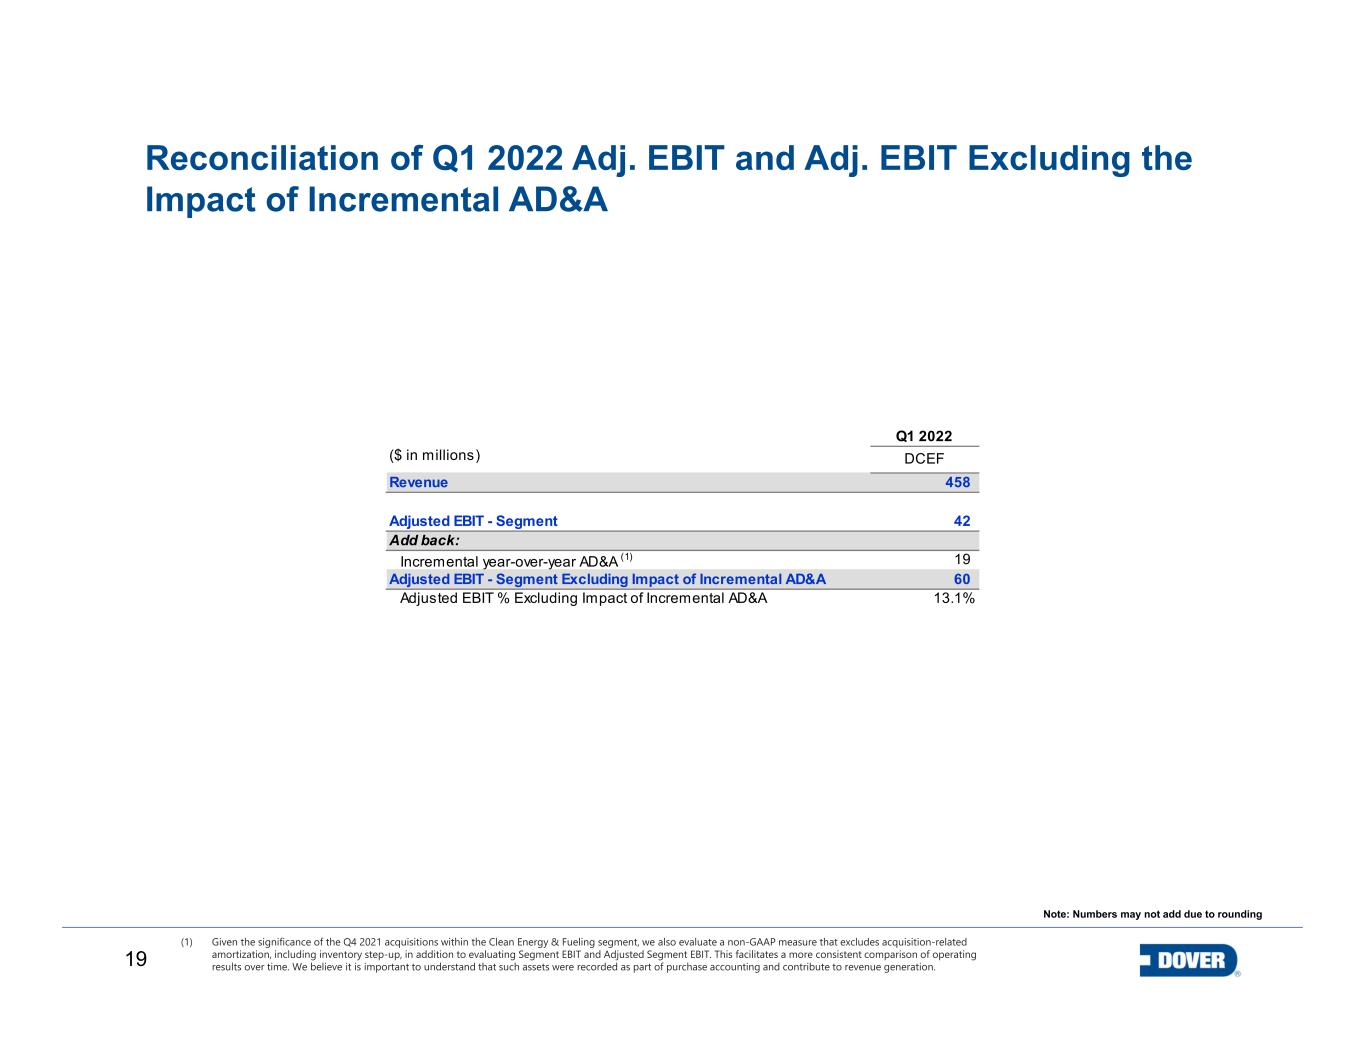
19 (1) Given the significance of the Q4 2021 acquisitions within the Clean Energy & Fueling segment, we also evaluate a non-GAAP measure that excludes acquisition-related amortization, including inventory step-up, in addition to evaluating Segment EBIT and Adjusted Segment EBIT. This facilitates a more consistent comparison of operating results over time. We believe it is important to understand that such assets were recorded as part of purchase accounting and contribute to revenue generation. Note: Numbers may not add due to rounding Reconciliation of Q1 2022 Adj. EBIT and Adj. EBIT Excluding the Impact of Incremental AD&A Q1 2022 DCEF 458 42 19 60 13.1% Adjusted EBIT - Segment Excluding Impact of Incremental AD&A Adjusted EBIT % Excluding Impact of Incremental AD&A Incremental year-over-year AD&A (1) ($ in millions) Revenue Adjusted EBIT - Segment Add back:
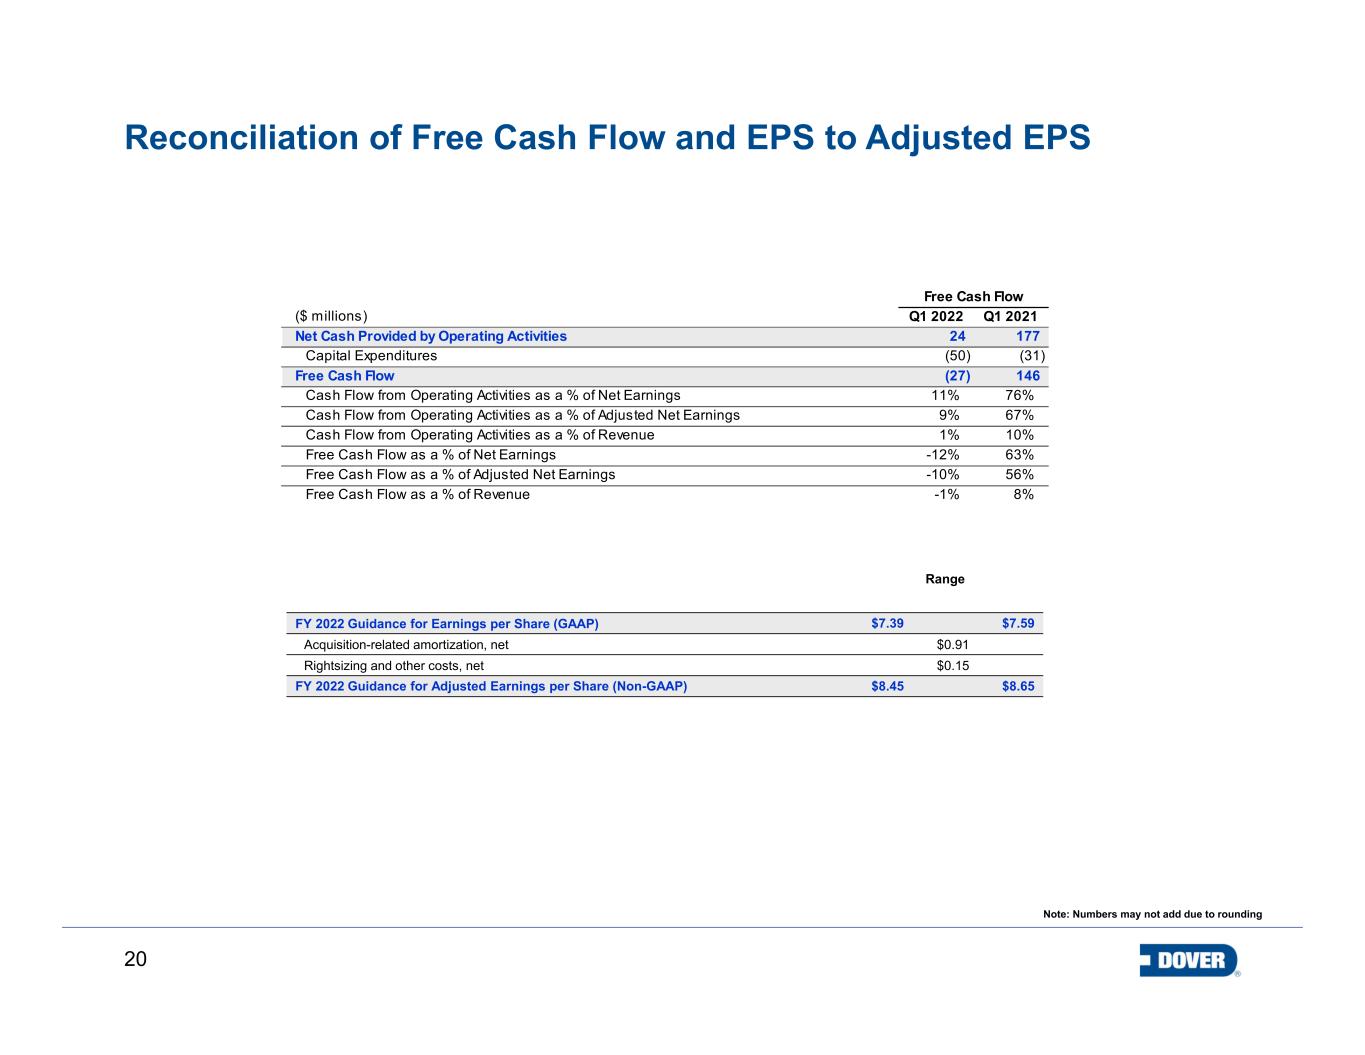
20 Range FY 2022 Guidance for Earnings per Share (GAAP) $7.39 $7.59 Acquisition-related amortization, net $0.91 Rightsizing and other costs, net $0.15 FY 2022 Guidance for Adjusted Earnings per Share (Non-GAAP) $8.45 $8.65 Note: Numbers may not add due to rounding ($ millions) Q1 2022 Q1 2021 Net Cash Provided by Operating Activities 24 177 Capital Expenditures (50) (31) Free Cash Flow (27) 146 Cash Flow from Operating Activities as a % of Net Earnings 11% 76% Cash Flow from Operating Activities as a % of Adjusted Net Earnings 9% 67% Cash Flow from Operating Activities as a % of Revenue 1% 10% Free Cash Flow as a % of Net Earnings -12% 63% Free Cash Flow as a % of Adjusted Net Earnings -10% 56% Free Cash Flow as a % of Revenue -1% 8% Free Cash Flow Reconciliation of Free Cash Flow and EPS to Adjusted EPS

21 Non-GAAP Definitions Definitions of Non-GAAP Measures: Adjusted Net Earnings: is defined as net earnings adjusted for the effect of acquisition-related amortization and inventory step-up, rightsizing and other costs/benefits, and gain/loss on dispositions. Adjusted Net Earnings Margin: is defined as adjusted net earnings divided by revenue. Adjusted Diluted Net Earnings Per Share (or Adjusted Earnings Per Share): is defined as diluted EPS adjusted for the effect of acquisition-related amortization and inventory step-up, rightsizing and other costs/benefits, and a gain/loss on disposition. Total Segment Earnings (EBIT): is defined as net earnings before income taxes, net interest expense and corporate expenses. Total Segment Earnings (EBIT) Margin: is defined as total segment earnings (EBIT) divided by revenue. Adjusted EBIT by Segment: is defined as net earnings before income taxes, net interest expense, corporate expenses, rightsizing and other costs/benefits, and gain/loss on dispositions Adjusted EBIT Margin by Segment: is defined as adjusted EBIT by segment divided by segment revenue. The bps change Y-o-Y is calculated as the difference between adjusted EBIT margin for the current period and the prior period. Adjusted EBITDA by Segment: is defined as adjusted EBIT by segment plus depreciation and amortization, excluding depreciation and amortization included within rightsizing and other costs. Adjusted EBITDA Margin by Segment: is defined as adjusted EBITDA by segment divided by segment revenue. Free Cash Flow: is defined as net cash provided by operating activities minus capital expenditures. Free cash flow as a percentage of revenue equals free cash flow divided by revenue. Free cash flow as a percentage of net earnings equals free cash flow divided by net earnings. Free cash flow as a percentage of adjusted net earnings equals free cash flow divided by adjusted net earnings. Organic Revenue Growth: is defined as revenue growth excluding the impact of foreign currency exchange rates and the impact of acquisitions and dispositions. The tables included in this presentation provide reconciliations of the non-GAAP measures used in this presentation to the most directly comparable U.S. GAAP measures. Further information regarding management’s use of these non-GAAP measures is included in Dover’s earnings release and investor supplement for the quarter.
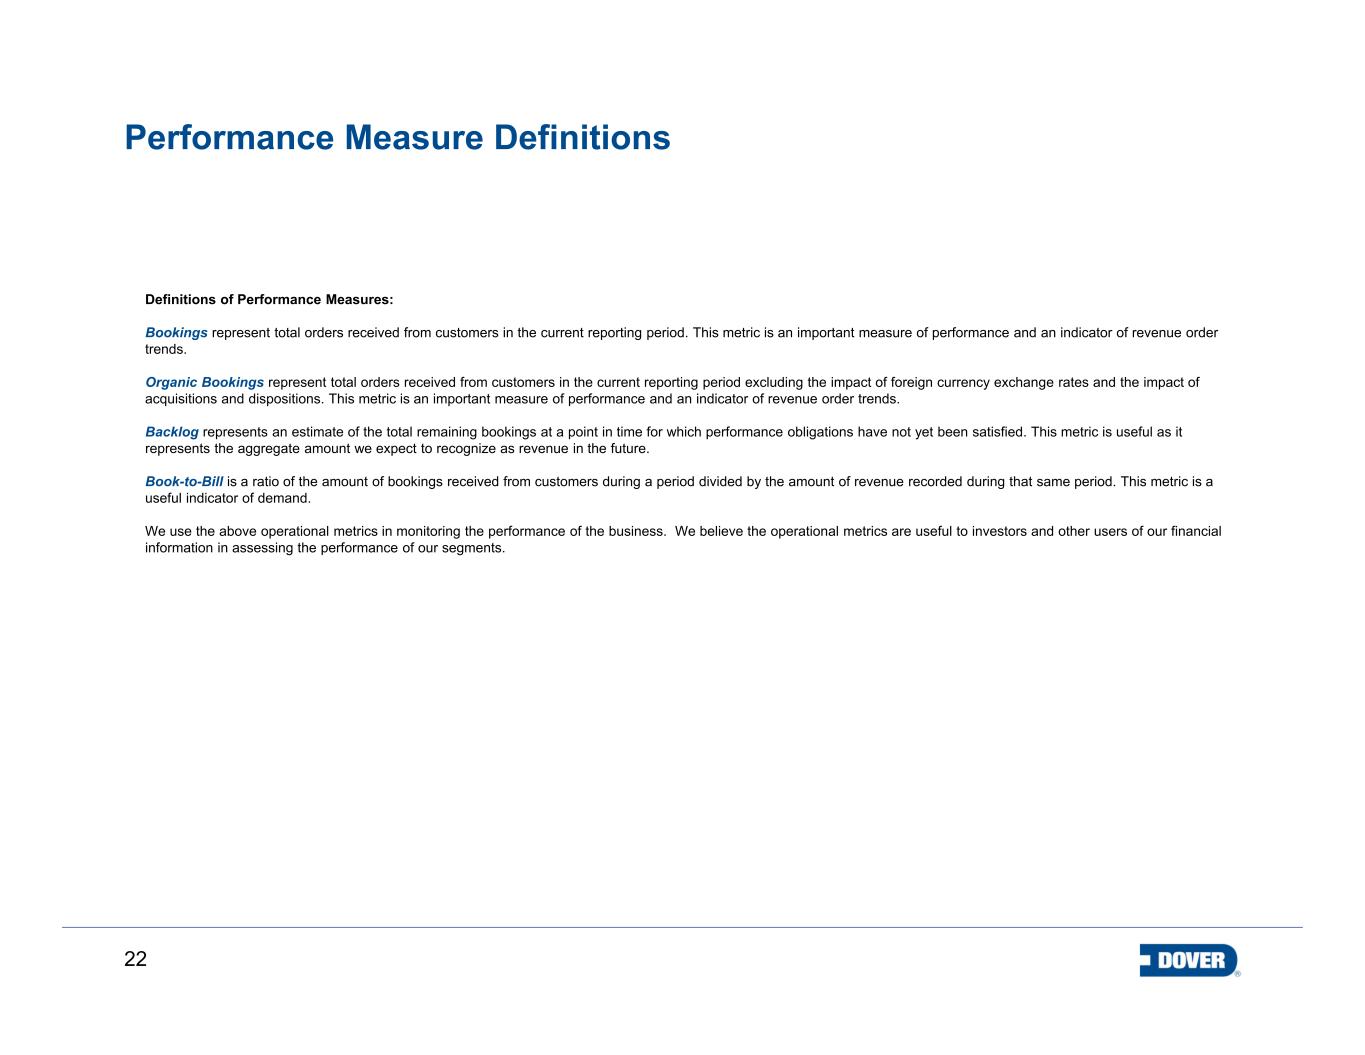
22 Performance Measure Definitions Definitions of Performance Measures: Bookings represent total orders received from customers in the current reporting period. This metric is an important measure of performance and an indicator of revenue order trends. Organic Bookings represent total orders received from customers in the current reporting period excluding the impact of foreign currency exchange rates and the impact of acquisitions and dispositions. This metric is an important measure of performance and an indicator of revenue order trends. Backlog represents an estimate of the total remaining bookings at a point in time for which performance obligations have not yet been satisfied. This metric is useful as it represents the aggregate amount we expect to recognize as revenue in the future. Book-to-Bill is a ratio of the amount of bookings received from customers during a period divided by the amount of revenue recorded during that same period. This metric is a useful indicator of demand. We use the above operational metrics in monitoring the performance of the business. We believe the operational metrics are useful to investors and other users of our financial information in assessing the performance of our segments.


