
Earnings Conference Call Second Quarter 2022 July 21, 2022 – 8:00am CT Exhibit 99.2
2 Forward-Looking Statements and Non-GAAP Measures We want to remind everyone that our comments may contain forward-looking statements that are inherently subject to uncertainties and risks, including the impacts of coronavirus (COVID-19) on the global economy and on our customers, suppliers, employees, operations, business, liquidity and cash flow, supply chain constraints and labor shortages that could result in production stoppages, and inflation in material input costs and freight logistics. We caution everyone to be guided in their analysis of Dover Corporation by referring to the documents we file from time to time with the SEC, including our Annual Report on Form 10-K, and our Quarterly Reports on Form 10-Q and Current Reports on Form 8-K, for a list of factors that could cause our results to differ from those anticipated in any such forward-looking statements. We would also direct your attention to our website, dovercorporation.com, where considerably more information can be found. In addition to financial measures based on U.S. GAAP, Dover provides supplemental non-GAAP financial information. Management uses non-GAAP measures in addition to GAAP measures to understand and compare operating results across periods, make resource allocation decisions, and for forecasting and other purposes. Management believes these non-GAAP measures reflect results in a manner that enables, in many instances, more meaningful analysis of trends and facilitates comparison of results across periods and to those of peer companies. These non-GAAP financial measures have no standardized meaning presented in U.S. GAAP and may not be comparable to other similarly titled measures used by other companies due to potential differences between the companies in calculations. The use of these non-GAAP measures has limitations and they should not be considered as substitutes for measures of financial performance and financial position as prepared in accordance with U.S. GAAP. Reconciliations and definitions are included either in this presentation or in Dover’s earnings release and investor supplement for the second quarter, which are available on Dover’s website. We do not provide a reconciliation of forward-looking organic revenue to the most directly comparable GAAP financial measure because we are not able to provide a meaningful or accurate compilation of reconciling items. This is due to the inherent difficulty in accurately forecasting the timing and amounts of the items that would be excluded from the most directly comparable GAAP financial measure or are out of our control. For the same reasons, we are unable to address the probable significance of unavailable information which may be material.
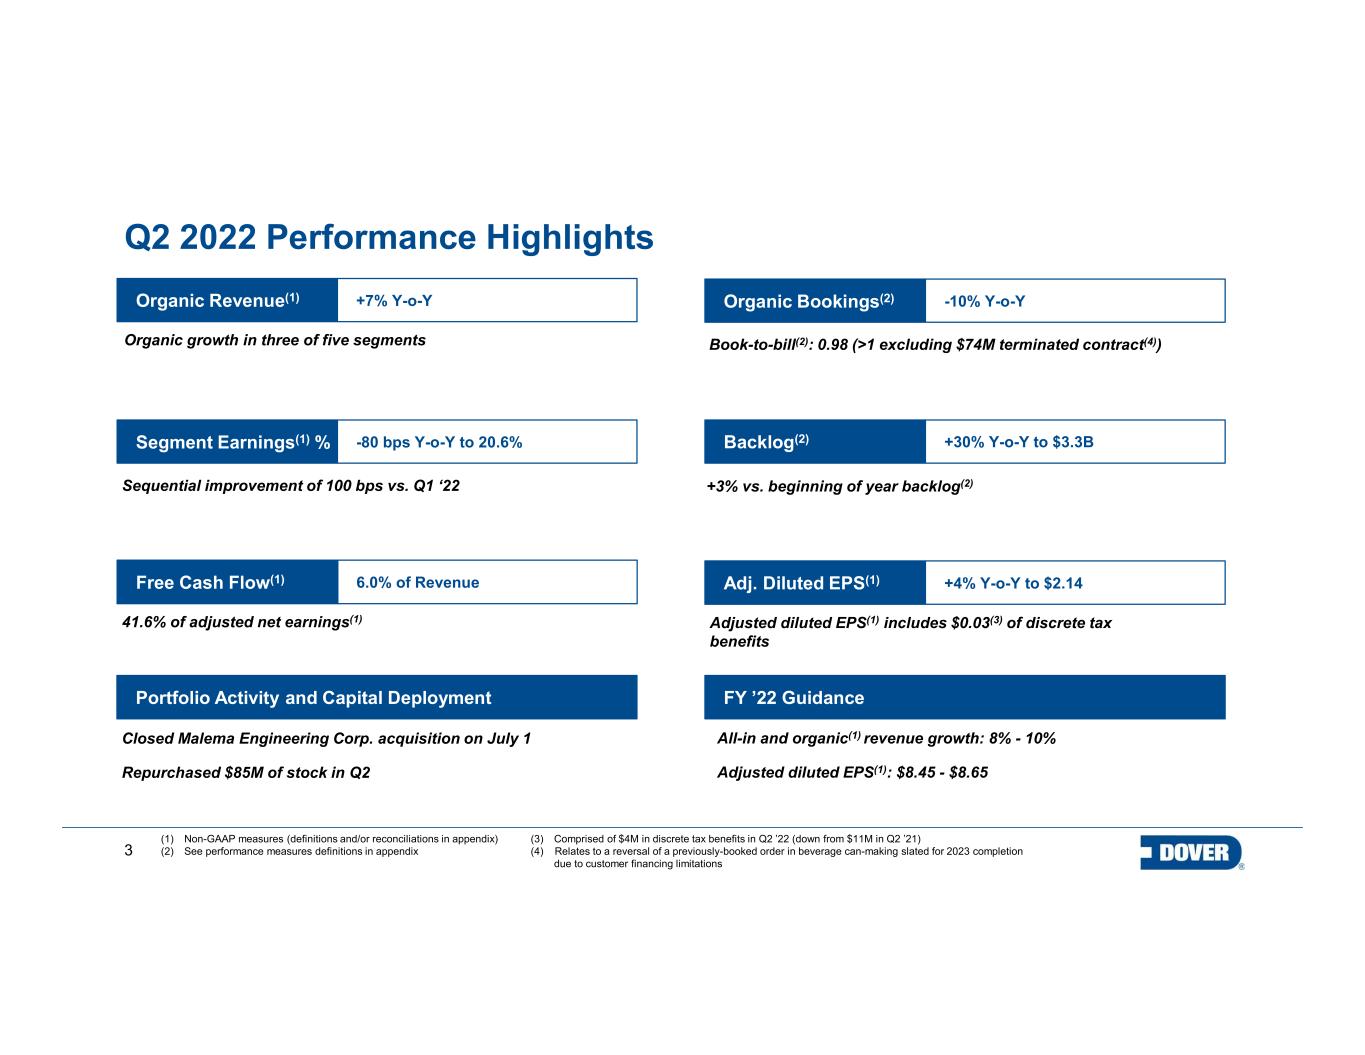
3 Free Cash Flow(1) Sequential improvement of 100 bps vs. Q1 ‘22 41.6% of adjusted net earnings(1) All-in and organic(1) revenue growth: 8% - 10% Adjusted diluted EPS(1): $8.45 - $8.65 Organic Revenue(1) Book-to-bill(2): 0.98 (>1 excluding $74M terminated contract(4))Organic growth in three of five segments Adj. Diluted EPS(1) Adjusted diluted EPS(1) includes $0.03(3) of discrete tax benefits +7% Y-o-Y Organic Bookings(2) -10% Y-o-Y Segment Earnings(1) % -80 bps Y-o-Y to 20.6% 6.0% of Revenue +4% Y-o-Y to $2.14 Backlog(2) +30% Y-o-Y to $3.3B FY ’22 GuidancePortfolio Activity and Capital Deployment Closed Malema Engineering Corp. acquisition on July 1 Repurchased $85M of stock in Q2 +3% vs. beginning of year backlog(2) (1) Non-GAAP measures (definitions and/or reconciliations in appendix) (2) See performance measures definitions in appendix (3) Comprised of $4M in discrete tax benefits in Q2 ’22 (down from $11M in Q2 ’21) (4) Relates to a reversal of a previously-booked order in beverage can-making slated for 2023 completion due to customer financing limitations Q2 2022 Performance Highlights
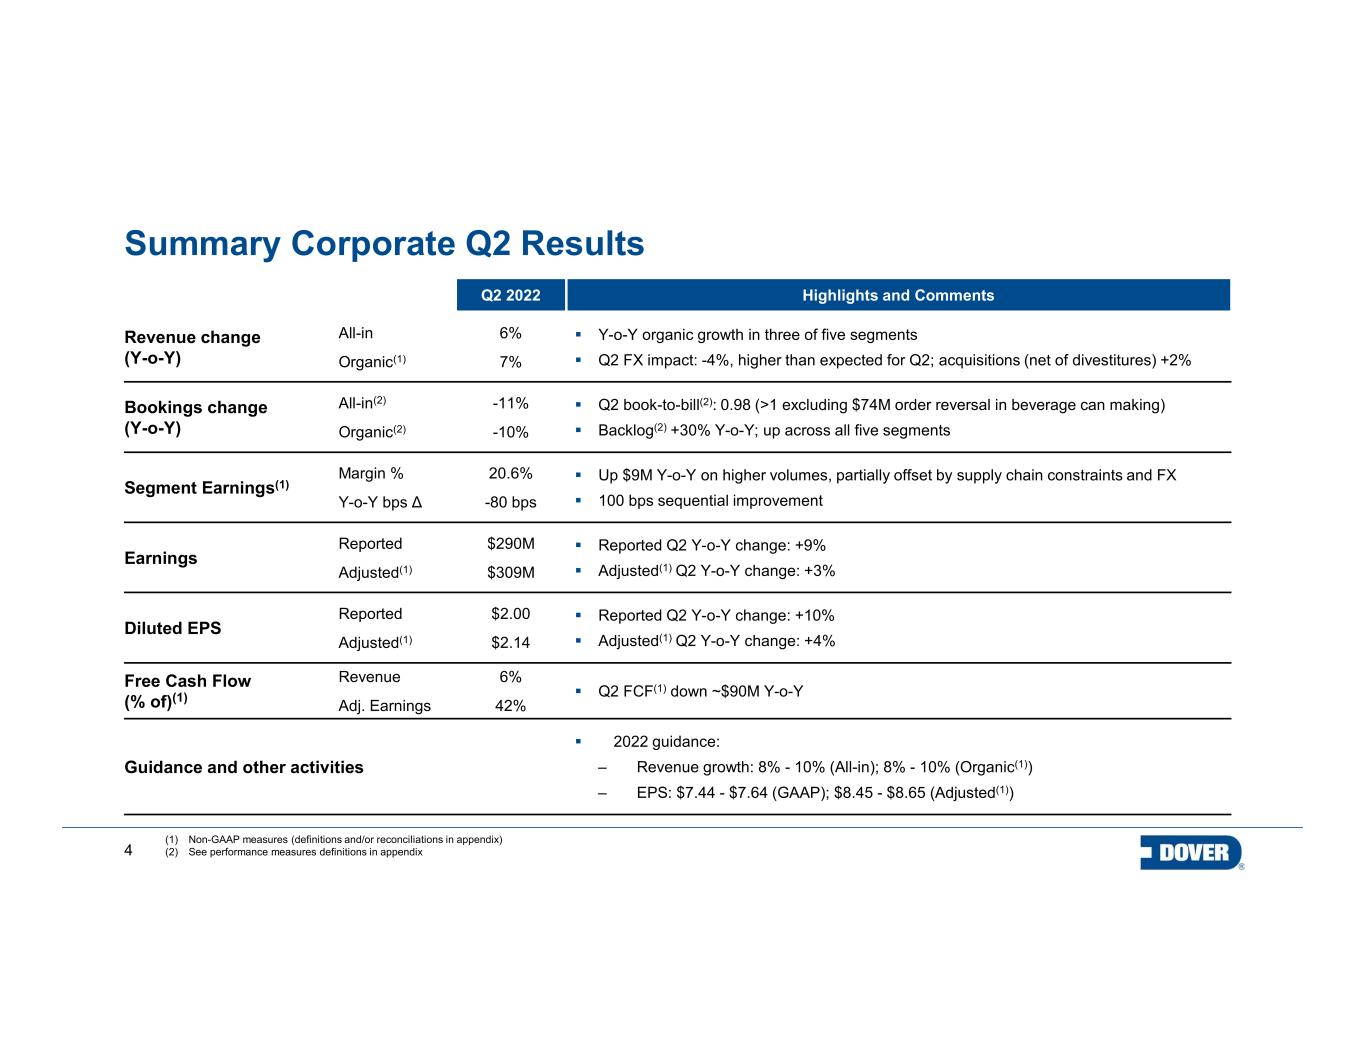
4 Summary Corporate Q2 Results Q2 2022 Highlights and Comments Revenue change (Y-o-Y) All-in Organic(1) 6% 7% Y-o-Y organic growth in three of five segments Q2 FX impact: -4%, higher than expected for Q2; acquisitions (net of divestitures) +2% Bookings change (Y-o-Y) All-in(2) Organic(2) -11% -10% Q2 book-to-bill(2): 0.98 (>1 excluding $74M order reversal in beverage can making) Backlog(2) +30% Y-o-Y; up across all five segments Segment Earnings(1) Margin % Y-o-Y bps Δ 20.6% -80 bps Up $9M Y-o-Y on higher volumes, partially offset by supply chain constraints and FX 100 bps sequential improvement Earnings Reported Adjusted(1) $290M $309M Reported Q2 Y-o-Y change: +9% Adjusted(1) Q2 Y-o-Y change: +3% Diluted EPS Reported Adjusted(1) $2.00 $2.14 Reported Q2 Y-o-Y change: +10% Adjusted(1) Q2 Y-o-Y change: +4% Free Cash Flow (% of)(1) Revenue Adj. Earnings 6% 42% Q2 FCF(1) down ~$90M Y-o-Y Guidance and other activities 2022 guidance: ‒ Revenue growth: 8% - 10% (All-in); 8% - 10% (Organic(1)) ‒ EPS: $7.44 - $7.64 (GAAP); $8.45 - $8.65 (Adjusted(1)) (1) Non-GAAP measures (definitions and/or reconciliations in appendix) (2) See performance measures definitions in appendix
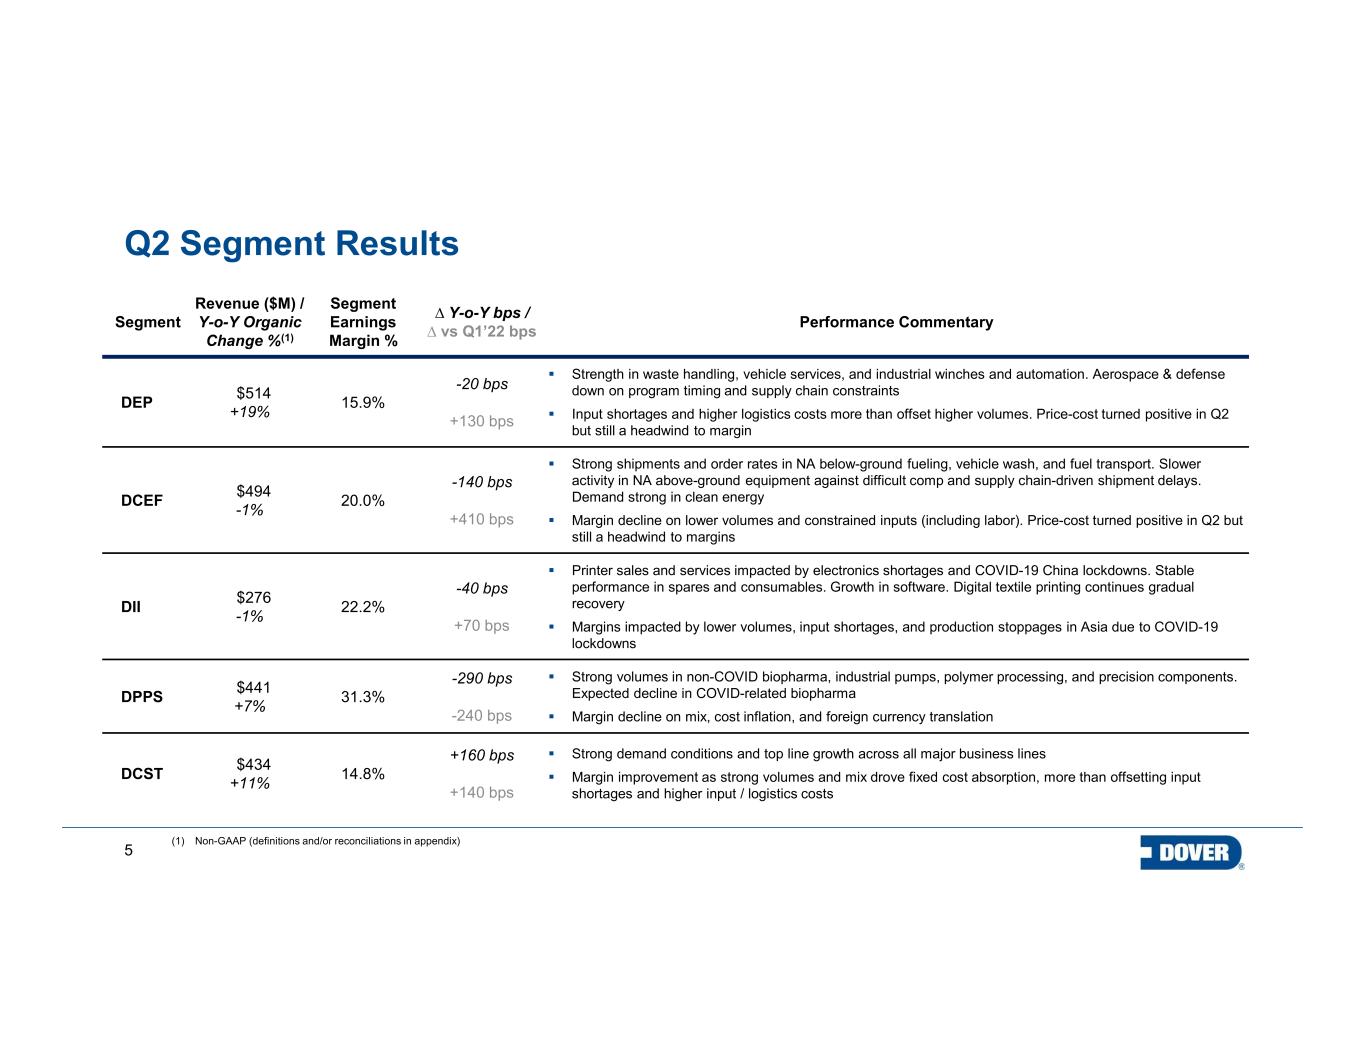
5 Segment Revenue ($M) / Y-o-Y Organic Change %(1) Segment Earnings Margin % ∆ Y-o-Y bps / ∆ vs Q1’22 bps Performance Commentary DEP $514 +19% 15.9% -20 bps +130 bps Strength in waste handling, vehicle services, and industrial winches and automation. Aerospace & defense down on program timing and supply chain constraints Input shortages and higher logistics costs more than offset higher volumes. Price-cost turned positive in Q2 but still a headwind to margin DCEF $494 -1% 20.0% -140 bps +410 bps Strong shipments and order rates in NA below-ground fueling, vehicle wash, and fuel transport. Slower activity in NA above-ground equipment against difficult comp and supply chain-driven shipment delays. Demand strong in clean energy Margin decline on lower volumes and constrained inputs (including labor). Price-cost turned positive in Q2 but still a headwind to margins DII $276 -1% 22.2% -40 bps +70 bps Printer sales and services impacted by electronics shortages and COVID-19 China lockdowns. Stable performance in spares and consumables. Growth in software. Digital textile printing continues gradual recovery Margins impacted by lower volumes, input shortages, and production stoppages in Asia due to COVID-19 lockdowns DPPS $441 +7% 31.3% -290 bps -240 bps Strong volumes in non-COVID biopharma, industrial pumps, polymer processing, and precision components. Expected decline in COVID-related biopharma Margin decline on mix, cost inflation, and foreign currency translation DCST $434 +11% 14.8% +160 bps +140 bps Strong demand conditions and top line growth across all major business lines Margin improvement as strong volumes and mix drove fixed cost absorption, more than offsetting input shortages and higher input / logistics costs (1) Non-GAAP (definitions and/or reconciliations in appendix) Q2 Segment Results
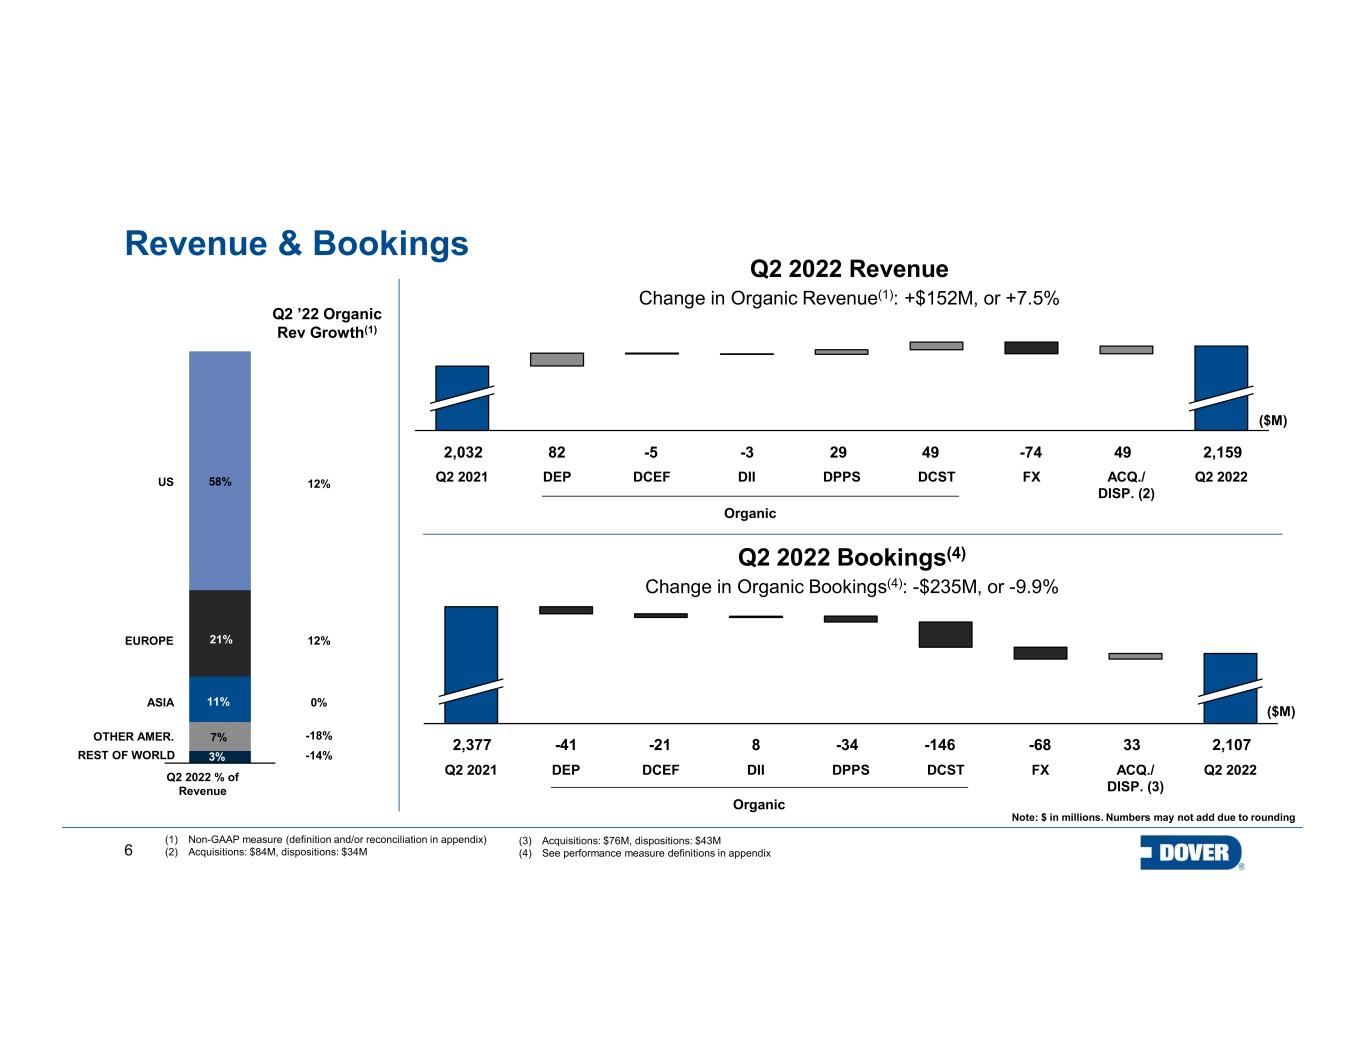
6 Revenue & Bookings (1) Non-GAAP measure (definition and/or reconciliation in appendix) (2) Acquisitions: $84M, dispositions: $34M Q2 2022 % of Revenue 7% 21% 3% 58% 11%ASIA REST OF WORLD EUROPE OTHER AMER. US -14% 0% 12% -18% 12% Q2 ’22 Organic Rev Growth(1) (3) Acquisitions: $76M, dispositions: $43M (4) See performance measure definitions in appendix Q2 2022 Revenue Change in Organic Revenue(1): +$152M, or +7.5% Note: $ in millions. Numbers may not add due to rounding Q2 2022 Bookings(4) Change in Organic Bookings(4): -$235M, or -9.9% DEPQ2 2021 DCEF DII DPPS DCST FX ACQ./ DISP. (2) Q2 2022 ($M) -5 -74 2,1594982 29-3 492,032 Organic DEPQ2 2021 DCEF DII DPPS DCST FX ACQ./ DISP. (3) Q2 2022 ($M) -21 -68 2,107-146-41 -348 332,377 Organic
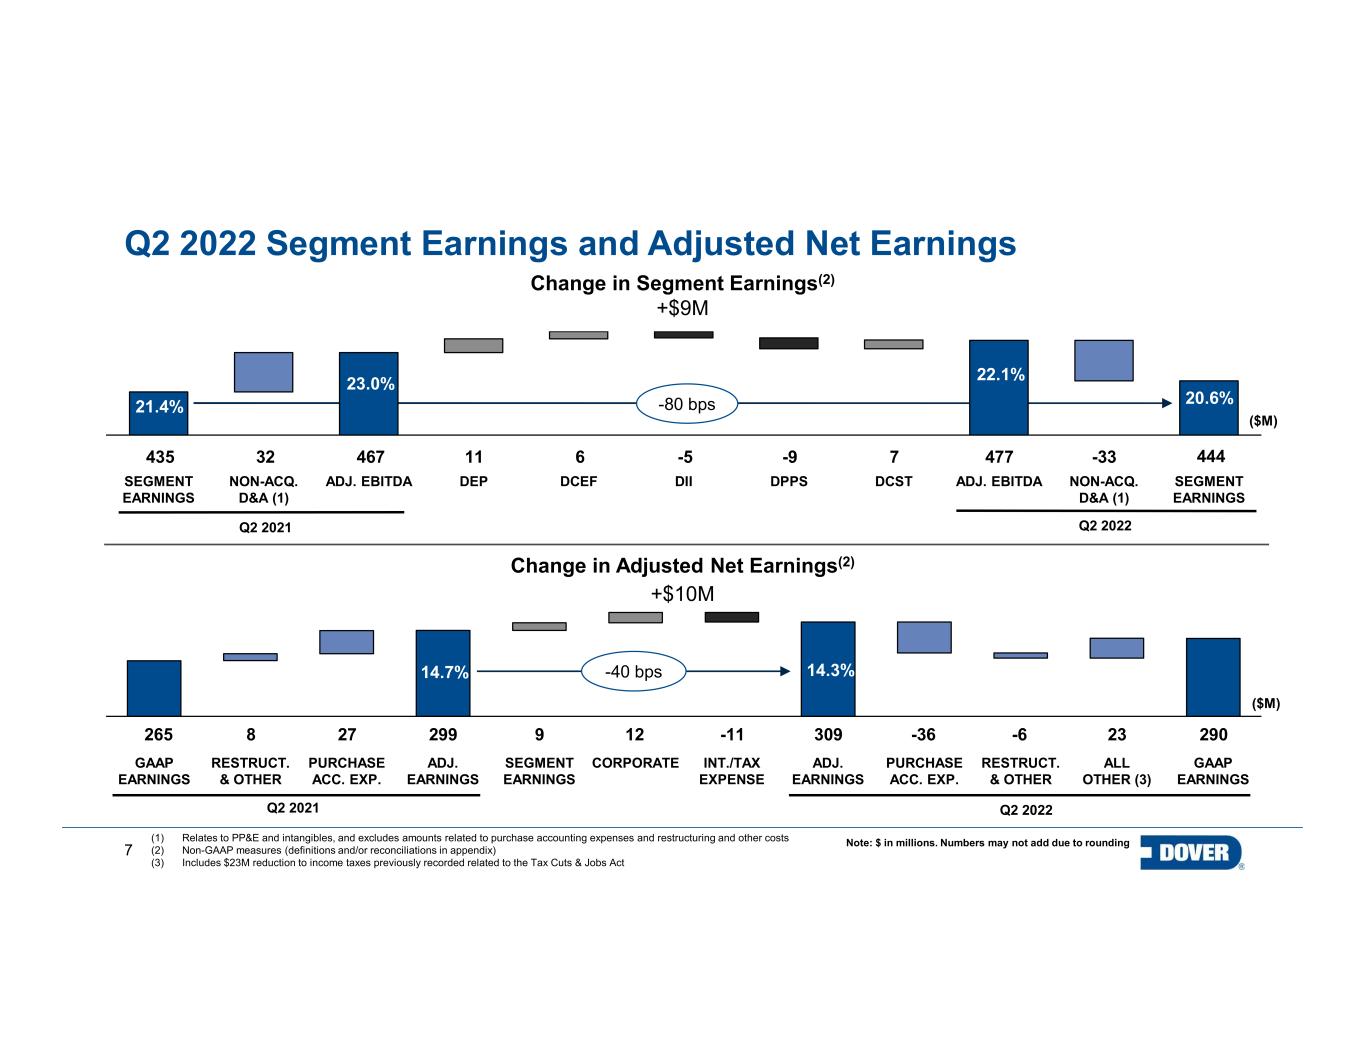
7 -80 bps SEGMENT EARNINGS ADJ. EBITDANON-ACQ. D&A (1) DEP DII DPPSDCEF DCST ADJ. EBITDA NON-ACQ. D&A (1) SEGMENT EARNINGS (1) Relates to PP&E and intangibles, and excludes amounts related to purchase accounting expenses and restructuring and other costs (2) Non-GAAP measures (definitions and/or reconciliations in appendix) (3) Includes $23M reduction to income taxes previously recorded related to the Tax Cuts & Jobs Act Q2 2022 Segment Earnings and Adjusted Net Earnings GAAP EARNINGS ADJ. EARNINGS CORPORATESEGMENT EARNINGS RESTRUCT. & OTHER PURCHASE ACC. EXP. ADJ. EARNINGS RESTRUCT. & OTHER INT./TAX EXPENSE PURCHASE ACC. EXP. ALL OTHER (3) GAAP EARNINGS Change in Adjusted Net Earnings(2) +$10M 265 8 27 299 9 12 -11 309 -36 -6 Q2 2021 Q2 2022 ($M) Note: $ in millions. Numbers may not add due to rounding 29023 23.0% 20.6% Change in Segment Earnings(2) +$9M Q2 2022 435 467 -511 444 ($M) -9 21.4% Q2 2021 -336 7 22.1% 47732 -40 bps14.7% 14.3%
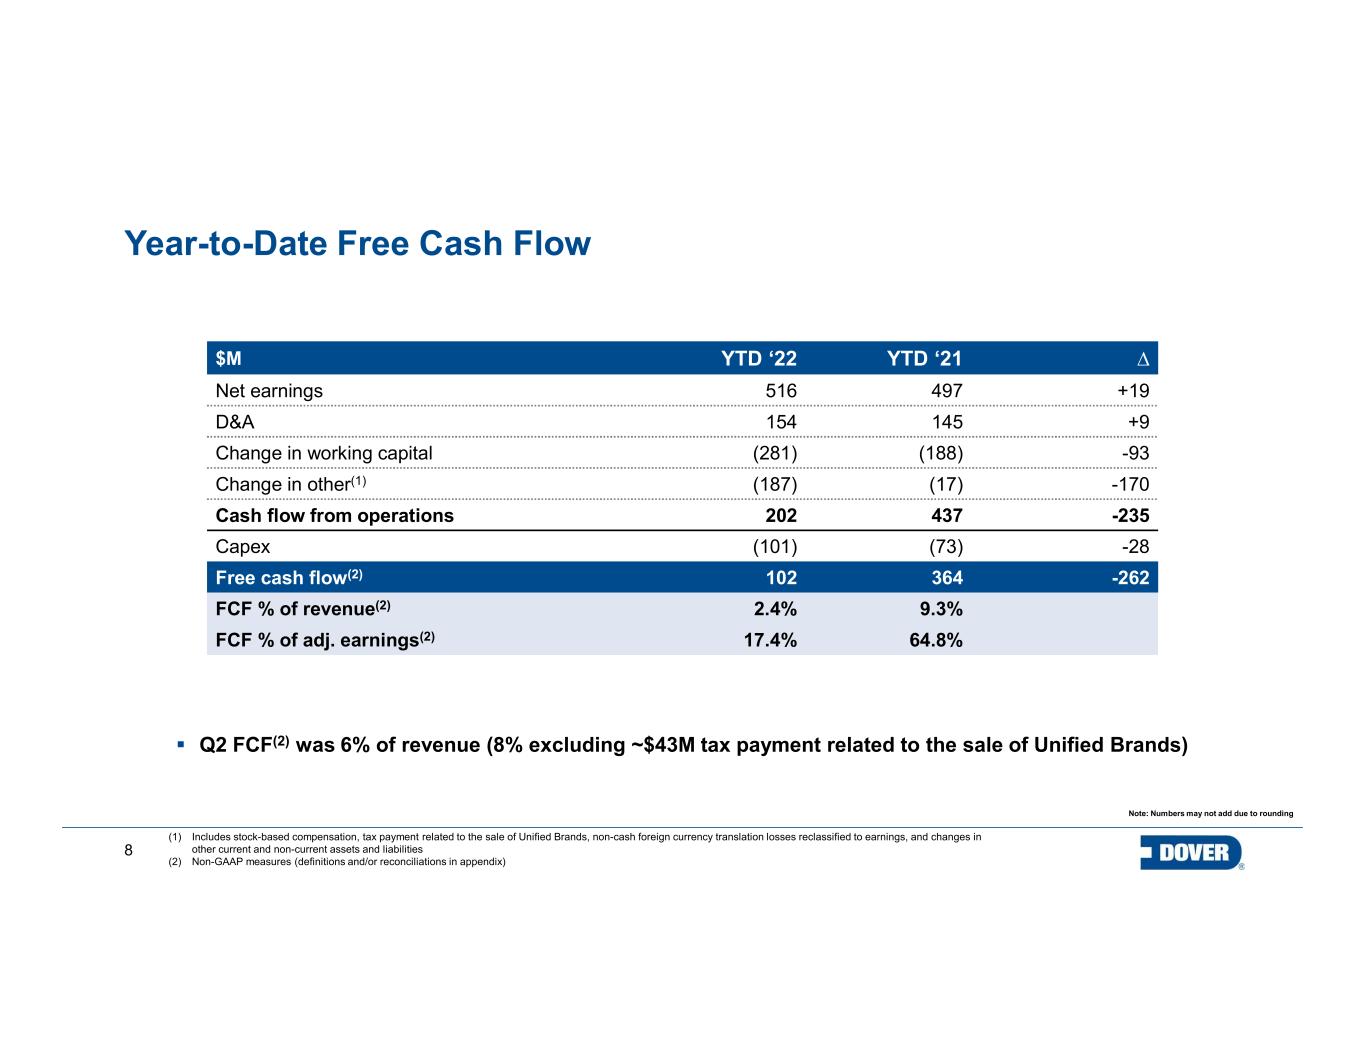
8 12.3% (1) Includes stock-based compensation, tax payment related to the sale of Unified Brands, non-cash foreign currency translation losses reclassified to earnings, and changes in other current and non-current assets and liabilities (2) Non-GAAP measures (definitions and/or reconciliations in appendix) Note: Numbers may not add due to rounding $M YTD ‘22 YTD ‘21 ∆ Net earnings 516 497 +19 D&A 154 145 +9 Change in working capital (281) (188) -93 Change in other(1) (187) (17) -170 Cash flow from operations 202 437 -235 Capex (101) (73) -28 Free cash flow(2) 102 364 -262 FCF % of revenue(2) 2.4% 9.3% FCF % of adj. earnings(2) 17.4% 64.8% Year-to-Date Free Cash Flow Q2 FCF(2) was 6% of revenue (8% excluding ~$43M tax payment related to the sale of Unified Brands)
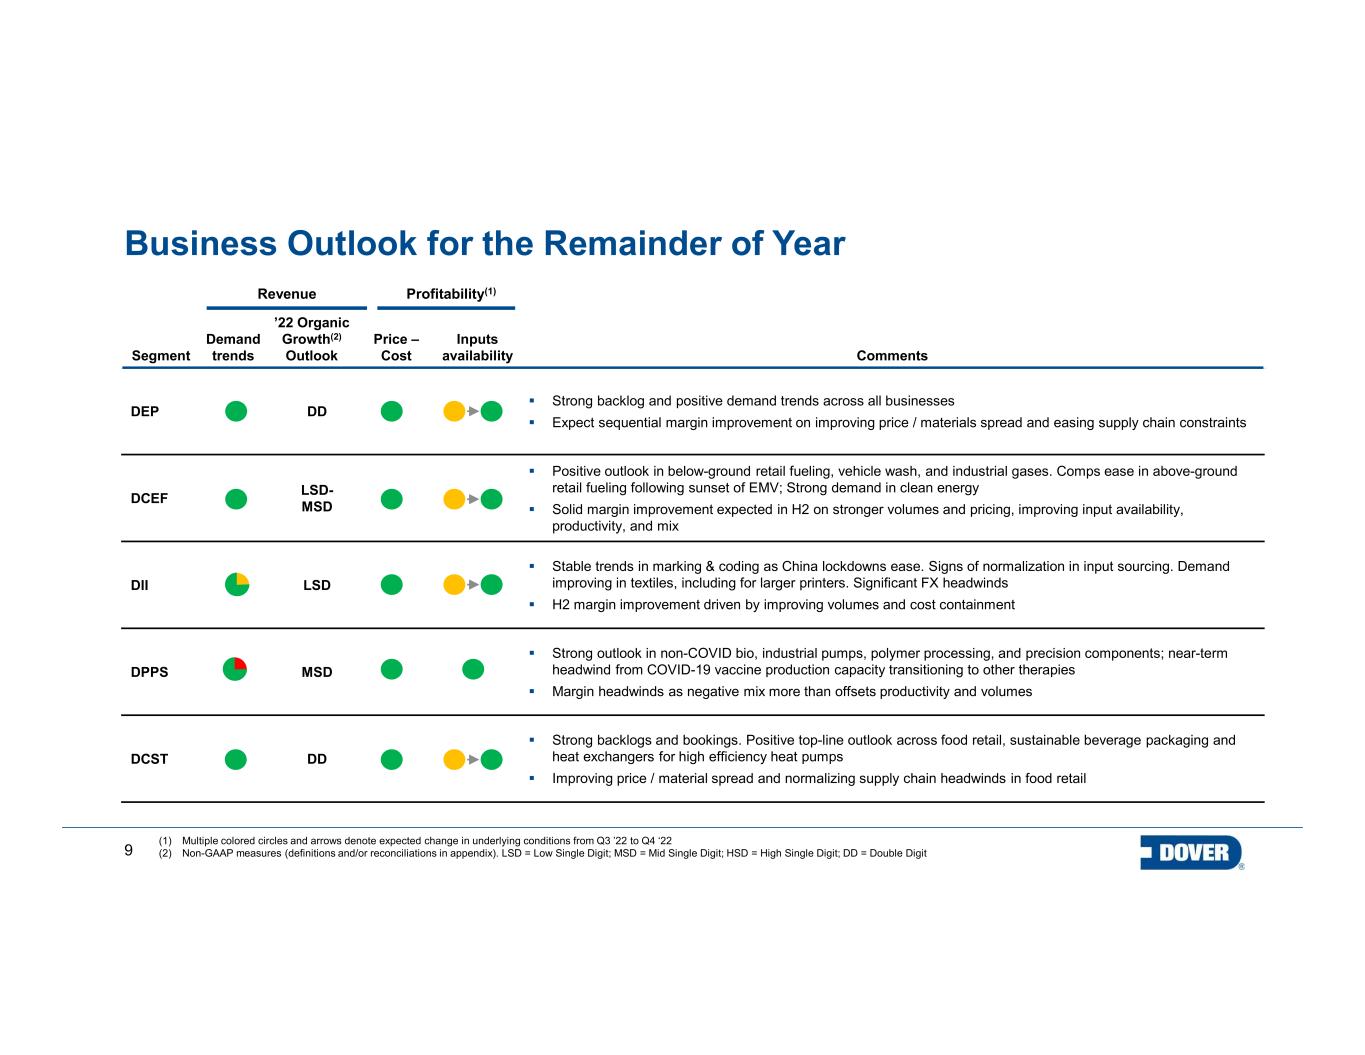
9 Segment Demand trends ’22 Organic Growth(2) Outlook Price – Cost Inputs availability Comments DEP DD Strong backlog and positive demand trends across all businesses Expect sequential margin improvement on improving price / materials spread and easing supply chain constraints DCEF LSD- MSD Positive outlook in below-ground retail fueling, vehicle wash, and industrial gases. Comps ease in above-ground retail fueling following sunset of EMV; Strong demand in clean energy Solid margin improvement expected in H2 on stronger volumes and pricing, improving input availability, productivity, and mix DII LSD Stable trends in marking & coding as China lockdowns ease. Signs of normalization in input sourcing. Demand improving in textiles, including for larger printers. Significant FX headwinds H2 margin improvement driven by improving volumes and cost containment DPPS MSD Strong outlook in non-COVID bio, industrial pumps, polymer processing, and precision components; near-term headwind from COVID-19 vaccine production capacity transitioning to other therapies Margin headwinds as negative mix more than offsets productivity and volumes DCST DD Strong backlogs and bookings. Positive top-line outlook across food retail, sustainable beverage packaging and heat exchangers for high efficiency heat pumps Improving price / material spread and normalizing supply chain headwinds in food retail (1) Multiple colored circles and arrows denote expected change in underlying conditions from Q3 ’22 to Q4 ‘22 (2) Non-GAAP measures (definitions and/or reconciliations in appendix). LSD = Low Single Digit; MSD = Mid Single Digit; HSD = High Single Digit; DD = Double Digit Revenue Profitability(1) Business Outlook for the Remainder of Year
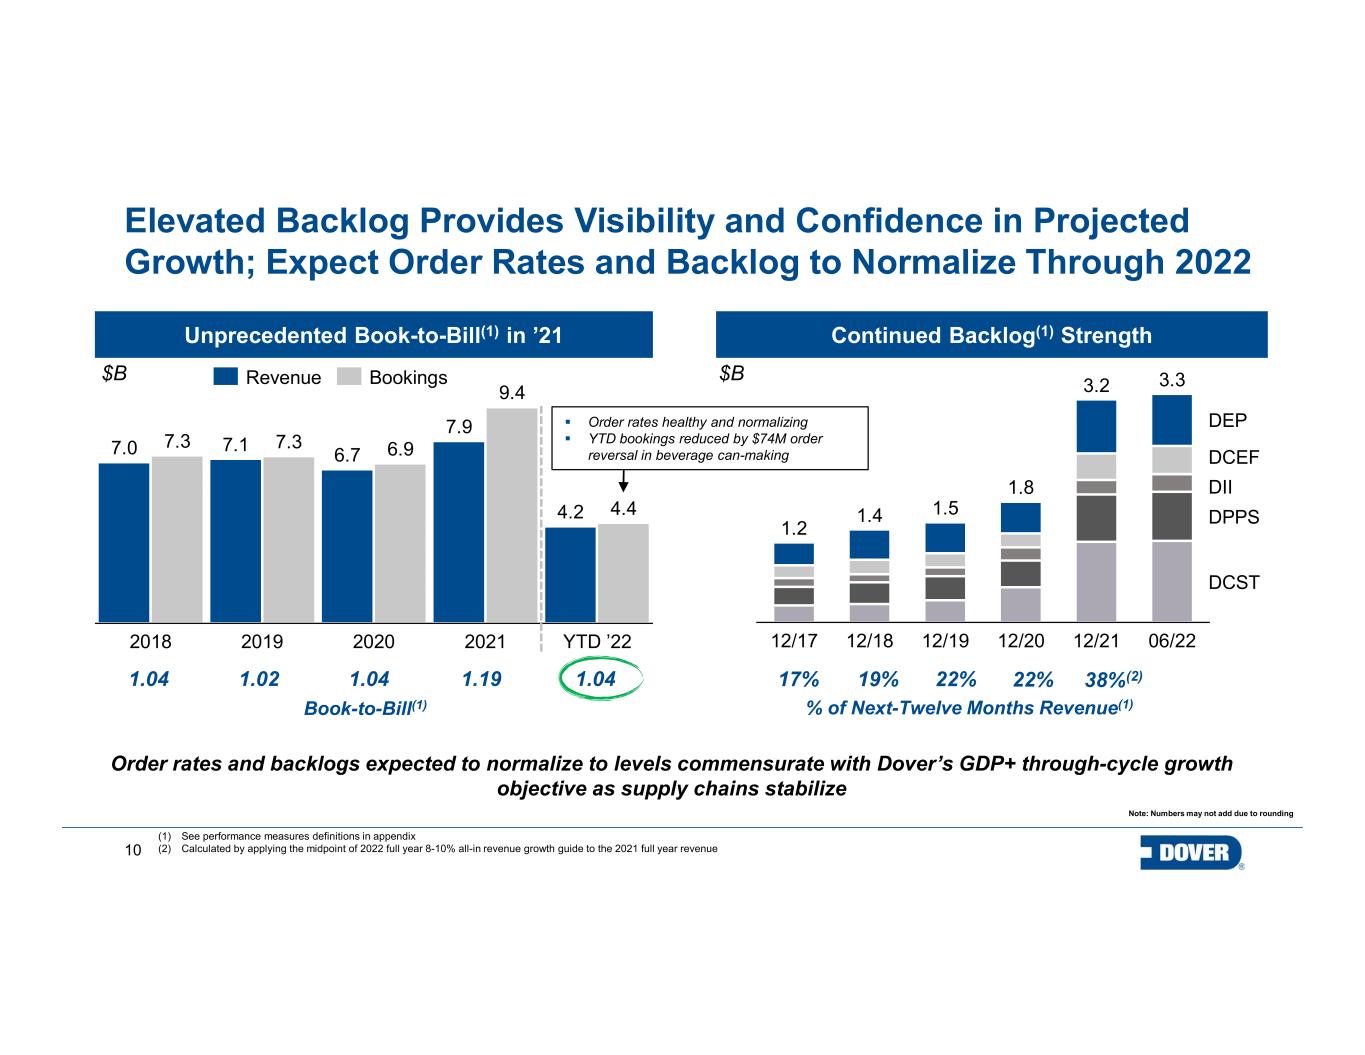
10 7.0 7.1 6.7 7.9 4.2 7.3 7.3 6.9 9.4 4.4 2018 2019 2020 2021 YTD ’22 (1) See performance measures definitions in appendix (2) Calculated by applying the midpoint of 2022 full year 8-10% all-in revenue growth guide to the 2021 full year revenue Unprecedented Book-to-Bill(1) in ’21 Revenue Bookings Continued Backlog(1) Strength $B 12/17 DEP 06/2212/1912/18 12/20 DCEF 12/21 DII DPPS DCST 1.2 1.4 1.5 1.8 3.2 3.3 1.04 1.02 1.04 1.19 Book-to-Bill(1) % of Next-Twelve Months Revenue(1) 17% 19% 22% 22% 38%(2)1.04 $B Order rates and backlogs expected to normalize to levels commensurate with Dover’s GDP+ through-cycle growth objective as supply chains stabilize Elevated Backlog Provides Visibility and Confidence in Projected Growth; Expect Order Rates and Backlog to Normalize Through 2022 Order rates healthy and normalizing YTD bookings reduced by $74M order reversal in beverage can-making Note: Numbers may not add due to rounding
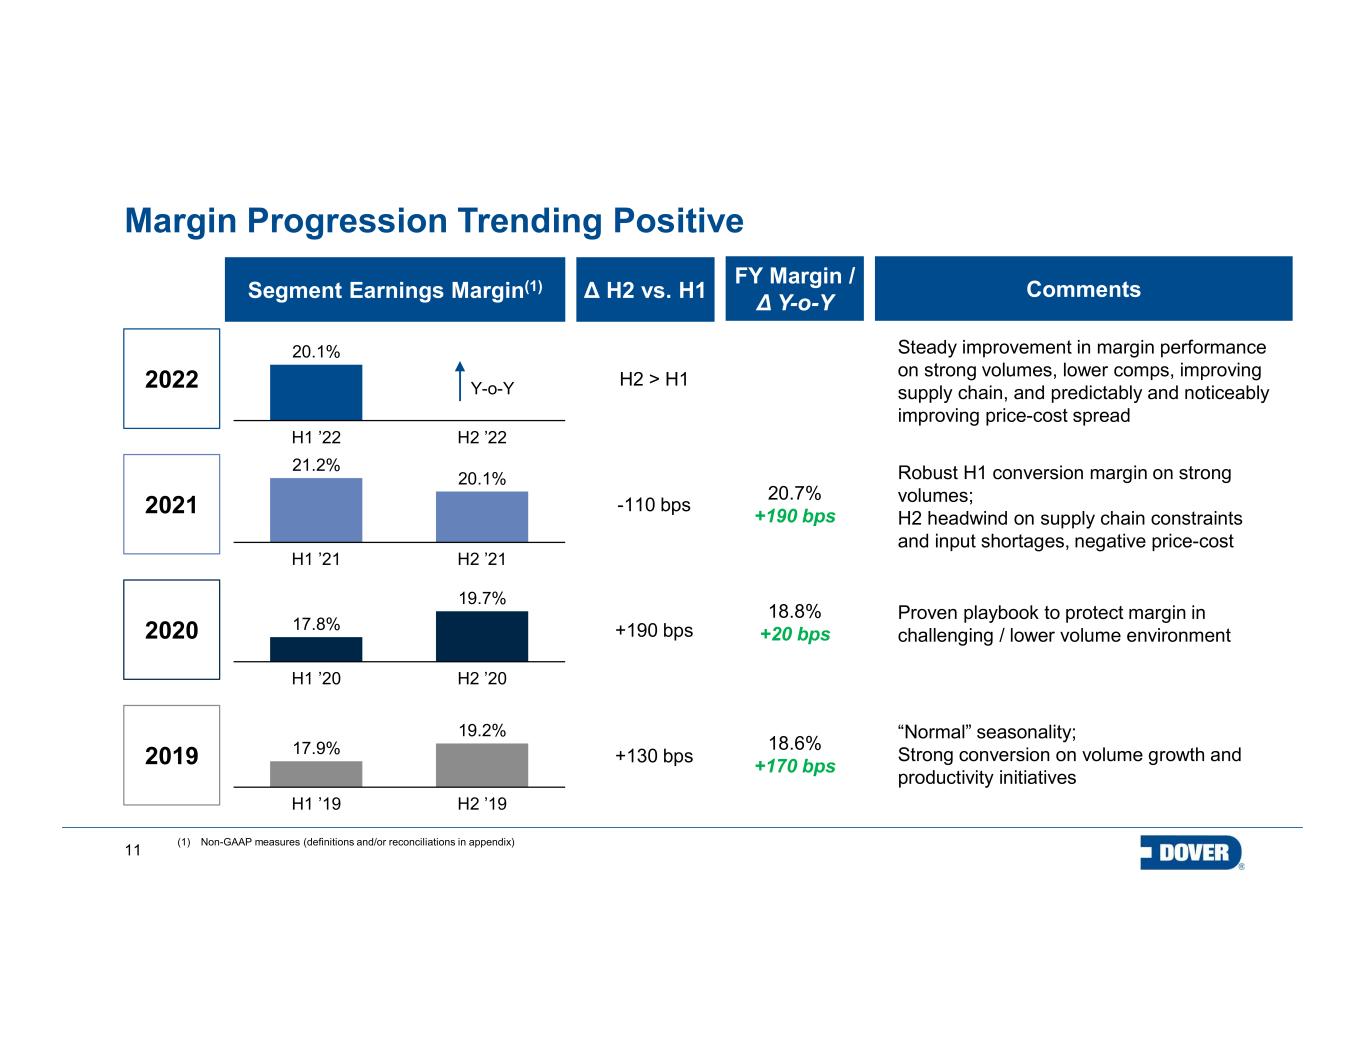
11 Margin Progression Trending Positive 19.2% H1 ’19 H2 ’19 17.9% H2 ’20H1 ’20 17.8% 19.7% H1 ’21 H2 ’21 21.2% 20.1% H1 ’22 H2 ’22 20.1% 2019 2020 2021 “Normal” seasonality; Strong conversion on volume growth and productivity initiatives Proven playbook to protect margin in challenging / lower volume environment Robust H1 conversion margin on strong volumes; H2 headwind on supply chain constraints and input shortages, negative price-cost Segment Earnings Margin(1) Δ H2 vs. H1 Comments +130 bps +190 bps -110 bps 2022 Steady improvement in margin performance on strong volumes, lower comps, improving supply chain, and predictably and noticeably improving price-cost spread H2 > H1Y-o-Y (1) Non-GAAP measures (definitions and/or reconciliations in appendix) FY Margin / Δ Y-o-Y 20.7% +190 bps 18.8% +20 bps 18.6% +170 bps
12 Appendix
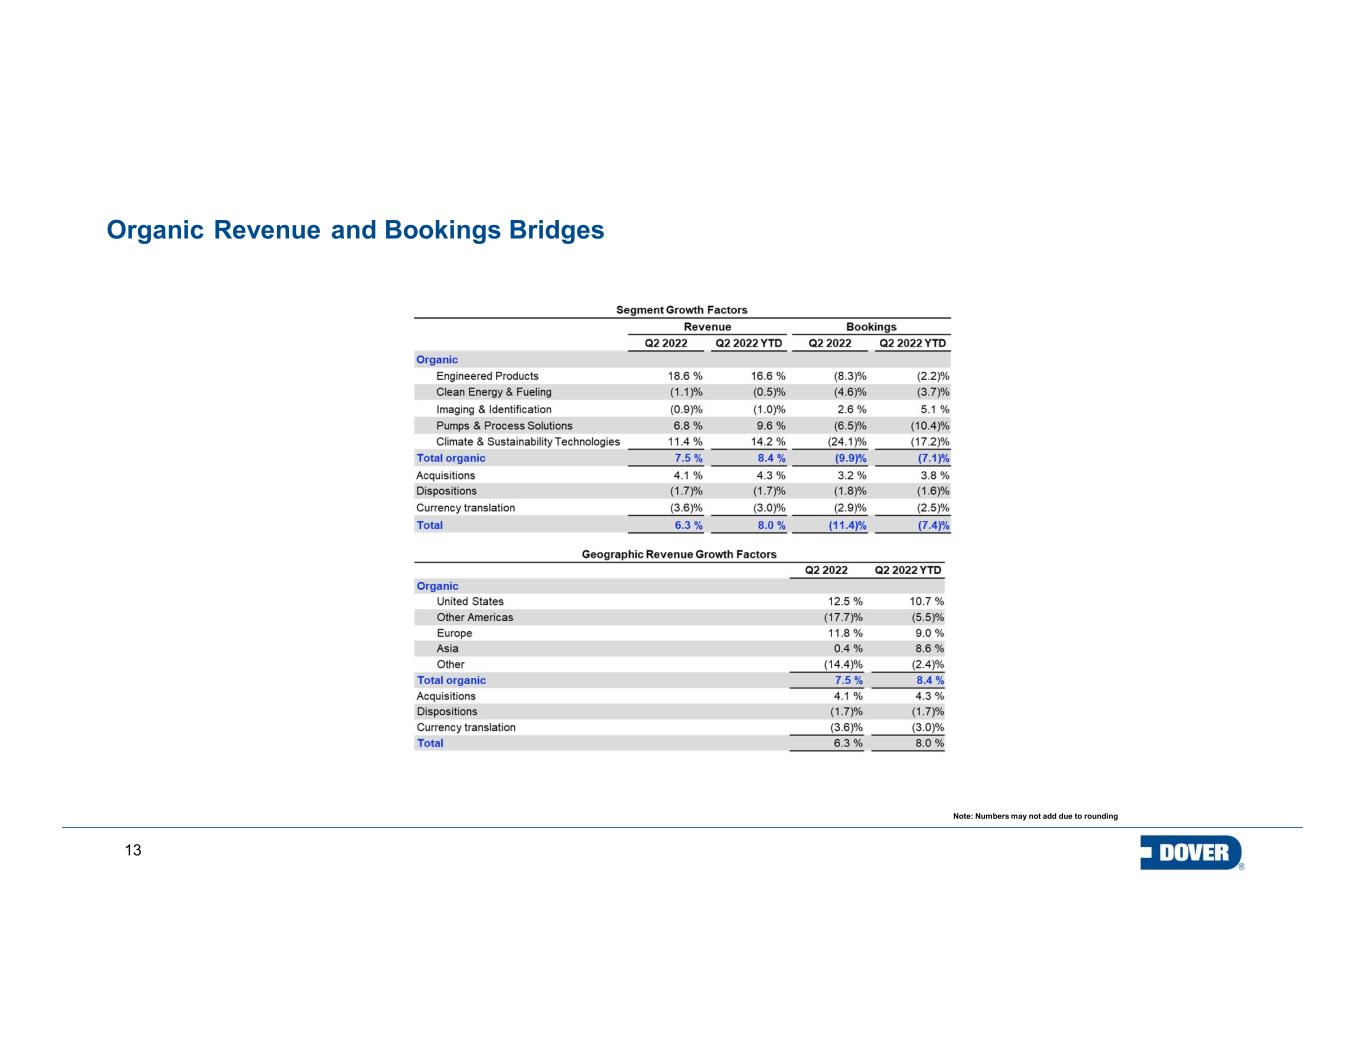
13 Note: Numbers may not add due to rounding Organic Revenue and Bookings Bridges
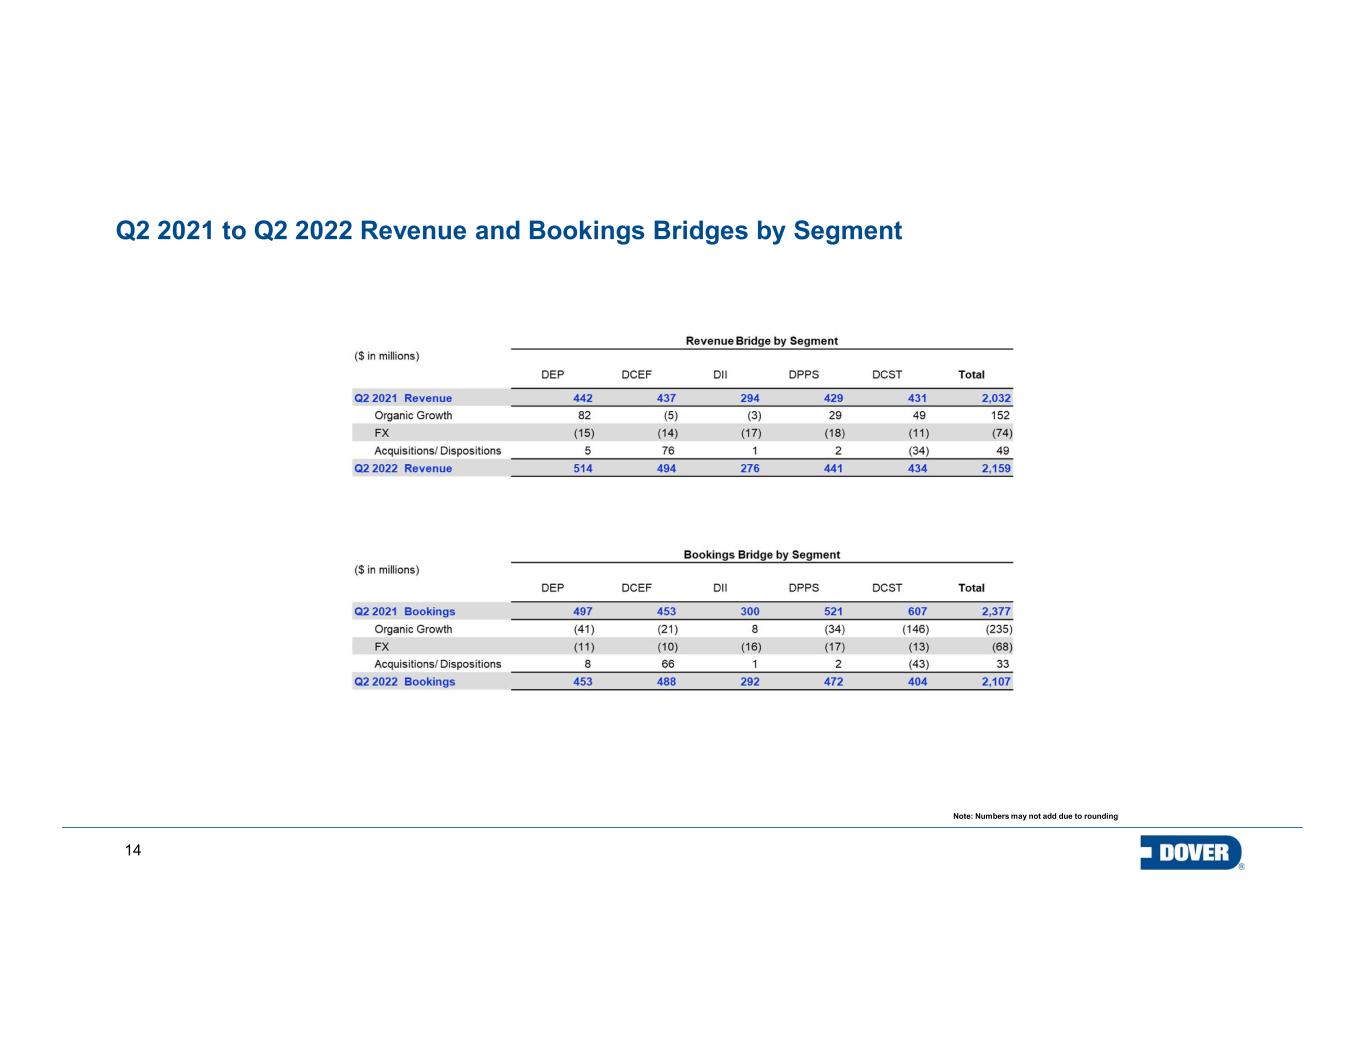
14 Note: Numbers may not add due to rounding Q2 2021 to Q2 2022 Revenue and Bookings Bridges by Segment
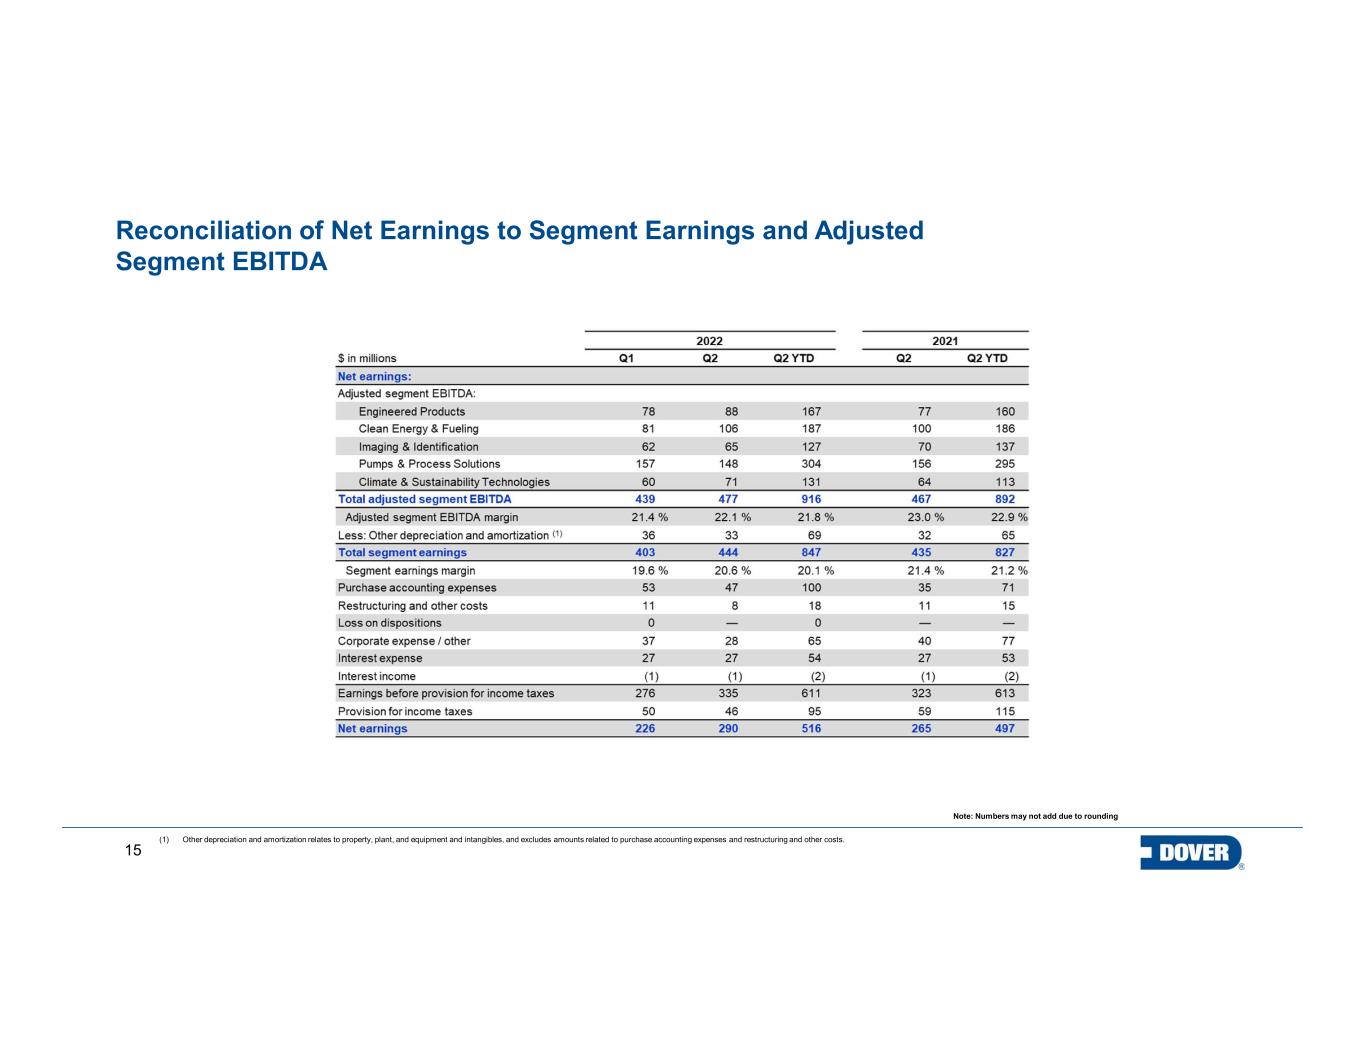
15 Note: Numbers may not add due to rounding Reconciliation of Net Earnings to Segment Earnings and Adjusted Segment EBITDA (1) Other depreciation and amortization relates to property, plant, and equipment and intangibles, and excludes amounts related to purchase accounting expenses and restructuring and other costs.
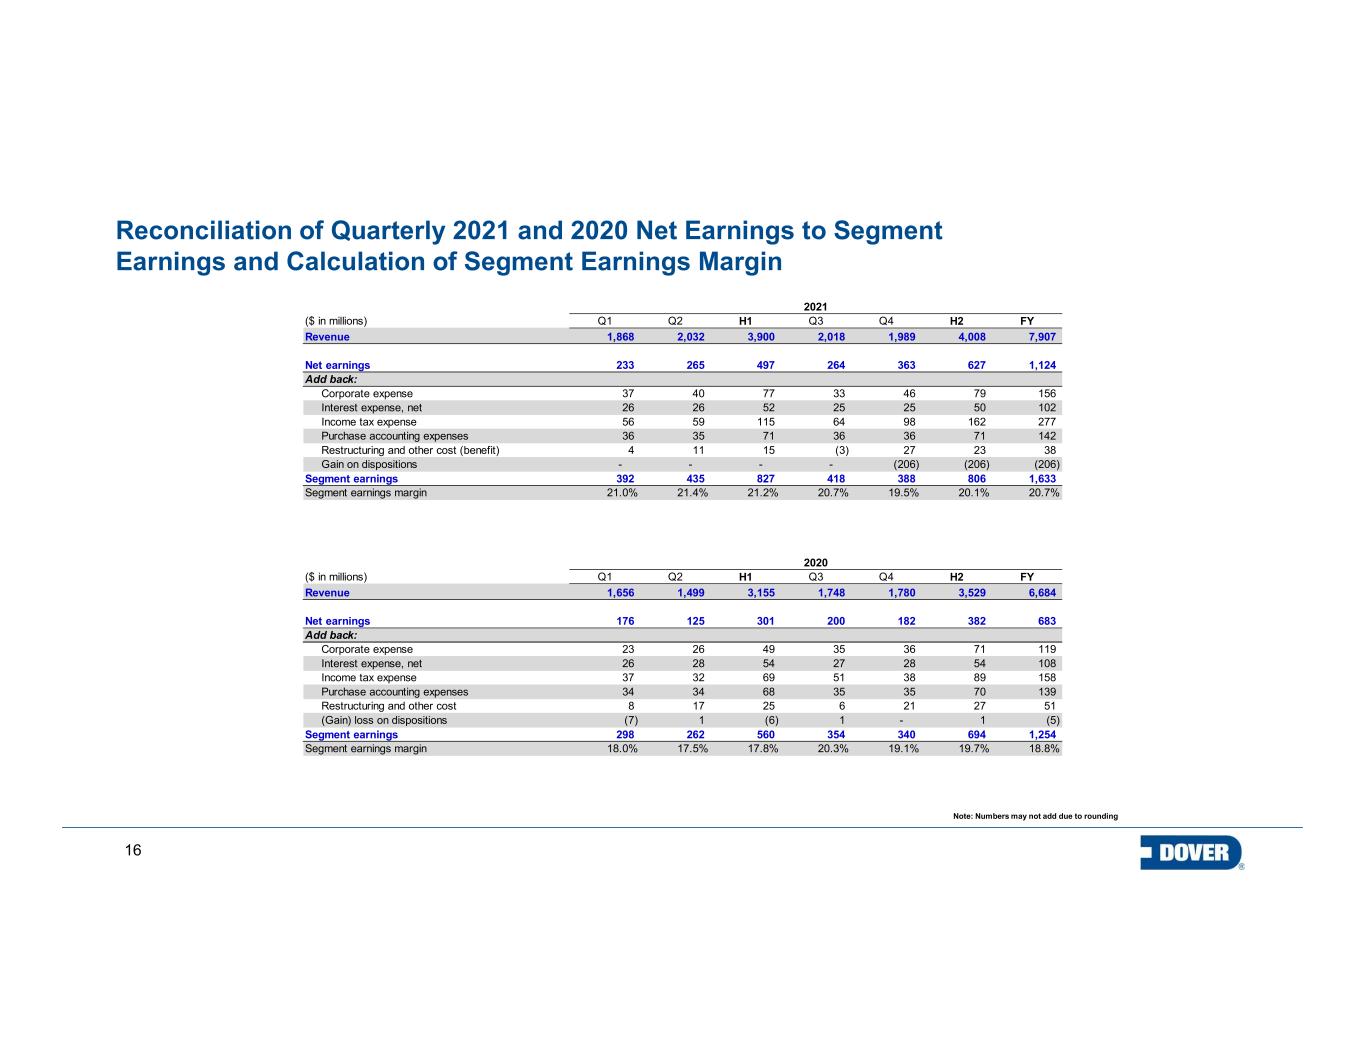
16 Note: Numbers may not add due to rounding Reconciliation of Quarterly 2021 and 2020 Net Earnings to Segment Earnings and Calculation of Segment Earnings Margin ($ in millions) Q1 Q2 H1 Q3 Q4 H2 FY Revenue 1,868 2,032 3,900 2,018 1,989 4,008 7,907 Net earnings 233 265 497 264 363 627 1,124 Add back: Corporate expense 37 40 77 33 46 79 156 Interest expense, net 26 26 52 25 25 50 102 Income tax expense 56 59 115 64 98 162 277 Purchase accounting expenses 36 35 71 36 36 71 142 Restructuring and other cost (benefit) 4 11 15 (3) 27 23 38 Gain on dispositions - - - - (206) (206) (206) Segment earnings 392 435 827 418 388 806 1,633 Segment earnings margin 21.0% 21.4% 21.2% 20.7% 19.5% 20.1% 20.7% ($ in millions) Q1 Q2 H1 Q3 Q4 H2 FY Revenue 1,656 1,499 3,155 1,748 1,780 3,529 6,684 Net earnings 176 125 301 200 182 382 683 Add back: Corporate expense 23 26 49 35 36 71 119 Interest expense, net 26 28 54 27 28 54 108 Income tax expense 37 32 69 51 38 89 158 Purchase accounting expenses 34 34 68 35 35 70 139 Restructuring and other cost 8 17 25 6 21 27 51 (Gain) loss on dispositions (7) 1 (6) 1 - 1 (5) Segment earnings 298 262 560 354 340 694 1,254 Segment earnings margin 18.0% 17.5% 17.8% 20.3% 19.1% 19.7% 18.8% 2020 2021
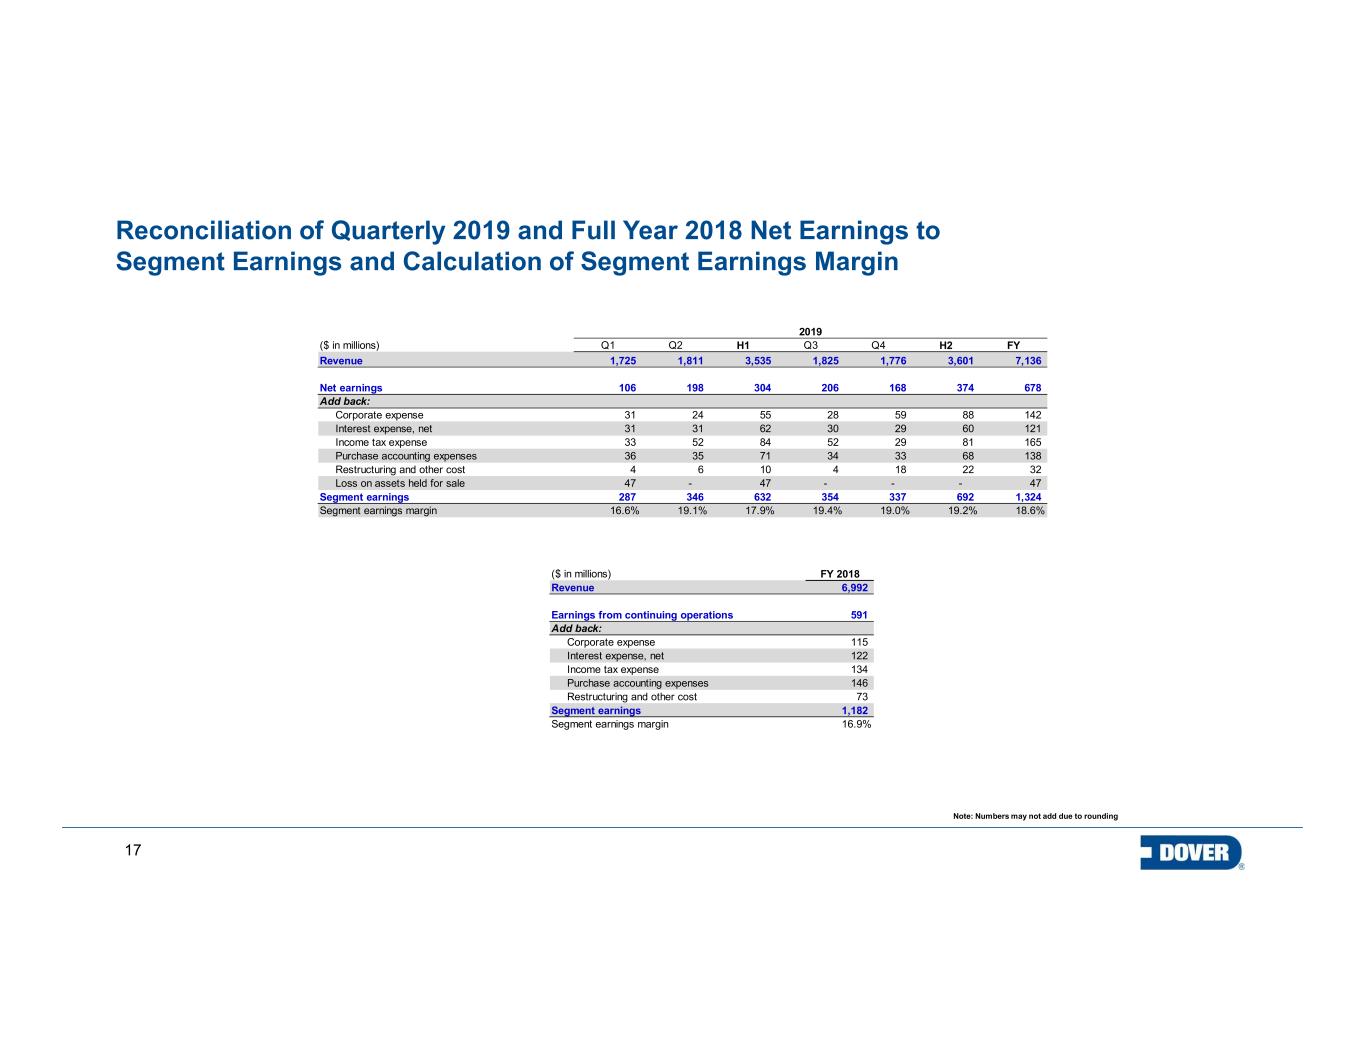
17 Note: Numbers may not add due to rounding Reconciliation of Quarterly 2019 and Full Year 2018 Net Earnings to Segment Earnings and Calculation of Segment Earnings Margin ($ in millions) Q1 Q2 H1 Q3 Q4 H2 FY Revenue 1,725 1,811 3,535 1,825 1,776 3,601 7,136 Net earnings 106 198 304 206 168 374 678 Add back: Corporate expense 31 24 55 28 59 88 142 Interest expense, net 31 31 62 30 29 60 121 Income tax expense 33 52 84 52 29 81 165 Purchase accounting expenses 36 35 71 34 33 68 138 Restructuring and other cost 4 6 10 4 18 22 32 Loss on assets held for sale 47 - 47 - - - 47 Segment earnings 287 346 632 354 337 692 1,324 Segment earnings margin 16.6% 19.1% 17.9% 19.4% 19.0% 19.2% 18.6% 2019 ($ in millions) FY 2018 Revenue 6,992 Earnings from continuing operations 591 Add back: Corporate expense 115 Interest expense, net 122 Income tax expense 134 Purchase accounting expenses 146 Restructuring and other cost 73 Segment earnings 1,182 Segment earnings margin 16.9%
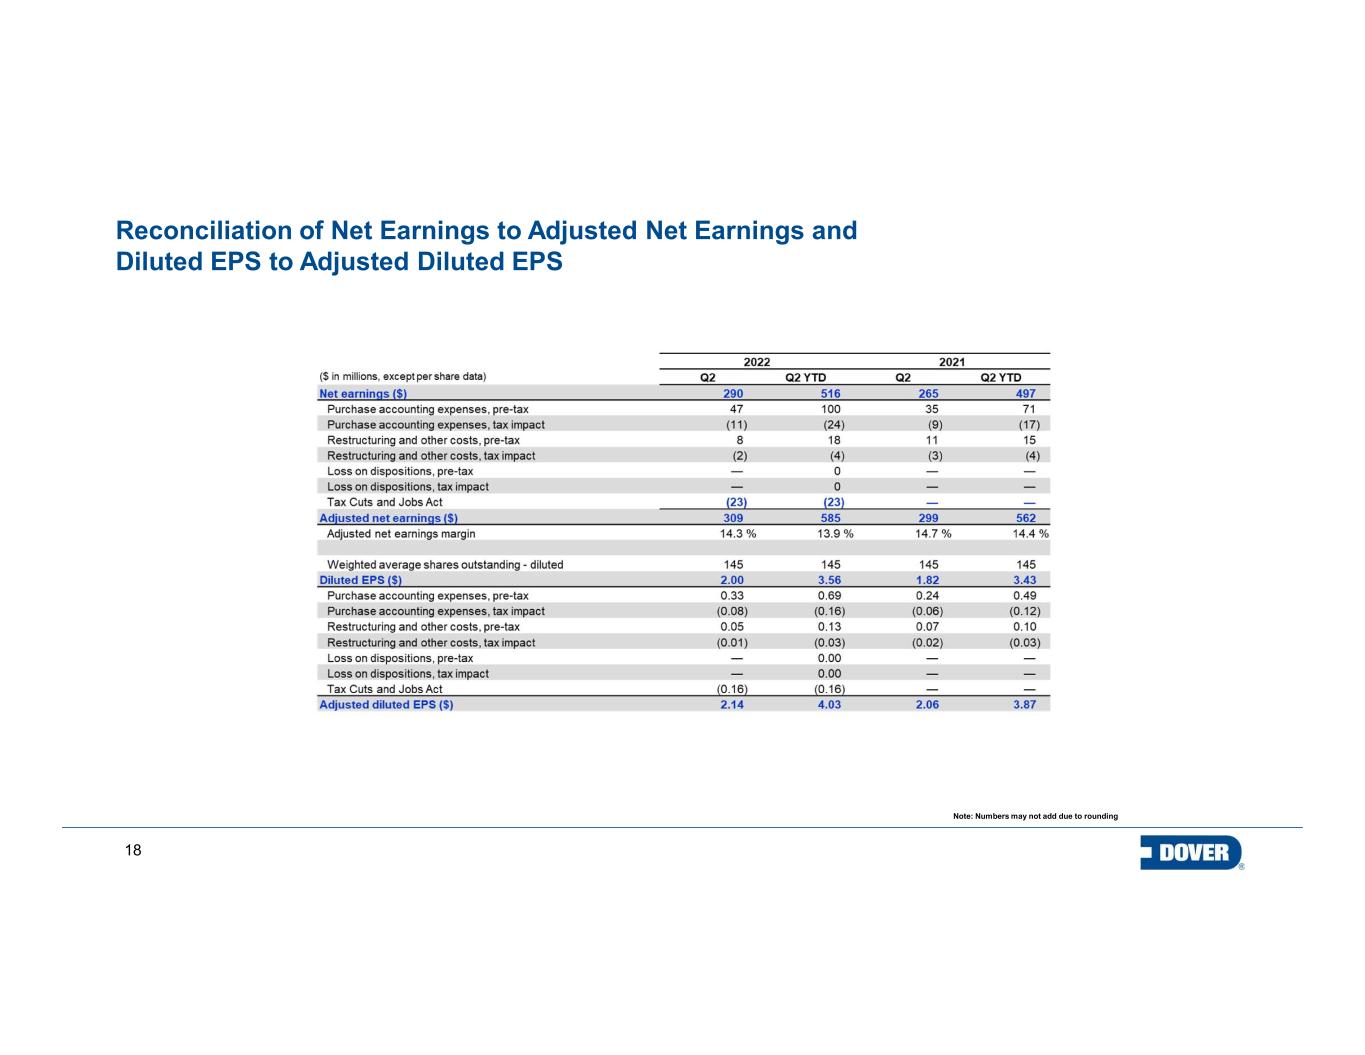
18 Note: Numbers may not add due to rounding Reconciliation of Net Earnings to Adjusted Net Earnings and Diluted EPS to Adjusted Diluted EPS
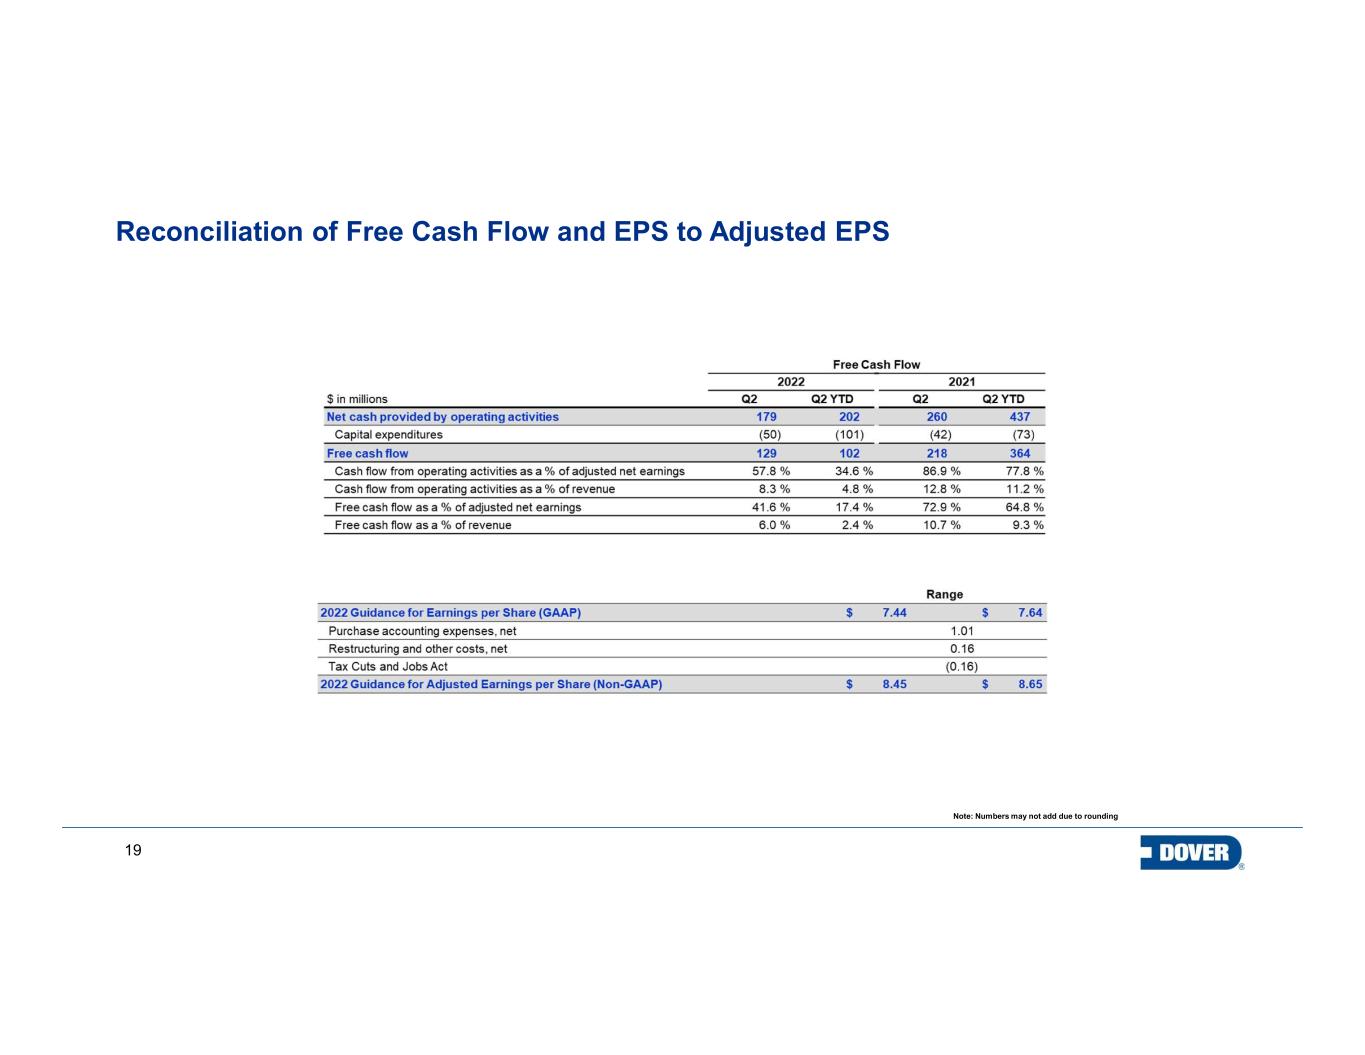
19 Note: Numbers may not add due to rounding Reconciliation of Free Cash Flow and EPS to Adjusted EPS
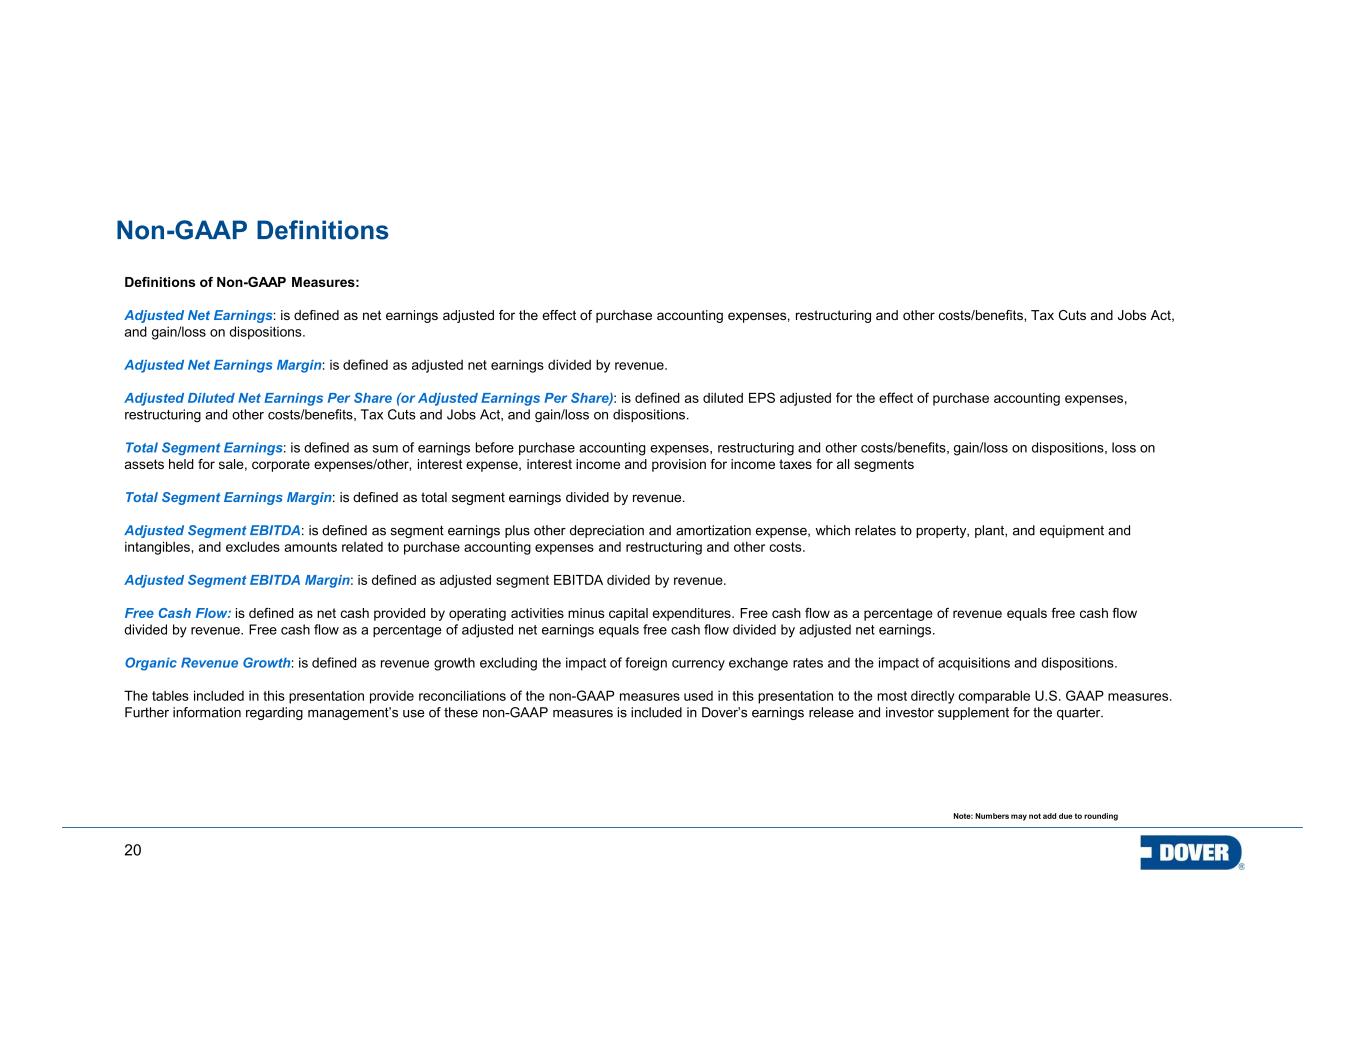
20 Note: Numbers may not add due to rounding Non-GAAP Definitions Definitions of Non-GAAP Measures: Adjusted Net Earnings: is defined as net earnings adjusted for the effect of purchase accounting expenses, restructuring and other costs/benefits, Tax Cuts and Jobs Act, and gain/loss on dispositions. Adjusted Net Earnings Margin: is defined as adjusted net earnings divided by revenue. Adjusted Diluted Net Earnings Per Share (or Adjusted Earnings Per Share): is defined as diluted EPS adjusted for the effect of purchase accounting expenses, restructuring and other costs/benefits, Tax Cuts and Jobs Act, and gain/loss on dispositions. Total Segment Earnings: is defined as sum of earnings before purchase accounting expenses, restructuring and other costs/benefits, gain/loss on dispositions, loss on assets held for sale, corporate expenses/other, interest expense, interest income and provision for income taxes for all segments Total Segment Earnings Margin: is defined as total segment earnings divided by revenue. Adjusted Segment EBITDA: is defined as segment earnings plus other depreciation and amortization expense, which relates to property, plant, and equipment and intangibles, and excludes amounts related to purchase accounting expenses and restructuring and other costs. Adjusted Segment EBITDA Margin: is defined as adjusted segment EBITDA divided by revenue. Free Cash Flow: is defined as net cash provided by operating activities minus capital expenditures. Free cash flow as a percentage of revenue equals free cash flow divided by revenue. Free cash flow as a percentage of adjusted net earnings equals free cash flow divided by adjusted net earnings. Organic Revenue Growth: is defined as revenue growth excluding the impact of foreign currency exchange rates and the impact of acquisitions and dispositions. The tables included in this presentation provide reconciliations of the non-GAAP measures used in this presentation to the most directly comparable U.S. GAAP measures. Further information regarding management’s use of these non-GAAP measures is included in Dover’s earnings release and investor supplement for the quarter.
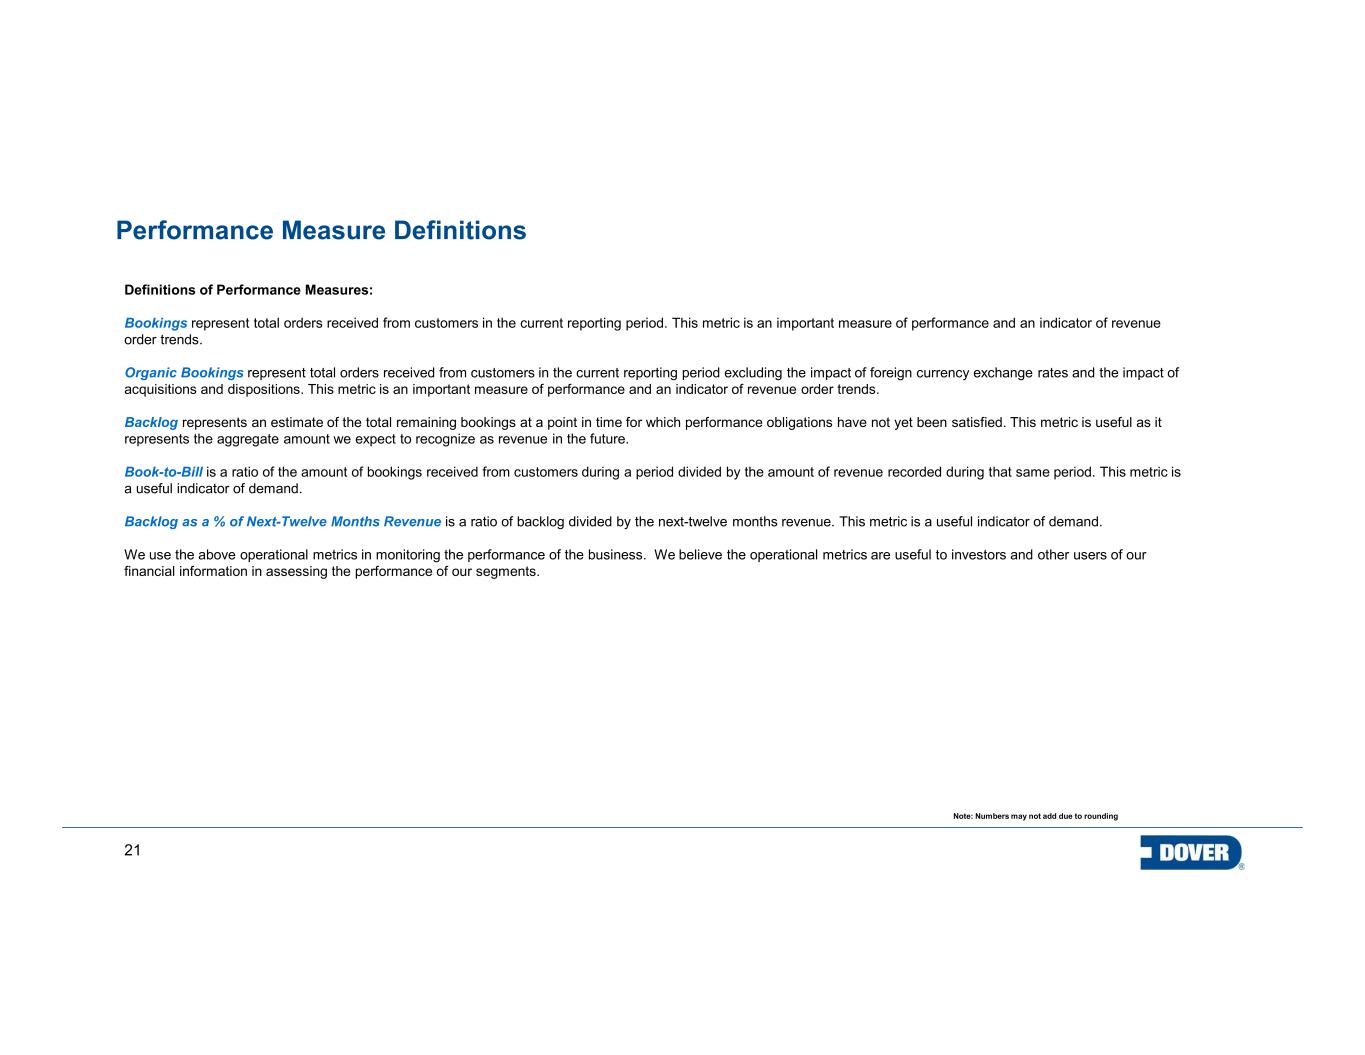
21 Note: Numbers may not add due to rounding Performance Measure Definitions Definitions of Performance Measures: Bookings represent total orders received from customers in the current reporting period. This metric is an important measure of performance and an indicator of revenue order trends. Organic Bookings represent total orders received from customers in the current reporting period excluding the impact of foreign currency exchange rates and the impact of acquisitions and dispositions. This metric is an important measure of performance and an indicator of revenue order trends. Backlog represents an estimate of the total remaining bookings at a point in time for which performance obligations have not yet been satisfied. This metric is useful as it represents the aggregate amount we expect to recognize as revenue in the future. Book-to-Bill is a ratio of the amount of bookings received from customers during a period divided by the amount of revenue recorded during that same period. This metric is a useful indicator of demand. Backlog as a % of Next-Twelve Months Revenue is a ratio of backlog divided by the next-twelve months revenue. This metric is a useful indicator of demand. We use the above operational metrics in monitoring the performance of the business. We believe the operational metrics are useful to investors and other users of our financial information in assessing the performance of our segments.
