| Exhibit 99.2 |
| OmnicomGroup |
| SECOND QUARTER 2003 RESULTS Investor Presentation |
| July 29, 2003 |
The following materials have been prepared for use in the July 29, 2003 conference call on Omnicom’s results of operations for the quarter ended June 30, 2003. The call will be archived on the Internet at http://www.omnicomgroup.com/financialwebcasts. |
| Forward-Looking Statements |
| Certain of the statements in this document constitute forward-looking statements. These statements relate to future events or future financial performance and involve known and unknown risks and other factors that may cause our actual or our industry’s results, levels of activity or achievement to be materially different from those expressed or implied by any forward-looking statements. These risks and uncertainties include, but are not limited to, our future financial condition and results of operations, changes in general economic conditions, competitive factors, changes in client communication requirements, the hiring and retention of human resources and our international operations, which are subject to the risks of currency fluctuations and exchange controls. In some cases, forward-looking statements can be identified by terminology such as “may,” “will,” “could,” “would,” “should,” “expect,” “plan,” “anticipate,” “intend,” “believe,” “estimate,” “predict,” “potential,” or “continue” or the negative of those terms or other comparable terminology. These statements are present expectations. Actual events or results may differ materially. |
| Other Information |
All dollar amounts are in millions except for EPS. The following financial information contained in this document has not been audited, although some of it has been derived from Omnicom’s historical financial statements, including its audited financial statements. In addition, industry, operational and other non-financial data contained in this document has been derived from sources we believe to be reliable, but we have not independently verified such information, and we do not, nor does any other person, assume responsibility for the accuracy or completeness of that information. The inclusion of information in this presentation does not mean that such information is material or that disclosure of such information is required. |
| OmnicomGroup | 1 |
| 2003 vs. 2002 P&L Summary |
| Second Quarter | Year to Date | ||||||||||||
| 2003 | 2002 | % Change | 2003 | 2002 | % Change | ||||||||
| Revenue | $2,149.5 | $1,916.6 | 12.2 | % | $4,086.8 | $3,649.0 | 12.0 | % | |||||
| Operating Income | 336.7 | 330.4 | 1.9 | % | 560.0 | 559.4 | 0.1 | % | |||||
| % Margin | 15.7% | 17.2% | 13.7% | 15.3% | |||||||||
| Net Interest Expense | 13.0 | 5.9 | 21.2 | 17.3 | |||||||||
| Profit Before Tax | 323.7 | 324.5 | (0.2) | % | 538.8 | 542.1 | (0.6) | % | |||||
| % Margin | 15.1% | 16.9% | 13.2% | 14.9% | |||||||||
| Taxes | 110.6 | 122.0 | 185.8 | 201.9 | |||||||||
| % Tax Rate | 34.2% | 37.6% | 34.5% | 37.2% | |||||||||
| Profit After Tax | 213.1 | 202.5 | 5.2 | % | 353.0 | 340.2 | 3.8 | % | |||||
| Equity in Affiliates/ Min. Interest | (22.4) | (15.2) | (33.7) | (24.3) | |||||||||
| Net Income | $ 190.7 | $ 187.3 | 1.8 | % | $ 319.3 | $ 315.9 | 1.1 | % | |||||
| OmnicomGroup | 2 |
| 2003 vs. 2002 Earnings Per Share |
Second Quarter | Year to Date | ||||||
2003 | 2002 | 2003 | 2002 | ||||
Earnings per Share: | |||||||
Basic | $1.02 | $1.01 | $1.71 | $1.70 | |||
Diluted | 1.02 | 1.00 | 1.70 | 1.67 | |||
Weighted Average Shares (millions): | |||||||
Basic | 187.2 | 185.7 | 186.9 | 186.2 | |||
Diluted | 188.1 | 188.1 | 187.7 | 189.1 | |||
Dividend Declared Per Share | $0.20 | $0.20 | $0.40 | $0.40 | |||
| OmnicomGroup | 3 |
| 2003 Total Revenue Growth |
Second Quarter | Year to Date | ||||||
$ | % | $ | % | ||||
Prior Period Revenue | $1,916.6 |
| $3,649.0 | ||||
Foreign Exchange (FX) Impact(a) | 126.3 | 6.6% | 233.6 | 6.4% | |||
Acquisition Revenue(b) | 56.7 | 3.0% | 109.5 | 3.0% | |||
Organic Revenue(c) | 49.9 | 2.6% | 94.7 | 2.6% | |||
Current Period Revenue | $2,149.5 | 12.2% | $4,086.8 | 12.0% | |||
| (a) | To calculate the FX impact, we first convert the current period’s local currency revenue using the average exchange rates from the equivalent prior period to arrive at constant currency revenue. The FX impact equals the difference between the current period revenue in U.S. dollars and the current period revenue in constant currency. |
| (b) | Acquisition revenue is the aggregate of the applicable prior period revenue of the acquired businesses. Netted against this number is the revenue of any business included in the prior period reported revenue that was disposed of subsequent to the prior period. |
| (c) | Organic revenue is calculated by subtracting both the acquisition revenue and the FX impact from total revenue growth. |
| OmnicomGroup | 4 |
| 2003 Revenue By Discipline |
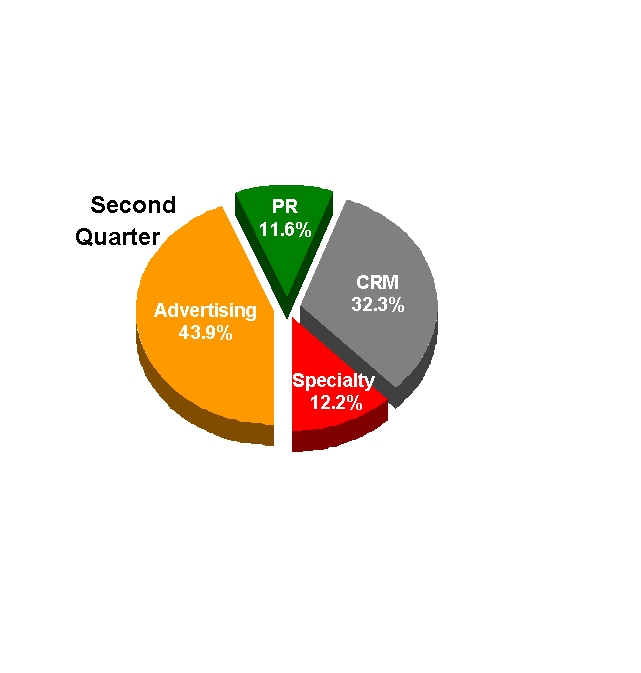
| Revenue By Discipline | ||||
$ Mix | Growth | |||
Advertising | 944.2 | 14.9% | ||
CRM | 693.3 | 17.7% | ||
PR | 249.3 | 1.4% | ||
Specialty | 262.7 | 1.1% |
| |
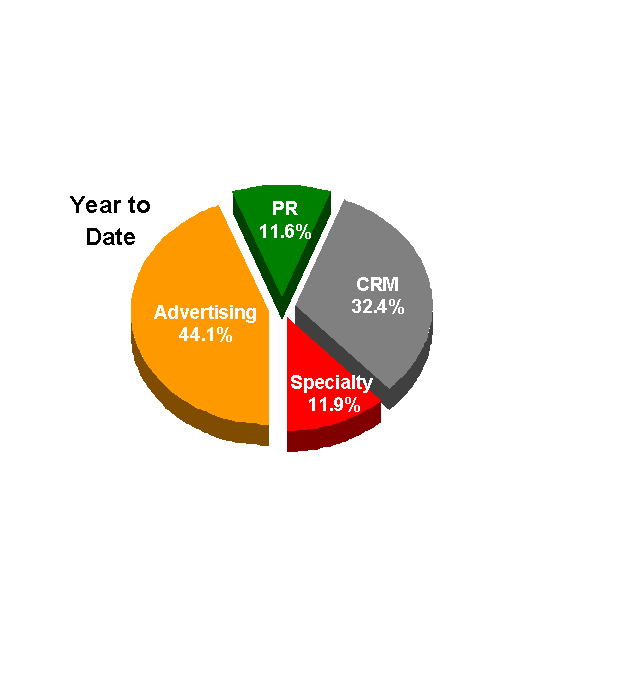
| Revenue By Discipline | ||||
$ Mix | Growth | |||
Advertising | 1,803.9 | 12.8% | ||
CRM | 1,324.5 | 19.2% | ||
PR | 474.4 | 0.2% | ||
Specialty | 484.0 | 4.2% |
| |
| Note: | “Growth” is the year-over-year growth from the prior period. |
| OmnicomGroup | 5 |
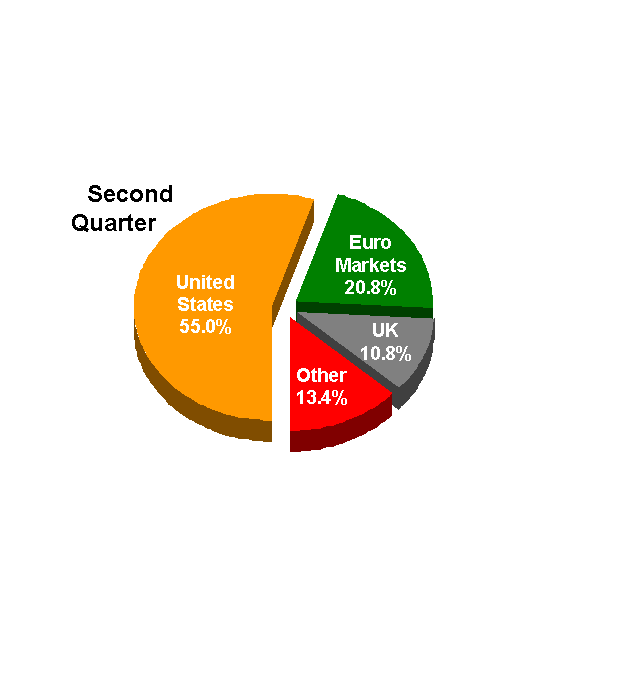
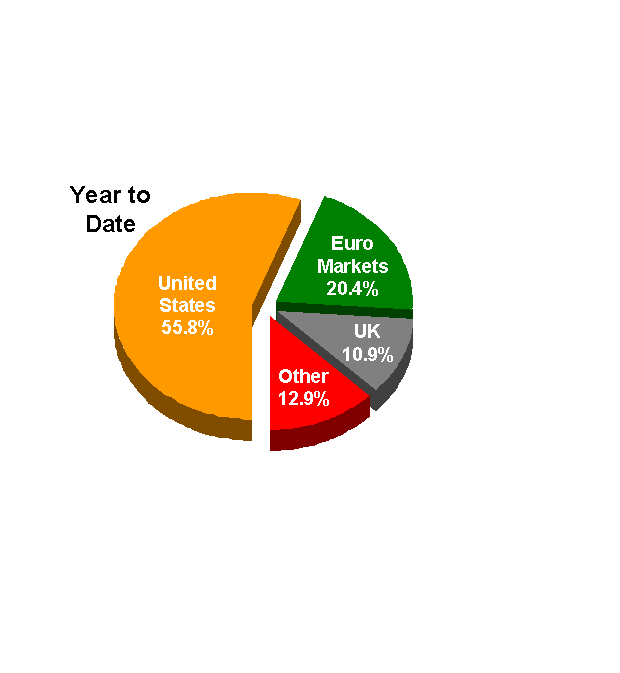
| 2003 Revenue By Geography |
| Domestic vs. International | ||||
$ Mix | $ Growth | |||
United States | $1,182.3 | $64.7 | ||
Organic | 32.6 | |||
Acquisition | 32.1 | |||
International | $967.2 | $168.2 | ||
Organic | 17.3 | |||
Acquisition | 24.6 | |||
FX | 126.3 | |||
| Primary Markets | ||||
$ Mix | Growth | |||
United States | $1,182.3 | 5.8% | ||
Euro Markets | 446.8 | 24.0% | ||
United Kingdom | 232.1 | 18.9% | ||
Other | 288.3 | 18.4% | ||
| Domestic vs. International | ||||
$ Mix | $ Growth | |||
United States | $2,281.8 | $142.2 | ||
Organic | 76.6 | |||
Acquisition | 65.6 | |||
International | $1,805.0 | $295.6 | ||
Organic | 18.1 | |||
Acquisition | 43.9 | |||
FX | 233.6 | |||
| Primary Markets | ||||
$ Mix | Growth | |||
United States | $2,281.8 | 6.6% | ||
Euro Markets | 834.2 | 22.7% | ||
United Kingdom | 443.7 | 17.3% | ||
Other | 527.1 | 16.9% | ||
| OmnicomGroup | 6 |
| Current Credit Picture |
| Q2 End | ||||||
2003 | 2002 | |||||
Operating Income (EBIT) (a) | $1,105 | $1,094 | ||||
Net Interest Expense (a) | $ 34.4 | $ 50.3 | ||||
EBIT / Net Interest | 32.1 | x | 21.7 | x | ||
Total Debt / EBIT | 2.4 | x | 2.5 | x | ||
Debt: | ||||||
Bank Loans (Due Less Than 1 Year) | $ 65 | $ 103 | ||||
$835 Million Revolver Due 11/14/05 | — | — | ||||
CP issued under 364 Day Facility (b) | — | 621 | ||||
5.20% Euro Notes Due 6/24/05 (c) | 175 | 151 | ||||
$850 Million Convertible Notes Due 2/7/31 | 847 | 850 | ||||
$900 Million Convertible Notes Due 7/31/32 | 900 | 900 | ||||
$600 Million Convertible Notes Due 6/15/33 | 600 | — | ||||
Loan Notes and Sundry (various through 2012) | 22 | 97 | ||||
Total Debt | $2,609 | $2,722 | ||||
| Cash and Short Term Investments | 544 | 454 | ||||
Net Debt | $2,065 | $2,268 | ||||
| (a) | “Operating Income (EBIT)” and “Net Interest Expense” calculations shown are latest twelve month figures for the quarter ended as specified. Although our bank agreements reference EBITDA, we have used EBIT for this presentation because EBITDA is a non-GAAP measure. Latest twelve month figures for 2002 are adjusted to assume that the cessation of goodwill amortization occurred as of the beginning of the period. |
| (b) | The underlying $1.040 billion 364 Day Credit facility expires 11/14/03 plus one-year term out at Omnicom’s option. | |
| (c) | The change in the outstanding balance is the result of changes in the Euro to U.S. dollar currency exchange rate. |
| OmnicomGroup | 7 |
| Current Liquidity Picture |
| Omnicom believes it has ample liquidity to meet all foreseeable business and capital requirements. |
As of June 30, 2003 | ||||||||
Total Amount | Outstanding | Available | ||||||
Committed Facilities | ||||||||
364 Day Revolving Credit Facility(a) | $1,040 | $ — | $1,040 | |||||
3 Year Revolving Credit Facility | 835 | — | 835 | |||||
Other Committed Credit Facilities | 65 | 65 | — | |||||
Total Committed Facilities | 1,940 | 65 | 1,875 | |||||
Uncommitted Facilities(b) | 391 | — | — | (b) | ||||
Total Credit Facilities | $2,331 | $ 65 | $1,875 | |||||
Cash & Short Term Investments | 544 | |||||||
Total Liquidity Available | $2,419 | |||||||
| (a) | The underlying $1.040 billion 364 Day Credit facility expires 11/14/03 plus one-year term out at Omnicom’s option. | |
| (b) | Uncommitted facilities in the U.S., U.K. and Canada. These amounts are excluded for purposes of this analysis. |
| OmnicomGroup | 8 |
| Traditional Return on Equity(a) |
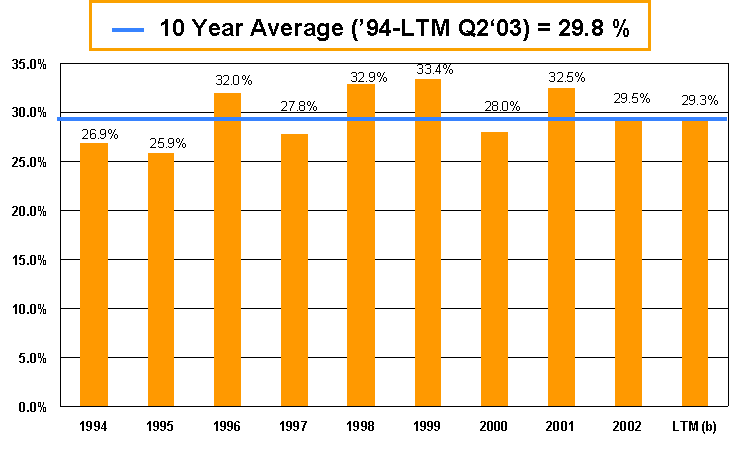
| Note: | Prior year amounts not adjusted here to reflect acquisitions accounted for as poolings of interest. 1994 excludes a $28.0 million after-tax charge for the cumulative effect of an accounting change related to post-employment benefits. In addition, 2000 excludes a $63.8 million after-tax gain from the sale of Razorfish shares. As a result of these exclusions, this presentation is a non-GAAP financial measure. We believe that by excluding these items noted above, this schedule presents the calculation of traditional return on equity using amounts that are more comparable year to year and thus more meaningful for purposes of this analysis. If the accounting change were included, the 1994 “Traditional Return on Equity” would have been 19.9%. If the Razorfish gain were included, the 2000 “Traditional Return on Equity” would have been 32.1%. If both the accounting change and Razorfish gain were included, the 10 year average would have been 29.5%. |
| (a) | “Traditional Return on Equity” is Net Income for the given period divided by the shareholders’ equity at the end of the prior period. |
| (b) | LTM result is calculated as the Net Income for the previous twelve months ended 6/30/03 divided by the shareholders’ equity on 6/30/02. |
| OmnicomGroup | 9 |
| Acquisitions Summary |
| Acquisition Related Expenditures |
6 Months YTD 2003 | ||
New Subsidiary Acquisitions (a) | $ 23.6 | |
Affiliates to Subsidiaries (b) | 0.0 | |
Affiliates (c) | 2.0 | |
Existing Subsidiaries (d) | 71.5 | |
Earn-outs (e) | 147.8 | |
Total Acquisition Expenditures | $244.9 | |
| Note: | See appendix for subsidiary acquisition profiles. |
| (a) | Includes acquisitions of a majority interest in new agencies resulting in their consolidation. Does not include the redemption of preferred stock in connection with the acquisition of AGENCY.COM which closed in June 2003. |
| (b) | Includes acquisitions of additional equity interests in existing affiliate agencies resulting in their majority ownership and consolidation. |
| (c) | Includes acquisitions of less than a majority interest in agencies in which Omnicom did not have a prior equity interest and the acquisition of additional interests in existing affiliated agencies that did not result in majority ownership. |
| (d) | Includes the acquisition of additional equity interests in already consolidated subsidiary agencies. |
| (e) | Includes additional consideration paid for acquisitions completed in prior periods. |
| OmnicomGroup | Acquisitions | 11 |
| Potential Earn-out Obligations |
| The following is an estimate of future earn-out related obligations as of June 30, 2003, assuming that the underlying acquired agencies continue to perform at their current levels:(a) | |||||
2003(b) | 2004 | 2005 | 2006 | Thereafter | Total |
$114.8 | $104.4 | $89.0 | $36.6 | $30.2 | $375.0 |
| (a) | The ultimate payments will vary as they are dependent on future events. |
| (b) | Estimated remaining obligations as of June 30, 2003. |
| OmnicomGroup | Acquisitions | 12 |
| Potential Put Obligations |
| In conjunction with certain transactions Omnicom has agreed to acquire (at the sellers’ option) additional equity interests. The following is an estimate of these potential future “put” obligations (as of June 30, 2003), assuming these underlying acquired agencies continue to perform at their current levels: | |||||
Currently | Not Currently | Total | ||||
Subsidiary Agencies | $113.9 | $118.0 | $231.9 | |||
Affiliated Agencies | 14.8 | 10.0 | 24.8 | |||
Total | $128.7 | $128.0 | $256.7 | |||
| OmnicomGroup | Acquisitions | 13 |
| Acquisitions Quarter-to-Date |
| The following pages are summaries of acquisitions completed during the quarter ended June 30, 2003 |
| OmnicomGroup | Acquisitions | 14 |
 |
| Siegel & Gale |
| Siegel & Gale is a strategic branding consulting firm with offices in New York and Los Angeles. For over 30 years, the firm has helped clients achieve the full potential of their businesses by defining, differentiating and projecting the unique value of their brands. |
| OmnicomGroup | Acquisitions | 15 |
 |
| Research by Design |
Research by Design (“RBD”), established in 1989, provides custom, proprietary market research services to pharmaceutical, biotechnology, medical device and other healthcare companies. The company offers information support for domestic and international development and marketing of healthcare products. RBD services include strategic consulting, concept evaluation, opportunity analysis, positioning, pricing research, modeling, segmentation, promotional testing, technology assessment, new product tracking, and multivariate analysis; employing focus groups, depth interviews and telephone and internet surveys. RBD is located in Doylestown, PA and is a member of the Adelphi Group of companies. |
| OmnicomGroup | Acquisitions | 16 |
 |
| pierce promotions & event management |
| pierce promotions & event management is a top-ranked national event marketing agency specializing in integrated, experiential marketing across multiple media and channels. Capabilities include retailtainment/in-store events, mobile marketing, sampling, mall marketing, sports marketing, radio promotion and special events. pierce is located in Portland, Maine. |
| OmnicomGroup | Acquisitions | 17 |
 |
| AGENCY.COM |
AGENCY.COM is an interactive marketing and technology agency which builds world-class, customer-focused Web sites, intranets and extranets, supported by interactive marketing and advertising services. With its focus on using interactive technology in the most cost-efficient way to create superior service experiences that deliver value to businesses and customers alike, AGENCY.COM’s interactive solutions have helped many market leading brands not only acquire and retain customers, but also increase their lifetime value. |
| OmnicomGroup | Acquisitions | 18 |