
Omnicom Group
FULL YEAR 2005 RESULTS
Investor Presentation
February 14, 2006
Exhibit 99.2

The following materials have been prepared for use in the February 14, 2006 conference call on Omnicom’s results of
operations for the year ended December 31, 2005. The call will be archived on the Internet at
http://www.omnicomgroup.com/financialwebcasts.
Forward-Looking Statements
Certain of the statements in this document constitute forward-looking statements within the meaning of the Private
Securities Litigation Act of 1995. These statements relate to future events or future financial performance and involve
known and unknown risks and other factors that may cause our actual or our industry’s results, levels of activity or
achievement to be materially different from those expressed or implied by any forward-looking statements. These risks
and uncertainties include, but are not limited to, our future financial condition and results of operations, changes in
general economic conditions, competitive factors, changes in client communication requirements, the hiring and
retention of human resources and our international operations, which are subject to the risks of currency fluctuations
and exchange controls. In some cases, forward-looking statements can be identified by terminology such as “may,”
“will,” “could,” “would,” “should,” “expect,” “plan,” “anticipate,” “intend,” “believe,” “estimate,” “predict,” “potential” or
“continue” or the negative of those terms or other comparable terminology. These statements are present
expectations. Actual events or results may differ materially. We undertake no obligation to update or revise any
forward-looking statement.
Other Information
All dollar amounts are in millions except for EPS. The following financial information contained in this document has
not been audited, although some of it has been derived from Omnicom’s historical financial statements, including its
audited financial statements. In addition, industry, operational and other non-financial data contained in this document
has been derived from sources we believe to be reliable, but we have not independently verified such information, and
we do not, nor does any other person, assume responsibility for the accuracy or completeness of that information.
The inclusion of information in this presentation does not mean that such information is material or that disclosure of
such information is required.
1

2005 vs. 2004 P&L Summary
2
2005
2004
% Change
2005
2004
%
Change
Revenue
2,939.4
$
2,789.0
$
5.4%
10,481.1
$
9,747.2
$
7.5%
Operating Income
426.1
394.9
7.9%
1,339.8
1,215.4
10.2%
% Margin
14.5%
14.2%
12.8%
12.5%
Net Interest Expense
16.5
10.0
59.2
36.6
Profit Before Tax
409.6
384.9
6.4%
1,280.6
1,178.8
8.6%
% Margin
13.9%
13.8%
12.2%
12.1%
Taxes
137.9
129.4
435.3
396.3
% Tax Rate
33.7%
33.6%
34.0%
33.6%
Profit After Tax
271.7
255.5
6.3%
845.3
782.5
8.0%
Equity in Affiliates
10.4
6.6
27.6
17.1
Minority Interest
(29.5)
(25.6)
(82.2)
(76.1)
Net Income
252.6
$
236.5
$
6.8%
790.7
$
723.5
$
9.3%
Fourth Quarter
Full Year

2005 vs. 2004 Earnings Per Share
Earnings per Share:
Basic
Diluted
Weighted Average Shares (millions):
Basic
Diluted
Dividend Declared Per Share
$ 1.42
1.41
178.2
179.6
$0.250
2004
2005
Fourth Quarter
$ 1.28
1.28
184.1
185.2
$0.225
$ 4.38
4.36
180.4
181.8
$0.925
2004
2005
Full Year
$ 3.90
3.88
185.7
186.6
$0.900
3

2005 Total Revenue Growth
(a)
To calculate the FX impact, we first convert the current period’s local currency revenue using the average
exchange rates from the equivalent prior period to arrive at constant currency revenue. The FX impact equals
the difference between the current period revenue in U.S. dollars and the current period revenue in constant
currency.
(b)
Acquisition revenue is the aggregate of the applicable prior period revenue of the acquired businesses. Netted
against this number is the revenue of any business included in the prior period reported revenue that was
disposed of subsequent to the prior period.
(c)
Organic revenue is calculated by subtracting both the acquisition revenue and the FX impact from total revenue
growth.
4
$
%
$
%
Prior Period Revenue
2,789.0
$
9,747.2
$
Foreign Exchange (FX) Impact (a)
(59.9)
-2.1%
53.3
0.5%
Acquisition Revenue (b)
(2.8)
-0.1%
(28.8)
-0.3%
Organic Revenue (c)
213.1
7.6%
709.4
7.3%
Current Period Revenue
2,939.4
$
5.4%
10,481.1
$
7.5%
Fourth Quarter
Full Year
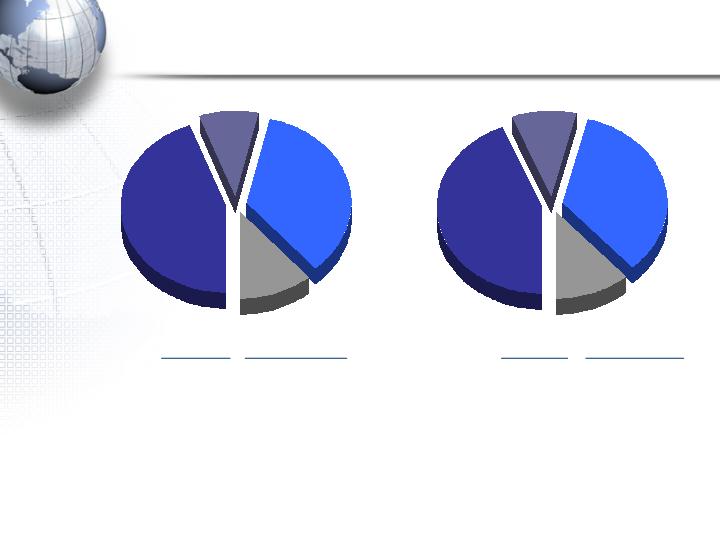
2005 Revenue By Discipline
(a) “Growth” is the year-over-year growth from the prior period.
Advertising
44.4%
PR
9.1%
CRM
35.1%
Specialty
11.4%
Advertising
43.8%
PR
10.0%
CRM
34.5%
Specialty
11.7%
Full
Year
Fourth Quarter
2005
5
Pie Chart
$ Mix
% Growth (a)
$ Mix
% Growth (a)
Advertising
1,305.6
8.6%
####
Advertising
4,589.0
9.1%
CRM
1,032.8
3.5%
####
CRM
3,613.0
6.8%
PR
267.3
1.3%
9.1%
PR
1,045.7
2.1%
Specialty
333.7
2.7%
####
Specialty
1,233.4
8.9%
Fourth Quarter
2005
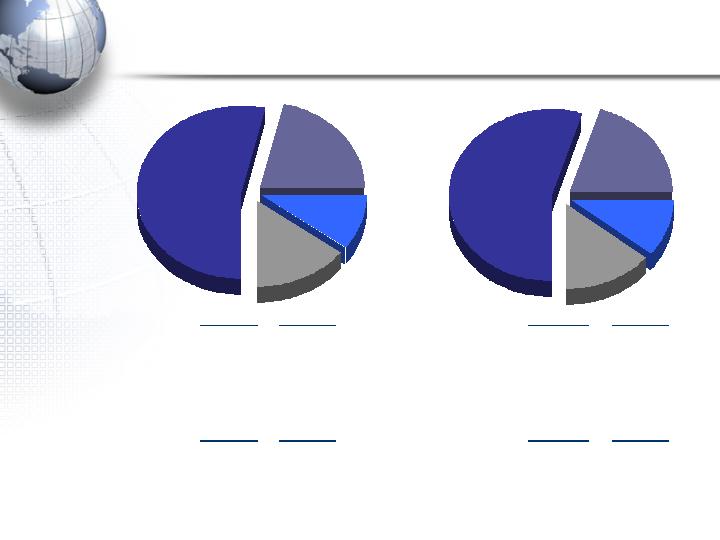
United
States
54.8%
UK
10.5%
Euro
Markets
20.6%
Other
14.1%
Full Year
United
States
53.6%
UK
10.4%
Euro
Markets
21.3%
Other
14.7%
6
(a) “Growth” is the year-over-year growth from the prior period.
2005 Revenue By Geography
$ Mix
$ Growth(a)
$ Mix
$ Growth(a)
United States
1,575.5
$
133.6
$
United States
5,743.9
$
520.5
$
Organic
116.7
Organic
467.9
Acquisition
16.9
Acquisition
52.6
International
1,363.9
$
16.8
$
International
4,737.2
$
213.4
$
Organic
96.4
Organic
241.5
Acquisition
(19.7)
Acquisition
(81.4)
FX
(59.9)
FX
53.3
$ Mix
$ Growth(a)
$ Mix
$ Growth(a)
United States
1,575.5
$
9.3%
United States
5,743.9
$
10.0%
Euro Currency Markets
624.9
-0.4%
Euro Currency Markets
2,156.5
4.8%
United Kingdom
307.3
-0.1%
United Kingdom
1,102.4
1.6%
Other
431.7
4.8%
Other
1,478.3
7.1%

Cash Flow – GAAP Presentation (condensed)
7
2005
2004
Net Income
790.7
$
723.5
$
Stock-Based Compensation Expense
102.8
143.4
Depreciation and Amortization
175.2
172.1
Other non-cash items to reconcile to net income
73.5
79.1
Other changes in Working Capital
(151.0)
169.5
Net Cash Provided by Operations
991.2
1,287.6
Capital Expenditures
(162.7)
(159.7)
Acquisitions
(297.9)
(340.5)
Proceeds from Sale of Businesses
29.3
-
Other Investing Activities, net
269.0
(258.7)
Net Cash Used in Investing Activities
(162.3)
(758.9)
Dividends
(164.0)
(163.1)
Stock Repurchases
(731.8)
(446.5)
Repayment of Euro Loan and other
(188.4)
-
Other Financing Activities
(32.6)
(40.4)
Net Cash Used in Financing Activities
(1,116.8)
(650.0)
Effect of exchange rate changes on cash and cash equivalents
(41.9)
43.4
Net Decrease in Cash and Cash Equivalents
(329.8)
$
(77.9)
$
Full Year

After-Tax Free Cash Flow(a)
(a)
The After-Tax Free Cash Flow numbers presented above are a non-GAAP measure. They exclude changes in working capital and certain other
investing and financing activities. This presentation reflects the metrics used by management to assess our generation of cash. We believe that this
presentation is more meaningful for understanding our after-tax free cash flow and our primary uses of that cash flow. This presentation was derived
from our GAAP condensed statement of cash flow on the previous page of this presentation.
(b)
Reflects cash–tax differences arising from our convertible bonds and tax deductible goodwill. These amounts are included in “Other changes in
Working Capital” on the previous page of this presentation.
(c)
Net of proceeds of $29.3 million in 2005 from the sale of businesses.
(d)
Stock repurchases of $731.8 million and $446.5 million are net of proceeds from stock option exercises and stock sold in our employee stock purchase
plan of $88.1 million and $74.8 million for the twelve months ended December 31, 2005 and 2004, respectively.
8
2005
2004
Net Income
790.7
$
723.5
$
Stock-Based Compensation Expense
102.8
143.4
Depreciation and Amortization
175.2
172.1
Cash-Tax Differences (b)
100.2
108.7
After-Tax Free Cash Flow
1,168.9
$
1,147.7
$
Primary Cash Uses:
Capital Expenditures
162.7
159.7
Dividends
164.0
163.1
Acquisitions, (net of sale proceeds) (c)
268.6
340.5
Stock Repurchases, (net of proceeds) (d)
643.7
371.7
Full Year

Current Credit Picture
9
(a) “Operating Income (EBIT)” and “Net Interest Expense” calculations shown for the years ended as specified. Although our bank
agreements reference EBITDA, we have used EBIT for this presentation because EBITDA is a non-GAAP measure.
2005
2004
Operating Income (EBIT)(a)
$
1,340
$
1,215
Net Interest Expense(a)
$
59.2
$
36.6
EBIT / Net Interest
22.6
x
33.2
x
Net Debt / EBIT
0.9
x
0.7
x
Debt:
Bank Loans (Due Less Than 1 Year)
$
15
$
18
CP issued under $2.1B - 5 Year Revolver Due 5/23/10
-
-
5.20% Euro Notes Due 6/24/05
-
207
Convertible Notes Due 2/7/31
847
847
Convertible Notes Due 7/31/32
892
892
Convertible Notes Due 6/15/33
600
600
Other Debt
19
22
Total Debt
$
2,373
$
2,586
Cash and Short Term Investments
1,210
1,740
Net Debt
$
1,163
$
846
Full Year

Current Liquidity Picture
10
(a)
The $400 million 364 Day Credit facility includes a one-year term out at maturity at our option.
(b)
Credit facility expires May 23, 2010.
(c)
Uncommitted facilities in the U.S., U.K. and Canada. These amounts are excluded for purposes of this
analysis.
Total Amount
Of Facility
Outstanding
Available
Committed Facilities
364 Day Revolver Due 6/29/06 (a)
400
$
-
$
400
$
CP issued - backed by 5 Year Revolver (b)
2,100
-
2,100
Other Committed Credit Facilities
12
12
-
Total Committed Facilities
2,512
12
2,500
Uncommitted Facilities (c)
336
3
-
(c)
Total Credit Facilities
2,848
$
15
$
2,500
$
Cash and Short Term Investments
1,210
Total Liquidity Available
3,710
$
As of December 31, 2005
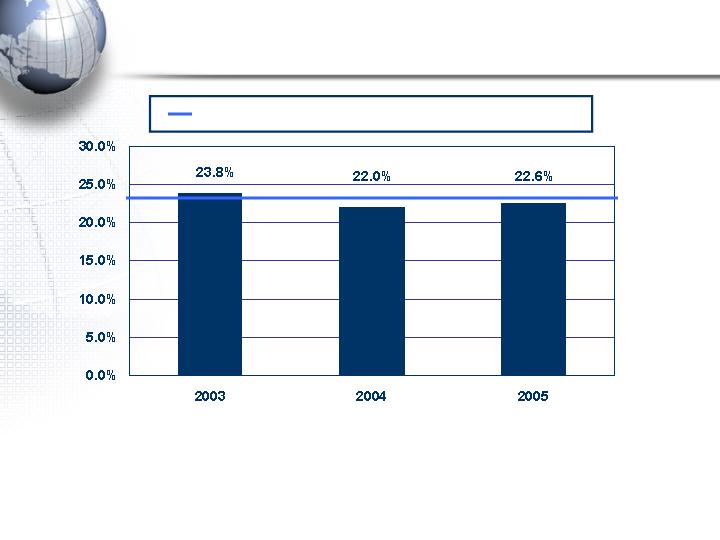
Return on Equity(a)
3 Year Average (2003-2005) = 22.8%
“Return on Equity” is constant dollar based Net Income for the given period divided by the shareholders’ equity at the end of the prior
period which has also been adjusted to a constant dollar basis.
In connection with our adoption on January 1, 2004 of SFAS 123 – ”Accounting for Stock-Based Compensation” as amended by SFAS
148, “Accounting for Stock-Based Compensation – Transition and Disclosure, an amendment for FASB Statement No.123,” utilizing
the retroactive restatement method, stock-based compensation costs have been expensed in the current period and the results for the
year ended December 31, 2003 have been restated as if we had used the fair value method to account for employee stock-based
compensation beginning January 1, 2003.
(a)
11

Acquisitions Summary
12

Acquisition Related Expenditures
13
Note: See appendix for subsidiary acquisition profiles.
Includes acquisitions of a majority interest in new agencies resulting in their consolidation.
Includes acquisitions of additional equity interests in existing affiliate agencies resulting in their majority ownership and consolidation.
Includes acquisitions of less than a majority interest in agencies in which Omnicom did not have a prior equity interest and the acquisition
of additional interests in existing affiliated agencies that did not result in majority ownership.
Includes the acquisition of additional equity interests in already consolidated subsidiary agencies.
Includes additional consideration paid for acquisitions completed in prior periods.
(a)
(b)
(c)
(d)
(e)
New Subsidiary Acquisitions (a)
78
$
Affiliates to Subsidiaries (b)
-
Affiliates (c)
1
Existing Subsidiaries (d)
43
Earn-outs (e)
205
Total Acquisition Expenditures
327
$
Full Year

Potential Earn-out Obligations
The following is a calculation of future earn-out obligations as of
December 31, 2005, assuming that the underlying acquired
agencies continue to perform at their current levels:(a)
(a)
The ultimate payments will vary as they are dependent on future events and changes in FX rates.
14
2006
2007
2008
2009
Thereafter
Total
126
$
113
$
89
$
47
$
22
$
397
$

Potential Obligations
15
(a) The ultimate payments will vary as they are dependent on future events and changes in FX rates.
In conjunction with certain transactions Omnicom has agreed to
acquire (at the sellers’ option) additional equity interests. The following
is a calculation of these potential future obligations (as of December
31, 2005), assuming these underlying acquired agencies continue to
perform at their current levels:(a)
Currently
Exercisable
Not Currently
Exercisable
Total
Subsidiary Agencies
116
$
108
$
224
$
Affiliated Agencies
43
5
48
Total
159
$
113
$
272
$

Fourth Quarter Acquisitions
The Beanstalk Group
The Beanstalk Group is the world’s leading brand licensing agency
and consultancy. Beanstalk helps its clients license their famous
trademarks, copyrights and images to enhance the value of their
brands and to create new revenue streams.
The agency is located in New York and London.
16

Fourth Quarter Acquisitions
ipsh!
ipsh! is a leader in innovating, developing and deploying
effective, mobile marketing strategies for clients. Formed
in 2001, the company is a full-service, mobile advertising
agency.
The company will become part of the Marketing Arm and is
located in San Francisco, California.
17

Fourth Quarter Acquisitions
The Marketing Partners
The Marketing Partners (“TMP”) is a promotion agency
founded in 1987. While its core competency is consumer
promotions for packaged goods companies, TMP also offers a
range of services including consumer promotion, advertising,
market research, package design, trade promotion and public
relations management.
The company will become part of the Alcone Marketing Group
and is located in Irvine, California.
18
Fourth Quarter Acquisitions
Myalo
Myalo is an interactive marketing agency whose clients are leaders
in the tourism, telecommunications and financial services industries.
The agency shares a number of clients with the TBWA group and is
located Kuala Lumpur, Malaysia. The agency will become part of
TBWA’s Tequila operations.
19

Fourth Quarter Acquisitions
Resolution Media
Resolution Media is a leading search engine marketing agency
offering customized business solutions through search marketing
strategy, optimization and integration. The agency provides
centralized solutions for leveraging all aspects of a client’s search
engine marketing, delivering measurable and positive returns on
search marketing investments.
The agency is based in Chicago, Illinois and is part of Omnicom
Media Group.
20
Fourth Quarter Acquisitions
Shockwaved
Shockwaved is an integrated dialogue and digital marketing
agency. The agency specializes in customer relationship
management through the use of integrated media.
The agency is located in Copenhagen, Denmark and is part of
TBWA Interactive.
21

Fourth Quarter Acquisitions
The Works
The Works is one of Europe’s largest sponsorship and
experiential event consultancies serving an international client
base which reaches across the Sport, Music, Film and Fashion
industries.
The Works is headquartered in London, England and is a
member of the Radiate Group of Companies.
22