
Omnicom Group
SECOND QUARTER 2006 RESULTS
Investor Presentation
July 25, 2006
Exhibit 99.2

The following materials have been prepared for use in the July 25, 2006 conference call on Omnicom’s results of
operations for the quarter ended June 30, 2006. The call will be archived on the Internet at
http://www.omnicomgroup.com/financialwebcasts.
Forward-Looking Statements
Certain of the statements in this document constitute forward-looking statements within the meaning of the Private
Securities Litigation Act of 1995. These statements relate to future events or future financial performance and involve
known and unknown risks and other factors that may cause our actual or our industry’s results, levels of activity or
achievement to be materially different from those expressed or implied by any forward-looking statements. These risks
and uncertainties include, but are not limited to, our future financial condition and results of operations, changes in
general economic conditions, competitive factors, changes in client communication requirements, the hiring and
retention of human resources and our international operations, which are subject to the risks of currency fluctuations and
exchange controls. In some cases, forward-looking statements can be identified by terminology such as “may,” “will,”
“could,” “would,” “should,” “expect,” “plan,” “anticipate,” “intend,” “believe,” “estimate,” “predict,” “potential” or “continue”
or the negative of those terms or other comparable terminology. These statements are present expectations. Actual
events or results may differ materially. We undertake no obligation to update or revise any forward-looking statement.
Other Information
All dollar amounts are in millions except for EPS. The following financial information contained in this document has not
been audited, although some of it has been derived from Omnicom’s historical financial statements, including its audited
financial statements. In addition, industry, operational and other non-financial data contained in this document have been
derived from sources we believe to be reliable, but we have not independently verified such information, and we do not,
nor does any other person, assume responsibility for the accuracy or completeness of that information.
The inclusion of information in this presentation does not mean that such information is material or that disclosure of
such information is required.
1

2006 vs. 2005 P&L Summary
2
2006
2005
%
2006
2005
%
Revenue
2,823.4
$
2,615.8
$
7.9%
5,386.3
$
5,018.8
$
7.3%
Operating Income
417.4
382.0
9.3%
701.9
639.3
9.8%
% Margin
14.8%
14.6%
13.0%
12.7%
Net Interest Expense
25.5
14.3
40.7
26.4
Profit Before Tax
391.9
367.7
6.6%
661.2
612.9
7.9%
% Margin
13.9%
14.1%
12.3%
12.2%
Taxes
131.7
124.3
222.6
210.5
% Tax Rate
33.6%
33.8%
33.7%
34.3%
Profit After Tax
260.2
243.4
6.9%
438.6
402.4
9.0%
Equity in Affiliates
6.3
5.0
11.2
10.2
Minority Interest
(22.4)
(22.6)
(40.1)
(36.3)
Net Income
244.1
$
225.8
$
8.1%
409.7
$
376.3
$
8.9%
Second Quarter
Year to Date

2006 vs. 2005 Earnings Per Share
Earnings per Share:
Basic
Diluted
Growth Rate, Diluted
Weighted Average Shares (millions):
Basic
Diluted
Dividend Declared Per Share
$ 1.43
1.42
14.5
170.2
172.0
$0.250
2005
2006
Second Quarter
$ 1.24
1.24
181.4
182.8
$0.225
$ 2.36
2.34
14.1
173.6
175.2
$0.500
2005
2006
Year to Date
$ 2.07
2.05
182.0
183.5
$0.450
%
%
3

2006 Total Revenue Growth
(a)
To calculate the FX impact, we first convert the current period’s local currency revenue using the average exchange rates from the
equivalent prior period to arrive at constant currency revenue. The FX impact equals the difference between the current period
revenue in U.S. dollars and the current period revenue in constant currency.
(b)
Acquisition revenue is the aggregate of the applicable prior period revenue of the acquired businesses. Netted against this number
is the revenue of any business included in the prior period reported revenue that was disposed of subsequent to the prior period.
(c)
Organic revenue is calculated by subtracting both the acquisition revenue and the FX impact from total revenue growth.
$
%
$
%
Prior Period Revenue
2,615.8
$
5,018.8
$
Foreign Exchange (FX) Impact (a)
3.8
0.1%
(61.4)
-1.2%
Acquisition Revenue (b)
16.5
0.6%
33.8
0.7%
Organic Revenue (c)
187.3
7.2%
395.1
7.9%
Current Period Revenue
2,823.4
$
7.9%
5,386.3
$
7.3%
Second Quarter
Year to Date
4

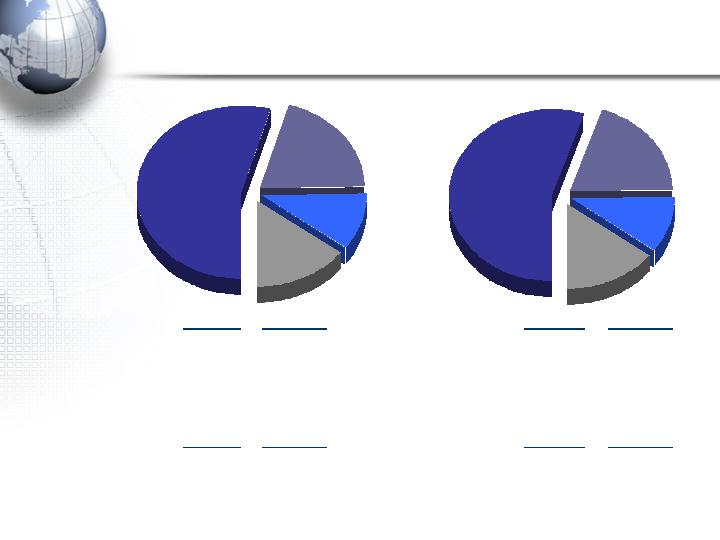
2006 Revenue By Discipline
(a) “Growth” is the year-over-year growth from the prior period.
Advertising
43.2%
PR
10.2%
CRM
34.7%
Specialty
11.9%
Advertising
43.2%
PR
10.2%
CRM
34.7%
Specialty
11.9%
Year to
Date
Second Quarter
2006
$ Mix
% Growth
(a)
$ Mix
% Growth
(a)
Advertising
1,219.3
5.7%
####
Advertising
2,324.3
5.5%
CRM
978.6
9.6%
####
CRM
1,870.4
9.8%
PR
288.6
8.9%
####
PR
548.4
5.2%
Specialty
336.9
10.8%
####
Specialty
643.2
8.9%
5
Second Quarter
2006
2006 Revenue By Geography
United
States
55.1%
UK
10.7%
Euro
Markets
19.6%
Other
14.6%
Year to Date
United
States
54.4%
UK
10.8%
Euro
Markets
20.2%
Other
14.6%
(a) “Growth” is the year-over-year growth from the prior period.
$ Mix
$ Growth
(a)
$ Mix
$ Growth
(a)
United States
1,535.4
$
107.7
$
United States
2,968.4
$
228.6
$
Organic
91.1
Organic
195.1
Acquisition
16.6
Acquisition
33.5
International
1,288.0
$
99.9
$
International
2,417.9
$
138.9
$
Organic
96.2
Organic
200.0
Acquisition
(0.1)
Acquisition
0.3
FX
3.8
FX
(61.4)
$ Mix
% Growth
(a)
$ Mix
% Growth
(a)
United States
1,535.4
$
7.5%
United States
2,968.4
$
8.3%
Euro Currency Markets
570.1
3.8%
Euro Currency Markets
1,053.9
-0.1%
United Kingdom
304.0
12.8%
United Kingdom
577.7
8.0%
Other
413.9
12.1%
Other
786.3
14.2%
6

Cash Flow – GAAP Presentation (condensed)
2006
2005
Net Income
409.7
$
376.3
$
Stock-Based Compensation Expense
33.9
47.4
Windfall Tax Benefit on Stock Compensation
-
14.0
Depreciation and Amortization
90.3
85.5
Other Non-Cash Items to Reconcile to Net Cash Provided by Operations
37.4
27.1
Other Changes in Working Capital
(374.6)
(1,120.5)
Excess Tax Benefit on Stock Compensation
(10.1)
-
Net Cash Provided by (Used in) Operations
186.6
(570.2)
Capital Expenditures
(73.0)
(67.2)
Acquisitions
(138.5)
(132.4)
Proceeds from Sale of Businesses
-
29.3
Repayment of LT Notes Receivable
13.5
72.1
Other Investing Activities, net
332.4
552.1
Net Cash Provided by Investing Activities
134.4
453.9
Dividends
(89.8)
(82.4)
Proceeds from Issuance of Debt
995.8
0.4
Repayment of Debt
(134.1)
(188.6)
Stock Repurchases
(958.6)
(524.0)
Share Transactions Under Employee Stock Plans
153.5
34.2
Excess Tax Benefit on Stock Compensation
10.1
-
Other Financing Activities
(42.7)
67.3
Net Cash Used in Financing Activities
(65.8)
(693.1)
Effect of exchange rate changes on cash and cash equivalents
1.0
(12.7)
Net Increase (Decrease) in Cash and Cash Equivalents
256.2
$
(822.1)
$
6 Months Ended June 30,
7

Current Credit Picture
(a) “Operating Income (EBIT)” and “Net Interest Expense” calculations shown are the latest twelve month (“LTM”) figures for the periods specified.
Although our bank agreements reference EBITDA, we have used EBIT for this presentation because EBITDA is a non-GAAP measure.
(b) Holders of our Convertible Notes Due 6/15/33 were offered a supplemental interest payment not to put the notes to us and to consent to certain
amendments to the notes. Holders of $427.1 million of notes consented to the amendments and were paid the supplemental interest thus
creating the Convertible Notes Due 7/1/38. Holders of $40.4 million of notes did not put or consent to the amendments and the notes
remained unchanged. The remaining holders of $132.5 million of notes put the notes to us for repurchase.
2006
2005
Operating Income (EBIT)
(a)
$
1,402
$
1,282
Net Interest Expense
(a)
$
73.5
$
45.2
EBIT / Net Interest
19.1
x
28.4
x
Net Debt / EBIT
1.5
x
1.7
x
Debt:
Bank Loans (Due Less Than 1 Year)
$
17
$
132
CP Issued Under $2.4B - 5 Year Revolver Due 6/23/11
-
-
Convertible Notes Due 2/7/31
847
847
Convertible Notes Due 7/31/32
892
892
Convertible Notes Due 6/15/33
(b)
40
600
Convertible Notes Due 7/1/38
(b)
427
-
10 Year Notes Due 4/15/16
995
-
Other Debt
19
20
Total Debt
$
3,237
$
2,491
Cash and Short Term Investments
1,135
365
Net Debt
$
2,102
$
2,126
LTM ended June 30,
8

Current Liquidity Picture
(a)
Credit facility expires June 23, 2011.
(b)
Represents uncommitted facilities in the U.S., U.K. and Canada. These amounts are excluded from our available
liquidity for purposes of this presentation.
Total Amount
Of Facility
Outstanding
Available
Committed Facilities
5 Year Revolver
(a)
2,400
$
-
$
2,400
$
Other Committed Credit Facilities
16
16
-
Total Committed Facilities
2,416
16
2,400
Uncommitted Facilities
(b)
345
-
-
(b)
Total Credit Facilities
2,761
$
16
$
2,400
$
Cash and Short Term Investments
1,135
Total Liquidity Available
3,535
$
As of June 30, 2006
9

Acquisitions Summary
10

Acquisition Related Expenditures
Note: See appendix for subsidiary acquisition profiles.
Includes acquisitions of a majority interest in new agencies resulting in their consolidation.
Includes acquisitions of additional equity interests in existing affiliate agencies resulting in their majority ownership and consolidation.
Includes acquisitions of less than a majority interest in agencies in which Omnicom did not have a prior equity interest and the acquisition
of additional interests in existing affiliated agencies that did not result in majority ownership.
Includes the acquisition of additional equity interests in already consolidated subsidiary agencies.
Includes additional consideration paid for acquisitions completed in prior periods.
(a)
(b)
(c)
(d)
(e)
New Subsidiary Acquisitions
(a)
36
$
Affiliates to Subsidiaries
(b)
-
Affiliates
(c)
3
Existing Subsidiaries
(d)
18
Earn-outs
(e)
94
Total Acquisition Expenditures
151
$
6 Months YTD 2006
11

Potential Earn-out Obligations
The following is a calculation of future earn-out obligations as of
June 30, 2006, assuming that the underlying acquired agencies
continue to perform at their current levels: (a)
(a)
The ultimate payments will vary as they are dependent on future events and changes in FX rates.
12
2006
2007
2008
2009
Thereafter
Total
44
$
146
$
105
$
55
$
55
$
405
$

Potential Obligations
(a) The ultimate payments will vary as they are dependent on future events and changes in FX rates.
In conjunction with certain transactions Omnicom has agreed to
acquire (at the sellers’ option) additional equity interests. If these rights
are exercised, there would likely be an increase in our net income as a
result of our increased ownership and the reduction of minority interest
expense. The following is a calculation of these potential future
obligations (as of June 30, 2006), assuming these underlying acquired
agencies continue to perform at their current levels: (a)
Currently
Exercisable
Not Currently
Exercisable
Total
Subsidiary Agencies
131
$
82
$
213
$
Affiliated Agencies
48
7
55
Total
179
$
89
$
268
$
13

Second Quarter Acquisitions
Entertainment Marketing Partners
Entertainment Marketing Partners ("EMP") is an entertainment-
based media and marketing solutions company. EMP provides
clients with access to the entertainment community through
relationships with studios, networks and production companies,
sports leagues around the world, and video game developers.
EMP is located in Los Angeles and New York City and will become
part of Ketchum Public Relations.
14

Second Quarter Acquisitions
Harrison & Wolf
Harrison & Wolf (H&W) is a corporate communications agency
providing strategic consultancy, contract publishing, advertising
and corporate design services.
The agency is located in Paris, France and will be part of the
Corporate Communications Group of TBWA.
15

Second Quarter Acquisitions
EVB
EVB is a full-service advertising agency that specializes in using
immersive content to create engaging brand experiences. EVB's
consumer-centric approach blends strategy with entertainment
and interactivity to develop new marketing campaigns that
generate brand awareness, deepen consumer relationships and
instill long-term brand loyalty.
EVB is located in San Francisco, California and will be part of the
DAS Group of Companies.
16