
Omnicom Group
THIRD QUARTER 2006 RESULTS
Investor Presentation
October 24, 2006
Exhibit 99.2

The following materials have been prepared for use in the October 24, 2006 conference call on Omnicom’s results of operations for the quarter
ended September 30, 2006. The call will be archived on the Internet at http://www.omnicomgroup.com/financialwebcasts ..
Forward-Looking Statements
Certain of the statements in this document constitute forward-looking statements within the meaning of the Private Securities Litigation Act of
1995. These statements relate to future events or future financial performance and involve known and unknown risks and other factors that may
cause our actual or our industry’s results, levels of activity or achievement to be materially different from those expressed or implied by any
forward-looking statements. These risks and uncertainties include, but are not limited to, our future financial condition and results of operations,
changes in general economic conditions, competitive factors, changes in client communication requirements, the hiring and retention of human
resources and our international operations, which are subject to the risks of currency fluctuations and exchange controls. In some cases, forward-
looking statements can be identified by terminology such as “may,” “will,” “could,” “would,” “should,” “expect,” “plan,” “anticipate,” “intend,”
“believe,” “estimate,” “predict,” “potential” or “continue” or the negative of those terms or other comparable terminology. These statements are
present expectations. Actual events or results may differ materially. We undertake no obligation to update or revise any forward-looking
statement.
Other Information
All dollar amounts are in millions except for EPS. The following financial information contained in this document has not been audited, although
some of it has been derived from Omnicom’s historical financial statements, including its audited financial statements. In addition, industry,
operational and other non-financial data contained in this document have been derived from sources we believe to be reliable, but we have not
independently verified such information, and we do not, nor does any other person, assume responsibility for the accuracy or completeness of
that information.
The inclusion of information in this presentation does not mean that such information is material or that disclosure of such information is required.
1

2006 vs. 2005 P&L Summary
2
2006
2005
%
2006
2005
%
Revenue
2,774.3
$
2,522.9
$
10.0%
8,160.7
$
7,541.7
$
8.2%
Operating Income
307.4
274.5
12.0%
1,009.3
913.7
10.5%
% Margin
11.1%
10.9%
12.4%
12.1%
Net Interest Expense
26.7
16.3
67.4
42.7
Profit Before Tax
280.7
258.2
8.7%
941.9
871.0
8.1%
% Margin
10.1%
10.2%
11.5%
11.5%
Taxes
92.9
86.9
315.5
297.4
% Tax Rate
33.1%
33.7%
33.5%
34.1%
Profit After Tax
187.8
171.3
9.6%
626.4
573.6
9.2%
Equity in Affiliates
6.3
6.9
17.5
17.2
Minority Interest
(17.0)
(16.5)
(57.1)
(52.7)
Net Income
177.1
$
161.7
$
9.5%
586.8
$
538.1
$
9.1%
Third Quarter
Year to Date

2006 vs. 2005 Earnings Per Share
Earnings per Share:
Basic
Diluted
Growth Rate, Diluted
Weighted Average Shares (millions):
Basic
Diluted
Dividend Declared Per Share
$ 1.05
1.04
15.6%
169.4
170.9
$0.250
2005
2006
Third Quarter
$ 0.90
0.90
179.3
180.6
$0.225
$ 3.41
3.38
14.6%
172.2
173.8
$0.750
2005
2006
Year to Date
$ 2.97
2.95
181.1
182.5
$0.675
3

2006 vs. 2005 P&L Summary
– adjusted comparison 3rd Quarter
4
* See footnotes on the following page.
Reported
Disposal
Activity
(a)
Adjusted
(b)
Reported
%
(c)
Revenue
2,774.3
$
-
$
2,774.3
$
2,522.9
$
10.0%
Operating Income
307.4
0.5
307.9
274.5
12.2%
% Margin
11.1%
11.1%
10.9%
Net Interest Expense
26.7
-
26.7
16.3
Profit Before Tax
280.7
0.5
281.2
258.2
8.9%
% Margin
10.1%
10.1%
10.2%
Taxes
92.9
1.8
94.7
86.9
% Tax Rate
33.1%
33.7%
33.7%
Profit After Tax
187.8
(1.3)
186.5
171.3
8.9%
Equity in Affiliates
6.3
-
6.3
6.9
Minority Interest
(17.0)
-
(17.0)
(16.5)
Net Income
177.1
$
(1.3)
$
175.8
$
161.7
$
8.7%
Diluted EPS
1.04
$
(0.01)
1.03
$
0.90
$
14.4%
2006
2005

2006 vs. 2005 P&L Summary
– adjusted comparison 3rd Quarter footnotes
(a)
During the third quarter of 2006, we disposed of a U.S. based healthcare business and
several small businesses. The sale of the healthcare business resulted in a high book
tax rate primarily caused by the non-deductibility of goodwill. This increase in income
tax expense was more than offset by a one-time reduction of income tax expense from
the resolution of uncertainties related to changes in certain foreign tax laws .. The
aggregate impact of these events on the 2006 third quarter and year-to-date period was
a decrease in profit before tax of $0.5 million, a decrease in tax expense of $1.8 million
and an increase in net income of $1.3 million.
(b)
As a result of the adjustments above, the “Adjusted” numbers are non-GAAP measures.
We believe that by making the adjustments above, the “Adjusted” numbers are more
comparable to previous quarters and thus more meaningful for the purpose of this
analysis.
(c)
Represents the change in the “Adjusted September 30, 2006” numbers compared to the
“Reported September 30, 2005” numbers.
5

2006 Total Revenue Growth
(a)
To calculate the FX impact, we first convert the current period’s local currency revenue using the average exchange rates from the equivalent prior period to arrive at constant currency revenue. The FX impact equals the difference between the current period revenue in U.S. dollars and the current period revenue in constant currency.
(b)
Acquisition revenue is the aggregate of the applicable prior period revenue of the acquired businesses. Netted against this number is the revenue of any business included in the prior period reported revenue that was disposed of subsequent to the prior period.
(c)
Organic revenue is calculated by subtracting both the acquisition revenue and the FX impact from total revenue growth.
6
$
%
$
%
Prior Period Revenue
2,522.9
$
7,541.7
$
Foreign Exchange (FX) Impact (a)
47.9
1.9%
(13.4)
-0.2%
Acquisition Revenue (b)
(4.4)
-0.1%
29.2
0.4%
Organic Revenue (c)
207.9
8.2%
603.2
8.0%
Current Period Revenue
2,774.3
$
10.0%
8,160.7
$
8.2%
Third Quarter
Year to Date
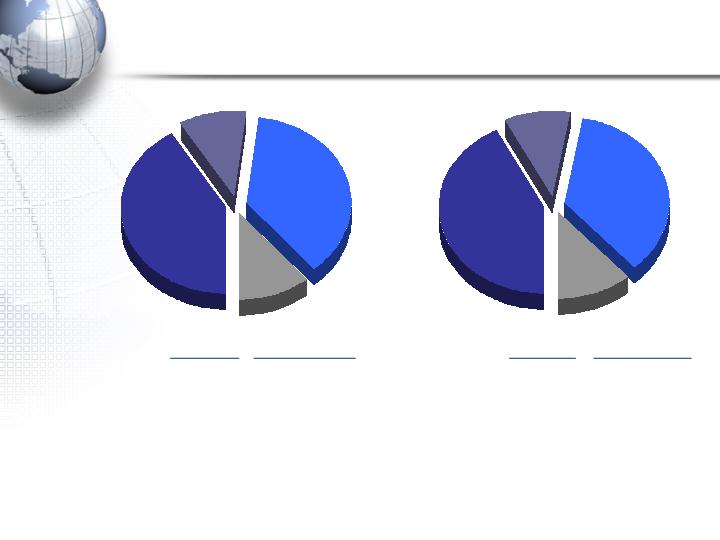
2006 Revenue By Discipline
(a) “Growth” is the year-over-year growth from the prior period.
Advertising
41.4%
PR
10.5%
CRM
36.9%
Specialty
11.2%
Advertising
42.6%
PR
10.3%
CRM
35.4%
Specialty
11.7%
Year to
Date
Third Quarter
2006
7
Pie Chart
$ Mix
% Growth(a)
$ Mix
% Growth(a)
Advertising
1,149.9
6.5%
####
Advertising
3,474.2
5.8%
CRM
1,023.4
16.7%
####
CRM
2,893.8
12.2%
PR
290.9
13.1%
####
PR
839.3
7.8%
Specialty
310.1
0.4%
####
Specialty
953.4
6.0%
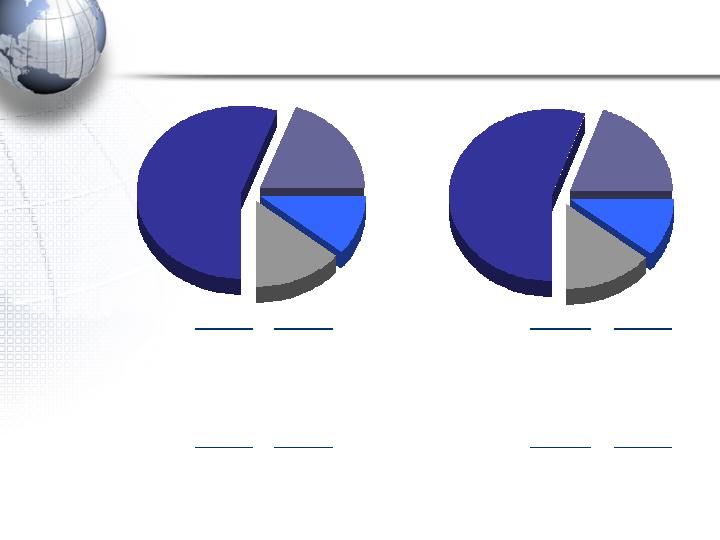
Third Quarter
2006
United
States
55.3%
UK
10.8%
Euro
Markets
19.6%
Other
14.3%
Year to Date
United
States
55.5%
UK
11.1%
Euro
Markets
19.6%
Other
13.8%
8
(a) “Growth” is the year-over-year growth from the prior period.
2006 Revenue By Geography
$ Mix
$ Growth(a)
$ Mix
$ Growth(a)
United States
1,540.5
$
111.9
$
United States
4,508.9
$
340.5
$
Organic
112.0
Organic
307.1
Acquisition
(0.1)
Acquisition
33.4
International
1,233.8
$
139.5
$
International
3,651.8
$
278.5
$
Organic
95.9
Organic
296.1
Acquisition
(4.3)
Acquisition
(4.2)
FX
47.9
FX
(13.4)
$ Mix
% Growth(a)
$ Mix
% Growth(a)
United States
1,540.5
$
7.8%
United States
4,508.9
$
8.2%
Euro Currency Markets
542.4
13.9%
Euro Currency Markets
1,596.2
4.2%
United Kingdom
307.2
18.1%
United Kingdom
884.9
11.3%
Other
384.2
7.3%
Other
1,170.7
11.9%

Cash Flow – GAAP Presentation (condensed)
9
2006
2005
Net Income
586.8
$
538.1
$
Stock-Based Compensation Expense
52.7
67.5
Windfall Tax Benefit on Stock Compensation
-
14.5
Depreciation and Amortization
137.5
128.1
Other Non-Cash Items to Reconcile to Net Cash Provided by Operations
51.4
41.7
Other Changes in Working Capital
(423.1)
(1,094.3)
Excess Tax Benefit on Stock Compensation
(15.0)
-
Net Cash Provided by (Used in) Operations
390.3
(304.4)
Capital Expenditures
(119.5)
(102.4)
Acquisitions
(208.6)
(192.2)
Proceeds from Sale of Businesses
31.4
29.3
Repayment of LT Notes Receivable
13.4
61.8
Other Investing Activities, net
329.0
559.3
Net Cash Provided by Investing Activities
45.7
355.8
Dividends
(133.1)
(123.8)
Proceeds from Issuance of Debt
996.0
0.7
Repayment of Debt
(299.2)
(189.2)
Stock Repurchases
(1,082.2)
(644.2)
Share Transactions Under Employee Stock Plans
166.6
51.3
Excess Tax Benefit on Stock Compensation
15.0
-
Other Financing Activities
(64.5)
104.5
Net Cash Used in Financing Activities
(401.4)
(800.7)
Effect of exchange rate changes on cash and cash equivalents
(62.1)
(20.7)
Net Increase (Decrease) in Cash and Cash Equivalents
(27.5)
$
(770.0)
$
9 Months Ended September 30,

Current Credit Picture
10
(a) “Operating Income (EBIT)” and “Net Interest Expense” calculations shown are the latest twelve month (“LTM”) figures for the periods specified.
Although our bank agreements reference EBITDA, we have used EBIT for this presentation because EBITDA is a non-GAAP measure.
(b) Holders of our Convertible Notes Due 6/15/33 were offered a supplemental interest payment not to put the notes to us for repurchase and to
consent to certain amendments to the notes. Holders of $428.1 million of notes consented to the amendments and were paid the supplemental
interest, thus creating the Convertible Notes Due 7/1/38. Holders of $39.4 million of notes did not put or consent to the amendments, and
the terms of their notes remain unchanged. The remaining holders of $132.5 million of notes put the notes to us for repurchase.
2006
2005
Operating Income (EBIT) (a)
$
1,435
$
1,309
Net Interest Expense (a)
$
84.0
$
52.7
EBIT / Net Interest
17.1
x
24.8
x
Net Debt / EBIT
1.5
x
1.7
x
Debt:
Bank Loans (Due Less Than 1 Year)
$
12
$
54
CP Issued Under $2.5B - 5 Year Revolver Due 6/23/11
-
160
Convertible Notes Due 2/7/31
847
847
Convertible Notes Due 7/31/32
727
892
Convertible Notes Due 6/15/33(b)
39
600
Convertible Notes Due 7/1/38(b)
428
-
10 Year Notes Due 4/15/16
995
-
Other Debt
20
20
Total Debt
$
3,068
$
2,573
Cash and Short Term Investments
849
410
Net Debt
$
2,219
$
2,163
LTM ended September 30,

Current Liquidity Picture
11
(a)
Credit facility expires June 23, 2011.
(b)
Represents uncommitted facilities in the U.S., U.K. and Canada. These amounts are excluded from our available
liquidity for purposes of this presentation.
Total Amount
Of Facility
Outstanding
Available
Committed Facilities
5 Year Revolver (a)
2,500
$
-
$
2,500
$
Other Committed Credit Facilities
12
12
-
Total Committed Facilities
2,512
12
2,500
Uncommitted Facilities(b)
345
-
-
(b)
Total Credit Facilities
2,857
$
12
$
2,500
$
Cash and Short Term Investments
849
Total Liquidity Available
3,349
$
As of September 30, 2006

Acquisitions Summary
12

Acquisition Related Expenditures
13
Note: See appendix for subsidiary acquisition profiles.
Includes acquisitions of a majority interest in new agencies resulting in their consolidation.
Includes acquisitions of additional equity interests in existing affiliate agencies resulting in their majority ownership and consolidation.
Includes acquisitions of less than a majority interest in agencies in which Omnicom did not have a prior equity interest and the acquisition
of additional interests in existing affiliated agencies that did not result in majority ownership.
Includes the acquisition of additional equity interests in already consolidated subsidiary agencies.
Includes additional consideration paid for acquisitions completed in prior periods.
(a)
(b)
(c)
(d)
(e)
New Subsidiary Acquisitions (a)
61
$
Affiliates to Subsidiaries (b)
-
Affiliates (c)
13
Existing Subsidiaries (d)
23
Earn-outs (e)
125
Total Acquisition Expenditures
222
$
9 Months YTD 2006

Potential Earn-out Obligations
The following is a calculation of future earn-out obligations as of
September 30, 2006, assuming that the underlying acquired
agencies continue to perform at their current levels: (a)
(a)
The ultimate payments will vary as they are dependent on future events and changes in FX rates.
14
2006
2007
2008
2009
Thereafter
Total
13
$
156
$
110
$
72
$
92
$
443
$

Potential Obligations
15
(a) The ultimate payments will vary as they are dependent on future events and changes in FX rates.
In conjunction with certain transactions, Omnicom has agreed to
acquire (at the sellers’ option) additional equity interests. If these rights
are exercised, there would likely be an increase in our net income as a
result of our increased ownership and the reduction of minority interest
expense. The following is a calculation of these potential future
obligations (as of September 30, 2006), assuming these underlying
acquired agencies continue to perform at their current levels: (a)
Currently
Exercisable
Not Currently
Exercisable
Total
Subsidiary Agencies
131
$
83
$
214
$
Affiliated Agencies
52
7
59
Total
183
$
90
$
273
$

Third Quarter Acquisitions
Colangelo Synergy Marketing
Colangelo is a sales promotion agency providing strategic planning,
concept development, media planning and buying, creative
development, field marketing, interactive media services, event
management, packaging design and production services. The
company serves clients in the consumer products, information
technology and lifestyle marketing industries.
Colangelo is located in Darien, Connecticut and Chicago, Illinois.
16

Third Quarter Acquisitions
Gotocustomer Services India
Gotocustomer Services India is a leading provider of integrated
marketing services to multinationals and local clients across India.
The company currently provides services to industry leading clients
in information technology, telecom products and services, consumer
products, media and real estate.
Gotocustomer is located in New Delhi, India.
17

Third Quarter Acquisitions
Go! Productions
Go! Productions develops and executes tradeshow and corporate
meeting events for multinational clients. Additionally, the company
provides consulting services around brand positioning, creative and
strategic event planning and execution.
Go! Productions is located in Atlanta, Georgia, with an additional
location in Los Angeles, California. Go! Productions is a member of
Radiate Group’s automotive group.
18

Third Quarter Acquisitions
Rodgers Townsend
Rodgers Townsend is a full-service creative communications agency
providing advertising, direct marketing, media planning, interactive
marketing and design services to its clients. Rodgers Townsend has
been recognized internationally by One Show, National ADDY’s and
Bronze Lions at the International Advertising Festival at Cannes.
Rodgers Townsend is located in St. Louis, Missouri.
19