
Omnicom Group
FOURTH QUARTER 2006 RESULTS
Investor Presentation
February 13, 2007
Exhibit 99.2

The following materials have been prepared for use in the February 13, 2007 conference call on Omnicom’s results of
operations for the year ended December 31, 2006. The call will be archived on the Internet at
http://www.omnicomgroup.com/financialwebcasts.
Forward-Looking Statements
Certain of the statements in this document constitute forward-looking statements within the meaning of the Private
Securities Litigation Act of 1995. These statements relate to future events or future financial performance and involve
known and unknown risks and other factors that may cause our actual or our industry’s results, levels of activity or
achievement to be materially different from those expressed or implied by any forward-looking statements. These risks
and uncertainties include, but are not limited to, our future financial condition and results of operations, changes in
general economic conditions, competitive factors, changes in client communication requirements, the hiring and retention
of human resources and our international operations, which are subject to the risks of currency fluctuations and
exchange controls. In some cases, forward-looking statements can be identified by terminology such as “may,” “will,”
“could,” “would,” “should,” “expect,” “plan,” “anticipate,” “intend,” “believe,” “estimate,” “predict,” “potential” or “continue” or
the negative of those terms or other comparable terminology. These statements are present expectations. Actual events
or results may differ materially. We undertake no obligation to update or revise any forward-looking statement.
Other Information
All dollar amounts are in millions except for EPS. The following financial information contained in this document has not
been audited, although some of it has been derived from Omnicom’s historical financial statements, including its audited
financial statements. In addition, industry, operational and other non-financial data contained in this document have been
derived from sources we believe to be reliable, but we have not independently verified such information, and we do not,
nor does any other person, assume responsibility for the accuracy or completeness of that information.
The inclusion of information in this presentation does not mean that such information is material or that disclosure of such
information is required.
1

2006 vs. 2005 P&L Summary
2
2006
2005
%
2006
2005
%
Revenue
3,216.2
$
2,939.4
$
9.4%
11,376.9
$
10,481.1
$
8.5%
Operating Income
474.2
426.1
11.3%
1,483.5
1,339.8
10.7%
% Margin
14.7%
14.5%
13.0%
12.8%
Net Interest Expense
24.1
16.5
91.6
59.2
Profit Before Tax
450.1
409.6
9.9%
1,391.9
1,280.6
8.7%
% Margin
14.0%
13.9%
12.2%
12.2%
Taxes
151.4
137.9
466.9
435.3
% Tax Rate
33.6%
33.7%
33.5%
34.0%
Profit After Tax
298.7
271.7
9.9%
925.0
845.3
9.4%
Equity in Affiliates
12.0
10.4
29.6
27.6
Minority Interest
(33.5)
(29.5)
(90.6)
(82.2)
Net Income
277.2
$
252.6
$
9.7%
864.0
$
790.7
$
9.3%
Fourth Quarter
Full Year

2006 vs. 2005 Earnings Per Share
Earnings per Share:
Basic
Diluted
Growth Rate, Diluted
Weighted Average Shares (millions):
Basic
Diluted
Dividend Declared Per Share
$ 1.64
1.62
14.9
169.1
171.3
$0.25
2005
2006
Fourth Quarter
$ 1.42
1.41
178.2
179.6
$0.25
$ 5.04
4.99
14.4
171.4
173.1
$1.00
2005
2006
Full Year
$ 4.38
4.36
180.4
181.8
$0.925
%
%
3

2006 Total Revenue Growth
(a)
To calculate the FX impact, we first convert the current period’s local currency revenue using the average exchange rates from the
equivalent prior period to arrive at constant currency revenue. The FX impact equals the difference between the current period
revenue in U.S. dollars and the current period revenue in constant currency.
(b)
Acquisition revenue is the aggregate of the applicable prior period revenue of the acquired businesses. Netted against this number
is the revenue of any business included in the prior period reported revenue that was disposed of subsequent to the prior period.
(c)
Organic revenue is calculated by subtracting both the acquisition revenue and the FX impact from total revenue growth.
4
$
%
$
%
Prior Period Revenue
2,939.4
$
10,481.1
$
Foreign Exchange (FX) Impact (a)
85.8
2.9%
72.3
0.7%
Acquisition Revenue (b)
(3.5)
-0.1%
25.9
0.2%
Organic Revenue (c)
194.5
6.6%
797.6
7.6%
Current Period Revenue
3,216.2
$
9.4%
11,376.9
$
8.5%
Fourth Quarter
Full Year
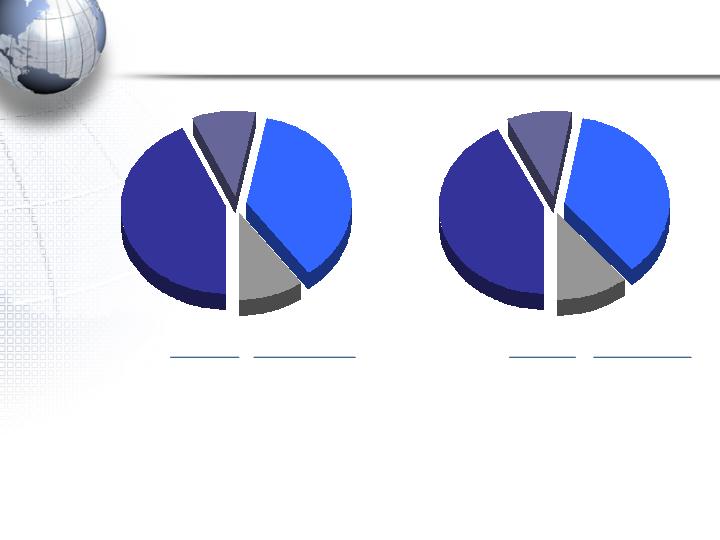
2006 Revenue By Discipline
(a) “Growth” is the year-over-year growth from the prior period.
Advertising
43.3%
PR
9.7%
CRM
36.9%
Specialty
10.1%
Advertising
42.8%
PR
10.1%
CRM
35.9%
Specialty
11.2%
Full Year
Fourth Quarter
5
Pie Chart
$ Mix
% Growth(a)
$ Mix
% Growth(a)
Advertising
1,392.2
6.6%
####
Advertising
4,866.4
6.0%
CRM
1,187.4
15.0%
####
CRM
4,081.1
13.0%
PR
310.7
16.3%
9.7%
PR
1,150.1
10.0%
Specialty
325.9
-2.4%
####
Specialty
1,279.3
3.7%
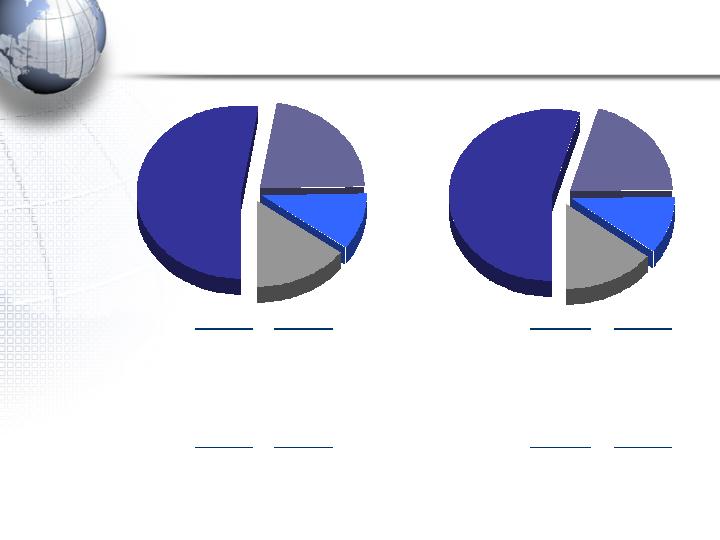
Fourth Quarter
United
States
54.4%
UK
10.8%
Euro
Markets
20.3%
Other
14.5%
Full Year
United
States
52.4%
UK
10.7%
Euro
Markets
22.3%
Other
14.6%
6
(a) “Growth” is the year-over-year growth from the prior period.
2006 Revenue By Geography
$ Mix
$ Growth(a)
$ Mix
$ Growth(a)
United States
1,685.1
$
109.6
$
United States
6,194.0
$
450.1
$
Organic
108.4
Organic
415.5
Acquisition
1.2
Acquisition
34.6
International
1,531.1
$
167.2
$
International
5,182.9
$
445.7
$
Organic
86.1
Organic
382.1
Acquisition
(4.7)
Acquisition
(8.7)
FX
85.8
FX
72.3
$ Mix
% Growth(a)
$ Mix
% Growth(a)
United States
1,685.1
$
7.0%
United States
6,194.0
$
7.8%
Euro Currency Markets
717.2
14.8%
Euro Currency Markets
2,313.5
7.3%
United Kingdom
344.9
12.2%
United Kingdom
1,229.7
11.6%
Other
469.0
8.6%
Other
1,639.7
10.9%

Cash Flow – GAAP Presentation (condensed)
7
2006
2005
Net Income
864.0
$
790.7
$
Stock-Based Compensation Expense
71.1
87.0
Windfall Tax Benefit on Stock Compensation
-
15.8
Depreciation and Amortization
190.0
175.2
Other Non-Cash Items to Reconcile to Net Cash Provided by Operations
78.2
73.7
Other Changes in Working Capital
564.5
(151.2)
Excess Tax Benefit on Stock Compensation
(26.6)
-
Net Cash Provided by Operations
1,741.2
991.2
Capital Expenditures
(177.6)
(162.7)
Acquisitions
(236.3)
(294.5)
Proceeds from Sale of Businesses
31.4
29.3
Repayment of LT Notes Receivable
13.5
65.8
Other Investing Activities, net
180.2
199.8
Net Cash Used in Investing Activities
(188.8)
(162.3)
Dividends
(175.8)
(164.0)
Proceeds from Issuance of Debt
996.6
0.9
Repayment of Debt
(300.4)
(188.4)
Stock Repurchases
(1,344.6)
(731.8)
Share Transactions Under Employee Stock Plans
297.9
74.3
Excess Tax Benefit on Stock Compensation
26.6
-
Other Financing Activities
(83.8)
(107.8)
Net Cash Used in Financing Activities
(583.5)
(1,116.8)
Effect of exchange rate changes on cash and cash equivalents
(65.2)
(41.9)
Net Increase (Decrease) in Cash and Cash Equivalents
903.7
$
(329.8)
$
Full Year

Current Credit Picture
8
(a) “Operating Income (EBIT)” and “Net Interest Expense” calculations shown are the latest twelve month (“LTM”) figures for the periods specified.
Although our bank agreements reference EBITDA, we have used EBIT for this presentation because EBITDA is a non-GAAP measure.
(b) Holders of our Convertible Notes Due 6/15/33 were offered a supplemental interest payment not to put the notes to us for repurchase and to
consent to certain amendments to the notes. Holders of $428.1 million of notes consented to the amendments and were paid the supplemental
interest, thus creating the Convertible Notes Due 7/1/38. Holders of $39.4 million of notes did not put or consent to the amendments, and
the terms of their notes remain unchanged. The remaining holders of $132.5 million of notes put the notes to us for repurchase.
2006
2005
Operating Income (EBIT) (a)
$
1,484
$
1,340
Net Interest Expense (a)
$
91.6
$
59.2
EBIT / Net Interest
16.2
x
22.6
x
Net Debt / EBIT
0.8
x
0.9
x
Debt:
Bank Loans (Due Less Than 1 Year)
$
11
$
15
CP Issued Under $2.5B - 5 Year Revolver Due 6/23/11
-
-
Convertible Notes Due 2/7/31
847
847
Convertible Notes Due 7/31/32
727
892
Convertible Notes Due 6/15/33 (b)
39
600
Convertible Notes Due 7/1/38 (b)
428
-
10 Year Notes Due 4/15/16
996
-
Other Debt
18
19
Total Debt
$
3,066
$
2,373
Cash and Short Term Investments
1,929
1,210
Net Debt
$
1,137
$
1,163
Full Year

Current Liquidity Picture
9
(a)
Credit facility expires June 23, 2011.
(b)
Represents uncommitted facilities in the U.S., U.K. and Canada. These amounts are excluded from our available
liquidity for purposes of this presentation.
Total Amount
Of Facility
Outstanding
Available
Committed Facilities
5 Year Revolver (a)
2,500
$
-
$
2,500
$
Other Committed Credit Facilities
11
11
-
Total Committed Facilities
2,511
11
2,500
Uncommitted Facilities (b)
352
-
-
(b)
Total Credit Facilities
2,863
$
11
$
2,500
$
Cash and Short Term Investments
1,929
Total Liquidity Available
4,429
$
As of December 31, 2006

Acquisitions Summary
10

Acquisition Related Expenditures
11
Note: See appendix for subsidiary acquisition profiles.
Includes acquisitions of a majority interest in new agencies resulting in their consolidation.
Includes acquisitions of additional equity interests in existing affiliate agencies resulting in their majority ownership and consolidation.
Includes acquisitions of less than a majority interest in agencies in which Omnicom did not have a prior equity interest and the acquisition
of additional interests in existing affiliated agencies that did not result in majority ownership.
Includes the acquisition of additional equity interests in already consolidated subsidiary agencies.
Includes additional consideration paid for acquisitions completed in prior periods.
(a)
(b)
(c)
(d)
(e)
New Subsidiary Acquisitions (a)
78
$
Affiliates to Subsidiaries (b)
-
Affiliates (c)
14
Existing Subsidiaries (d)
60
Earn-outs (e)
159
Total Acquisition Expenditures
311
$
Full Year 2006

Potential Earn-out Obligations
The following is a calculation of future earn-out obligations as of
December 31, 2006, assuming that the underlying acquired
agencies continue to perform at their current levels: (a)
(a)
The ultimate payments will vary as they are dependent on future events and changes in FX rates.
12
2007
2008
2009
2010
Thereafter
Total
164
$
108
$
77
$
83
$
16
$
448
$

Potential Obligations
13
(a) The ultimate payments will vary as they are dependent on future events and changes in FX rates.
In conjunction with certain transactions, Omnicom has agreed to
acquire (at the sellers’ option) additional equity interests. If these rights
are exercised, there would likely be an increase in our net income as a
result of our increased ownership and the reduction of minority interest
expense. The following is a calculation of these potential future
obligations (as of December 31, 2006), assuming these underlying
acquired agencies continue to perform at their current levels: (a)
Currently
Exercisable
Not Currently
Exercisable
Total
Subsidiary Agencies
145
$
82
$
227
$
Affiliated Agencies
48
8
56
Total
193
$
90
$
283
$

Fourth Quarter Acquisitions
180 Communications
180 Communications is a full-service international advertising agency
headquartered in Amsterdam, the Netherlands. 180 Communications
has been one of the most awarded independent agencies of the past
several years.
180 Communications will operate as an independent agency within
Omnicom.
14
Fourth Quarter Acquisitions
BBL/HFM
BBL-HFM is a full-service communications agency, providing
advertising, direct marketing, media planning and recruitment
advertising services. The company is located in The Hague, the
Netherlands, and its clients primarily comprise governmental and
other public authorities.
The company has been merged with an existing agency within the
TBWA Netherlands group to form HFM Bovaco.
15

Fourth Quarter Acquisitions
Flamingo International
Flamingo International is a qualitative market research agency that
specializes in delivering international marketing and product
development services to consumer brand businesses. These
services include brand consulting, focus group facilitation and
analysis, online research, semiotics, ethnography and youth
marketing consulting.
Flamingo International has offices in London, San Francisco and
Singapore and will operate as an independent agency within DAS.
16

Fourth Quarter Acquisitions
Weapon 7
Weapon 7 is a digital interactive television consulting agency
providing advertisement design and production, digital interactive
strategy consulting and mobile content production. The agency
serves multinational clients in the United Kingdom and Europe.
Weapon 7 is located in London and is part of DAS’s Zulu Group in
the U.K.
17