
Omnicom Group
THIRD QUARTER 2007 RESULTS
Investor Presentation
October 23, 2007

The following materials have been prepared for use in the October 23, 2007 conference call on Omnicom’s results of
operations for the quarter ended September 30, 2007. The call will be archived on the Internet at
http://www.omnicomgroup.com/financialwebcasts.
Forward-Looking Statements
Certain of the statements in this document constitute forward-looking statements within the meaning of the Private
Securities Litigation Act of 1995. These statements relate to future events or future financial performance and involve
known and unknown risks and other factors that may cause our actual or our industry’s results, levels of activity or
achievement to be materially different from those expressed or implied by any forward-looking statements. These risks
and uncertainties include, but are not limited to, our future financial condition and results of operations, changes in
general economic conditions, competitive factors, changes in client communication requirements, the hiring and retention
of human resources and our international operations, which are subject to the risks of currency fluctuations and exchange
controls. In some cases, forward-looking statements can be identified by terminology such as “may,” “will,” “could,”
“would,” “should,” “expect,” “plan,” “anticipate,” “intend,” “believe,” “estimate,” “predict,” “potential” or “continue” or the
negative of those terms or other comparable terminology. These statements are present expectations. Actual events or
results may differ materially. We undertake no obligation to update or revise any forward-looking statement.
Other Information
All dollar amounts are in millions except for EPS. The following financial information contained in this document has not
been audited, although some of it has been derived from Omnicom’s historical financial statements, including its audited
financial statements. In addition, industry, operational and other non-financial data contained in this document have been
derived from sources we believe to be reliable, but we have not independently verified such information, and we do not,
nor does any other person, assume responsibility for the accuracy or completeness of that information.
The inclusion of information in this presentation does not mean that such information is material or that disclosure of such
information is required.
1

2007 vs. 2006 P&L Summary
2
2007
2006
%
2007
2006
%
Revenue
3,101.4
$
2,774.3
$
11.8%
9,068.1
$
8,160.7
$
11.1%
Operating Profit
350.2
307.4
13.9%
1,127.3
1,009.3
11.7%
% Margin
11.3%
11.1%
12.4%
12.4%
Net Interest Expense
19.3
26.7
59.8
67.4
Profit Before Tax
330.9
280.7
17.9%
1,067.5
941.9
13.3%
% Margin
10.7%
10.1%
11.8%
11.5%
Taxes
112.1
92.9
361.4
315.5
% Tax Rate
33.9%
33.1%
33.9%
33.5%
Profit After Tax
218.8
187.8
16.5%
706.1
626.4
12.7%
Equity in Affiliates
8.0
6.3
25.8
17.5
Minority Interest
(24.6)
(17.0)
(70.0)
(57.1)
Net Income
202.2
$
177.1
$
14.2%
661.9
$
586.8
$
12.8%
Third Quarter
Year to Date

2007 vs. 2006 Earnings Per Share (a)
Earnings per Share:
Basic
Diluted
Growth Rate, Diluted
Weighted Average Shares (millions):
Basic
Diluted
Dividend Declared Per Share
$ 0.62
0.62
19.2
324.0
328.2
$0.150
2006
2007
Third Quarter
$ 0.52
0.52
338.8
341.9
$0.125
$ 2.02
2.00
18.3
327.0
331.8
$0.425
2006
2007
Year to Date
$ 1.70
1.69
344.4
347.5
$0.375
%
%
(a)
In connection with our two-for-one stock split distributed on June 25, 2007, which was effected in the form of a 100%
stock dividend, all current and prior period per share amounts and weighted average share amounts have been
adjusted in accordance with SFAS No. 128, “Earnings per Share.”
3

2007 Total Revenue Growth
(a)
To calculate the FX impact, we first convert the current period’s local currency revenue using the average exchange
rates from the equivalent prior period to arrive at constant currency revenue. The FX impact equals the difference
between the current period revenue in U.S. dollars and the current period revenue in constant currency.
(b)
Acquisition revenue is the aggregate of the applicable prior period revenue of the acquired businesses. Netted against
this number is the revenue of any business included in the prior period reported revenue that was disposed of
subsequent to the prior period.
(c)
Organic revenue is calculated by subtracting both the acquisition revenue and the FX impact from total revenue growth.
4
$
%
$
%
Prior Period Revenue
2,774.3
$
8,160.7
$
Foreign Exchange (FX) Impact (a)
99.1
3.6%
275.1
3.4%
Acquisition Revenue (b)
33.4
1.2%
41.6
0.5%
Organic Revenue (c)
194.6
7.0%
590.7
7.2%
Current Period Revenue
3,101.4
$
11.8%
9,068.1
$
11.1%
Third Quarter
Year to Date
5
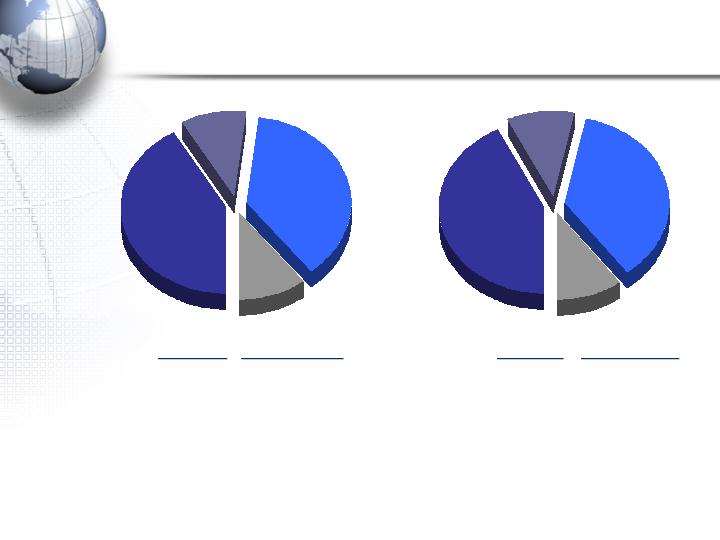
Third Quarter
Year to Date
Advertising
42.9%
PR
10.3%
CRM
36.4%
Specialty
10.4%
Advertising
41.7%
PR
10.2%
CRM
37.6%
Specialty
10.5%
(a) “Growth” is the year-over-year increase or decrease from the prior period.
2007 Revenue By Discipline
Pie Chart
$ Mix
% Growth (a)
$ Mix
% Growth (a)
Advertising
1,292.8
12.1%
####
Advertising
3,885.1
11.5%
CRM
1,165.8
14.2%
####
CRM
3,303.5
14.4%
PR
317.8
9.7%
####
PR
933.7
11.7%
Specialty
325.0
4.8%
####
Specialty
945.8
-0.8%
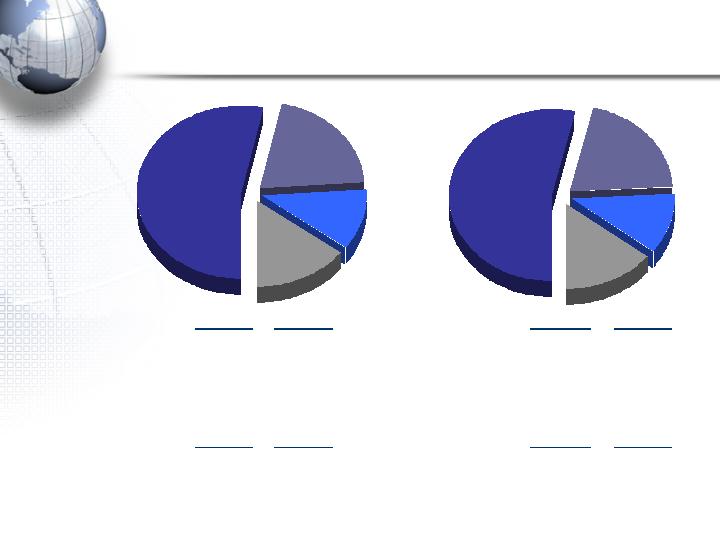
Third Quarter
United
States
53.6%
UK
11.3%
Euro
Markets
20.7%
Other
14.4%
Year to Date
United
States
53.4%
UK
11.4%
Euro
Markets
20.5%
Other
14.7%
6
(a) “Growth” is the year-over-year increase or decrease from the prior period.
2007 Revenue By Geography
$ Mix
$ Growth(a)
$ Mix
$ Growth(a)
United States
1,654.9
$
114.4
$
United States
4,858.4
$
349.5
$
Organic
92.8
Organic
324.9
Acquisition
21.6
Acquisition
24.6
International
1,446.5
$
212.7
$
International
4,209.7
$
557.9
$
Organic
101.8
Organic
265.8
Acquisition
11.8
Acquisition
17.0
FX
99.1
FX
275.1
$ Mix
% Growth(a)
$ Mix
% Growth(a)
United States
1,654.9
$
7.4%
United States
4,858.4
$
7.8%
Euro Currency Markets
635.5
17.0%
Euro Currency Markets
1,878.5
17.5%
United Kingdom
352.6
14.8%
United Kingdom
1,026.0
15.9%
Other
458.4
19.5%
Other
1,305.2
11.7%

Cash Flow – GAAP Presentation (condensed)
7
2007
2006
Net Income
661.9
$
586.8
$
Stock-Based Compensation Expense
53.4
52.7
Depreciation and Amortization
150.8
137.5
Other Non-Cash Items to Reconcile to Net Cash Provided by Operations
70.6
54.2
Other Changes in Working Capital
(752.6)
(425.9)
Excess Tax Benefit on Stock Compensation
(15.4)
(15.0)
Net Cash Provided by Operations
168.7
390.3
Capital Expenditures
(160.8)
(119.5)
Acquisitions
(317.9)
(208.6)
Proceeds from Sale of Businesses
-
31.4
Repayment of LT Notes Receivable
-
13.4
Other Investing Activities, net
132.3
329.0
Net Cash (Used) Provided by Investing Activities
(346.4)
45.7
Dividends
(133.7)
(133.1)
Proceeds from Issuance of Debt
0.8
996.0
Repayment of Debt
(1.2)
(299.2)
Stock Repurchases
(846.5)
(1,105.2)
Share Transactions Under Employee Stock Plans
68.4
189.6
Excess Tax Benefit on Stock Compensation
15.4
15.0
Other Financing Activities
(45.1)
(64.5)
Net Cash Used by Financing Activities
(941.9)
(401.4)
Effect of exchange rate changes on cash and cash equivalents
(42.7)
(62.1)
Net Decrease in Cash and Cash Equivalents
(1,162.3)
$
(27.5)
$
9 Months Ended September 30,

Current Credit Picture
8
(a)
“Operating Income (EBIT)” and “Net Interest Expense” calculations shown are the latest twelve month (“LTM”) figures for the periods specified.
Although our bank agreements reference EBITDA, we have used EBIT for this presentation because EBITDA is a non-GAAP measure.
(b)
In June 2006, holders of our Convertible Notes Due 6/15/33 were offered a supplemental interest payment not to put the notes to us
for repurchase and to consent to certain amendments to the notes, including extending the maturity date on such notes. Holders of
$467.3 million of notes consented to the amendments, thus creating the Convertible Notes Due 7/1/38. The remaining holders of
the notes put the notes to us for repurchase.
2007
2006
Operating Income (EBIT)
(a)
$
1,601
$
1,435
Net Interest Expense
(a)
$
83.9
$
84.0
EBIT / Net Interest
19.1
x
17.1
x
Net Debt / EBIT
1.5
x
1.5
x
Debt:
Bank Loans (Due Less Than 1 Year)
$
18
$
12
CP Issued Under $2.5B - 5 Year Revolver Due 6/23/11
-
-
Convertible Notes Due 2/7/31
847
847
Convertible Notes Due 7/31/32
727
727
Convertible Notes Due 6/15/33
(b)
-
39
Convertible Notes Due 7/1/38
(b)
467
428
10 Year Notes Due 4/15/16
996
995
Other Debt
20
20
Total Debt
$
3,075
$
3,068
Cash and Short Term Investments
635
849
Net Debt
$
2,440
$
2,219
LTM ended September 30,

Current Liquidity Picture
9
(a)
Credit facility expires June 23, 2011.
(b)
Represents uncommitted facilities in the U.S., U.K. and Canada. These amounts are excluded from our
available liquidity for purposes of this presentation.
Total Amount
Of Facility
Outstanding
Available
Committed Facilities
5 Year Revolver (a)
2,500
$
-
$
2,500
$
Other Committed Credit Facilities
18
18
-
Total Committed Facilities
2,518
18
2,500
Uncommitted Facilities
(b)
674
-
-
(b)
Total Credit Facilities
3,192
$
18
$
2,500
$
Cash and Short Term Investments
635
Total Liquidity Available
3,135
$
As of September 30, 2007

Acquisitions Summary
10

Acquisition Related Expenditures
11
Note: See appendix for subsidiary acquisition profiles.
(a)
Includes acquisitions of a majority interest in agencies resulting in their consolidation.
(b)
Includes acquisitions of additional equity interests in existing affiliate agencies resulting in their majority ownership and
consolidation.
(c)
Includes acquisitions of less than a majority interest in agencies in which Omnicom did not have a prior equity interest
and the acquisition of additional interests in existing affiliated agencies that did not result in majority ownership.
(d)
Includes the acquisition of additional equity interests in already consolidated subsidiary agencies.
(e)
Includes additional consideration paid for acquisitions completed in prior periods.
New Subsidiary Acquisitions (a)
154
$
Affiliates to Subsidiaries (b)
1
Affiliates (c)
-
Existing Subsidiaries (d)
42
Earn-outs (e)
132
Total Acquisition Expenditures
329
$
9 Months YTD 2007

Potential Earn-out Obligations
The following is a calculation of future earn-out obligations as of
September 30, 2007, assuming that the underlying acquired
agencies continue to perform at their current levels: (a)
(a)
The ultimate payments will vary as they are dependent on future events and changes in FX rates.
12
2007
2008
2009
2010
Thereafter
Total
27
$
130
$
81
$
101
$
35
$
374
$

Potential Obligations
13
(a) The ultimate payments will vary as they are dependent on future events and changes in FX rates.
In conjunction with certain transactions, Omnicom has agreed to
acquire (at the sellers’ option) additional equity interests. If these rights
are exercised, there would likely be an increase in our net income as a
result of our increased ownership and the reduction of minority interest
expense. The following is a calculation of these potential future
obligations (as of September 30, 2007), assuming these underlying
acquired agencies continue to perform at their current levels: (a)
Currently
Exercisable
Not Currently
Exercisable
Total
Subsidiary Agencies
159
$
83
$
242
$
Affiliated Agencies
38
9
47
Total
197
$
92
$
289
$

Third Quarter Acquisitions
Consultech
Consultech is a healthcare consulting and marketing company
specializing in market research, strategic planning and
consultancy and marketing communications.
Consultech is based in Beijing, China and is part of the
Diversified Agency Services (DAS) Group.
14

Third Quarter Acquisitions
Sil Ad
Sil Ad is a full service advertising agency which was founded 16
years ago and currently services many leading Malaysian
companies. Over the years the agency has built a strong
creative reputation as evidenced by numerous industry
related awards.
Sil Ad is based in Kuala Lumpur, Malaysia and is part of the
TBWA-ISC Malaysia Group.
15

Third Quarter Acquisitions
Pointer Group
The Pointer Group specializes in retail activation and
promotional marketing. Its services include trade
marketing, channel marketing, field marketing, events,
point-of-sale, store design, sales promotion and sales
related public relations.
The Pointer Group is located in Helsinki, Finland, and is part of
the TBWA\PHS Group.
16
Third Quarter Acquisitions
RTS Rieger Team
RTS Rieger Team is a leading full-service agency providing
business to business solutions, including advertising, brand
consulting, sales promotion, direct marketing, public
relations and e-business solutions.
The company is part of TBWA Germany and is located in
Stuttgart and Düsseldorf.
17

Third Quarter Acquisitions
Signature Graphics
Signature Graphics is a leading producer of high quality,
customized vehicle graphic wraps and large format
branding materials and services in North America. The
company provides a full range of customized vehicle
graphics and marketing and advertising solutions including
design, custom manufacturing, warehousing, installation
and removal for brand conscious clients.
Signature Graphics is part of the DAS Group of Companies
and is located in Porter, Indiana.
18