
OmnicomGroup
Bear Stearns 21st Annual
Media Conference
March 10, 2008

1
The following materials have been prepared for use at the Bear Stearns 21st Annual Media Conference on March 10th,
2008.
Forward-Looking Statements
Certain of the statements in this document constitute forward-looking statements within the meaning of the Private
Securities Litigation Act of 1995. These statements relate to future events or future financial performance and involve
known and unknown risks and other factors that may cause our actual or our industry’s results, levels of activity or
achievement to be materially different from those expressed or implied by any forward-looking statements. These risks
and uncertainties include, but are not limited to, our future financial condition and results of operations, changes in
general economic conditions, competitive factors, changes in client communication requirements, the hiring and retention
of human resources and our international operations, which are subject to the risks of currency fluctuations and
exchange controls. In some cases, forward-looking statements can be identified by terminology such as “may,” “will,”
“could,” “would,” “should,” “expect,” “plan,” “anticipate,” “intend,” “believe,” “estimate,” “predict,” “potential” or “continue” or
the negative of those terms or other comparable terminology. These statements are present expectations. Actual events
or results may differ materially. We undertake no obligation to update or revise any forward-looking statement, except as
required by law.
Other Information
All dollar amounts are in millions except for EPS. The following financial information contained in this document has not
been audited, although some of it has been derived from Omnicom’s historical financial statements, including its audited
financial statements. In addition, industry, operational and other non-financial data contained in this document has been
derived from sources we believe to be reliable, but we have not independently verified such information, and we do not,
nor does any other person, assume responsibility for the accuracy or completeness of that information.
The inclusion of information in this presentation does not mean that such information is material or that disclosure of
such information is required.

2
Who We Are
The World’s Leading
Advertising and Marketing
Communications Services
Group
3
OmnicomGroup
Media Advertising
Customer Relationship
Management
Public
Relations
Specialty
Communications
30+ Marketing Communications Disciplines
200+ Strategic Brand Platforms
1,500+ Individual Agencies

4
Diversified Service Offering
CONSISTENCY
Broad Client Base
5,000+ clients
Top client = 2.8% of total revenue
and was served by over 100 of
our agencies
No other client > 2.4%
Our Top 10 clients = 16.7%
Our Top 100 clients = 46.2%
Top 100 clients are served by an
average of more than 40 of our
agencies
Clients include leading companies in
every industry category
200+ strategic platforms
1,500+ individual agencies
Leadership positions in 30+
marketing communications
disciplines
Strong global presence represented
in more than 100 countries serving
national, pan-regional and global
client needs
Omnicom’s Balance and Diversity

5
Industry-Specific Trends
Long-Term Trends
Client-Specific Trends
Desire to manage brands
on a pan-regional or global basis,
with an increased focus on
Emerging Markets
Reduction in service partners
Greater coordination
of advertising with other
marketing initiatives
Continued Focus on Return on
Investment and increased focus
on alternative media
Focus on continued expansion of
pan-regional and global Marketing
Services Networks
Marketing Complexity…
Integration of the Internet within
every marketing discipline
Private equity competition on
acquisition playing field abating
consumer fragmentation
digital initiatives
increased availability of data
more informed consumers

6
Factors Impacting 2008
Focus on marketing effectiveness and efficiency
Expanding mix of Media and Marketing Opportunities
Globalization of emerging markets by large multinationals
Continuing development of technologies which increase and expand
product offerings and ease of delivery
Delivery platforms
Data collection tools
Content Development and Collaboration tools
Uncertain economic conditions

7
Objectives
Maintain the leadership positions of our brands
Continued coordination of multi-agency offering for current and
potential clients
Continue to expand our relationships with our existing clients
both by discipline and geography
Make selective accretive acquisitions that allow us to further
extend our strategic advantages in non-traditional advertising
and in emerging markets
Achieve reported double digit Revenue and EPS growth
Optimize our operating margins while maintaining a high level of
investment in our people and businesses
Use free cash flow to enhance shareholder value

8
OmnicomGroup

9
Financial Review

10
2007 vs. 2006 P&L Summary
Organic 7.1%
Acq. 0.7%
Fx 3.8%
2007
2006
% Change
Revenue
12,694.0
$
11,376.9
$
11.6%
Operating Income
1,659.1
1,483.5
11.8%
% Margin
13.1%
13.0%
Net Interest Expense
74.0
91.6
Profit Before Tax
1,585.1
1,391.9
13.9%
% Margin
12.5%
12.2%
Taxes
536.9
466.9
% Tax Rate
33.9%
33.5%
Profit After Tax
1,048.2
925.0
13.3%
Equity in Affiliates/
38.4
29.6
Minority Interest
(110.9)
(90.6)
Net Income
975.7
$
864.0
$
12.9%
EPS
2.95
2.50
18.0%
Full Year

11
2007 Revenue Mix
Advertising
43.0%
PR
10.0%
CRM
36.6%
Specialty
10.4%
United
States
52.8%
Euro
Markets
21.3%
UK
11.0%
Other
14.9%
By Discipline
By Geography
Advertising
CRM
PR
Specialty
5,463.7
4,645.7
1,273.1
1,311.5
12.0%
14.1%
11.1%
2.5%
$ Mix
% Growth(a)
United States
Euro Markets
United Kingdom
Other
6,704.2
2,709.7
1,393.8
1,886.3
8.2%
16.9%
13.3%
15.3%
$ Mix
% Growth(a)
(a) “Growth” is the year-over-year growth from the prior period.

12
Revenue
Operating Income
Net Income
Earnings Per Share
(a) 2001 results are adjusted to assume that the cessation of goodwill amortization occurred on January 1, 2001.
All periods presented, beginning with 1995, include the effect of the adoption of Statement of Financial Accounting Standards No. 123, Accounting for Stock-Based Compensation.
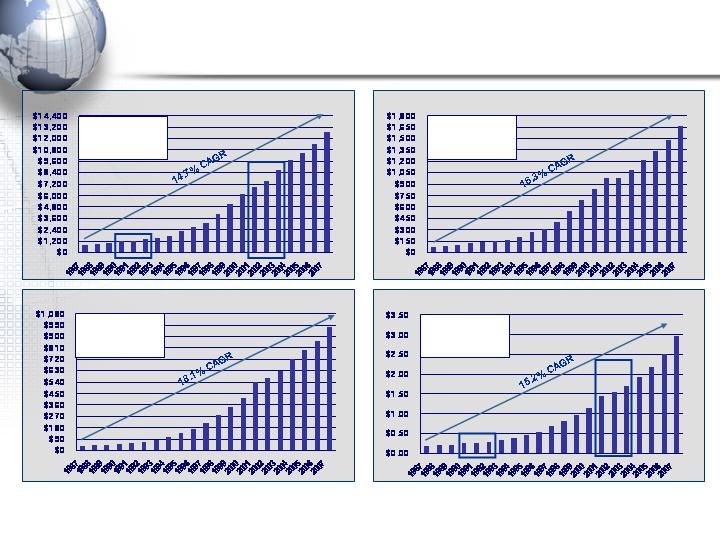
Financial Performance(a)
2007 $1,659
2006 $1,484
Growth 11.8%
2007 $12,694
2006 $11,377
Growth 11.6%
2007 $976
2006 $864
Growth 12.9%
2007 $2.95
2006 $2.50
Growth 18.0%
13
Revenue
Operating Income
Net Income
Earnings Per Share
(a) 2001 results are adjusted to assume that the cessation of goodwill amortization occurred on January 1, 2001.
All periods presented, beginning with 1995, include the effect of the adoption of Statement of Financial Accounting Standards No. 123, Accounting for Stock-Based Compensation.
Financial Performance(a)
2007 $1,659
2006 $1,484
Growth 11.8%
2007 $12,694
2006 $11,377
Growth 11.6%
2007 $976
2006 $864
Growth 12.9%
2007 $2.95
2006 $2.50
Growth 18.0%

14
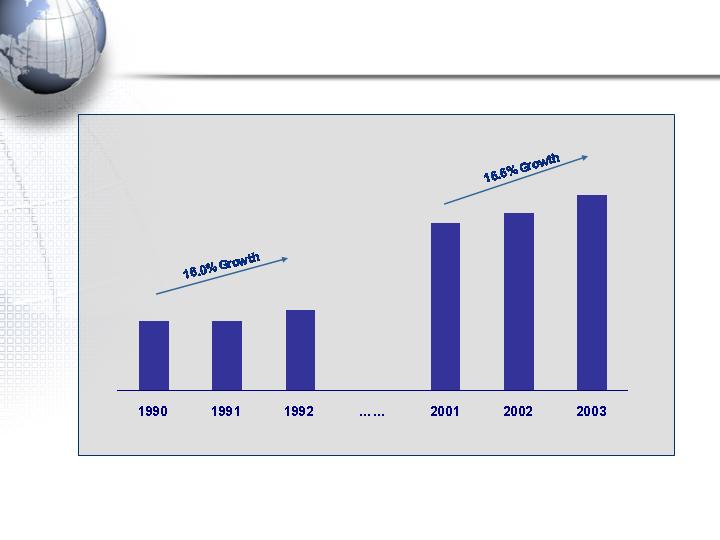
Revenue
Financial Performance
$1,178
$1,236
$1,385
$6,889
$7,536
$8,621
Earning Per Share
15
Financial Performance
$0.25
$0.25
$0.29
$1.45
$1.69
$1.54

16
Financial Objectives
Consistent industry leading long-term financial performance
- Maximize operating efficiency
Continuing to increase investment in:
- Emerging markets
- Emerging technologies
- Behavioral marketing
- Quantitative analytics
Maintain a conservative and efficient capital structure
Double digit reported growth in Revenue and EPS
Selective acquisitions
Staff development
New hires

17
OmnicomGroup