
Omnicom Group
THIRD QUARTER 2008 RESULTS
Investor Presentation
October 21, 2008
Exhibit 99.2

1
The following materials have been prepared for use in the October 21, 2008 conference call on Omnicom’s results of operations
for the period ended September 30, 2008. The call will be archived on the Internet at
http://www.omnicomgroup.com/financialwebcasts.
Forward-Looking Statements
Certain of the statements in this document constitute forward-looking statements within the meaning of the Private Securities
Litigation Act of 1995. These statements relate to future events or future financial performance and involve known and
unknown risks and other factors that may cause our actual or our industry’s results, levels of activity or achievement to be
materially different from those expressed or implied by any forward-looking statements. These risks and uncertainties
include, but are not limited to, our future financial condition and results of operations, changes in general economic
conditions, competitive factors, changes in client communication requirements, the hiring and retention of human resources
and our international operations, which are subject to the risks of currency fluctuations and exchange controls. In some
cases, forward-looking statements can be identified by terminology such as “may,” “will,” “could,” “would,” “should,” “expect,”
“plan,” “anticipate,” “intend,” “believe,” “estimate,” “predict,” “potential” or “continue” or the negative of those terms or other
comparable terminology. These statements are present expectations. Actual events or results may differ materially. We
undertake no obligation to update or revise any forward-looking statement, except as required by law.
Other Information
All dollar amounts are in millions except for EPS. The financial information contained in this document has not been audited,
although some of it has been derived from Omnicom’s historical financial statements, including its audited financial
statements. In addition, industry, operational and other non-financial data contained in this document have been derived
from sources we believe to be reliable, but we have not independently verified such information, and we do not, nor does
any other person, assume responsibility for the accuracy or completeness of that information.
The inclusion of information in this presentation does not mean that such information is material or that disclosure of such
information is required.

2
2008 vs. 2007 P&L Summary
2008
2007
%
2008
2007
%
Revenue
3,316.2
$
3,101.4
$
6.9%
9,988.5
$
9,068.1
$
10.1%
Operating Income
373.4
350.2
6.6%
1,241.0
1,127.3
10.1%
% Margin
11.3%
11.3%
12.4%
12.4%
Net Interest Expense
20.7
19.3
50.4
59.8
Profit Before Tax
352.7
330.9
6.6%
1,190.6
1,067.5
11.5%
% Margin
10.6%
10.7%
11.9%
11.8%
Taxes
118.2
112.1
400.6
361.4
% Tax Rate
33.5%
33.9%
33.6%
33.9%
Equity in Affiliates
6.8
8.0
26.0
25.8
Minority Interest
(27.7)
(24.6)
(86.7)
(70.0)
Net Income
213.6
$
202.2
$
5.6%
729.3
$
661.9
$
10.2%
Third Quarter
Year to Date

3
2008 vs. 2007 Earnings Per Share
Earnings per Share:
Basic
Diluted
Growth Rate, Diluted
Weighted Average Shares (millions):
Basic
Diluted
Dividend Declared Per Share
$ 0.69
0.69
11.3
309.1
310.7
$0.150
2007
2008
Third Quarter
$ 0.62
0.62
324.0
328.2
$0.150
$ 2.32
2.30
15.0
315.0
317.7
$0.450
2007
2008
Year to Date
$ 2.02
2.00
327.0
331.8
$0.425
%
%

4
2008 Total Revenue Growth
(a)
To calculate the FX impact, we first convert the current period’s local currency revenue using the average exchange
rates from the equivalent prior period to arrive at constant currency revenue. The FX impact equals the difference
between the current period revenue in U.S. dollars and the current period revenue in constant currency.
(b)
Acquisition revenue is the aggregate of the applicable prior period revenue of the acquired businesses. Netted against
this number is the revenue of any business included in the prior period reported revenue that was disposed of
subsequent to the prior period.
(c)
Organic revenue is calculated by subtracting both the acquisition revenue and the FX impact from total revenue growth.
$
%
$
%
Prior Period Revenue
3,101.4
$
9,068.1
$
Foreign Exchange (FX) Impact (a)
66.0
2.1%
374.5
4.1%
Acquisition Revenue (b)
22.9
0.7%
88.9
1.0%
Organic Revenue (c)
125.9
4.1%
457.0
5.0%
Current Period Revenue
3,316.2
$
6.9%
9,988.5
$
10.1%
Third Quarter
Year to Date
5
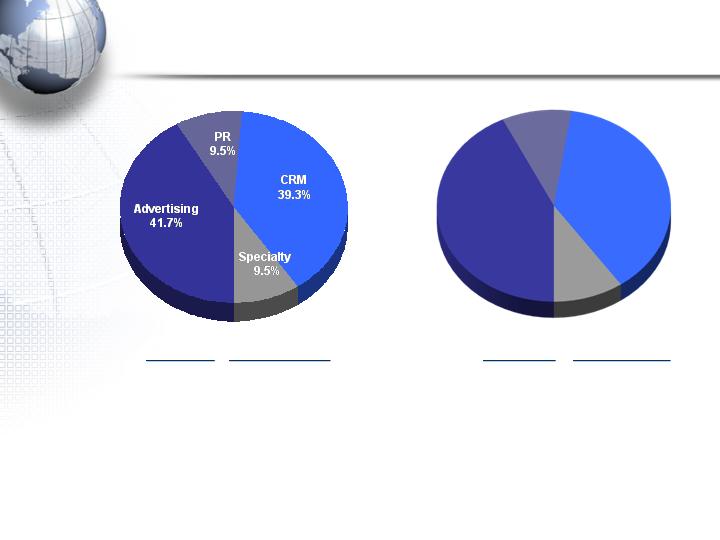
Third Quarter
Year to Date
Advertising
42.8%
PR
9.6%
CRM
37.9%
Specialty
9.7%
(a) “Growth” is the year-over-year increase or decrease from the prior period.
2008 Revenue By Discipline
$ Mix
% Growth(a)
$ Mix
% Growth(a)
Advertising
1,382.0
6.9%
Advertising
4,273.2
10.0%
CRM
1,305.5
12.0%
CRM
3,786.8
14.6%
PR
314.1
-1.2%
PR
962.5
3.1%
Specialty
314.6
-3.2%
Specialty
966.0
2.1%
6
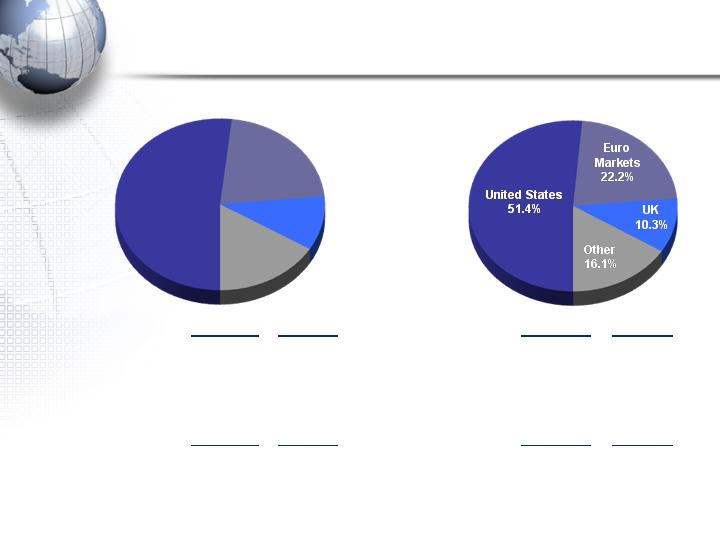
Third Quarter
2008 Revenue By Geography
Year to Date
Euro
Markets
21.7%
United States
51.8%
UK
10.2%
Other
16.3%
(a) “Growth” is the year-over-year increase or decrease from the prior period.
$ Mix
$ Growth(a)
$ Mix
$ Growth(a)
United States
1,718.0
$
63.1
$
United States
5,130.5
$
272.1
$
Organic
46.9
Organic
221.9
Acquisition
16.2
Acquisition
50.2
International
1,598.2
$
151.7
$
International
4,858.0
$
648.3
$
Organic
79.0
Organic
235.1
Acquisition
6.7
Acquisition
38.7
FX
66.0
FX
374.5
$ Mix
% Growth(a)
$ Mix
% Growth(a)
United States
1,718.0
$
3.8%
United States
5,130.5
$
5.6%
Euro Currency Markets
718.3
13.0%
Euro Currency Markets
2,217.9
18.1%
United Kingdom
337.5
-4.3%
United Kingdom
1,026.4
0.0%
Other
542.4
18.3%
Other
1,613.7
23.6%
7
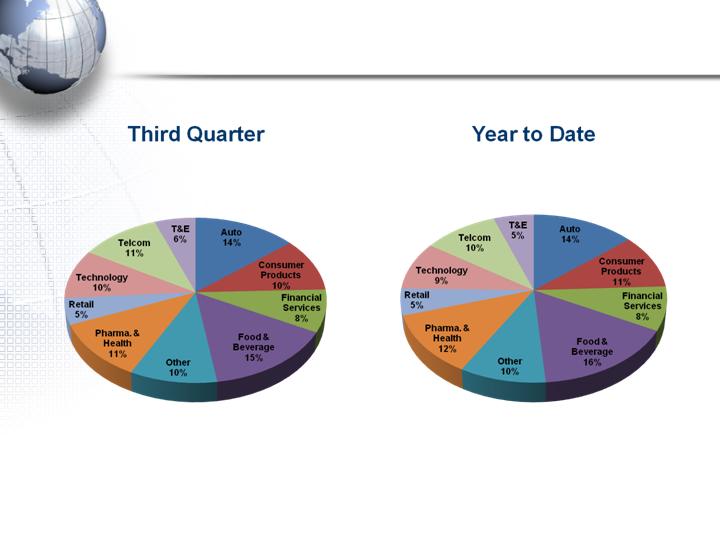
2008 Revenue By Industry
Charts represent the amount of revenue attributable to each industry expressed as a percentage of the total revenue
from Omnicom’s 1,000 largest clients for the period ended September 30, 2008.

8
Cash Flow – GAAP Presentation (condensed)
2008
2007
Net Income
729.3
$
661.9
$
Share-Based Compensation Expense
44.3
53.4
Depreciation and Amortization
176.2
150.8
Other Non-Cash Items to Reconcile to Net Cash Provided by Operations
86.7
70.6
Other Changes in Working Capital
(789.2)
(752.6)
Excess Tax Benefit on Share-Based Compensation
(12.9)
(15.4)
Net Cash Used by Operations
234.4
168.7
Capital Expenditures
(151.6)
(160.8)
Acquisitions
(387.8)
(317.9)
Other Investing Activities, net
19.1
132.3
Net Cash Used by Investing Activities
(520.3)
(346.4)
Dividends
(145.3)
(133.7)
Stock Repurchases
(846.0)
(846.5)
Share Transactions Under Employee Stock Plans
77.8
68.4
Proceeds from Issuance of Debt
115.3
0.8
Excess Tax Benefit on Stock Compensation
12.9
15.4
Other Financing Activities
(49.0)
(46.3)
Net Cash Used by Financing Activities
(834.3)
(941.9)
Effect of exchange rate on cash and cash equivalents
(142.4)
(42.7)
Net Decrease in Cash and Cash Equivalents
(1,262.6)
$
(1,162.3)
$
9 Months Ended September 30,

9
Current Credit Picture
(a)
“EBITDA” and “Gross Interest Expense” calculations shown are the latest twelve month (“LTM”) figures for the
periods specified. EBITDA is defined as operating income before interest, taxes, depreciation and amortization.
Although EBITDA is a non-GAAP measure, we believe EBITDA is more meaningful for purposes of this analysis
because the financial covenants in our credit facilities are based on EBITDA (see reconciliation of Operating
Income to EBITDA on page 21).
2008
2007
EBITDA (a)
$
2,007
$
1,805
Gross Interest Expense (a)
$
115.2
$
117.3
EBITDA / Gross Interest Expense
17.4
x
15.4
x
Total Debt / EBITDA
1.6
x
1.7
x
Debt:
Short-term borrowings (Due Less Than 1 Year)
$
64
$
18
CP Issued Under $2.5B - 5 Year Revolver Due 6/23/11
113
-
Convertible Notes Due 2/7/31
847
847
Convertible Notes Due 7/31/32
727
727
Convertible Notes Due 6/15/33
-
-
Convertible Notes Due 7/1/38
467
467
10 Year Notes Due 4/15/16
996
996
Other Debt
20
20
Total Debt
$
3,234
$
3,075
Cash and Short Term Investments
553
635
Net Debt
$
2,681
$
2,440
LTM Ended September 30,

10
Current Liquidity Picture
(a)
Credit facility expires June 23, 2011.
(b)
Represents uncommitted facilities in the U.S., U.K. and Canada as of September 30, 2008. These amounts are
excluded from our available liquidity for purposes of this presentation.
Total Amount
Of Facility
Outstanding
Available
Committed Facilities
5 Year Revolver (a)
2,500
$
113
$
2,387
$
Other Committed Credit Facilities
64
64
-
Total Committed Facilities
2,564
177
2,387
Uncommitted Facilities (b)
331
-
-
(b)
Total Credit Facilities
2,895
$
177
$
2,387
$
Cash and Short Term Investments
553
Total Liquidity Available
2,940
$
As of September 30, 2008

11
Omnicom Debt Structure
Supplemental Information
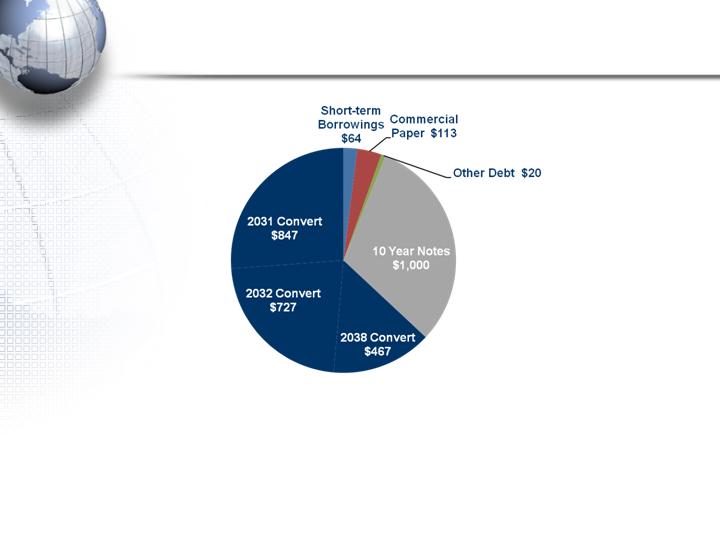
Omnicom Debt Structure
12
The above chart reflects Omnicom’s debt outstanding at September 30, 2008. The
amount reflected above for the 10 Year Notes represents the value of these notes at
maturity on April 15, 2016.

13
Omnicom Debt Structure
The Bank
Facility and
Commercial
Paper Program
together provide
liquidity in the
event any
convertible
notes are put.
We then have
flexibility to
refinance in
different debt
capital markets.
Our 2031 Notes are putable annually, with the next put date in February 2009. Our 2032 Notes are putable annually, with the next put date in July
2009. Our 2038 Notes are putable in June 2010, 2013, 2018, 2023 and annually thereafter.
For purposes of this presentation we have included the following borrowings as of September 30, 2008 as outstanding through June 2011, the
date of expiration of our five-year credit facility: commercial paper of $113 million, short-term borrowings of $64 million and other debt of $20
million. We believe that this presentation is more meaningful for purposes of understanding how we evaluate the maturities of our debt structure.
$
0
$
200
$
400
$
600
$
800
$
1
,
000
$
1
,
200
Jan
-
08
Jan
-
09
Jan
-
10
Jan
-
11
Jan
-
12
Jan
-
13
Jan
-
14
Jan
-
15
Jan
-
16
2031
2032
2038
$
1
.
0
B
10
-
Year
$
2
.
04
Billion
Senior Convertible
Notes
Other
Borrowings

14
Senior Notes Due 2016
Principal Amount
$1 Billion
Co - Issuers
Omnicom Group, Omnicom Finance, Omnicom Capital
Date
March 29, 2006
Maturity
April 15, 2016
Security
Unsecured, pari passu with Bank Facility
Coupon
5.90%
Spread Over Comparable
Treasury at Issue
1.30%
Rating
Moody’s: Baa1
S&P: A-
Fitch: A-

15
2031 Convertible Notes
Principal Amount
$847 Million
Co - Issuers
Omnicom Group, Omnicom Finance, Omnicom Capital
Date
February 7, 2001
Maturity
February 7, 2031 with annual puts each February
Security
Unsecured, pari passu with Bank Facility
Coupon
0.00%
Conversion Price
$55
Rating
Moody’s: Baa1
S&P: A-
Fitch: A-

16
2032 Convertible Notes
Principal Amount
$727 Million
Co - Issuers
Omnicom Group, Omnicom Finance, Omnicom Capital
Date
March 6, 2002
Maturity
July 31, 2032 with puts each July
Security
Unsecured, pari passu with Bank Facility
Coupon
0.00%
Conversion Price
$55
Rating
Moody’s: Baa1
S&P: A-
Fitch: A-

17
2038 Convertible Notes
Principal Amount
$467 Million
Co - Issuers
Omnicom Group, Omnicom Finance, Omnicom Capital
Date
June 10, 2003
Maturity
June 15, 2038 with puts in June of 2010, 2013, 2018, 2023 and
annually thereafter until maturity
Security
Unsecured, pari passu with Bank Facility
Coupon
0.00%
Conversion Price
$51.50
Rating
Moody’s: Baa1
S&P: A-
Fitch: A-

18
Current Bank Credit Facility
Amount
$2.5 Billion
Type
Unsecured Revolving Credit
Maturity
5 Years – June 2011
Facility Fee
13BP per annum
Drawn Rate
Libor +17BP
Covenants
-Maximum Debt to EBITDA 3:1
-Minimum Interest Coverage 5:1

19
Current Bank Credit Facility –
Distribution of 32 Banks
North America
Bank of America
($200)
Wells Fargo ($175)
Northern Trust ($50)
PNC ($50)
Union Bank
of California ($50)
US Bancorp ($50)
Scotia ($40)
Comerica ($25)
Key ($25)
Fifth Third ($15)
Europe
Societe Generale ($150)
Deutsche ($150)
BNP Paribas ($130)
BBVA ($100)
Commerzbank ($80)
Barclays ($50)
Den Danske ($50)
UBS ($35)
Intesa San Paolo ($30)
ING ($25)
Nordea ($25)
Unicredit ($25)
Global
Citigroup ($100) JP Morgan ($200) HSBC ($200) Royal Bank of Scotland ($150)
Asia
Sumitomo ($100)
Bank of Tokyo ($50)
Mizuho ($50)
ANZ ($50)
Standard Chartered ($45)
Westpac ($25)
($ in Millions)

Current Omnicom Credit Ratings
Moody’s
S&P
Fitch
Long Term Ratings
Baa1
A-
A-
Short Term
Ratings
P2
A2
F2
Outlook
Stable
Stable
Stable
20

21
Reconciliation of Operating Income to
EBITDA
The covenants contained in our credit facility are based on the EBITDA ratios as presented on page 9 of this presentation. The above
reconciles our GAAP Operating Income to EBITDA for the periods presented.
EBITDA is a non-GAAP financial measure within the meaning of applicable SEC rules and regulations Our credit facility defines EBITDA as
earnings before deducting interest expense, income taxes, depreciation and amortization. Our credit facility uses EBITDA to measure our
compliance with covenants, such as interest coverage and leverage. EBITDA is not, and should not, be used as a substitute for Operating
Income as determined in accordance with GAAP and is only used to measure our compliance with our debt covenants. Management does not
use EBITDA for any other measurement purpose.
2008
2007
Operating Income
$
1,773
$
1,601
Depreciation
184
159
Amortization
50
45
EBITDA
$
2,007
$
1,805
LTM Ended September 30,

22
Acquisitions Summary

23
Acquisition Related Expenditures
Note: See appendix for acquisition profiles.
Includes acquisitions of a majority interest in agencies resulting in their consolidation.
Includes acquisitions of additional equity interests in existing affiliate agencies resulting in their majority ownership and consolidation.
Includes acquisitions of less than a majority interest in agencies in which Omnicom did not have a prior equity interest and the
acquisition of additional interests in existing affiliated agencies that did not result in majority ownership.
Includes the acquisition of additional equity interests in already consolidated subsidiary agencies.
Includes additional consideration paid for acquisitions completed in prior periods.
(a)
(b)
(c)
(d)
(e)
New Subsidiary Acquisitions (a)
77
$
Affiliates to Subsidiaries (b)
12
Affiliates (c)
87
Existing Subsidiaries (d)
66
Earn-outs (e)
164
Total Acquisition Expenditures
406
$
9 Months YTD 2008

24
Potential Earn-out Obligations
The following is a calculation of future earn-out obligations as of
September 30, 2008, assuming that the underlying acquired agencies
continue to perform at their current levels: (a)
(a)
The ultimate payments will vary as they are dependent on future events and changes in FX rates.
2008
2009
2010
2011
Thereafter
Total
20
$
107
$
94
$
41
$
41
$
303
$

25
Potential Obligations
(a) The ultimate payments will vary as they are dependent on future events and changes in FX rates.
In conjunction with certain transactions, Omnicom has agreed to
acquire (at the sellers’ option) additional equity interests. If these rights
are exercised, there would likely be an increase in our net income as a
result of our increased ownership and the reduction of minority interest
expense. The following is a calculation of these potential future
obligations (as of September 30, 2008), assuming these underlying
acquired agencies continue to perform at their current levels: (a)
Currently
Exercisable
Not Currently
Exercisable
Total
Subsidiary Agencies
164
$
86
$
250
$
Affiliated Agencies
42
1
43
Total
206
$
87
$
293
$
26
Third Quarter Acquisitions
Barefoot
Barefoot is a fully integrated interactive marketing communication
agency. The company’s service programs include strategy, on-line,
consumer promotion, planning and advertising. From this platform the
company offers high quality end to end service in brand strategy, media
strategy & planning, relationship marketing and results measurement,
reporting and tracking.
Barefoot will be a part of Proximity within the BBDO network and is located
in Cincinnati, Ohio.

27
Third Quarter Acquisitions
Paul Wilmot Communications
Paul Wilmot Communications provides public relations, communications
and publicity services within the fashion and luxury goods arenas.
The agency is comprised of five divisions: Fashion, Beauty &
Wellness, Accessories, Culture & Lifestyle and Special Events.
Paul Wilmot Communications is based in New York and will operate
within Fleishman Hillard.

28
Third Quarter Acquisitions
TRO
TRO (The Russell Organization) is a leading experiential marketing and events agency, specializing in the use of face-to-face
communication and the live medium. TRO designs, produces and
delivers brand experiences and environments which achieve real
results for B2C and B2B clients. The spectrum of work includes road
shows, shopping center campaigns, live promotions exhibitions,
sponsorship activation, conferencing, new product launches, training and hospitality.
Located in Isleworth, England, TRO will become a part of CPM's
experiential marketing services delivery network.

29
Third Quarter Acquisitions
The Eleven Agency
The Eleven Agency is a field marketing communications company
specializing in Sales Training, Training Video Production, E-Learning,
Recruiting, Assisted Sales at Retail, Retail Merchandising and Field &
Event Marketing.
The Eleven Agency is located in Irvine, California and will become a
member of GMR Marketing.

30
Third Quarter Acquisitions
Tarek Nour
The DDB network acquired a 49% affiliate interest in TN Holdings, the
holding company for the Tarek Nour group.
Established in 1978, TN Holdings is one of Egypt’s largest marketing and
corporate communications companies. The group’s twenty companies
provide a wide range of services including advertising, media
research, planning & buying, brand design, television production,
event management & outdoor advertising services.
Tarek Nour is headquartered in Cairo, Egypt.