
Investor Presentation
Fourth Quarter 2008 Results
February 10, 2009
Exhibit 99.2

Disclosure
The following materials have been prepared for use in the February 10, 2009 conference call on Omnicom’s results of
operations for the period ended December 31, 2008. The call will be archived on the Internet at
http://www.omnicomgroup.com/financialwebcasts ..
Forward-Looking Statements
Certain of the statements in this document constitute forward-looking statements within the meaning of the Private
Securities Litigation Act of 1995. These statements relate to future events or future financial performance and involve
known and unknown risks and other factors that may cause our actual or our industry’s results, levels of activity or
achievement to be materially different from those expressed or implied by any forward-looking statements. These
risks and uncertainties include, but are not limited to, our future financial condition and results of operations, changes
in general economic conditions, competitive factors, changes in client communication requirements, the hiring and
retention of human resources and our international operations, which are subject to the risks of currency fluctuations
and exchange controls. In some cases, forward-looking statements can be identified by terminology such as “may,”
“will,” “could,” “would,” “should,” “expect,” “plan,” “anticipate,” “intend,” “believe,” “estimate,” “predict,” “potential” or
“continue” or the negative of those terms or other comparable terminology. These statements are present
expectations. Actual events or results may differ materially. We undertake no obligation to update or revise any
forward-looking statement, except as required by law.
Other Information
All dollar amounts are in millions except for EPS. The financial information contained in this document has not been
audited, although some of it has been derived from Omnicom’s historical financial statements, including its audited
financial statements. In addition, industry, operational and other non-financial data contained in this document have
been derived from sources we believe to be reliable, but we have not independently verified such information, and we
do not, nor does any other person, assume responsibility for the accuracy or completeness of that information.
The inclusion of information in this presentation does not mean that such information is material or that disclosure of
such information is required.
1
February 10, 2009

2008 vs. 2007 P&L Summary
February 10, 2009
2
Fourth Quarter
Full Year
2008
2007
%
2008
2007
%
Revenue
$
3,371.3
$
3,626.0
-
7.0%
$
13,359.9
$
12,694.0
5.2%
Operating Income
448.4
531.9
-
15.7%
1,689.4
1,659.1
1.8%
% Margin
13.3%
14.7%
12.6%
13.1%
Net Interest Expense
23.9
14.3
74.3
74.0
Profit Before Tax
424.5
517.6
-
18.0%
1,615.1
1,585.1
1.9%
% Margin
12.6%
14.3%
12.1%
12.5%
Taxes
142.0
175.5
542.7
536.9
% Tax Rate
33.5%
33.9%
33.6%
33.9%
Equity in Affiliates
16.0
12.7
42.0
38.4
Minority Interest
(27.5)
(40.9)
(114.1)
(110.9)
Net Income
$
271.0
$
313.9
-
13.7%
$
1,000.3
$
975.7
2.5%

2008 vs. 2007 Earnings per Share
February 10, 2009
3
Fourth Quarter
Full Year
2008
2007
2008
2007
Earnings per Share:
Basic
$
0.88
$
0.97
$
3.20
$
2.99
Diluted
0.88
0.96
3.17
2.95
Growth Rate, Diluted
-
8.3%
7.5%
Weighted Average Shares (millions):
Basic
307.2
323.2
313.0
326.0
Diluted
307.2
327.0
315.4
330.4
Dividend Declared per Share
$
0.150
$
0.150
$
0.600
$
0
.575

2008 Total Revenue Growth
February 10, 2009
4
(a)
To calculate the FX impact, we first convert the current period’s local currency revenue using the average exchange rates
from the equivalent prior period to arrive at constant currency revenue. The FX impact equals the difference between the
current period revenue in U.S. dollars and the current period revenue in constant currency.
(b)
Acquisition revenue is the aggregate of the applicable prior period revenue of the acquired businesses. Netted against this
number is the revenue of any business included in the prior period reported revenue that was disposed of subsequent to
the prior period.
(c)
Organic revenue is calculated by subtracting both the acquisition revenue and the FX impact from total revenue growth.
Fourth Quarter
Full Year
$
%
$
%
Prior Period Revenue
$
3,626.0
$
12,694.0
Foreign Exchange (FX) Impact (a)
(210.7)
-
5.8%
163.9
1.3%
Acquisition Revenue (b)
39.2
1.1%
128.1
1.0%
Organic Revenue (c)
(83.2)
-
2.3%
373.9
2.9%
Current Period Revenue
$
3,371.3
-
7.0%
$
13,359.9
5.2%

2008 Revenue by Discipline
February 10, 2009
5
$ Mix
% Growth (a)
Advertising
$ 1,458.6
-7.6%
CRM
1,298.0
-3.3%
PR
304.9
-10.2%
Specialty
309.8
-15.3%
$ Mix
% Growth (a)
Advertising
$ 5,731.8
4.9%
CRM
5,084.9
9.5%
PR
1,267.4
-0.4%
Specialty
1,275.8
-2.7%
(a)
“Growth” is the year-over-year increase or decrease from the prior period.

9.9%
U.K.
16.2%
Other
22.3%
Euro Markets
51.6%
U.S.
Full Year
14.5%
2,158.9
Other
-4.9%
1,325.4
United Kingdom
10.2%
2,985.6
Euro Currency Markets
2.8%
$
6,890.0
United States
% Growth(a)
$ Mix
163.9
FX
57.8
Acquisition
258.4
Organic
$
480.1
$
6,469.9
International
70.3
Acquisition
115.5
Organic
$
185.8
$
6,890.0
United States
$ Growth(a)
$ Mix
8.8%
U.K.
16.2%
Other
22.8%
Euro Markets
52.2%
U.S.
Fourth Quarter
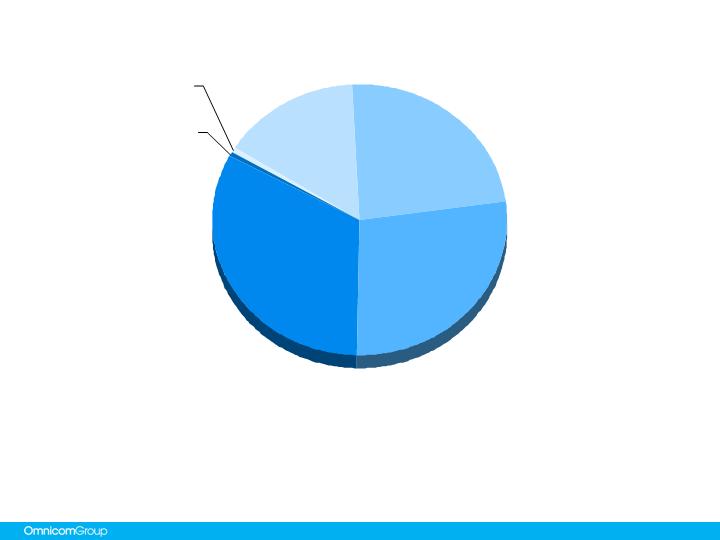
2008 Revenue By Geography
February 10, 2009
6
(a)
“Growth” is the year-over-year increase or decrease from the prior period.
$ Mix
$ Growth(a)
United States
1,759.5
$
(86.4)
$
Organic
(106.4)
Acquisition
20.0
International
1,611.8
$
(168.3)
$
Organic
23.2
Acquisition
19.2
FX
(210.7)
$ Mix
% Growth(a)
United States
1,759.5
$
-4.7%
Euro Currency Markets
767.6
-7.6%
United Kingdom
298.9
-18.7%
Other
545.3
-6.2%

Cash Flow – GAAP Presentation (condensed)
February 10, 2009
7
Full Year
2008
2007
Net Income
$
1,000.3
$
975.7
Share-Based Compensation Expense
59.3
68.7
Depreciation and Amortization
235.9
208.6
Other Non-Cash Items to Reconcile to Net Cash Provided by Operations
123.6
119.7
Other Changes in Working Capital
(12.0)
243.8
Excess Tax Benefit on Share-Based Compensation
-
(12.9)
(17.2)
Net Cash Provided by Operating Activities
1,394.2
1,599.3
Capital Expenditures
(212.2)
(223.0)
Acquisitions
(441.4)
(358.8)
Other Investing Activities, net
(26
.4
)
141.3
Net Cash Used in Investing Activities
(680.0)
(440.5)
Dividends
(192.0)
(182.8)
Stock Repurchases
(846.8)
(899.7)
Share Transactions Under Employee Stock Plans
86.0
100.9
Proceeds from Issuance of Debt
2.4
3.4
Excess Tax Benefit on Stock Compensation
12.9
17.2
Other Financing Activities, net
(116.3)
(79.7)
Net Cash Used in Financing Activities
(
1,053.8)
(1,040.7)
Effect of exchange rate on cash and cash equivalents
(356.3)
(64.4)
Net (Decrease) Increase in Cash and Cash Equivalents
$
(
695.9)
$
53.7

Current Credit Picture
February 10, 2009
8
(a)
“EBITDA” and “Gross Interest Expense” calculations shown are for the twelve months ending December 31. EBITDA is defined as operating income before interest, taxes,
depreciation and amortization. Although EBITDA is a non-GAAP measure, we believe EBITDA is more meaningful for purposes of this analysis because the financial
covenants in our credit facilities are based on EBITDA (see reconciliation of Operating Income to EBITDA on page 21).
(b)
On February 9, 2009, holders of $841.2 million aggregate principal amount of Omnicom’s convertible notes due 2031 put their notes to Omnicom for purchase at par in
accordance with the terms of the indenture under which the convertible notes were issued. Omnicom borrowed $814.4 million under its existing $2.5 billion five-year revolving
credit facility and received $26.8 million from unaffiliated equity investors in the partnership referred to below to fund the purchase of the notes. Omnicom purchased and
retired $295.2 million aggregate principal amount of the convertible notes that had been put. A partnership controlled by Omnicom and formed for the purpose of buying the
convertible notes used a portion of Omnicom’s credit facility borrowings and the contributed equity to purchase the remaining $546.0 million aggregate principal amount of
convertible notes that were put. The partnership purchased the convertible notes intending to sell such notes back into the marketplace over the next 12 months if market
conditions permit. The partnership will be consolidated within Omnicom’s financial statements.
2008
2007
EBITDA (a)
$
1,925
$
1,868
Gross Interest Expense (a)
$
124.6
$
106.9
EBITDA / Gross Interest Expense
15.4
x
17.5
x
Total Debt / EBITDA
1.6
x
1.6
x
Debt:
Short-term borrowings (Due Less Than 1 Year)
$
16
$
12
CP Issued Under $2.5B - 5 Year Revolver Due 6/23/11
-
(b)
-
Convertible Notes Due 2/7/31
847
(b)
847
Convertible Notes Due 7/31/32
727
727
Convertible Notes Due 6/15/33
-
-
Convertible Notes Due 7/1/38
467
467
10 Year Notes Due 4/15/16
996
996
Other Debt
20
20
Total Debt
$
3,073
$
3,069
Cash and Short Term Investments
1,112
1,841
Net Debt
$
1,961
$
1,228
Full Year

Current Liquidity Picture
February 10, 2009
9
As of December 31, 2008
Total Amount
of Facility
Outstanding
Available
Committed Facilities
5 Year Revolver (a)
$ 2,500
$ —
$ 2,500
Other Committed Credit Facilities
16
16
—
Total Committed Facilities
2,516
16
2,500
Uncommitted Facilities (b)
354
—
— (b)
Total Credit Facilities
$ 2,870
$ 16
$ 2,500
Cash and Short Term Investments
1,112
Total Liquidity Available
$ 3,612
(a)
Credit Facility expires June 23, 2011. For an update, see the Current Credit Picture Update on page 13.
(b)
Represents uncommitted facilities in the U.S., U.K. and Canada as of December 31, 2008. These amounts are excluded from our
available liquidity for purposes of this presentation.

Omnicom Debt Structure
Supplemental Information
The above chart reflects Omnicom’s debt outstanding at December 31, 2008. The amount reflected above for the 10 Year Notes represents the principal
amount of these notes at maturity on April 15, 2016.
On February 9, 2009, holders of $841.2 million aggregate principal amount of Omnicom’s convertible notes due 2031 put their notes to Omnicom for purchase
at par in accordance with the terms of the indenture under which the convertible notes were issued. Omnicom borrowed $814.4 million under its existing $2.5
billion five-year revolving credit facility and received $26.8 million from unaffiliated equity investors in the partnership referred to below to fund the purchase of
the notes. Omnicom purchased and retired $295.2 million aggregate principal amount of the convertible notes that had been put. A partnership controlled by
Omnicom and formed for the purpose of buying the convertible notes used a portion of Omnicom’s credit facility borrowings and the contributed equity to
purchase the remaining $546.0 million aggregate principal amount of convertible notes that were put. The partnership purchased the convertible notes
intending to sell such notes back into the marketplace over the next 12 months if market conditions permit. The partnership will be consolidated within
Omnicom’s financial statements.
11
February 10, 2009
Omnicom Debt Structure
2032 Convert
$727
2038 Convert
$467
10 Year Notes
$1,000
2031 Convert
$847
Other Debt $20
Short-term
Borrowings $16
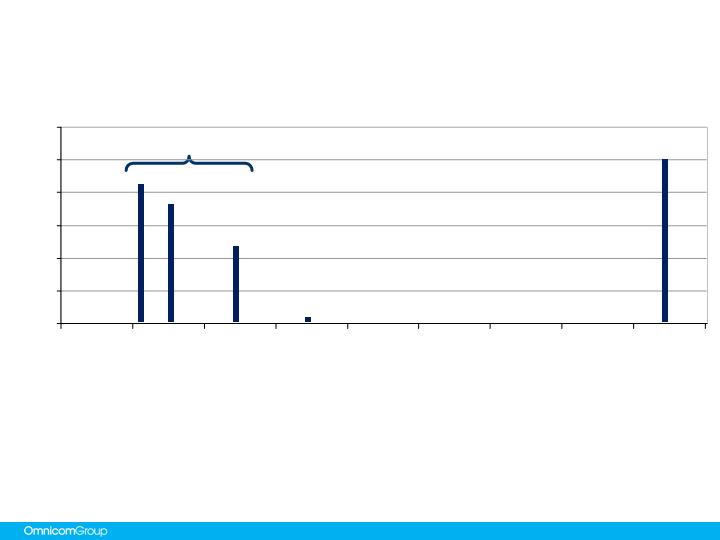
Omnicom Debt Structure
February 10, 2009
12
The Bank Facility and Commercial Paper Program together provide liquidity in the event any convertible notes are
put. We then have flexibility to refinance in different debt capital markets.
Our 2031 Notes are putable annually, with the next put date in February 2009. Our 2032 Notes are putable annually, with the next put date in July 2009. Our 2038
Notes are putable in June 2010, 2013, 2018, 2023 and annually thereafter.
On February 9, 2009, holders of $841.2 million aggregate principal amount of Omnicom’s convertible notes due 2031 put their notes to Omnicom for purchase at
par in accordance with the terms of the indenture under which the convertible notes were issued. Omnicom borrowed $814.4 million under its existing $2.5 billion
five-year revolving credit facility and received $26.8 million from unaffiliated equity investors in the partnership referred to below to fund the purchase of the notes.
Omnicom purchased and retired $295.2 million aggregate principal amount of the convertible notes that had been put. A partnership controlled by Omnicom and
formed for the purpose of buying the convertible notes used a portion of Omnicom’s credit facility borrowings and the contributed equity to purchase the remaining
$546.0 million aggregate principal amount of convertible notes that were put. The partnership purchased the convertible notes intending to sell such notes back
into the marketplace over the next 12 months if market conditions permit. The partnership will be consolidated within Omnicom’s financial statements.
For purposes of this presentation we have included the following borrowings as of December 31, 2008 as outstanding through June 2011, the date of expiration of
our five-year credit facility: short-term borrowings of $16 million and other debt of $20 million. We believe that this presentation is more meaningful for purposes of
understanding how we evaluate the maturities of our debt structure.
Other
Borrowings
$2.04 Billion
Senior Convertible Notes
$1.0 Billion
10-Year Note
2038
2032
2031
$0
$200
$400
$600
$800
$1,000
$1,200
Jan-08
Jan-09
Jan-10
Jan-11
Jan-12
Jan-13
Jan-14
Jan-15
Jan-16

Current Credit Picture Update
February 10, 2009
13
On February 9, 2009, holders of $841.2 million aggregate principal amount of Omnicom’s convertible notes due 2031 put their notes to
Omnicom for purchase at par in accordance with the terms of the indenture under which the convertible notes were issued. Omnicom
borrowed $814.4 million under its existing $2.5 billion five-year revolving credit facility and received $26.8 million from unaffiliated equity
investors in the partnership referred to below to fund the purchase of the notes. Omnicom purchased and retired $295.2 million aggregate
principal amount of the convertible notes that had been put. A partnership controlled by Omnicom and formed for the purpose of buying the
convertible notes used a portion of Omnicom’s credit facility borrowings and the contributed equity to purchase the remaining $546.0 million
aggregate principal amount of convertible notes that were put. The partnership purchased the convertible notes intending to sell such
notes back into the marketplace over the next 12 months if market conditions permit. The partnership will be consolidated within
Omnicom’s financial statements.
On February 9, 2009 $841 million of the 2031 notes were put back to us for purchase.
The below amounts reflect how we financed the purchase of these bonds and do not
reflect any other financing activities that occurred subsequent to December 31, 2008.
Debt at
Updated to Reflect
Put of 2031 Notes
Debt:
Short-term borrowings (Due Less Than 1 Year)
$
16
$
16
5 Year Revolver Due 6/23/11
-
814
Convertible Notes Due 2/7/31
847
6
Convertible Notes Due 7/31/32
727
727
Convertible Notes Due 6/15/33
-
-
Convertible Notes Due 7/1/38
467
467
10 Year Notes Due 4/15/16
996
996
Other Debt
20
20
Total Debt
$
3,073
$
3,046
December 31, 2008

Senior Notes Due 2016
February 10, 2009
14
Principal Amount
$1 Billion
Co - Issuers
Omnicom Group, Omnicom Finance, Omnicom Capital
Date
March 29, 2006
Maturity
April 15, 2016
Security
Unsecured, pari passu with Bank Facility
Coupon
5.90%
Spread Over Comparable Treasury at Issue
1.30%
Rating
Moody’s: Baa1
S&P: A-
Fitch: A-

2031 Convertible Notes
February 10, 2009
15
Principal Amount
$847 Million
Co - Issuers
Omnicom Group, Omnicom Finance, Omnicom Capital
Date
February 7, 2001
Maturity
February 7, 2031 with annual puts each February
Security
Unsecured, pari passu with Bank Facility
Coupon
0.00%
Conversion Price
$55
Rating
Moody’s: Baa1
S&P: A-
Fitch: A-
Note: On February 9, 2009, holders of $841.2 million aggregate principal amount of Omnicom’s convertible notes due 2031 put their notes
to Omnicom for purchase at par in accordance with the terms of the indenture under which the convertible notes were issued. Omnicom
borrowed $814.4 million under its existing $2.5 billion five-year revolving credit facility and received $26.8 million from unaffiliated equity
investors in the partnership referred to below to fund the purchase of the notes. Omnicom purchased and retired $295.2 million aggregate
principal amount of the convertible notes that had been put. A partnership controlled by Omnicom and formed for the purpose of buying the
convertible notes used a portion of Omnicom’s credit facility borrowings and the contributed equity to purchase the remaining $546.0 million
aggregate principal amount of convertible notes that were put. The partnership purchased the convertible notes intending to sell such
notes back into the marketplace over the next 12 months if market conditions permit. The partnership will be consolidated within
Omnicom’s financial statements.

2032 Convertible Notes
February 10, 2009
16
Principal Amount
$727 Million
Co - Issuers
Omnicom Group, Omnicom Finance, Omnicom Capital
Date
March 6, 2002
Maturity
July 31, 2032 with annual puts each July
Security
Unsecured, pari passu with Bank Facility
Coupon
0.00%
Conversion Price
$55
Rating
Moody’s: Baa1
S&P: A-
Fitch: A-

2038 Convertible Notes
February 10, 2009
17
Principal Amount
$467 Million
Co - Issuers
Omnicom Group, Omnicom Finance, Omnicom Capital
Date
June 10, 2003
Maturity
June 15, 2038 with puts in June of 2010, 2013, 2018, 2023
and annually thereafter until maturity
Security
Unsecured, pari passu with Bank Facility
Coupon
0.00%
Conversion Price
$51.50
Rating
Moody’s: Baa1
S&P: A-
Fitch: A-

Current Bank Credit Facility
February 10, 2009
18
Amount
$2.5 Billion
Type
Unsecured Revolving Credit
Maturity
5 Years – June 2011
Facility Fee
13BP per annum
Drawn Rate
Libor +17BP
Covenants
-Maximum Debt to EBITDA 3:1
-Minimum Interest Coverage 5:1

Current Bank Credit Facility – Distribution of 33 Banks
February 10, 2009
19
North America
Bank of America ($200)
Wells Fargo ($175)
Northern Trust ($50)
PNC ($50)
Union Bank of California ($50)
US Bancorp ($50)
Scotia ($40)
Comerica ($25)
Key ($25)
Fifth Third ($15)
Global
Citigroup ($100) • JP Morgan ($200) • HSBC ($200) • Royal Bank of Scotland ($150)
Europe
Societe Generale ($150)
Deutsche ($150)
BBVA ($100)
Commerzbank ($80)
Fortis ($70)
BNP Paribas ($60)
Barclays ($50)
Den Danske ($50)
UBS ($35)
Intesa San Paolo ($30)
ING ($25)
Nordea ($25)
Unicredit ($25)
Asia
Sumitomo ($100)
Bank of Tokyo ($50)
Mizuho ($50)
ANZ ($50)
Standard Chartered ($45)
Westpac ($25)

Current Omnicom Credit Ratings
February 10, 2009
20
Moody’s
S&P
Fitch
Long Term Ratings
Baa1
A-
A-
Short Term Ratings
P2
A2
F2
Outlook
Stable
Stable
Stable

Reconciliation of Operating Income to EBITDA
February 10, 2009
21
The covenants contained in our credit facility are based on the EBITDA ratios as presented on pages 8 & 18 of this presentation. The
above reconciles our GAAP Operating Income to EBITDA for the periods presented.
EBITDA is a non-GAAP financial measure within the meaning of applicable SEC rules and regulations Our credit facility defines EBITDA
as earnings before deducting interest expense, income taxes, depreciation and amortization. Our credit facility uses EBITDA to measure
our compliance with covenants, such as interest coverage and leverage. EBITDA is not, and should not, be used as a substitute for
Operating Income as determined in accordance with GAAP and is only used to measure our compliance with our debt covenants.
Management does not use EBITDA for any other measurement purpose.
2008
2007
Operating Income
$
1,689
1,659
Depreciation
183
164
Amortization
53
45
EBITDA
$
1,925
1,868
Full Year

Acquisitions Summary

Acquisition Related Expenditures
February 10, 2009
23
Note: See pages 26-28 for acquisition profiles.
a)
Includes acquisitions of a majority interest in agencies resulting in their consolidation.
b)
Includes acquisitions of additional equity interests in existing affiliate agencies resulting in their majority ownership and consolidation.
c)
Includes acquisitions of less than a majority interest in agencies in which Omnicom did not have a prior equity interest and the acquisition
of additional interests in existing affiliated agencies that did not result in majority ownership.
d)
Includes the acquisition of additional equity interests in already consolidated subsidiary agencies.
e)
Includes additional consideration paid for acquisitions completed in prior periods.
Full Year 2008
New Subsidiary Acquisitions (a)
89
$
Affiliates to Subsidiaries (b)
37
Affiliates (c)
88
Existing Subsidiaries (d)
99
Earn-outs (e)
179
Total Acquisition Expenditures
492
$

Potential Earn-out Obligations
February 10, 2009
24
The following is a calculation of future earn-out obligations as of December 31, 2008,
assuming that the underlying acquired agencies continue to perform at their current levels: (a)
(a)
The ultimate payments will vary as they are dependent on future events, including changes in FX rates.
2009
2010
2011
2012
Thereafter
Total
$ 118
$ 99
$ 53
$ 33
$ 12
$ 315

Potential Obligations
February 10, 2009
25
a)
The ultimate payments will vary as they are dependent on future events, including changes in FX rates.
In conjunction with certain transactions, Omnicom has agreed to acquire (at the sellers’ option)
additional equity interests. If these rights are exercised, there would likely be an increase in our
net income as a result of our increased ownership and the reduction of minority interest
expense. The following is a calculation of these potential future obligations, assuming the
underlying acquired agencies continue to perform at their current levels: (a)
Currently
Exercisable
Not Currently
Exercisable
Total
Subsidiary Agencies
138
$
63
$
201
$
Affiliated Agencies
41
-
41
Total
179
$
63
$
242
$
Fourth Quarter Acquisitions
February 10, 2009
26
Access Communications is a full service public relations agency that
provides comprehensive, integrated marketing programs, focusing in the hi-
tech and consumer-tech area. The company’s services include strategic
planning, social media relations including blogger relations and blog
monitoring, tracking online presence, building on-line communities and
producing blog, vlog and podcast content.
With offices in San Francisco and New York, Access Communications will
operate within Ketchum’s Global Technology practice.

Fourth Quarter Acquisitions
February 10, 2009
27
New Performance is a full service healthcare advertising agency, creating integrated
healthcare campaigns for global as well as local clients within Germany. A member
of the DAS affiliate network for the past three years, New Performance has
collaborated with many Omnicom agencies as the healthcare resource in Germany
on international healthcare clients.
Located in Munich, Germany, New Performance will form part of the Cline Davis &
Mann (CDM) global network and will be rebranded CDM Munich.

Fourth Quarter Acquisitions
February 10, 2009
28
Yellowwood Future Architects is a marketing and brand strategy agency established
in 1997. One of the most respected entities in its field in South Africa, Yellowwood
Future Architects’ offering includes brand and marketing strategy, brand insights and
intelligence, brand design and experience creation.
Yellowwood Future Architects has offices in Cape Town and Johannesburg, South
Africa and will operate within TBWA\South Africa.