
Investor Presentation
First Quarter 2009 Results
April 27, 2009
Exhibit 99.2

Disclosure
The following materials have been prepared for use in the April 27, 2009 conference call on Omnicom’s results of operations
for the quarter ended March 31, 2009. The call will be archived on the Internet at
http://www.omnicomgroup.com/financialwebcasts.
Forward-Looking Statements
Certain of the statements in this document constitute forward-looking statements within the meaning of the Private Securities
Litigation Act of 1995 . In addition, from time to time, we or our representatives have made or may make forward-looking
statements, orally or in writing. These statements relate to future events or future financial performance and involve known and
unknown risks and other factors that may cause our actual or our industry’s results, levels of activity or achievement to be
materially different from those expressed or implied by any forward-looking statements. These risks and uncertainties include,
but are not limited to, our future financial condition and results of operations, the continuing global economic recession and
credit crisis, losses on media purchases on behalf of clients, reductions in client spending and/or a slowdown in client
payments, competitive factors, changes in client communication requirements, the hiring and retention of personnel, our ability
to attract new clients and retain existing clients, changes in government regulations impacting our advertising and marketing
strategies, risks associated with assumptions we make in connection with our critical accounting estimates, legal proceedings,
settlements, investigations and claims, and our international operations, which are subject to the risks of currency fluctuations
and exchange controls. In some cases, forward-looking statements can be identified by terminology such as “may,” “will,”
“could,” “would,” “should,” “expect,” “plan,” “anticipate,” “intend,” “believe,” “estimate,” “predict,” “potential” or “continue” or the
negative of those terms or other comparable terminology. These statements are present expectations. Actual events or results
may differ materially. We undertake no obligation to update or revise any forward-looking statement, except as required by law.
Other Information
All dollar amounts are in millions except for EPS. The following financial information contained in this document has not been
audited, although some of it has been derived from Omnicom’s historical financial statements, including its audited financial
statements. In addition, industry, operational and other non-financial data contained in this document have been derived from
sources we believe to be reliable, but we have not independently verified such information, and we do not, nor does any other
person, assume responsibility for the accuracy or completeness of that information.
The inclusion of information in this presentation does not mean that such information is material or that disclosure of such
information is required.
1
April 27, 2009

2009 vs. 2008 P&L Summary
April 27, 2009
2
(a)
On January 1, 2009 we adopted SFAS 160, Noncontrolling Interests in Consolidated Financial Statements - an amendment of
ARB No. 51. In accordance with the presentation requirements of SFAS 160, we have reclassified the amounts reported previously
as minority interest expense in 2008 as noncontrolling interests to be consistent with the 2009 presentation.
(b)
See pages 20-21 for supplemental earnings per share information.
2009
2008
% Δ
Revenue
$ 2,746.6
$ 3,195.4
-14.0%
Operating Income
282.4
350.8
-19.5%
% Margin
10.3%
11.0%
Net Interest Expense
21.4
11.0
Income Before Tax
261.0
339.8
-23.2%
% Margin
9.5%
10.6%
Taxes
88.7
115.2
% Tax Rate
34.0%
33.9%
Income from Equity Method Investments
5.9
8.1
Net Income (a)
178.2
232.7
Less: Net Income Attributed to Noncontrolling Interests (a)
(13.7)
(24.0)
Net Income - Omnicom Group
$ 164.5
$ 208.7
-21.2%
Net Income per Common Share - Omnicom Group - Diluted (b)
0.53
$
0.64
$
-17.2%
First Quarter

3
Total Revenue Growth – First Quarter 2009
April 27, 2009
(a)
To calculate the FX impact, we first convert the current period’s local currency revenue using the average exchange rates from the
equivalent prior period to arrive at constant currency revenue. The FX impact equals the difference between the current period revenue
in U.S. dollars and the current period revenue in constant currency.
(b)
Acquisition revenue is the aggregate of the applicable prior period revenue of the acquired businesses. Netted against this number is
the revenue of any business included in the prior period reported revenue that was disposed of subsequent to the prior period.
(c)
Organic revenue is calculated by subtracting both the acquisition revenue and the FX impact from total revenue growth.
$
%
Prior Period Revenue
3,195.4
$
Foreign Exchange (FX) Impact (a)
(252.3)
-7.8%
Acquisition Revenue (b)
14.1
0.4%
Organic Revenue (c)
(210.6)
-6.6%
Current Period Revenue
2,746.6
$
-14.0%
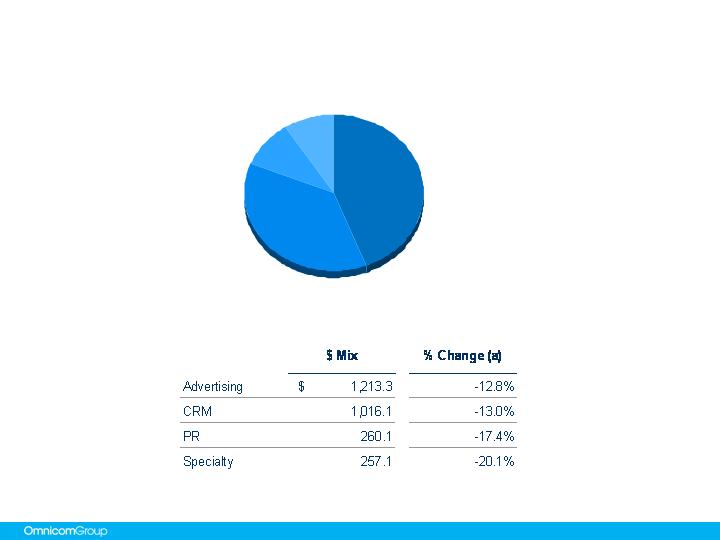
Revenue by Discipline – First Quarter 2009
April 27, 2009
4
(a)
“Change” is the year-over-year increase or decrease from the prior period.
CRM
37.0%
PR
9.5%
Specialty
9.3%
Advertising
44.2%
(a)
“Change” is the year-over-year increase or decrease from the prior period.
5
April 27, 2009
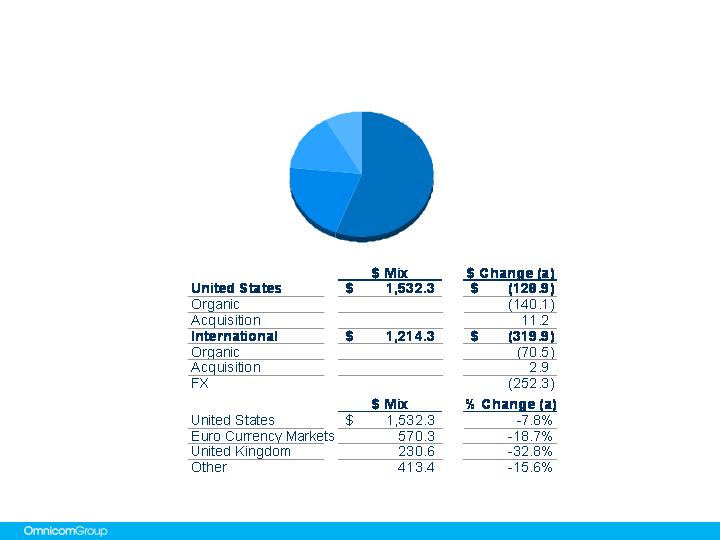
Revenue by Geography – First Quarter 2009
Euro
Markets
20.8%
U.S.
55.8%
Other
15.0%
U.K.
8.4%

6
Cash Flow – GAAP Presentation (condensed)
April 27, 2009
2009
2008
Net Income
Share-Based Compensation Expense
Depreciation and Amortization
Other Non-Cash Items to Reconcile to Net Cash Used for Operations
Other Changes in Operating Capital
Net Cash Used by Operations
Capital Expenditures
Acquisitions
Other Investing Activities, net
Net Cash (Used) Provided by Investing Activities
Dividends
Proceeds from Short-term Debt, net
Proceeds from Long-term Debt, net
Repayment of Convertible Debt
Stock Repurchases
Proceeds from Stock Plans
Excess Tax Benefit on Share-based Compensation
-
Other Financing Activities, net
Net Cash Used by Financing Activities
Effect of exchange rate changes on cash and cash equivalents
Net Decrease in Cash and Cash Equivalents
178.2
$
14.5
55.8
(2.8)
(474.1)
(228.4)
(23.3)
(3.1)
3.8
(22.6)
(46.7)
28.3
505.5
(841.8)
(1.8)
0.2
(14.2)
(370.5)
(63.4)
(684.9)
$
232.7
$
15.2
57.2
(3.5)
(809.2)
(507.6)
(42.2)
(89.0)
(3.7)
(134.9)
(49.1)
7.4
1.7
(0.1)
(316.0)
33.2
4.1
(21.7)
(340.5)
3.7
(979.3)
$
3 Months ended March 31,

Current Credit Picture
April 27, 2009
7
(a)
“EBITDA” and “Gross Interest Expense” calculations shown are for the twelve months ending March 31. EBITDA is defined as
operating income before interest, taxes, depreciation and amortization. Although EBITDA is a non-GAAP measure, we believe
EBITDA is more meaningful for purposes of this analysis because the financial covenants in our credit facilities are based on EBITDA
(see reconciliation of Operating Income to EBITDA on page 23).
2009
2008
EBITDA (a)
$
1,856
$
1,912
Gross Interest Expense (a)
$
126.0
$
104.5
EBITDA / Gross Interest Expense
14.7
x
18.3
x
Total Debt / EBITDA
1.5
x
1.6
x
Debt:
Bank Loans (Due Less Than 1 Year)
$
44
$
20
CP Issued Under $2.5B Revolver Due 6/23/11
30
-
Borrowings Under $2.5B Revolver Due 6/23/11
475
-
Convertible Notes Due 2/7/31
6
847
Convertible Notes Due 7/31/32
727
727
Convertible Notes Due 6/15/33
-
-
Convertible Notes Due 7/1/38
467
467
10 Year Notes Due 4/15/16
997
996
Other Debt
18
21
Total Debt
$
2,764
$
3,078
Cash and Short Term Investments
427
863
Net Debt
$
2,337
$
2,215
12 Months ended March 31,

8
Current Liquidity Picture
April 27, 2009
(a)
Credit facility expires June 23, 2011.
(b)
Represents uncommitted facilities in the U.S., U.K. and Canada. These amounts are excluded from our available liquidity for purposes
of this presentation.
Total
Amount of
Facility
Outstanding
Available
Committed Facilities
Revolver & Commercial Paper (a)
2,500
$
505
$
1,995
$
Other Committed Credit Facilities
44
44
-
Total Committed Facilities
2,544
549
1,995
Uncommitted Facilities (b)
370
-
-
(b)
Total Credit Facilities
2,914
$
549
$
1,995
$
Cash and Short Term Investments
427
Total Liquidity Available
2,422
$
As of March 31, 2009

Omnicom Debt Structure
Supplemental Information

The above chart reflects Omnicom’s debt outstanding at March 31, 2009. The amount reflected above for the 10 Year Notes
represents the principal amount of these notes at maturity on April 15, 2016.
10
April 27, 2009
Omnicom Debt Structure
Other Debt
$18
Short-term
Borrowings
$44
Commercial Paper
$30
2031 Convert
$6
Revolver
Borrowing
$475
2038
Convert
$467
2032
Convert
$727
10 Year Notes
$1,000
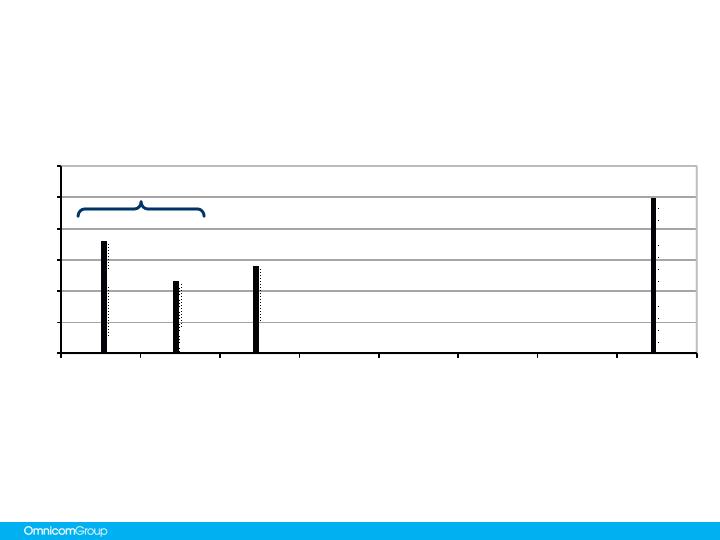
Omnicom Debt Structure
April 27, 2009
11
The Bank Facility and Commercial Paper Program together provide liquidity in the event any
convertible notes are put. We then have flexibility to refinance in different debt capital
markets.
Our 2031 Notes are putable annually, with the next put date in February 2010. Our 2032 Notes are putable annually, with the
next put date in July 2009. Our 2038 Notes are putable in June 2010, 2013, 2018, 2023 and annually thereafter.
For purposes of this presentation we have included the following borrowings as of March 31, 2009 as outstanding through
June 2011, the date of expiration of our five-year credit facility: short-term borrowings of $44 million, revolver borrowings of
$475 million, commercial paper of $30 million and and other debt of $18 million. We believe that this presentation is more
meaningful for purposes of understanding how we evaluate the maturities of our debt structure.
Revolver
and Other
Borrowings
$1.2 Billion
Senior Convertible Notes
$1.0 Billion
10-Year Note
2038
2032
2031
$0
$200
$400
$600
$800
$1,000
$1,200
Jan
-
09
Jan
-
10
Jan
-
11
Jan
-
12
Jan
-
13
Jan
-
14
Jan
-
15
Jan
-
16

Senior Notes Due 2016
April 27, 2009
12
Principal Amount
$1 Billion
Co - Issuers
Omnicom Group, Omnicom Finance, Omnicom Capital
Date
March 29, 2006
Maturity
April 15, 2016
Security
Unsecured, pari passu with Bank Facility
Coupon
5.90%
Spread Over Comparable Treasury at Issue
1.30%
Rating
Moody’s: Baa1
S&P: A-
Fitch: A-

2031 Convertible Notes
April 27, 2009
13
Principal Amount
$6 Million
Co - Issuers
Omnicom Group, Omnicom Finance, Omnicom Capital
Date
February 7, 2001
Maturity
February 7, 2031 with annual puts each February
Security
Unsecured, pari passu with Bank Facility
Coupon
0.00%
Conversion Price
$55
Rating
Moody’s: Baa1
S&P: A-
Fitch: A-
Note: On February 9, 2009, $841.2 million aggregate principal amount of Omnicom’s convertible notes due 2031 were put
to Omnicom for purchase at par and $5.8 million of the notes remain outstanding. Omnicom borrowed $814.4 million under
its existing $2.5 billion five-year revolving credit facility. A partnership controlled by Omnicom and formed for the purpose of
buying the convertible notes used a portion of the proceeds under Omnicom’s borrowing to purchase $546.0 million
aggregate principal amount of convertible notes that were put. The controlled partnership purchased the convertible notes
with the intent to sell such notes back into the marketplace over the next 12 months if market conditions permit. The
partnership is consolidated within Omnicom’s financial statements.
Omnicom repurchased the remaining $295.2 million aggregate principal amount of the convertible notes that had been put,
all of which have been retired.

2032 Convertible Notes
April 27, 2009
14
Principal Amount
$727 Million
Co - Issuers
Omnicom Group, Omnicom Finance, Omnicom Capital
Date
March 6, 2002
Maturity
July 31, 2032 with annual puts each July
Security
Unsecured, pari passu with Bank Facility
Coupon
0.00%
Conversion Price
$55
Rating
Moody’s: Baa1
S&P: A-
Fitch: A-

2038 Convertible Notes
April 27, 2009
15
Principal Amount
$467 Million
Co - Issuers
Omnicom Group, Omnicom Finance, Omnicom Capital
Date
June 10, 2003
Maturity
June 15, 2038 with puts in June of 2010, 2013, 2018, 2023
and annually thereafter until maturity
Security
Unsecured, pari passu with Bank Facility
Coupon
0.00%
Conversion Price
$51.50
Rating
Moody’s: Baa1
S&P: A-
Fitch: A-

Current Bank Credit Facility
April 27, 2009
16
Amount
$2.5 Billion
Type
Unsecured Revolving Credit
Maturity
5 Years – June 2011
Facility Fee
13BP per annum
Drawn Rate
Libor +17BP
Covenants
-Maximum Debt to EBITDA 3:1
-Minimum Interest Coverage 5:1

Current Bank Credit Facility – Distribution of 33 Banks
April 27, 2009
17
North America
Bank of America ($200)
Wells Fargo ($175)
Northern Trust ($50)
PNC ($50)
Union Bank of California ($50)
US Bancorp ($50)
Scotia ($40)
Comerica ($25)
Key ($25)
Fifth Third ($15)
Global
Citigroup ($100) • JPMorgan ($200) • HSBC ($200) • Royal Bank of Scotland ($150)
Europe
Societe Generale ($150)
Deutsche ($150)
BBVA ($100)
Commerzbank ($80)
Fortis ($70)
BNP Paribas ($60)
Barclays ($50)
Den Danske ($50)
UBS ($35)
Intesa San Paolo ($30)
ING ($25)
Nordea ($25)
Unicredit ($25)
Asia
Sumitomo ($100)
Bank of Tokyo ($50)
Mizuho ($50)
ANZ ($50)
Standard Chartered ($45)
Westpac ($25)

Current Omnicom Credit Ratings
April 27, 2009
18
Moody’s
S&P
Fitch
Long Term Ratings
Baa1
A-
A-
Short Term Ratings
P2
A2
F2
Outlook
Negative
Negative
Stable

Supplemental Financial Information

20
Q1 2009 vs. Q1 2008 Earnings Per Share (a)
April 27, 2009
a)
On January 1, 2009, we adopted FSP EITF 03-6-1 entitled “Determining Whether Instruments Granted in Share-Based
Payment Transactions Are Participating Securities”. Our unvested restricted stock awards pay dividends and therefore
qualify as participating securities. In accordance with EITF 03-6-1, Net income, for the purposes of the basic and diluted
EPS calculation is reduced for a presumed hypothetical distribution of earnings to the holders of the unvested restricted
stock. Accordingly, the effect of the allocation required under EITF 03-6-1 reduces Earnings Available to Common
Shareholders. Additionally, the unvested restricted shares were excluded from the calculation of diluted EPS because their
inclusion would have been anti-dilutive. The above information reflects the effect of the adoption on Earnings per Share as if
we adopted EITF 03-6-1 at the beginning of the period and the 2008 amounts have been adjusted (see page 21).
2009
2008
Net Income per Common Share - Omnicom Group:
Basic
$0.53
$0.65
Diluted
0.53
0.64
Earnings Available for Common Shares:
Net Income - Omnicom Group
$ 164.5
$ 208.7
Earnings Allocated to Participating Securities
(2.2)
(2.6)
Earnings Available for Common Shares
$ 162.3
$ 206.1
Weighted Average Shares (millions):
Basic
307.5
318.3
Diluted
307.6
320.1
Dividend Declared per Share
$0.150
$0.150

21
2008 Earnings Per Share Revised (a)
a)
On January 1, 2009, we adopted FSP EITF 03-6-1 entitled “Determining Whether Instruments Granted in Share-Based
Payment Transactions Are Participating Securities”. Our unvested restricted stock awards pay dividends and therefore
qualify as participating securities. In accordance with EITF 03-6-1, Net income, for the purposes of the basic and
diluted EPS calculation is reduced for a presumed hypothetical distribution of earnings to the holders of the unvested
restricted stock. Accordingly, the effect of the allocation required under EITF 03-6-1 reduces Earnings Available to
Common Shareholders. Additionally, the unvested restricted shares were excluded from the calculation of diluted EPS
because their inclusion would have been anti-dilutive. The above information reflects the effect of the adoption on
Earnings per Share as if we adopted EITF 03-6-1 at the beginning of the period and the 2008 amounts have been
adjusted.
April 27, 2009
Q1
Q2
Q3
Q4
Full Year
As Previously Presented:
Basic EPS
$0.65
$0.97
$0.69
$0.88
$3.20
Diluted EPS
0.65
0.96
0.69
0.88
3.17
Weighted Average Shares (millions):
Basic
318.6
317.5
309.1
307.2
313.0
Diluted
320.9
320.8
310.7
307.2
315.4
Net Income for EPS:
Diluted
$208.7
$307.0
$213.6
$271.0
$1,000.3
As Revised:
Basic EPS
$0.65
$0.96
$0.68
$0.87
$3.15
Diluted EPS
0.64
0.95
0.68
0.87
3.14
Weighted Average Shares (millions):
Basic
318.3
317.5
309.1
307.2
313.0
Diluted
320.1
319.6
310.3
307.2
314.8
Earnings Available for Common Shares:
Net Income - Omnicom Group
$208.7
$307.0
$213.6
$271.0
$1,000.3
Earnings Allocated to Participating Securities
(2.6)
(3.1)
(3.1)
(3.9)
(12.8)
Earnings Available for Common Shares
$206.1
$303.9
$210.5
$267.1
$987.5

Acquisition Related Expenditures
April 27, 2009
22
a)
Includes acquisitions of a majority interest in agencies resulting in their consolidation.
b)
Includes acquisitions of additional equity interests in existing affiliate agencies resulting in their majority ownership and
consolidation.
c)
Includes acquisitions of less than a majority interest in agencies in which Omnicom did not have a prior equity interest and
the acquisition of additional interests in existing affiliated agencies that did not result in majority ownership.
d)
Includes the acquisition of additional equity interests in already consolidated subsidiary agencies. On January 1, 2009 we
adopted SFAS No. 160 “Noncontrolling Interests in Consolidated Financial Statements—an amendment of ARB No. 51”.
As required by SFAS 160, these transactions are now reported directly in equity.
e)
Includes additional consideration paid for acquisitions completed in prior periods.
First Quarter 2009
New Subsidiary Acquisitions (a)
-
$
Affiliates to Subsidiaries (b)
-
Affiliates (c)
-
Existing Subsidiaries (d)
1
Earn-outs (e)
2
Total Acquisition Expenditures
3
$

Reconciliation of Operating Income to EBITDA
April 27, 2009
23
The covenants contained in our credit facility are based on the EBITDA ratios as presented on pages 7 & 16 of this presentation.
The above reconciles our GAAP Operating Income to EBITDA for the periods presented.
EBITDA is a non-GAAP financial measure within the meaning of applicable SEC rules and regulations Our credit facility defines
EBITDA as earnings before deducting interest expense, income taxes, depreciation and amortization. Our credit facility uses
EBITDA to measure our compliance with covenants, such as interest coverage and leverage. EBITDA is not, and should not, be
used as a substitute for Operating Income as determined in accordance with GAAP and is only used to measure our compliance
with our debt covenants. Management does not use EBITDA for any other measurement purpose.
2009
2008
Operating Income
1,621
$
1,694
$
Depreciation
181
171
Amortization
54
47
EBITDA
1,856
$
1,912
$
12 Months ended March 31,