Exhibit 99.2
| |
 |  Investor Presentation Investor Presentation |
Third Quarter 2010 Results October 19, 2010 |
Disclosure
Thefollowing materialshave beenpreparedfor use in theOctober19, 2010conferencecall onOmnicom’sresults ofoperationsfor the period endedSeptember30, 2010. The call will bearchivedon theInternetathttp://www. omnicomgroup. com/financialwebcasts.
Forward-Looking Statements
Certainof thestatementsin thisdocument constitute forward-looking statementswithin themeaningof thePrivate Securities LitigationReform Act of 1995. In addition, from time to time, we or our representatives have made or may make forward -looking statements, orally or in writing. These statements relate to future events or future financial performance and involve known and unknown risks and other factors that may cause our actual or our industry’s results, levels of activity, or achievement to be materially different from those expressed or implied by any forward -looking statements. These risks and uncertainties include, but are not limited to, our future financial condition and results of operations, global economic conditions and renewed turmoil in the credit markets, losses on media purchases on behalf of clients, reductions in client spending and/or a slowdown in client payments, competitive factors, changes in client communication requirements, the hiring and retention of personnel, our ability to attract new clients and retain existing clients, changes in government regulations impacting our advertising and marketing strategies, risks associated with assumptions we make in connection with our critical accounting estimates, and our international operations, which are subject to the risks of currency fluctuations and foreign exchange controls. In some cases, forward -looking statements can be identified by terminology such as “may,” “will,” “could,” “would,” “should,” “expect,” “plan,” “anticipate,” “intend,” “believe,” “estimate,” “predict,” “potential” or “continue” or the negative of those terms or other comparable terminology. These statements are our present expectations. Actual events or results may differ. We undertake no obligation to update or revise any forward - -looking statement, except as required by law.
OtherInformation
All dollar amounts are in millions except for per share amounts. The following financial information contained in this document has not been audited, although some of it has been derived from Omnicom’s historical financial statements, including its audited financial statements. In addition, industry, operational and other non-financial data contained in this document have been derived from sources we believe to be reliable, but we have not independently verified such information, and we do not, nor does any other person, assume responsibility for the accuracy or completeness of that information. Certain amounts in prior periods have been reclassified to conform to our current presentation.
The inclusion of information in this presentation does not mean that such information is material or that disclosure of such information is required.
| | |
 | October 19, 2010 | 1 |
2010 vs. 2009 P&L Summary
| | Third Quarter (b)
| | | Year to Date (b)
|
| | 2010
| | 2009
| | %D
| 2010
| | 2009
| | %D
|
| Revenue | $ | 2,994.6 | | | $ | 2,837.6 | | | 5.5 | % | $ | 8,955.7 | | | $ | 8,454.9 | | | 5.9 | % |
|
| | |
| | | | |
| | |
| | | | |
| EBITA (a) | | 332.1 | | | | 309.5 | | | 7.3 | % | | 1,071.3 | | | | 1,016.5 | | | 5.4 | % |
| % Margin | | 11.1 | % | | | 10.9 | % | | | | | 12.0 | % | | | 12.0 | % | | | |
|
| | |
| | | | |
| | |
| | | | |
| Amortization of Intangibles | | 18.0 | | | | 14.7 | | | | | | 50.7 | | | | 41.2 | | | | |
|
| | |
| | | | |
| | |
| | | | |
| Operating Income (a) | | 314.1 | | | | 294.8 | | | 6.5 | % | | 1,020.6 | | | | 975.3 | | | 4.6 | % |
| % Margin | | 10.5 | % | | | 10.4 | % | | | | | 11.4 | % | | | 11.5 | % | | | |
|
| | |
| | | | |
| | |
| | | | |
| Net Interest Expense | | 29.8 | | | | 28.9 | | | | | | 77.7 | | | | 72.1 | | | | |
|
| | |
| | | | |
| | |
| | | | |
| Income Before Taxes | | 284.3 | | | | 265.9 | | | 6.9 | % | | 942.9 | | | | 903.2 | | | 4.4 | % |
| % Margin | | 9.5 | % | | | 9.4 | % | | | | | 10.5 | % | | | 10.7 | % | | | |
|
| | |
| | | | |
| | |
| | | | |
| Taxes | | 96.9 | | | | 90.5 | | | | | | 320.8 | | | | 308.9 | | | | |
| % Tax Rate | | 34.1 | % | | | 34.0 | % | | | | | 34.0 | % | | | 34.2 | % | | | |
|
| | |
| | | | |
| | |
| | | | |
| Income from Equity Method Investments | | 8.2 | | | | 7.3 | | | | | | 23.1 | | | | 20.5 | | | | |
|
| | |
| | | | |
| | |
| | | | |
| Net Income | | 195.6 | | | | 182.7 | | | | | | 645.2 | | | | 614.8 | | | | |
|
| | |
| | | | |
| | |
| | | | |
| Less: Noncontrolling Interests | | (21.0 | ) | | | (17.1 | ) | | | | | (64.0 | ) | | | (51.3 | ) | | | |
|
| | |
| | | | |
| | |
| | | | |
| Net Income - Omnicom Group | | 174.6 | | | | 165.6 | | | 5.4 | % | | 581.2 | | | | 563.5 | | | 3.1 | % |
|
| | |
| | | | |
| | |
| | | | |
| Less: Net Income Allocated to Participating Securities | | (1.7 | ) | | | (1.8 | ) | | | | | (5.6 | ) | | | (6.6 | ) | | | |
|
| | |
| | | | |
| | |
| | | | |
| Net Income Available for Common Shares | $ | 172.9 | | | $ | 163.8 | | | | | $ | 575.6 | | | $ | 556.9 | | | | |
| |
| | |
| | | | |
| | |
| | | | |
| Net Income per Common Share - Omnicom Group -Diluted | $ | 0.57 | | | $ | 0.53 | | | 7.5 | % | $ | 1.88 | | | $ | 1.80 | | | 4.4 | % |
| (a) | EBITA and Operating income includes depreciation expense of $44.5 million and $45.4 million for the three months and $134.9 million and $132.6 million for the nine months ended September 30, 2010 and 2009, respectively. |
| (b) | See page 20 for additional earnings per share information and page 22 for reconciliation of non-GAAP measures. |
| | |
| | October 19, 2010 | 2 |
2010 Total Revenue Change
| | Third Quarter
| | | Year to Date
|
| | $
| | %D
| $
| | %D
|
| Prior Period Revenue | $ | 2,837.6 | | | | | $ | 8,454.9 | | | |
| |
| |
| |
| |
| Foreign Exchange (FX) Impact (a) | | (52.9 | ) | | -1.9% | | | 59.1 | | 0.7% | |
| |
| |
| |
| |
| Acquisition Revenue (b) | | 19.6 | | | 0.7% | | | 18.1 | | 0.2% | |
| |
| |
| |
| |
| Organic Revenue (c) | | 190.3 | | | 6.7% | | | 423.6 | | 5.0% | |
| |
| |
| |
| |
| Current Period Revenue | $ | 2,994.6 | | | 5.5% | | $ | 8,955.7 | | 5.9% | |
| |
| | |
| |
| |
| |
| (a) | To calculate the FX impact, we first convert the current period’s local currency revenue using the average exchange rates from the equivalent prior period to arrive at constant currency revenue. The FX impact equals the difference between the current period revenue in U.S. dollars and the current period revenue in constant currency. |
| (b) | Acquisition revenue is the aggregate of the applicable prior period revenue of the acquired businesses. Netted against this number is the revenue of any business included in the prior period reported revenue that was disposed of subsequent to the prior period. |
| (c) | Organic revenue is calculated by subtracting both the acquisition revenue and the FX impact from total revenue growth. |
| | |
| | October 19, 2010 | 3 |
2010 Revenue by Discipline

| | $ Mix
| | % Change(a)
| | % Organic
Change(b)
|
| Advertising | $ | 1,331.9 | | 6.1 | % | | 6.5 | % |
| |
| |
|
| CRM | | 1,108.4 | | 4.7 | % | | 7.3 | % |
| |
| |
|
| PR | | 279.9 | | 5.1 | % | | 5.4 | % |
| |
| |
|
| Specialty | | 274.4 | | 6.3 | % | | 6.8 | % |

| | $ Mix
| | % Change(a)
| | % Organic
Change(b)
|
| Advertising | $ | 4,008.7 | | 5.3 | % | | 3.1 | % |
| |
| |
|
| CRM | | 3,261.7 | | 6.6 | % | | 6.4 | % |
| |
| |
|
| PR | | 846.7 | | 6.1 | % | | 4.6 | % |
| |
| |
|
| Specialty | | 838.6 | | 6.3 | % | | 9.3 | % |
| (a) | “Change” is the year-over-year increase from the prior period. |
| (b) | “Organic Change” reflects the year-over-year increase in revenue from the prior period, excluding the FX Impact and Acquisition Revenue, as defined on page 3. |
| | |
| | October 19, 2010 | 4 |
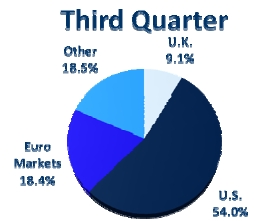
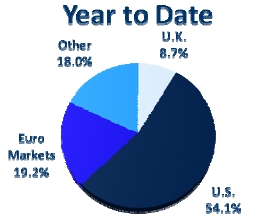
2010 Revenue By Geography
| | | $ Mix
| | $ Change(a)
|
| United States | | $ | 1,617.1 | | $ | 125.9 | |
| |
| |
|
| Organic | | | | | | 125.9 | |
| |
| |
|
| Acquisition | | | | | | - | |
| |
| |
|
| International | | $ | 1,377.5 | | $ | 31.1 | |
| |
| |
|
| Organic | | | | | | 64.4 | |
| |
| |
|
| Acquisition | | | | | | 19.6 | |
| |
| |
|
| FX | | | | | | (52.9 | ) |
| | | $ Mix
| | %Change(a)
| | %Organic
Change (b)
|
| United States | | $ | 1,617.1 | | 8.4 | % | | 8.4 | % |
| |
| |
| |
|
Euro Currency
Markets | | | 551.5 | | -8.5 | % | | 1.2 | % |
| |
| |
| |
|
| United Kingdom | | | 270.9 | | 3.0 | % | | 8.9 | % |
| |
| |
| |
|
| Other | | | 555.1 | | 15.5 | % | | 7.1 | % |
| | | $ Mix
| | $ Change(a)
|
| United States | | $ | 4,846.7 | | $ | 298.7 | |
| |
| |
|
| Organic | | | | | | 328.2 | |
| |
| |
|
| Acquisition | | | | | | (29.5 | ) |
| |
| |
|
| International | | $ | 4,109.0 | | $ | 202.1 | |
| |
| |
|
| Organic | | | | | | 95.4 | |
| |
| |
|
| Acquisition | | | | | | 47.6 | |
| |
| |
|
| FX | | | | | | 59.1 | |
| | | $ Mix
| | %Change(a)
| | %Organic
Change (b)
|
| United States | | $ | 4,846.7 | | 6.6 | % | | 7.2 | % |
| |
| |
| |
|
Euro Currency
Markets | | | 1,714.5 | | -4.9 | % | | -1.6 | % |
| |
| |
| |
|
| United Kingdom | | | 780.2 | | 4.6 | % | | 5.2 | % |
| |
| |
| |
|
| Other | | | 1,614.3 | | 18.9 | % | | 6.3 | % |
| (a) | “Change” is the year-over-year increase or decrease from the prior period. |
| (b) | “Organic Change” reflects the year-over-year increase or decrease in revenue from the prior period, excluding the FX Impact and Acquisition Revenue, as defined on page 3. |
| | |
| | October 19, 2010 | 5 |
Cash Flow – GAAP Presentation (condensed)
| | | Nine Months Ended September 30,
|
| | | 2010
| | 2009
|
| Net Income (a) | | $ | 645.2 | | | $ | 614.8 | |
| |
| |
|
| Share-Based Compensation Expense | | | 51.9 | | | | 56.7 | |
| |
| |
|
| Gain on Remeasurement of Affiliate (a) | | | (14.0 | ) | | | - | |
| |
| |
|
| Depreciation and Amortization | | | 185.6 | | | | 173.8 | |
| |
| |
|
| Other Non-Cash Items to Reconcile to Net Cash Provided by Operating Activities, net | | | (25.9 | ) | | | 4.9 | |
| |
| |
|
| Other Changes in Operating Capital | | | (799.3 | ) | | | (397.1 | ) |
| |
| |
|
| Net Cash Provided by Operating Activities | | | 43.5 | | | | 453.1 | |
| |
| |
|
| Capital Expenditures | | | (98.1 | ) | | | (93.4 | ) |
| |
| |
|
| Acquisitions | | | (115.4 | ) | | | (112.6 | ) |
| |
| |
|
| Proceeds from Sale of Investments, net | | | 4.3 | | | | 28.5 | |
| |
| |
|
| Net Cash Used in Investing Activities | | | (209.2 | ) | | | (177.5 | ) |
| |
| |
|
| Dividends | | | (169.2 | ) | | | (140.3 | ) |
| |
| |
|
| Proceeds from Short-term Debt, net | | | 33.1 | | | | 157.9 | |
| |
| |
|
| Proceeds from Long-term Debt, net | | | 990.4 | | | | 497.8 | |
| |
| |
|
| Repayment of Convertible Debt | | | (66.5 | ) | | | (1,316.7 | ) |
| |
| |
|
| Stock Repurchases | | | (567.0 | ) | | | (13.3 | ) |
| |
| |
|
| Proceeds from Stock Plans | | | 105.2 | | | | 10.1 | |
| |
| |
|
| Excess Tax Benefit on Stock-based Compensation | | | 16.4 | | | | - | |
| |
| |
|
| Payments to Noncontrolling Interests | | | (26.5 | ) | | | (12.3 | ) |
| |
| |
|
| Other Financing Activities, net | | | (58.6 | ) | | | (53.9 | ) |
| |
| |
|
| Net Cash Provided by (Used in) Financing Activities | | | 257.3 | | | | (870.7 | ) |
| |
| |
|
| Effect of exchange rate changes on cash and cash equivalents | | | 10.7 | | | | 95.2 | |
| |
| |
|
| Net Increase (Decrease) in Cash and Cash Equivalents | | $ | 102.3 | | | $ | (499.9 | ) |
| |
| |
|
| (a) | In the third quarter of 2010, we recorded a non-cash pre-tax remeasurement gain of $14.0 million. Further, we recorded a pre-tax charge of $13.1 million related to the disposal of four underperforming businesses in Europe. |
| | |
| | October 19, 2010 | 6 |
Current Credit Picture
| | | 12 Months Ended September 30,
|
| | | 2010
| | 2009
|
| EBITDA (a) | | $ | 1,675 | | | $ | 1,657 | |
| |
| |
|
| Gross Interest Expense (a) | | | 129.9 | | | | 120.7 | |
| |
| |
|
| EBITDA / Gross Interest Expense | | | 12.9 | x | | | 13.7 | x |
| |
| |
|
| Total Debt / EBITDA | | | 1.9 | x | | | 1.5 | x |
| |
| |
|
| Debt | | | | | | | | |
| |
| |
|
| Bank Loans (Due Less Than 1 Year) | | $ | 63 | | | $ | 33 | |
| |
| |
|
| CP Issued Under $2.5B Revolver Due 6/23/11 | | | - | | | | 144 | |
| |
| |
|
| Borrowings Under $2.5B Revolver Due 6/23/11 | | | - | | | | - | |
| |
| |
|
| Convertible Notes Due 2/7/31 | | | - | | | | 6 | |
| |
| |
|
| Convertible Notes Due 7/31/32 (b) | | | 253 | | | | 253 | |
| |
| |
|
| Convertible Notes Due 7/1/38 (c) | | | 407 | | | | 467 | |
| |
| |
|
| Senior Notes Due 4/15/16 | | | 997 | | | | 997 | |
| |
| |
|
| Senior Notes Due 7/15/19 | | | 497 | | | | 497 | |
| |
| |
|
| Senior Notes Due 8/15/20 | | | 997 | | | | - | |
| |
| |
|
| Other Debt | | | 7 | | | | 16 | |
| |
| |
|
| Total Debt | | $ | 3,221 | | | $ | 2,413 | |
| |
| |
|
| Cash and Short Term Investments | | | 1,698 | | | | 613 | |
| |
| |
|
| Net Debt | | $ | 1,523 | | | $ | 1,800 | |
| | |
| |
|
| (a) | “EBITDA” and “Gross Interest Expense” calculations shown are for the twelve months ending September 30. EBITDA is defined as operating income before interest, taxes, depreciation and amortization. Although EBITDA is a non-GAAP measure, we believe EBITDA is more meaningful for purposes of this analysis because the financial covenants in our credit facilities are based on EBITDA (see reconciliation of Operating Income to EBITDA on page 22). |
| (b) | The next put date for our Convertible Notes due 2032 is August 1, 2011. |
| (c) | The next put date for our Convertible Notes due 2038 is June 17, 2013. |
| | |
| | October 19, 2010 | 7 |
Current Liquidity Picture
| | | | As of September 30, 2010
|
| | Total Amount
of Facility
| | Outstanding (c)
| | Available
|
| Committed Facilities | | | | | | | | | |
|
| |
| |
|
| Revolver & Commercial Paper (a) | $ | 2,500 | | $ | - | | $ | 2,500 | |
|
| |
| |
|
| Other Committed Credit Facilities | | 63 | | | 63 | | | - | |
|
| |
| |
|
| Total Committed Facilities | | 2,563 | | | 63 | | | 2,500 | |
|
| |
| |
|
| Uncommitted Facilities (b) | | 581 | | | - | | | - | (b) |
|
| |
| |
|
| Total Credit Facilities | $ | 3,144 | | $ | 63 | | $ | 2,500 | |
|
| |
| |
|
| Cash and Short Term Investments | | | | | | | | 1,698 | |
|
| |
| |
|
| Total Liquidity Available | | | | | | | $ | 4,198 | |
| | | | | | | |
|
| (a) | Credit facility expires June 23, 2011. |
| (b) | Represents uncommitted facilities primarily outside the United States. These amounts are excluded from our available liquidity for purposes of this presentation. |
| (c) | For the three month period ended September 30, 2010, the average borrowings under our facilities were as follows: commercial paper facilities $419 million and other facilities $58 million. There were no borrowings under the revolver facility during the period. Commercial paper issuances were significantly reduced in the quarter following the issuance in August of our $1 billion Senior Notes due 2020. |
| | |
| | October 19, 2010 | 8 |
| |

| Omnicom Debt Structure Supplemental Information |
Omnicom Debt Structure
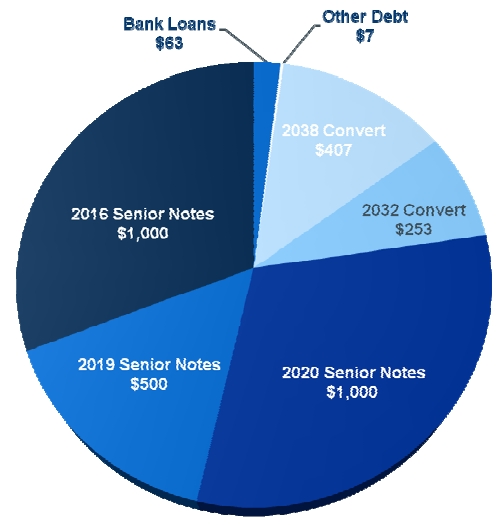
The above chart sets forthOmnicom’sdebtoutstandingatSeptember30, 2010. Theamounts reflectedabove for the 2016, 2019 and 2020 Senior Notesrepresenttheprincipal amountof these notes atmaturityon April 15, 2016, July 15, 2019 andAugust15, 2020,respectively.
| | |
| | October 19, 2010 | 10 |
Omnicom Debt Structure
The BankFacilityandCommercialPaperProgram together provide additional liquidityin the event anyconvertiblenotes are put. Webelievethat we will then haveflexibilitytorefinanceindifferentdebt capitalmarkets.
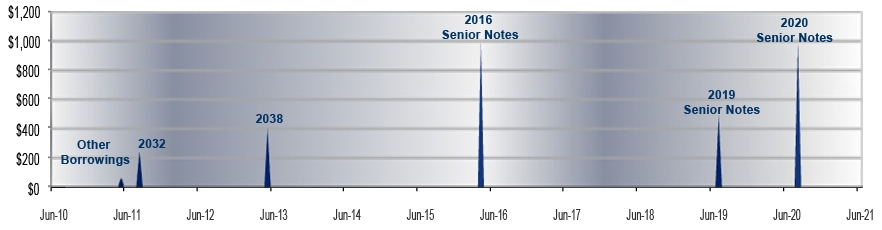
Our 2032ConvertibleNotes areputableinAugust2011 andannuallyin Julythereafteruntilmaturity.Our 2038ConvertibleNotes areputablein June 2013, 2018, 2023 andannually thereafteruntilmaturity.
Other borrowings at September 30, 2010 include short-term borrowings of $63 million and other debt of $7 million, which are due in less than one year. For purposes of this presentation we have included these borrowings as outstanding through June 2011, the date of expiration of our five-year credit facility.
| | |
| | October 19, 2010 | 11 |
Senior Notes Due 2020
| Principal Amount | $1 Billion |
|
| Co - Issuers | Omnicom Group, Omnicom Finance, Omnicom Capital |
|
| Date | August 5, 2010 |
|
| Maturity | August 15, 2020 |
|
| Security | Unsecured, pari passu with Bank Facility |
|
| Coupon | 4.45% |
|
| Spread Over Comparable Treasury at Issue | 1.55% |
|
| Rating | Moody’s: Baa1
S&P: BBB+
Fitch: A- |
| | |
| | October 19, 2010 | 12 |
Senior Notes Due 2019
| Principal Amount | $500 Million |
|
| Co - Issuers | Omnicom Group, Omnicom Finance, Omnicom Capital |
|
| Date | July 1, 2009 |
|
| Maturity | July 15, 2019 |
|
| Security | Unsecured, pari passu with Bank Facility |
|
| Coupon | 6.25% |
|
| Spread Over Comparable Treasury at Issue | 2.75% |
|
| Rating | Moody’s: Baa1
S&P: BBB+
Fitch: A- |
| | |
| | October 19, 2010 | 13 |
Senior Notes Due 2016
| Principal Amount | $1 Billion |
|
| Co - Issuers | Omnicom Group, Omnicom Finance, Omnicom Capital |
|
| Date | March 29, 2006 |
|
| Maturity | April 15, 2016 |
|
| Security | Unsecured, pari passu with Bank Facility |
|
| Coupon | 5.90% |
|
| Spread Over Comparable Treasury at Issue | 1.30% |
|
| Rating | Moody’s: Baa1
S&P: BBB+
Fitch: A- |
In August 2010, we entered into a series of interest rate swap agreements to hedge the risk of changes in fair value of the $1 billion principal amount of our 5.90% Senior Notes due April 15, 2016 (“2016 Notes”). Under the terms of these agreements, we will receive fixed interest rate payments and will make variable interest rate payments on the total principal value of the 2016 Notes. These agreements effectively convert the 2016 Notes from fixed rate debt to floating rate debt from the date we entered into the swaps through the maturity of the 2016 Notes. The swap agreements qualify as a hedge for accounting purposes at inception and at September 30, 2010 and are designated as a fair value hedge on the 2016 Notes. The variable interest rate we pay is based on the one month and three month U.S. LIBOR rate, flat. The fixed rate we receive is 1.766%. The swaps mature on April 15, 2016, the maturity date of the 2016 Notes.
| | |
| | October 19, 2010 | 14 |
2032 Convertible Notes
| Principal Amount | $253 Million |
|
| Co - Issuers | Omnicom Group, Omnicom Finance, Omnicom Capital |
|
| Date | March 6, 2002 |
|
| Maturity | July 31, 2032, with a put in August 2011 and annually in |
| | July thereafter until maturity |
|
| Security | Unsecured, pari passu with Bank Facility |
|
| Coupon | 0.00% |
|
| Conversion Price | $55 |
|
| Rating | Moody’s: Baa1
S&P: BBB+
Fitch: A- |
| | |
| | October 19, 2010 | 15 |
2038 Convertible Notes
| Principal Amount | $407 Million |
|
| Co - Issuers | Omnicom Group, Omnicom Finance, Omnicom Capital |
|
| Date | June 10, 2003 |
|
| Maturity | July 1, 2038 with puts in June of 2013, 2018, 2023 and
annually thereafter until maturity |
|
| Security | Unsecured, pari passu with Bank Facility |
|
| Coupon | 0.00% |
|
| Conversion Price | $51.50 |
|
| Rating | Moody’s: Baa1
S&P: BBB+
Fitch: A- |
| | |
| | October 19, 2010 | 16 |
Current Bank Credit Facility
| Amount | $2.5 Billion |
|
| Type | Unsecured Revolving Credit |
|
| Maturity | 5 Years – June 2011 |
|
| Facility Fee | 13BP per annum |
|
| Drawn Rate | Libor +17BP |
|
| Covenants | -Maximum Debt to EBITDA 3:1
-Minimum Interest Coverage 5:1 |
| | |
| | October 19, 2010 | 17 |
Current Omnicom Credit Ratings
| | Moody’s | S&P | Fitch |
|
| Long Term Ratings | Baa1 | BBB+ | A- |
|
| Short Term Ratings | P2 | A2 | F2 |
|
| Outlook | Stable | Stable | Stable |
|
Note:Reflectscredit ratings as ofOctober15, 2010.
| | |
| | October 19, 2010 | 18 |
| |
| Supplemental Financial Information |
2010 vs. 2009 Earnings Per Share
| | Third Quarter
| | | Year to Date
|
| | 2010
| | 2009
| | 2010
| | 2009
|
| Net Income per Common Share - Omnicom Group: | | | | | | | | | | | | | | | |
|
| | |
| | |
| | |
| |
| Basic | $ | 0.58 | | | $ | 0.53 | | | $ | 1.90 | | | $ | 1.81 | |
|
| | |
| | |
| | |
| |
| Diluted | | 0.57 | | | | 0.53 | | | | 1.88 | | | | 1.80 | |
|
| | |
| | |
| | |
| |
| | | | | | | | | | | | | | | | |
| Net Income Available for Common Shares: | | | | | | | | | | | | | | | |
|
| | |
| | |
| | |
| |
| Net Income - Omnicom Group | $ | 174.6 | | | $ | 165.6 | | | $ | 581.2 | | | $ | 563.5 | |
|
| | |
| | |
| | |
| |
| Net Income Allocated to Participating Securities | | (1.7 | ) | | | (1.8 | ) | | | (5.6 | ) | | | (6.6 | ) |
|
| | |
| | |
| | |
| |
| Net Income Available for Common Shares | $ | 172.9 | | | $ | 163.8 | | | $ | 575.6 | | | $ | 556.9 | |
| |
| | |
| | |
| | |
| |
| Weighted Average Shares (millions): | | | | | | | | | | | | | | | |
|
| | |
| | |
| | |
| |
| Basic | | 299.3 | | | | 308.6 | | | | 302.7 | | | | 308.0 | |
|
| | |
| | |
| | |
| |
| Diluted | | 303.5 | | | | 311.6 | | | | 306.9 | | | | 309.5 | |
|
| | |
| | |
| | |
| |
| Dividend Declared per Share | $ | 0.20 | | | $ | 0.15 | | | $ | 0.60 | | | $ | 0.45 | |
| | |
| | October 19, 2010 | 20 |
Acquisition Related Expenditures
| | | Nine Months YTD 2010
|
| New Subsidiary Acquisitions(a) | | $ | 6 |
| |
|
| Affiliates to Subsidiaries(b) | | | 10 |
| |
|
| Affiliates(c) | | | 2 |
| |
|
| Existing Subsidiaries(d) | | | 26 |
| |
|
| Earn-outs(e) | | | 98 |
| |
|
| Total Acquisition Expenditures(f) | | $ | 142 |
| | |
|
| (a) | Includes acquisitions of a majority interest in agencies resulting in their consolidation. |
| (b) | Includes acquisitions of additional equity interests in existing affiliate agencies resulting in their majority ownership and consolidation. |
| (c) | Includes acquisitions of less than a majority interest in agencies in which Omnicom did not have a prior equity interest and the acquisition of additional interests in existing affiliated agencies that did not result in majority ownership. |
| (d) | Includes the acquisition of additional equity interests in already consolidated subsidiary agencies which are recorded to Equity – Noncontrolling Interest. |
| (e) | Includes additional consideration paid for acquisitions completed in prior periods. |
| (f) | Total Acquisition Expenditures figure is net of cash acquired. |
| | |
| | October 19, 2010 | 21 |
Reconciliation of non-GAAP Measures
| | | 3 Months Ended September 30,
| | 9 Months Ended September 30,
| | 12 Months Ended September 30,
|
| | | 2010
| | 2009
| | 2010
| | 2009
| | 2010
| | 2009
|
| EBITDA | | $ | 376.6 | | | $ | 355.0 | | | $ | 1,206.2 | | | $ | 1,149.1 | | | $ | 1,674.7 | | | $ | 1,657.3 | |
| |
| |
| |
| |
| |
| |
|
| Depreciation | | | 44.5 | | | | 45.4 | | | | 134.9 | | | | 132.6 | | | | 188.8 | | | | 177.7 | |
| |
| |
| |
| |
| |
| |
|
| EBITA | | | 332.1 | | | | 309.6 | | | | 1,071.3 | | | | 1,016.5 | | | | 1,485.9 | | | | 1,479.6 | |
| |
| |
| |
| |
| |
| |
|
| Amortization of Intangibles | | | 18.0 | | | | 14.8 | | | | 50.7 | | | | 41.2 | | | | 65.8 | | | | 55.9 | |
| |
| |
| |
| |
| |
| |
|
| Operating Income | | | 314.1 | | | | 294.8 | | | | 1,020.6 | | | | 975.3 | | | | 1,420.1 | | | | 1,423.7 | |
| |
| |
| |
| |
| |
| |
|
| Net Interest Expense | | | 29.8 | | | | 28.9 | | | | 77.7 | | | | 72.1 | | | | 106.2 | | | | 96.0 | |
| |
| |
| |
| |
| |
| |
|
| Income Before Tax | | | 284.3 | | | | 265.9 | | | | 942.9 | | | | 903.2 | | | | 1,313.9 | | | | 1,327.7 | |
| |
| |
| |
| |
| |
| |
|
| Taxes | | | 96.9 | | | | 90.5 | | | | 320.8 | | | | 308.9 | | | | 445.5 | | | | 450.9 | |
| |
| |
| |
| |
| |
| |
|
| Income from Equity Method Investments | | | 8.2 | | | | 7.3 | | | | 23.1 | | | | 20.5 | | | | 33.4 | | | | 36.5 | |
| |
| |
| |
| |
| |
| |
|
| Net Income | | | 195.6 | | | | 182.7 | | | | 645.2 | | | | 614.8 | | | | 901.8 | | | | 913.3 | |
| |
| |
| |
| |
| |
| |
|
| Less: Net Income Attributed to Noncontrolling Interests | | | (21.0 | ) | | | (17.1 | ) | | | (64.0 | ) | | | (51.3 | ) | | | (91.0 | ) | | | (78.8 | ) |
| |
| |
| |
| |
| |
| |
|
| Net Income - Omnicom Group | | $ | 174.6 | | | $ | 165.6 | | | $ | 581.2 | | | $ | 563.5 | | | $ | 810.8 | | | $ | 834.5 | |
| |
| |
| |
| |
| |
| |
|
The abovereconciles EBITDA& EBITA to the GAAPfinancial measuresfor theperiods presented.
EBITDA and EBITA are non-GAAP financial measures within the meaning of applicable SEC rules and regulations. Our credit facility defines EBITDA as earnings before deducting interest expense, income taxes, depreciation and amortization. Our credit facility uses EBITDA to measure our compliance with covenants, such as interest coverage and leverage ratios as presented on pages 7 & 17 of this presentation. Management uses EBITA as an additional operating performance measure, which excludes acquisition-related amortization expense, because it believes that EBITA is a useful measure to evaluate the performance of our businesses. EBITDA and EBITA are not, and should not, be used as substitutes for Operating Income as determined in accordance with GAAP and are only used to measure our compliance with our debt covenants and as an additional performance measure of our businesses.
| | |
| | October 19, 2010 | 22 |
Third Quarter Acquisition
Omnicom Media Group Middle East and North Africa
Omnicom Media Group Middle East and North Africa is a leading full service media agency offering an integrated suite of services to both international and domestic clients in the United Arab Emirates and North Africa through the OMD and PHD brands. The company has a subsidiary in Saudi Arabia. Its offering includes media strategy, planning and buying across all media channels.
The company has operated as an affiliate of our BBDO and TBWA networks since 2002 and is headquartered in Dubai, United Arab Emirates.
| | |
| | October 19, 2010 | 23 |