Exhibit 99.2

Investor Presentation Fourth Quarter 2011 Results February 14, 2012
Disclosure
Thefollowing materialshave beenpreparedfor use in theFebruary14, 2012conferencecall onOmnicom’sresults ofoperationsfor the period endedDecember31, 2011. The call will bearchivedon theInternetathttp://www.omnicomgroup.com/financialwebcasts.
Forward-Looking Statements
Certainof thestatementsin thispresentation constitute forward-looking statementswithin themeaningof thePrivate Securities Litigation ReformAct of 1995. Inaddition,from time to time, we or ourrepresentativeshave made or may makeforward-looking statements,orally or inwriting.Thesestatementsrelate to future events or futurefinancial performanceandinvolveknown andunknownrisks and other factors that may cause our actual or ourindustry’s results,levels ofactivityorachievementto bematerially differentfrom thoseexpressedorimpliedby anyforward-looking statements.These risks anduncertainties, includingthose that will bedescribedin our 2011AnnualReport of Form 10-K under Item 1A - RiskFactorsand Item 7 -Management’s DiscussionandAnalysisofFinancial ConditionandResultsofOperations, include,but are not limited to, our futurefinancial positionand results ofoperations,globaleconomic conditionsandconditionsin the creditmarkets,losses on mediapurchasesandproductioncostsincurredon behalf ofclients, reductionsin clientspendingand/or aslowdownin clientpayments, competitive factors, changesin clientcommunication requirements, managing conflictsofinterest,the hiring andretentionofpersonnel, maintaininga highly skilledworkforce,our ability to attract new clients and retainexisting clients, relianceoninformation technology systems, changesingovernment regulations impactingouradvertisingandmarketing strategies,risksassociatedwithassumptionswe make inconnectionwith our criticalaccounting estimatesand legalproceedings,and ourinternational operations,which aresubjectto the risks ofcurrency fluctuationsand foreignexchange controls.In some cases,forward-looking statementscan beidentifiedbyterminologysuch as “may,” “will,”“could,” “would,” “should,” “expect,”“plan,”“anticipate,” “intend,” “believe,” “estimate,” “predict,” “potential”or“continue”or thenegativeof those terms or othercomparable terminology.Thesestatementsare ourpresent expectations.Actual events or results may differ. Weundertakenoobligationtoupdateor revise anyforward-looking statement,except asrequiredby law.
Non-GAAP Financial Measures
Weprovidehereinfinancial measures determinedinaccordancewithgenerally accepted accounting principlesin the United States(“GAAP”)andadjustmentsto the GAAPpresentation(“Non-GAAP”),which webelievearemeaningfulforunderstandingourperformance.Non-GAAPfinancial measuresshould not beconsideredinisolationfrom, or as asubstitutefor,financial information presentedincompliancewithGAAP.Non-GAAPfinancial measuresasreportedby us may not becomparabletosimilarlytitledamounts reportedby othercompanies.Weprovideareconciliationof non-GAAPmeasuresto thecomparableGAAPmeasureson pages 17 and 18.
The non-GAAPmeasuresused in thispresentation includethefollowing:
Net Free Cash Flow,definedas Free Cash Flow(definedbelow) less thePrimaryUses of Cash(definedbelow). Net Free Cash Flow is one of themetricsused by us toassessoursourcesand uses of cash and wasderivedfrom ourconsolidated statementsof cash flows. Webelievethat thispresentationismeaningfulforunderstandingourprimary sourcesandprimaryuses of that cash flow.Free Cash Flow,definedas netincomeplusdepreciation, amortization,share basedcompensation expenseand gain onremeasurementof equityinterestinaffiliatesless other non-cash items toreconcileto net cashprovidedbyoperating activities.PrimaryUses of Cash,definedasdividendstocommon shareholders, dividendspaid tononcontrolling interest shareholders,capitalexpenditures,cash paid onacquisitions, paymentsforadditional interestincontrolled subsidiariesand stockrepurchases,net of theproceedsandexcesstax benefit from our stock plans, andexcludes changesinworkingcapital and otherinvestingandfinancing activities, including commercialpaperissuancesandredemptionsused to fund theseworkingcapitalchanges.
EBITDA,definedasoperating incomebeforeinterest,taxes,depreciationandamortization.Webelieve EBITDAis moremeaningfulforpurposesof thisanalysis becausethefinancial covenantsin our creditfacilitiesare based onEBITDA.
EBITA,definedasoperating incomebeforeinterest,taxes andamortization.We use EBITA as anadditional operating performance measure,whichexcludes acquisition-related amortization expense, becausewebelievethat EBITA is a usefulmeasuretoevaluatetheperformanceof ourbusinesses.
Net Debt,definedas total debt less cash, cashequivalentsand short-terminvestments.Webelievenet debt,togetherwith thecomparableGAAPmeasures, reflectsone of themetricsused by us toassessour cashmanagement.
After TaxOperating Income,definedasoperating incomelessincometaxescalculatedusing theeffectivetax rate for theapplicable period.
Other Information
All dollaramountsare inmillionsexcept for per shareamounts.Thefollowing information containedin thisdocumenthas not beenaudited, althoughsome of it has beenderivedfromOmnicom’s historical financial statements, includingitsaudited financial statements.Inaddition, industry, operationaland other non-financialdatacontainedin thisdocumenthave beenderivedfromsourceswebelieveto bereliable,but we have notindependently verifiedsuchinformation,and we do not, nor does any otherperson, assume responsibilityfor theaccuracyorcompletenessof thatinformation. Certain amountsin priorperiodshave beenreclassifiedtoconformto ourcurrent presentation.
Theinclusionofinformationin thispresentationdoes not mean that suchinformationismaterialor thatdisclosureof suchinformationisrequired.
February 14, 2012 1


2011 vs. 2010 P&L Summary Fourth Quarter (a) Full Year (a) 2011 2010 % 2011 2010 % Revenue $ 3,852.9 $ 3,586.87.4%$ 13,872.5 $ 12,542.510.6%EBITA (b) 511.1 459.811.2%1,762.5 1,531.015.1% % Margin 13.3% 12.8% 12.7% 12.2% Amortization of Intangibles 23.7 20.2 91.4 70.8 Operating Income 487.4 439.610.9%1,671.1 1,460.214.4% % Margin 12.7% 12.3% 12.0% 11.6% Net Interest Expense 30.3 32.1 122.1 109.8 Income Before Income Taxes 457.1 407.512.2%1,549.0 (c) 1,350.414.7% % Margin 11.9% 11.4% 11.2% 10.8% Income Taxes 156.8 139.4 505.8 (d) 460.2% Tax Rate 34.3% 34.2% 32.7% 34.1% Income from Equity Method Investments 6.9 10.4 17.2 33.5 Net Income 307.2 278.5 1,060.4 923.7 Less: Noncontrolling Interests 35.3 32.0 107.8 96.0 Net Income - Omnicom Group 271.9 246.510.3%952.6 827.715.1%Less: Net Income Allocated to Participating Securities 3.5 2.5 10.7 8.0 Net Income Available for Common Shares $ 268.4 $ 244.0 $ 941.9 $ 819.7 Net Income per Common Share - Omnicom Group - $ 0.96 $ 0.8315.7%$ 3.33 $ 2.7023.3%Diluted (a) See page 14 for additional earnings per share information. (b) EBITA is a Non-GAAP financial measure. See page 1 for the definition of this measure and page 17 for the reconciliation of Non-GAAP measures. (c) See page 19 for additional information. (d) See page 19 for additional information. February 14, 2012 2

2011 Total Revenue Change Fourth Quarter Full Year $ % $ % Prior Period Revenue $ 3,586.8 $ 12,542.5 Foreign Exchange (FX) Impact (a) 0.9 0.0% 323.4 2.6% Acquisition/Disposition Revenue (b) 80.0 2.2% 236.0 1.9% Organic Revenue (c) 185.2 5.2% 770.6 6.1% Current Period Revenue $ 3,852.9 7.4% $ 13,872.5 10.6% (a) To calculate the FX impact, we first convert the current period’s local currency revenue using the average exchange rates from the equivalent prior period to arrive at constant currency revenue. The FX impact equals the difference between the current period revenue in U.S. dollars and the current period revenue in constant currency. (b) Acquisition/Disposition revenue is the aggregate of the applicable prior period revenue of the acquired businesses. Netted against this number is the revenue of any business included in the prior period reported revenue that was disposed of subsequent to the prior period. (c) Organic revenue is calculated by subtracting both the acquisition revenue and the FX impact from total revenue growth. February 14, 2012 3

2011 Revenue by Discipline Fourth Quarter Full Year Specialty Specialty 8.3% 8.6% PR PR 8.1% 8.8% Advertising Advertising 46.1% 47.5% CRM CRM 36.1% 36.5% % Organic % Organic $ Mix % Change (a) $ Mix % Change (a) Change (b) Change (b) Advertising $1,832.3 9.7% 7.3% Advertising $6,401.2 12.7% 7.7% CRM 1,391.2 8.2% 6.0% CRM 5,067.3 11.4% 7.3% PR 310.6 3.9% 0.6% PR 1,215.0 6.0% 1.9% Specialty 318.8 -3.8% -5.1% Specialty 1,189.0 1.6% -1.4% (a) “Change” is the year-over-year increase or decrease from the prior period. (b) “Organic Change” reflects the year-over-year increase or decrease in revenue from the prior period, excluding the FX Impact and Acquisition/Disposition Revenue, as defined on page 3. February 14, 2012 4

2011 Revenue By Geography Fourth Quarter Full Year U.K. Other 8.5% U.K. 22.6% Other 8.8% 21.8% Euro Euro Markets U.S. Markets U.S. 18.8% 50.1% 18.6% 50.8% $ Mix $ Change (a) $ Mix $ Change (a) United States $ 1,928.7 $ 92.3 United States $ 7,048.7 $ 365.6 Organic 96.8 Organic 387.5 Acquisition (4.5) Acquisition (21.9) International $ 1,924.2 $ 173.8 International $ 6,823.8 $ 964.4 Organic 88.4 Organic 383.1 Acquisition 84.5 Acquisition 257.9 FX 0.9 FX 323.4 (a) %Organic %Organic $ Mix %Change $ Mix %Change (a) Change (b) Change (b) United States $ 1,928.7 5.0% 5.3% United States $ 7,048.7 5.5% 5.8% Euro Currency Markets 723.3 -2.9% -2.2% Euro Currency Markets 2,579.5 4.9% 0.5% United Kingdom 328.3 5.9% 5.4% United Kingdom 1,227.0 12.5% 7.9% Other 872.6 25.5% 12.7% Other 3,017.3 30.7% 12.3% (a) “Change” is the year-over-year increase or decrease from the prior period. (b) “Organic Change” reflects the year-over-year increase or decrease in revenue from the prior period, excluding the FX Impact and Acquisition/Disposition Revenue, as defined on page 3. February 14, 2012 5

Revenue By Industry Fourth Quarter - 2011 Fourth Quarter - 2010 T&E Auto 8% Telecom 7% 6% T&E Auto 7% Consumer Consumer Telecom 7% 7% Products 11% Products 11% Technology 10% Financial Financial Technology 10% Retail 7% Services 12% Services 9% Retail 7% Pharma. & Food & Food & Health 10% Beverage 14% Beverage 13% Pharma. & Health 12% Other 16% Other 16% Growth Auto 13.3% Food & Beverage 1.4% Consumer Products 9.8% Financial Services 34.9% Pharma & Healthcare 4.8% T&E 4.3% Retail 11.0% Technology 3.9% Telecom 6.4% Other Industries 6.9% “Growth” is the year-over-year increase from the prior period. Charts represent the amount of revenue attributable to each industry expressed as a percentage of the total revenue from Omnicom’s clients for the three months ended December 31, 2011 and 2010, respectively. February 14, 2012 6

Cash Flow Performance Full Year 2011 2010 Free Cash Flow: Net Income $ 1,060.4 $ 923.7 Depreciation and Amortization Expense 273.7 253.0 Share-based Compensation Expense 74.5 69.3 Gain on Remeasurement of Equity Interest in Clemenger Group (123.4) -Gain on Remeasurement of Equity Interest in affiliates (15.1) (26.0) Other Non-Cash Items to Reconcile to Net Cash Provided by Operating Activities, net (22.8) (42.3) Free Cash Flow 1,247.3 1,177.7 Primary Uses of Cash: Dividends 269.1 229.7 Dividends paid to Noncontrolling Interest Shareholders 101.3 81.0 Capital Expenditures 185.5 153.7 Acquisitions, net of Proceeds from Sale of Investments 389.1 140.0 Payments for Additional Interest in Controlled Subsidiaries 38.8 32.1 Stock Repurchases, net of Proceeds & Tax Benefit from Stock Plans 701.1 1,128.3 Primary Uses of Cash 1,684.9 1,764.8 Net Free Cash Flow $ (437.6) $ (587.1) The Free Cash Flow, Primary Uses of Cash and Net Free Cash Flow amounts presented above are non-GAAP financial measures. See page 1 for the definition of these measures and page 18 for the reconciliation of non-GAAP measures. Additional information regarding our cash flows can be found in our condensed cash flow statement on page 15. February 14, 2012 7

Net Cash Returned to Shareholders through Dividends and Share Re purchases Omnicom's Revenues and Net Income doubled in the past 10 years (a). During this period, Omnicom distributed over 95% of Net Income to shareholders, through Dividends and Share Repurchases. 9.0 $8.12 8.0 $7.73 7.0 6.0 illions $5.87 $ in B 5.0 4.0 3.0 2.0 $1.86 1.0 - 2002 2003 2004 2005 2006 2007 2008 2009 2010 2011 Cumulative Dividends Paid Cumulative Cost of Net Shares Repurchased, defined as payments for repurchases of common stock less proceeds from stock plans Cash Returned to Shareholders, defined as the sum of Cumulative Dividends paid and Cumulative Cost of Net Shares Repurchased Cumulative Net Income - Omnicom Group Inc. (a) Omnicom Revenue went from $6.9 billion to $13.9 billion and Net Income from $455 million to $953 million in 2002 and 2011, respectively. February 14, 2012 8

Current Credit Picture Long-term Credit Ratings (a): BBB+ (S&P) Baa1 (Moody’s) Outlook (a): Stable (S&P and Moody’s) Full Year 2011 2010 EBITDA (b) $ 1,944.8 $ 1,713.2 Gross Interest Expense 158.1 134.7 EBITDA / Gross Interest Expense 12.3 x 12.7 x Total Debt / EBITDA 1.6 x 1.9 x Net Debt (f) / EBITDA 0.7 x 0.5 x Debt Bank Loans (Due Less Than 1 Year) $10 $ 52 CP Issued Under Revolver - -Borrowings Under Revolver - -Convertible Notes Due 7/31/32 (c) 253 253 Convertible Notes Due 7/1/38 (d) 407 407 Senior Notes Due 4/15/16 (e) 1,000 1,000 Senior Notes Due 7/15/19 (e) 500 500 Senior Notes Due 8/15/20 (e) 1,000 1,000 Other Debt - (3) Total Debt $ 3,170 $ 3,209 Cash and Short Term Investments 1,805 2,300 Net Debt (f) $ 1,365 $ 909 (a) Reflects credit ratings and outlook as of February 13, 2012. (b) EBITDA is a Non-GAAP financial measure. See page 1 for the definition of this measure and page 17 for the reconciliation of non-GAAP measures. (c) The next put date for our Convertible Notes due 2032 is July 31, 2012. (d) The next put date for our Convertible Notes due 2038 is June 17, 2013. (e) Amounts reflected for the 2016, 2019 and 2020 Senior Notes represent the principal amount of these notes at maturity on April 15, 2016, July 15, 2019 and August 15, 2020, respectively. (f) Net Debt is a non-GAAP financial measure. See page 1 for the definition of this measure. February 14, 2012 9

Historical Returns Return on Invested Capital (ROIC) (a) % Twelve Months Ended December 31, 2011 18.8 Twelve Months Ended December 31, 2010 16.8 Return on Equity (ROE) (b) % Twelve Months Ended December 31, 2011 26.9 Twelve Months Ended December 31, 2010 21.3 (a) Return on Invested Capital is After Tax Operating Income (a non-GAAP measure – see page 1 for the definition of this measure and page 18 for the reconciliation of non-GAAP measures) divided by the average of Invested Capital at the beginning and the end of the period (Book value of all long-term liabilities and short-term interest bearing debt plus shareholders’ equity less cash, cash equivalents and short term investments) . (b) Return on Equity is Net Income for the given period divided by the average of shareholders equity at the beginning and end of the period. February 14, 2012 10

Supplemental Financial Information

Omnicom Debt Structure Bank Loans $10 2038 Convert $407 2032 Convert 2016 Senior Notes $253 $1,000 2020 Senior Notes 2019 Senior Notes $1,000 $500 The above chart sets forth Omnicom’s debt outstanding at December 31, 2011. The amounts reflected above for the 2016, 2019 and 2020 Senior Notes represent the principal amount of these notes at maturity on April 15, 2016, July 15, 2019 and August 15, 2020, respectively. February 14, 2012 12

Omnicom Debt Maturity Profile $1,200 2016 2020 Senior Notes Senior Notes $1,000 $800 2019 $600 Senior Notes 2038 Convert $400 2032 Convert $200 Other Borrowings $0 Dec 11 Dec 12 Dec 13 Dec 14 Dec 15 Dec 16 Dec 17 Dec 18 Dec 19 Dec 20 Dec 21 Our 2032 Convertible Notes are putable on July 31, 2012 and annually in July thereafter until maturity. Our 2038 Convertible Notes are putable in June 2013, 2018, 2023 and annually thereafter until maturity. Other borrowings at December 31, 2011 include short-term borrowings of $10 million which are due in less than one year. For purposes of this presentation we have included these borrowings as outstanding through October 2016, the date of expiration of our five-year credit facility. February 14, 2012 13

2011 vs. 2010 Earnings Per Share Fourth Quarter Full Year 2011 2010 2011 2010 Net Income per Common Share - Omnicom Group: Basic $ 0.97 $ 0.84 $ 3.38 $ 2.74 Diluted 0.96 0.83 3.33 2.70 Net Income Available for Common Shares: Net Income - Omnicom Group $ 271.9 $ 246.5 $ 952.6 $ 827.7 Net Income Allocated to Participating Securities (3.5) (2.5) (10.7) (8.0) Net Income Available for Common Shares $ 268.4 $ 244.0 $ 941.9 $ 819.7 Weighted Average Shares (millions): Basic 276.4 290.5 279.0 299.6 Diluted 280.8 295.7 283.3 303.5 Dividend Declared per Share $0.25$0.20 $1.00 $0.80 February 14, 2012 14

Condensed Cash Flow Full Year 2011 2010 Net Income $ 1,060.4 $ 923.7 Share-Based Compensation Expense 74.5 69.3 Depreciation and Amortization 273.7 253.0 Gain on Remeasurement of Equity Interest in Clemenger Group (123.4) -Gain on Remeasurement of Equity Interest in affiliates (15.1) (26.0) Other Non-Cash Items to Reconcile to Net Cash Provided by Operating Activities, net (22.8) (42.3) Changes in Operating Capital 68.0 310.3 Net Cash Provided by Operating Activities 1,315.3 1,488.0 Capital Expenditures (185.5) (153.7) Acquisitions, net of Proceeds from Sale of Investments (389.1) (140.0) Net Cash Used in Investing Activities (574.6) (293.7) Dividends (269.1) (229.7) Dividends paid to Noncontrolling Interest Shareholders (101.3) (81.0) (Repayments of) / Proceeds from Short-term & Long-term Debt, net (43.1) 1,025.1 Repayment of Convertible Debt (0.1) (66.5) Stock Repurchases, net of Proceeds from Stock Plans and Excess Tax Benefit from Stock Plans (701.1) (1,128.3) Payments for Additional Interest in Controlled Subsidiaries (38.8) (32.1) Other Financing Activities, net (52.2) (24.8) Net Cash Used in Financing Activities (1,205.7) (537.3) Effect of exchange rate changes on cash and cash equivalents (42.5) 44.7 Net (Decrease)/Increase in Cash and Cash Equivalents $ (507.5) $ 701.7 February 14, 2012 15

2011 Acquisition Related Expenditures Full Year New Subsidiary Acquisitions (a) $ 189 Affiliates to Subsidiaries (b) 139 Affiliates (c) 3 Additional Interest in Controlled Subsidiaries (d) 39 Earn -outs (e) 73 Total Acquisition Expenditures (f) $ 443 (a) Includes acquisitions of a majority interest in agencies resulting in their consolidation. (b) Includes acquisitions of additional equity interests in existing affiliate agencies resulting in their majority ownership and consolidation. (c) Includes acquisitions of less than a majority interest in agencies in which Omnicom did not have a prior equity interest and the acquisition of additional interests in existing affiliated agencies that did not result in majority ownership. (d) Includes the acquisition of additional equity interests in already consolidated subsidiary agencies which are recorded to Equity – Noncontrolling Interest. (e) Includes additional consideration paid for acquisitions completed in prior periods. (f) Total Acquisition Expenditures figure is net of cash acquired. February 14, 2012 16
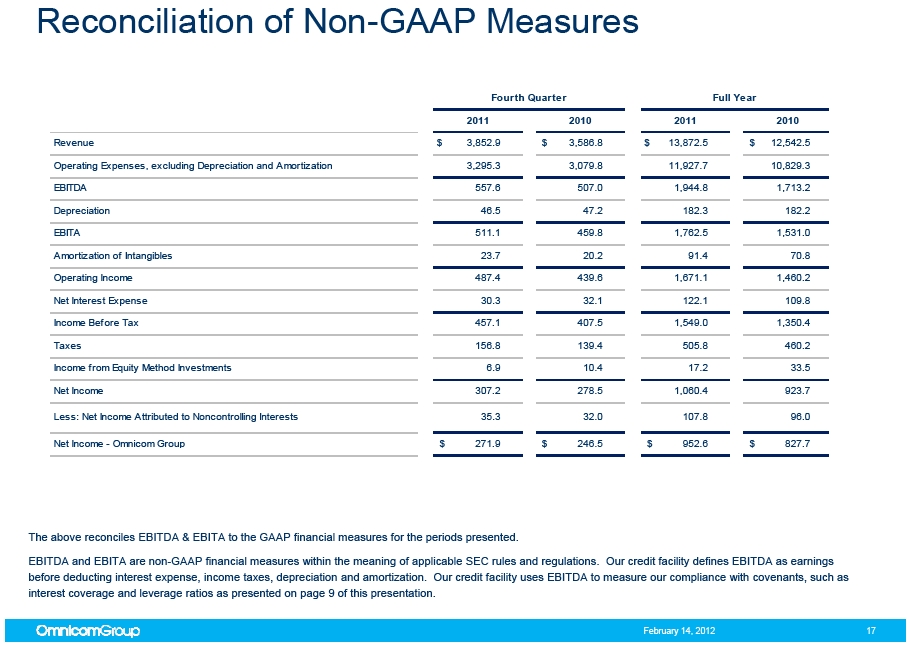
Reconciliation of Non -GAAP Measures Fourth Quarter Full Year 2011 2010 2011 2010 Revenue $ 3,852.9 $ 3,586.8 $ 13,872.5 $ 12,542.5 Operating Expenses, excluding Depreciation and Amortization 3,295.3 3,079.8 11,927.7 10,829.3 EBITDA 557.6 507.0 1,944.8 1,713.2 Depreciation 46.5 47.2 182.3 182.2 EBITA 511.1 459.8 1,762.5 1,531.0 Amortization of Intangibles 23.7 20.2 91.4 70.8 Operating Income 487.4 439.6 1,671.1 1,460.2 Net Interest Expense 30.3 32.1 122.1 109.8 Income Before Tax 457.1 407.5 1,549.0 1,350.4 Taxes 156.8 139.4 505.8 460.2 Income from Equity Method Investments 6.9 10.4 17.2 33.5 Net Income 307.2 278.5 1,060.4 923.7 Less: Net Income Attributed to Noncontrolling Interests 35.3 32.0 107.8 96.0 Net Income - Omnicom Group $ 271.9 $ 246.5 $ 952.6 $ 827.7 The above reconciles EBITDA & EBITA to the GAAP financial measures for the periods presented. EBITDA and EBITA are non-GAAP financial measures within the meaning of applicable SEC rules and regulations. Our credit facility defines EBITDA as earnings before deducting interest expense, income taxes, depreciation and amortization. Our credit facility uses EBITDA to measure our compliance with covenants, such as interest coverage and leverage ratios as presented on page 9 of this presentation. February 14, 2012 17

Reconciliation of Non -GAAP Measures Full Year 2011 2010 Net Free Cash Flow $ (437.6) $ (587.1) Cash Flow items excluded from Net Free Cash Flow: Changes in Operating Capital 68.0 310.3 (Repayments of) / Proceeds from Short-term & Long-term Debt, net (43.1) 1,025.1 Repayment of Convertible Debt (0.1) (66.5) Other Financing Activities, net (52.2) (24.8) Effect of exchange rate changes on cash and cash equivalents (42.5) 44.7 Net (Decrease)/Increase in Cash and Cash Equivalents $ (507.5) $ 701.7 Full Year 2011 2010 Operating Income $ 1,671.1 $ 1,460.2 Effective Tax Rate for the applicable period 32.7% 34.1% Income Taxes on Operating Income 546.4 497.9 After Tax Operating Income $ 1,124.7 $ 962.3 February 14, 2012 18

2011 Non -GAAP Measures – Impact of Q1 Clemenger Remeasurement Gain and Repositioning Actions on Operating Expenses Q1 Clemenger 2011 Full Year Remeasurement Q1 Repositioning 2011 Full Year As Reported Gain Actions As Adjusted Salary & Service Expenses $ 10,250.6 $ - $ (92.8) $ 10,157.8 Office and General Expenses, excluding 1,677.1 123.4 (38.5) 1,762.0 Depreciation and Amortization Depreciation Expense 182.3 - - 182.3 Amortization of Intangibles 91.4 - - 91.4 Total Operating Expenses $ 12,201.4 $ 123.4 $ (131.3) $ 12,193.5 The table above presents the impact of the Clemenger remeasurement gain and repositioning actions taken in the first quarter of 2011 on our 2011 Full Year results. The 2011 Full Year, as adjusted figures are Non-GAAP financial measures. The 2011 Full Year, as adjusted figures exclude the gain on the remeasurement of our equity interest in Clemenger Group and the repositioning charges recognized in the first quarter of 2011. We recorded a $123.4 million non-cash gain resulting from the remeasurement to fair value of our existing ownership interests in the Clemenger Group, our affiliate in Australia and New Zealand, in which we acquired a controlling interest. The acquisition brought our ownership up to 73.7% from 46.7%. The difference between the fair value of our shares in Clemenger Group at the acquisition date and the carrying value of our investment held prior to the acquisition resulted in the remeasurement gain. We recognized repositioning charges of $131.3 million that were the result of our strategic review that is focused on improving our strategic position and operations. Our repositioning actions included $92.8 million in severance costs and $38.5 million in lease termination charges, as well as asset and goodwill write-offs, net of gain on dispositions. February 14, 2012 19

2011 Non -GAAP Measures – Impact of Q1 Clemenger Remeasurement Gain and Repositioning Actions on Income Taxes Income Before Income Income Taxes Taxes 2011 Full Year, As Reported $ 1,549.0 $ 505.8 Adjustments: Less: Q1 Gain on Remeasurement of Equity Interest in Clemenger Group (123.4) (2.8) Plus: Q1 Repositioning Actions 131.3 39.5 Less: Tax Provision - Q1 FIN 48 Charge - (9.0) 2011 Full Year, As Adjusted 1,556.9 533.5% Tax Rate, as adjusted 34.3% The table above presents the impact of the Clemenger remeasurement gain and repositioning actions taken in the first quarter of 2011 on Income Before Income Taxes and Income Taxes for the 2011 year to date period. These are Non-GAAP financial measures. Both Income Before Income Taxes, as adjusted and Income Taxes, as adjusted exclude the gain on the remeasurement of our equity interest in Clemenger Group and the repositioning charges recognized in the first quarter of 2011, as well as a tax accrual we recorded in accordance with ASC 740 (FIN 48 accrual) during the first quarter of 2011. We recorded a $123.4 million non-cash gain resulting from the remeasurement to fair value of our existing ownership interests in the Clemenger Group, our affiliate in Australia and New Zealand, in which we acquired a controlling interest. The acquisition brought our ownership up to 73.7% from 46.7%. The difference between the fair value of our shares in Clemenger Group at the acquisition date and the carrying value of our investment held prior to the acquisition resulted in the remeasurement gain. We recognized repositioning charges of $131.3 million that were the result of our strategic review that is focused on improving our strategic position and operations. Our repositioning actions included $92.8 million in severance costs and $38.5 million in lease termination charges, as well as asset and goodwill write-offs, net of gain on dispositions. February 14, 2012 20

Fourth Quarter Acquisition Mudra Group is one of India’s leading integrated marketing communications groups. Mudra’s agencies – Mudra India, DDB Mudra, Mudra MAX & Ignite Mudra – deliver brand solutions to its clients, offering a wide range of marketing services including general and specialty advertising, CRM, branding and public relations. Mudra Group has been an affiliate of the DDB Worldwide network since 1993. Mudra is headquartered in Mumbai, India with additional agencies in New Delhi, Bangalore and Ahmedabad, India. February 14, 2012 21

Fourth Quarter Acquisition DDB Worldwide has purchased a controlling interest in its two Turkish affiliates -Medina Turgul DDB and DDB & Co. Medina Turgul DDB and DDB & Co. have operated as affiliates of the DDB network since 1995 and 2004, respectively. Both agencies offer a broad range of marketing services including general advertising, digital, below the line and graphic/film production. Both agencies are located in Istanbul, Turkey and will operate as separate agencies within the DDB Worldwide network. February 14, 2012 22

Fourth Quarter Acquisition Founded in 1983 by CEO Marina Maher, Marina Maher Communications is widely recognized for its expertise in brand building for consumer products, food & beverage companies, as well as prescription and over-the-counter pharmaceuticals on behalf of Fortune 500 companies. Marina Maher Communications is located in New York, New York. February 14, 2012 23

Fourth Quarter Acquisition Established in 2006, Grid Worldwide Branding and Design is a highly regarded branding and design agency. The agency services a blue chip South African client base, and was recently awarded the 2011 Design Agency of the Year in the recent AdFocus awards. Located in Johannesburg, South Africa, Grid will operate within the TBWA\Worldwide network. February 14, 2012 24
Fourth Quarter Acquisition Established in 2007, Page Three Media is an independent strategic media planning agency. The agency delivers high-level strategic and innovative media solutions in a “boutique” environment. With offices in Johannesburg and Cape Town, South Africa, Page Three Media will operate as part of the PHD group of companies within the OMG Network. February 14, 2012 25