Exhibit 99.2
 |  |
First Quarter 2012 Results April 17, 2012 |
2012 vs. 2011 P&LSummary
| | | First Quarter |
| | | 2012 | | 2011 | | % ∆ |
| Revenue | | $ | 3,307.3 | | | $ | 3,151.3 | | | 5.0 | % |
| EBITA(a) | | | 386.5 | | | | 342.8 | | | 12.7 | % |
| % Margin | | | 11.7 | % | | | 10.9 | % | | | |
| Amortization of Intangibles | | | 24.0 | | | | 20.7 | | | | |
| Operating Income | | $ | 362.5 | | | $ | 322.1 | | | 12.5 | % |
| % Margin | | | 11.0 | % | | | 10.2 | % | | | |
| (a) | | EBITA is a non-GAAP financial measure. See page 23 for the definition of this measure and page 18 for the reconciliation of non-GAAP measures. |
 | April 17, 2012 | 1 |
2012 vs. 2011 P&LSummary
| | | First Quarter |
| | | 2012 | | 2011 | | % ∆ |
| |
| Operating Income | | $ | 362.5 | | | $ | 322.1 | | | 12.5 | % |
| % Margin | | | 11.0 | % | | | 10.2 | % | | | |
| | | | | | | | | | | | |
| Net Interest Expense | | | 29.2 | | | | 32.1 | | | | |
| Income Taxes | | | 109.3 | | | | 73.9 | (a) | | | |
| % Tax Rate | | | 32.8 | % | | | 25.5 | % | | | |
| Income from Equity Method Investments | | | 2.0 | | | | 1.0 | | | | |
| Noncontrolling Interests | | | 21.4 | | | | 15.2 | | | | |
| | | | | | | | | | | | |
| Net Income - Omnicom Group | | $ | 204.6 | | | $ | 201.9 | | | 1.3 | % |
| | | | | | | | | | | | |
| (a) | | In the first quarter of 2011, we recorded an aggregate pre-tax charge of $7.9 million, consisting of a gain of $123.4 million related to a non-cash remeasurement gain, and repositioning charges of $131.3 million. The tax effect of these items was a net benefit of $36.7 million. This was partially offset by a tax charge of $9.0 million related to a tax accrual recorded in accordance with ASC 740 (FIN 48) during the first quarter of 2011. The after-tax effect of these items increased Net Income by $19.8 million and reduced our effective tax rate. |
| | April 17, 2012 | 2 |
2012 vs. 2011 NetIncomeandEarningsPer Share
| | | First Quarter |
| | | 2012 | | 2011 |
| Net Income - Omnicom Group | | $ | 204.6 | | | $ | 201.9 | |
| Net Income - Participating Securities | | | (4.5 | ) | | | (2.0 | ) |
| Net Income Available for Common Shares | | $ | 200.1 | | | $ | 199.9 | |
| | | | | | | | | |
| Diluted Shares (in millions) | | | 277.5 | | | | 289.2 | |
| | | | | | | | | |
| EPS - Diluted | | $ | 0.72 | | | $ | 0.69 | |
| |
| Dividend Declared per Share | | $ | 0.30 | | | $ | 0.25 | |
| | April 17, 2012 | 3 |
2012 TotalRevenue Change
| | | First Quarter |
| | | $ | | % ∆ |
| Prior Period Revenue | | $ | 3,151.3 | | | | |
| Foreign Exchange (FX) Impact(a) | | | (36.0 | ) | | -1.1 | % |
| Acquisition/Disposition Revenue(b) | | | 31.1 | | | 1.0 | % |
| Organic Revenue(c) | | | 160.9 | | | 5.1 | % |
| Current Period Revenue | | $ | 3,307.3 | | | 5.0 | % |
| (a) | | To calculate the FX impact, we first convert the current period’s local currency revenue using the average exchange rates from the equivalent prior period to arrive at constant currency revenue. The FX impact equals the difference between the current period revenue in U.S. dollars and the current period revenue in constant currency. |
| (b) | | Acquisition/Disposition revenue is the aggregate of the applicable prior period revenue of the acquired businesses. Netted against this number is the revenue of any business included in the prior period reported revenue that was disposed of subsequent to the prior period. |
| (c) | | Organic revenue is calculated by subtracting both the acquisition revenue and the FX impact from total revenue growth. |
| | April 17, 2012 | 4 |
2012RevenuebyDiscipline
FirstQuarter

| | | | | Total | | Organic |
| | $ Mix | | Growth | | Growth(a) |
| Advertising | $ | 1,550.1 | | 8.3 | % | | 8.5 | % |
| CRM | | 1,201.7 | | 2.4 | % | | 3.1 | % |
| PR | | 306.9 | | 6.5 | % | | 4.4 | % |
| Specialty | | 248.6 | | -3.7 | % | | -3.9 | % |
| (a) | | “Organic Growth” reflects the year-over-year increase or decrease in revenue from the prior period, excluding the FX Impact and Acquisition/Disposition Revenue, as defined on page 4. |
| | April 17, 2012 | 5 |
2012RevenuebyGeography
FirstQuarter
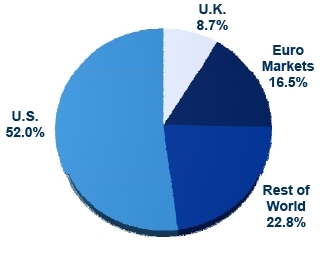
| | | $ Mix | | Growth | | | | $ Mix | | Growth | | Organic
Growth(a) |
| United States | | $ | 1,719.3 | | $ | 66.8 | | | United States | | $ | 1,719.3 | | 4.0 | % | | 4.4 | % |
| Organic | | | | | | 73.3 | | | Euro Currency Markets | | | 547.6 | | -5.2 | % | | 0.3 | % |
| Acquisition | | | | | | (6.5 | ) | | United Kingdom | | | 286.8 | | 2.4 | % | | 4.1 | % |
| International | | $ | 1,588.0 | | $ | 89.2 | | | Rest of World | | | 753.6 | | 17.5 | % | | 11.6 | % |
| Organic | | | | | | 87.6 | | | | | | | | | | | | |
| Acquisition | | | | | | 37.6 | | | | | | | | | | | | |
| FX | | | | | | (36.0 | ) | | | | | | | | | | | |
| (a) | | “Organic Growth” reflects the year-over-year increase in revenue from the prior period, excluding the FX Impact and Acquisition/Disposition Revenue, as defined on page 4. |
| | April 17, 2012 | 6 |
RevenueByIndustry
FirstQuarter- 2012
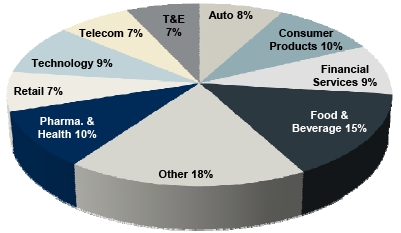
FirstQuarter- 2011
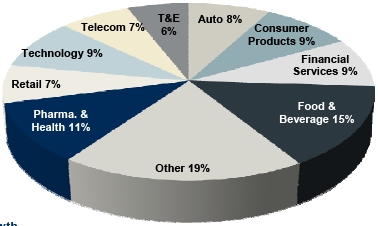
| | | Growth |
| Auto | | 13.1 | % |
| Food & Beverage | | 1.6 | % |
| Consumer Products | | 5.7 | % |
| Financial Services | | 5.3 | % |
| Pharma & Healthcare | | -3.0 | % |
| T&E | | 9.4 | % |
| Retail | | 11.9 | % |
| Technology | | 7.7 | % |
| Telecom | | 3.6 | % |
| Other Industries | | 3.5 | % |
| | April 17, 2012 | 7 |
Cash FlowPerformance
| | | Three Months Ended March 31 |
| | | 2012 | | 2011 |
| Net Income | | $ | 226.0 | | | $ | 217.1 | |
| Depreciation and Amortization Expense | | | 69.3 | | | | 65.2 | |
| Share-Based Compensation Expense | | | 26.3 | | | | 16.4 | |
| Other Non-Cash Items to Reconcile to Net Cash Provided byOperating Activities, net | | | (11.1 | ) | | | (123.0 | )(b) |
| Free Cash Flow(a) | | $ | 310.5 | | | $ | 175.7 | |
Additional information regardingour cash flows can be found in ourcondensedcash flowstatementon page 16.
| (a) | | The Free Cash Flow amounts presented above are non-GAAP financial measures. See page 23 for the definition and page 19 for GAAP reconciliation. |
| (b) | | 2011 figures include a $123.4 million non-cash gain on remeasurement of our equity interest in Clemenger Group. |
| | April 17, 2012 | 8 |
Cash FlowPerformance
| | | Three Months Ended March 31 |
| | | 2012 | | 2011 |
| Free Cash Flow(a) | | $ | 310.5 | | | $ | 175.7 | |
| Primary Uses of Cash: | | | | | | | | |
| Dividends | | | 69.8 | | | | 57.9 | |
| Dividends paid to Noncontrolling Interest Shareholders | | | 23.0 | | | | 24.9 | |
| Capital Expenditures | | | 45.6 | | | | 39.1 | |
| Acquisitions and Payments for Additional Interest in Controlled Subsidiaries, net of Proceeds from Sale of Investments | | | 12.9 | | | | 219.9 | |
| Stock Repurchases, net | | | 152.9 | | | | 301.5 | |
| Primary Uses of Cash(a) | | | 304.2 | | | | 636.3 | |
| Net Free Cash Flow(a) | | $ | 6.3 | | | $ | (460.6 | ) |
Additional information regardingour cash flows can be found in ourcondensedcash flowstatementon page 16.
| (a) | | The Free Cash Flow, Primary Uses of Cash and Net Free Cash Flow amounts presented above are non-GAAP financial measures. See page 23 for the definition of these measures and page 19 for the reconciliation of non-GAAP measures. |
| | April 17, 2012 | 9 |
CurrentCreditPicture
| | | Twelve Months Ended March 31 |
| | | 2012 | | 2011 |
| EBITDA(a) | | $ | 1,989.3 | | | | $ | 1,747.5 | | |
| Gross Interest Expense | | | 154.7 | | | | | 146.9 | | |
| EBITDA / Gross Interest Expense | | | 12.9 | | x | | | 11.9 | | x |
| Total Debt / EBITDA | | | 1.6 | | x | | | 1.8 | | x |
| Net Debt(b)/ EBITDA | | | 0.8 | | x | | | 1.0 | | x |
| Debt | | | | | | | | | | |
| Bank Loans (Due Less Than 1 Year) | | $ | 12 | | | | $ | 64 | | |
| CP & Borrowings Issued Under Revolver | | | – | | | | | – | | |
| Convertible Notes(c) | | | 660 | | | | | 660 | | |
| Senior Notes(c) | | | 2,500 | | | | | 2,500 | | |
| Other Debt | | | – | | | | | (3 | ) | |
| Total Debt | | $ | 3,172 | | | | $ | 3,221 | | |
| Cash and Short Term Investments | | | 1,509 | | | | | 1,518 | | |
| | | | | | | | | | | |
| Net Debt(b) | | $ | 1,663 | | | | $ | 1,703 | | |
| | | | | | | | | | | |
| (a) | | EBITDA is a non-GAAP financial measure. See page 23 for the definition of this measure and page 18 for the reconciliation of non-GAAP measures. |
| (b) | | Net Debt is a non-GAAP financial measure. See page 23 for the definition of this measure. |
| (c) | | See pages 14 and 15 for additional information on our Convertible Notes and Senior Notes. |
| | April 17, 2012 | 10 |
Historical Returns
| Return on Invested Capital (ROIC)(a): | | |
| Twelve Months Ended March 31, 2012 | | 16.9% |
| Twelve Months Ended March 31, 2011 | | 15.7% |
| | | |
| | | |
| Return on Equity(b): | | |
| Twelve Months Ended March 31, 2012 | | 26.9% |
| Twelve Months Ended March 31, 2011 | | 23.3% |
| (a) | | Return on Invested Capital is After Tax Operating Income (a non-GAAP measure – see page 23 for the definition of this measure and page 19 for the reconciliation of non-GAAP measures) divided by the average of Invested Capital at the beginning and the end of the period (Book value of all long-term liabilities and short-term interest bearing debt plus shareholders’ equity less cash, cash equivalents and short term investments). |
| (b) | | Return on Equity is Net Income for the given period divided by the average of shareholders equity at the beginning and end of the period. |
| | April 17, 2012 | 11 |
Net CashReturnedtoShareholders through Dividendsand Share Repurchases
Omnicom's Revenuesand NetIncome doubledsince 2002(a). During this period andthroughQ1 2012,Omnicom distributedover 95% of NetIncometoshareholders, through Dividendsand ShareRepurchases.
| (a) | | Omnicom Revenue went from $6.9 billion to $13.9 billion and Net Income from $455 million to $953 million in 2002 and 2011, respectively. |
| | April 17, 2012 | 12 |
 | Supplemental Financial Information |
OmnicomDebtStructure
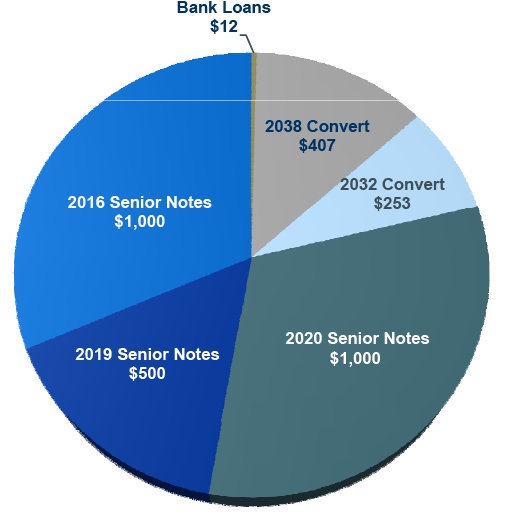
The above chart sets forthOmnicom’sdebtoutstandingat March 31, 2012.
Theamounts reflectedabove for the 2016, 2019 and 2020 Senior Notesrepresenttheprincipal amountof these notes atmaturityon April 15, 2016, July 15, 2019 andAugust15, 2020,respectively.
| | April 17, 2012 | 14 |
OmnicomDebtMaturityProfile
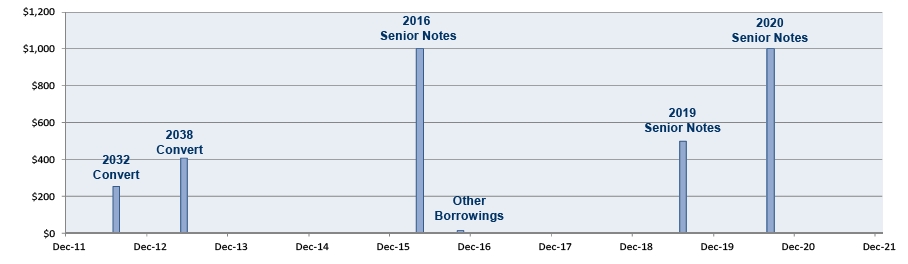
Our 2032ConvertibleNotes areputableon July 31, 2012 andannuallyin Julythereafteruntilmaturity.Our 2038ConvertibleNotes areputablein June 2013, 2018, 2023 andannually thereafteruntilmaturity.
Otherborrowingsat March 31, 2012includeshort-termborrowingsof $12 million which are due in less than one year. Forpurposesof thispresentationwe haveincludedtheseborrowingsasoutstanding through October2016, the date ofexpirationof our five-year creditfacility.
| | April 17, 2012 | 15 |
CondensedCash Flow
| | | Three Months Ended March 31 |
| | | 2012 | | 2011 |
| Net Income | | $ | 226.0 | | | $ | 217.1 | |
| Share-Based Compensation Expense | | | 26.3 | | | | 16.4 | |
| Depreciation and Amortization | | | 69.3 | | | | 65.2 | |
| Gain on Remeasurement of Equity Interest in Clemenger Group | | | – | | | | (123.4 | ) |
| Other Non-Cash Items to Reconcile to Net Cash Provided by Operating Activities, net | | | (11.1 | ) | | | 0.4 | |
| Changes in Operating Capital | | | (311.0 | ) | | | (352.6 | ) |
| Net Cash Used in Operating Activities | | | (0.5 | ) | | | (176.9 | ) |
| |
| Capital Expenditures | | | (45.6 | ) | | | (39.1 | ) |
| Acquisitions, net of Proceeds from Sale of Investments | | | (11.6 | ) | | | (200.3 | ) |
| Net Cash Used in Investing Activities | | | (57.2 | ) | | | (239.4 | ) |
| |
| Dividends | | | (69.8 | ) | | | (57.9 | ) |
| Dividends paid to Noncontrolling Interest Shareholders | | | (23.0 | ) | | | (24.9 | ) |
| Proceeds from Short-term & Long-term Debt, net | | | 1.9 | | | | 9.7 | |
| Repayment of Convertible Debt | | | – | | | | (0.1 | ) |
| Stock Repurchases, net of Proceeds from Stock Plans and Tax Benefit from Stock Plans | | | (152.9 | ) | | | (301.5 | ) |
| Payments for Additional Interest in Controlled Subsidiaries | | | (1.3 | ) | | | (12.6 | ) |
| Other Financing Activities, net | | | (7.2 | ) | | | (2.7 | ) |
| Net Cash Used in Financing Activities | | | (252.3 | ) | | | (390.0 | ) |
| |
| Effect of exchange rate changes on cash and cash equivalents | | | 31.5 | | | | 29.8 | |
| Net Decrease in Cash and Cash Equivalents | | $ | (278.5 | ) | | $ | (776.5 | ) |
| | April 17, 2012 | 16 |
2012Acquisition Related Expenditures
| | | First Quarter |
| |
| Acquisitions of Businesses and Affiliates(a) | | $ | 30.4 |
| Additional Interest in Controlled Subsidiaries(b) | | | 1.3 |
| Earn-outs(c) | | | 1.4 |
| Total Acquisition Expenditures(d) | | $ | 33.1 |
| (a) | | Includes acquisitions of a majority interest in agencies resulting in their consolidation, including additional interest in existing affiliate agencies resulting in majority ownership. |
| (b) | | Includes the acquisition of additional equity interests in already consolidated subsidiary agencies which are recorded to Equity – Noncontrolling Interest. |
| (c) | | Includes additional consideration paid for acquisitions completed in prior periods. |
| (d) | | Total Acquisition Expenditures figure is net of cash acquired. |
| | April 17, 2012 | 17 |
Reconciliationof Non-GAAPMeasures
| | | First Quarter | | 12 Months Ended March 31 |
| | | 2012 | | 2011 | | 2012 | | 2011 |
| Revenue | | $ | 3,307.3 | | | $ | 3,151.3 | | | $ | 14,028.4 | | | $ | 12,773.9 | |
| Operating Expenses, excluding Depreciation and Amortization | | | 2,875.5 | | | | 2,764.0 | | | | 12,039.1 | | | | 11,026.4 | |
| EBITDA | | | 431.8 | | | | 387.3 | | | | 1,989.3 | | | | 1,747.5 | |
| Depreciation | | | 45.3 | | | | 44.5 | | | | 183.2 | | | | 181.0 | |
| EBITA | | | 386.5 | | | | 342.8 | | | | 1,806.1 | | | | 1,566.5 | |
| Amortization of Intangibles | | | 24.0 | | | | 20.7 | | | | 94.7 | | | | 75.2 | |
| Operating Income | | | 362.5 | | | | 322.1 | | | | 1,711.4 | | | | 1,491.3 | |
| Net Interest Expense | | | 29.2 | | | | 32.1 | | | | 119.0 | | | | 117.8 | |
| Income Before Tax | | | 333.3 | | | | 290.0 | | | | 1,592.4 | | | | 1,373.5 | |
| Taxes | | | 109.3 | | | | 73.9 | | | | 541.3 | | | | 443.3 | |
| Income from Equity Method Investments | | | 2.0 | | | | 1.0 | | | | 18.2 | | | | 29.8 | |
| Net Income | | | 226.0 | | | | 217.1 | | | | 1,069.3 | | | | 960.0 | |
| Less: Net Income Attributed to Noncontrolling Interests | | | 21.4 | | | | 15.2 | | | | 114.0 | | | | 93.7 | |
| Net Income - Omnicom Group | | $ | 204.6 | | | $ | 201.9 | | | $ | 955.3 | | | $ | 866.3 | |
The abovereconciles EBITDA& EBITA to the GAAPfinancial measuresfor theperiods presented.
EBITDAand EBITA are non-GAAPfinancial measureswithin themeaningofapplicableSEC rules. Our credit facilitydefines EBITDAasearningsbeforededucting interest expense, incometaxes,depreciationandamortization.Our credit facility usesEBITDAtomeasureourcompliancewithcovenants,such asinterest coverageandleverageratios aspresentedon page 10 of thispresentation.
| | April 17, 2012 | 18 |
Reconciliationof Non-GAAPMeasures
| | | Three Months Ended March 31 |
| | | 2012 | | 2011 |
| Net Free Cash Flow | | $ | 6.3 | | | $ | (460.6 | ) |
| Cash Flow items excluded from Net Free Cash Flow: | | | | | | | | |
| Changes in Operating Capital | | | (311.0 | ) | | | (352.6 | ) |
| Proceeds from Short-term & Long-term Debt, net | | | 1.9 | | | | 9.7 | |
| Repayment of Convertible Debt | | | – | | | | (0.1 | ) |
| Other Financing Activities, net | | | (7.2 | ) | | | (2.7 | ) |
| Effect of exchange rate changes on cash and cash equivalents | | | 31.5 | | | | 29.8 | |
| Net Decrease in Cash and Cash Equivalents | | $ | (278.5 | ) | | $ | (776.5 | ) |
| |
| |
| | | Twelve Months Ended March 31 |
| | | 2012 | | 2011 |
| Operating Income | | $ | 1,711.4 | | | $ | 1,491.3 | |
| | | | | | | | | |
| Effective Tax Rate for the applicable period | | | 34.0 | % | | | 32.3 | % |
| Income Taxes on Operating Income | | | 581.9 | | | | 481.7 | |
| After Tax Operating Income | | $ | 1,129.5 | | | $ | 1,009.6 | |
| | April 17, 2012 | 19 |
FirstQuarter Acquisition

Medical Collective Intelligence (“MCI”)is a leading market research company, specializing in providing clients with online market research and CRM solutions for the medical and pharma industries in Japan.
MCI’smarket research services provided include quantitativeandqualitative research covering consulting, planning, information collection, fieldwork operations, analysis, reportingandrecommendation.Thecompanyalsoprovides relationship outreachwithphysicians.
With offices in Tokyo andOsaka,Japan, MCI willoperateas part of theDiversified Agency Services network.
| | April 17, 2012 | 20 |
FirstQuarter Acquisition

Fleishman-Hillard,aleadingglobal publicrelations company,hasacquiredamajority interestinFleishman-HillardVanguard,itsoperatingbrand inRussia.
Fleishman-HillardVanguardis one of theleading communication consultanciesinRussiaand its client baseincludes leading multinationalsas well asprominent Russian companiesandinstitutions spanninga broadspectrumofcommerce, industryandgovernment.
Fleishman-HillardVanguardislocatedinMoscow, Russia. Fleishman-Hillard is part of theDiversified Agency Services network.
| | April 17, 2012 | 21 |
FirstQuarter Acquisition

Channel5 Communications is a retail marketing agency, focusing on in-store marketing solutions for consumer product, healthcare and food and beverage clients. Channel 5 also provides field force promotion and event services through its Test Drive division.
Channel5CommunicationsislocatedinSydney, Australiaand willoperateas part of theClemengerGroup within the BBDOWorldwide network.
| | April 17, 2012 | 22 |
Disclosure
The preceding materials have been prepared for use in the April 17, 2012 conference call on Omnicom’s results of operations for the period ended March 31, 2012. The call will be archived on the Internet at http://www.omnicomgroup.com/financialwebcasts.
Forward-Looking Statements
Certainof thestatementsin thispresentation constitute forward-looking statementswithin themeaningof thePrivate Securities Litigation ReformAct of 1995. Inaddition,from time to time, we or ourrepresentativeshave made or may makeforward-looking statements,orally or inwriting.Thesestatementsrelate to future events or futurefinancial performanceandinvolveknown andunknownrisks and other factors that may cause our actual or ourindustry’s results,levels ofactivityorachievementto bematerially differentfrom thoseexpressedorimpliedby anyforward-looking statements.These risks anduncertainties, includingthose that aredescribedin our 2011AnnualReport of Form 10-K under Item 1A - RiskFactorsand Item 7 -Management’s DiscussionandAnalysisofFinancial ConditionandResultsofOperations, include,but are not limited to, our futurefinancial positionand results ofoperations,globaleconomic conditionsandconditionsin the creditmarkets,losses on mediapurchasesandproductioncostsincurredon behalf ofclients, reductionsin clientspendingand/or aslowdownin clientpayments, competitive factors, changesin clientcommunication requirements, managing conflictsofinterest,the hiring andretentionofpersonnel, maintaininga highly skilledworkforce,our ability to attract new clients and retainexisting clients, relianceoninformation technology systems, changesingovernment regulations impactingouradvertisingandmarketing strategies,risksassociatedwithassumptionswe make inconnectionwith our criticalaccounting estimatesand legalproceedings,and ourinternational operations,which aresubjectto the risks ofcurrency fluctuationsand foreignexchange controls.In some cases,forward-looking statementscan beidentifiedbyterminologysuch as “may,” “will,”“could,” “would,” “should,” “expect,”“plan,”“anticipate,” “intend,” “believe,” “estimate,” “predict,” “potential”or“continue”or thenegativeof those terms or othercomparable terminology.Thesestatementsare ourpresent expectations.Actual events or results may differ. Weundertakenoobligationtoupdateor revise anyforward-looking statement,except asrequiredby law.
Non-GAAPFinancial Measures
Weprovidehereinfinancial measures determinedinaccordancewithgenerally accepted accounting principlesin the United States(“GAAP”)andadjustmentsto the GAAPpresentation(“Non-GAAP”),which webelievearemeaningfulforunderstandingourperformance.Non-GAAPfinancial measuresshould not beconsideredinisolationfrom, or as asubstitutefor,financial information presentedincompliancewithGAAP.Non-GAAPfinancial measuresasreportedby us may not becomparabletosimilarlytitledamounts reportedby othercompanies.Weprovideareconciliationof non-GAAPmeasuresto thecomparableGAAPmeasureson pages 18 and 19.
The non-GAAPmeasuresused in thispresentation includethefollowing:
Net Free Cash Flow,definedas Free Cash Flow(definedbelow) less thePrimaryUses of Cash(definedbelow). Net Free Cash Flow is one of themetricsused by us toassessoursourcesand uses of cash and wasderivedfrom ourconsolidated statementsof cash flows. Webelievethat thispresentationismeaningfulforunderstandingourprimary sourcesandprimaryuses of that cash flow.Free Cash Flow,definedas netincomeplusdepreciation, amortization,share basedcompensation expenseand gain onremeasurementof equityinterestinaffiliatesless other non-cash items toreconcileto net cashprovidedbyoperating activities.
PrimaryUses of Cash,definedasdividendstocommon shareholders, dividendspaid tononcontrolling interest shareholders,capitalexpenditures,cash paid onacquisitions, paymentsforadditional interestincontrolled subsidiariesand stockrepurchases,net of theproceedsandexcesstax benefit from our stock plans, andexcludes changesinworkingcapital and otherinvestingandfinancing activities, including commercialpaperissuancesandredemptionsused to fundworkingcapitalchanges.
EBITDA,definedasoperating incomebeforeinterest,taxes,depreciationandamortization.Webelieve EBITDAis moremeaningfulforpurposesof thisanalysis becausethefinancial covenantsin our creditfacilitiesare based onEBITDA.
EBITA,definedasoperating incomebeforeinterest,taxes andamortization.We use EBITA as anadditional operating performance measure,whichexcludes acquisition-related amortization expense, becausewebelievethat EBITA is a usefulmeasuretoevaluatetheperformanceof ourbusinesses.
Net Debt,definedas total debt less cash, cashequivalentsand short-terminvestments.Webelievenet debt,togetherwith thecomparableGAAPmeasures, reflectsone of themetricsused by us toassessour cashmanagement.
After Tax Operating Income, defined as operating income less income taxes calculated using the effective tax rate for the applicable period.
OtherInformation
All dollaramountsare inmillionsexcept for per shareamounts.Thefollowing information containedin thisdocumenthas not beenaudited, althoughsome data has beenderivedfromOmnicom’s historical financial statements, includingitsaudited financial statements.Inaddition, industry, operationaland other non-financialdatacontainedin thisdocumenthave beenderivedfromsourcesthat webelieveto bereliable,but we have notindependently verifiedsuchinformation,and we do not, nor does any otherperson, assume responsibilityfor theaccuracyorcompletenessof thatinformation. Certain amountsin priorperiodshave beenreclassifiedtoconformto ourcurrent presentation.
Theinclusionofinformationin thispresentationdoes not mean that suchinformationismaterialor thatdisclosureof suchinformationisrequired.
| | April 17, 2012 | 23 |