Exhbit 99.2

Fourth Quarter 2012 Results
February 12, 2013
2012 vs. 2011 P&L Summary
Fourth Quarter Full Year
2012 2011 % 2012 2011 %
Revenue$ 3,944.5 $ 3,852.92.4%$ 14,219.4 $ 13,872.52.5% EBITA(a)573.9 511.112.3%1,905.3 1,762.58.1%
% Margin 14.5% 13.3% 13.4% 12.7%
Amortization of Intangibles25.9 23.7 101.1 91.4
Operating Income$ 548.0 $ 487.412.4%$ 1,804.2 $ 1,671.18.0%
% Margin 13.9% 12.7% 12.7% 12.0%
(a) EBITA is a non-GAAP financial measure. See page 26 for the definition of this measure and page 19 for the reconciliation of non-GAAP measures.
February 12, 2013 1
2012 vs. 2011 P&L Summary
Fourth Quarter Full Year
2012 2011 % 2012 2011(b)%
Operating Income$ 548.0 $ 487.412.4%$ 1,804.2 $ 1,671.18.0%
% Margin 13.9% 12.7% 12.7% 12.0%
Net Interest Expense40.3 30.3 144.6 122.1
(a) (a)
Income Taxes137.3 156.8 527.1 505.8
% Tax Rate 27.0% 34.3% 31.8% 32.7%
Income/(Loss) from Equity(c) (c)
(26.8) 6.9 (15.0) 17.2
Method Investments
Noncontrolling Interests36.5 35.3 119.2 107.8
Net Income - Omnicom Group$ 307.1 $ 271.912.9%$ 998.3 $ 952.64.8%
(a) Our effective tax rate for 2012 decreased to 31.8%, compared to 32.7% for 2011. In the fourth quarter of 2012, income tax expense was reduced by $53 million, primarily resulting from a reduction in the deferred tax liabilities for unremitted foreign earnings of certain of our operating companies located in the Asia Pacific region, as well as lower statutory tax rates in other foreign jurisdictions. In an effort to support our continued expansion and pursue operational efficiencies in the Asia Pacific region, we completed a legal reorganization in certain countries within the region. As a result of the reorganization, our unremitted foreign earnings in the effected countries are subject to lower effective tax rates as compared to the U.S. statutory tax rate. Therefore we recorded a reduction in our deferred tax liabilities to reflect the lower tax rate that these earnings are subject to. In future periods we expect an ongoing annual reduction in income tax expense of approximately $11 million. The reduction in income tax expense was partially offset by a charge of approximately $16 million resulting from U.S. state and local tax accruals recorded for uncertain tax positions, net of federal income tax benefits. We expect that on an ongoing basis our effective tax rate will be 33.6%.
(b) In the first quarter of 2011, we recorded an aggregate pre-tax charge of $7.9 million, consisting of a gain of $123.4 million related to a non-cash remeasurement gain, and repositioning charges of $131.3 million. The tax effect of these items was a net benefit of $36.7 million. This was partially offset by a tax charge of $9.0 million related to a tax accrual recorded in accordance with ASC 740 (FIN 48) during the first quarter of 2011. The after-tax effect of these items increased Net Income by $19.8 million and reduced our effective tax rate.
(c) In the fourth quarter of 2012, we recorded an impairment charge of $29.2 million related to an equity method investment in Egypt.
February 12, 2013 2
2012 vs. 2011 Net Income and Earnings Per Share
Fourth Quarter Full Year 2012 2011 2012 2011
Net Income - Omnicom Group$ 307.1 $ 271.9 $ 998.3 $ 952.6
Net Income - Participating Securities(7.2) (3.5) (22.5) (10.7)Net Income Available for Common Shares$ 299.9 $ 268.4 $ 975.8 $ 941.9
Diluted Shares (millions)266.0 280.8 270.0 283.3
EPS - Diluted $ 1.13 $ 0.96 $ 3.61 $ 3.33
Dividend Declared per Share$ 0.30 $ 0.25 $ 1.20 $ 1.00
February 12, 2013 3
2012 Total Revenue Change
Fourth Quarter Full Year
$ % $ %
Prior Period Revenue$ 3,852.9 $ 13,872.5
Foreign Exchange (FX) Impact(a)(28.2) -0.7% (310.0) -2.2%
Acquisition/Disposition Revenue(b)15.1 0.4% 95.0 0.7%
Organic Revenue(c)104.7 2.7% 561.9 4.0%
Current Period Revenue$ 3,944.5 2.4% $ 14,219.4 2.5%
(a) To calculate the FX impact, we first convert the current period’s local currency revenue using the average exchange rates from the equivalent prior period to arrive at constant currency revenue. The FX impact equals the difference between the current period revenue in U.S. dollars and the current period revenue in constant currency.
(b) Acquisition/Disposition revenue is the aggregate of the applicable prior period revenue of the acquired businesses. Netted against this number is the revenue of any business included in the prior period reported revenue that was disposed of subsequent to the prior period.
(c) Organic revenue is calculated by subtracting both the acquisition revenue and the FX impact from total revenue growth.
February 12, 2013 4
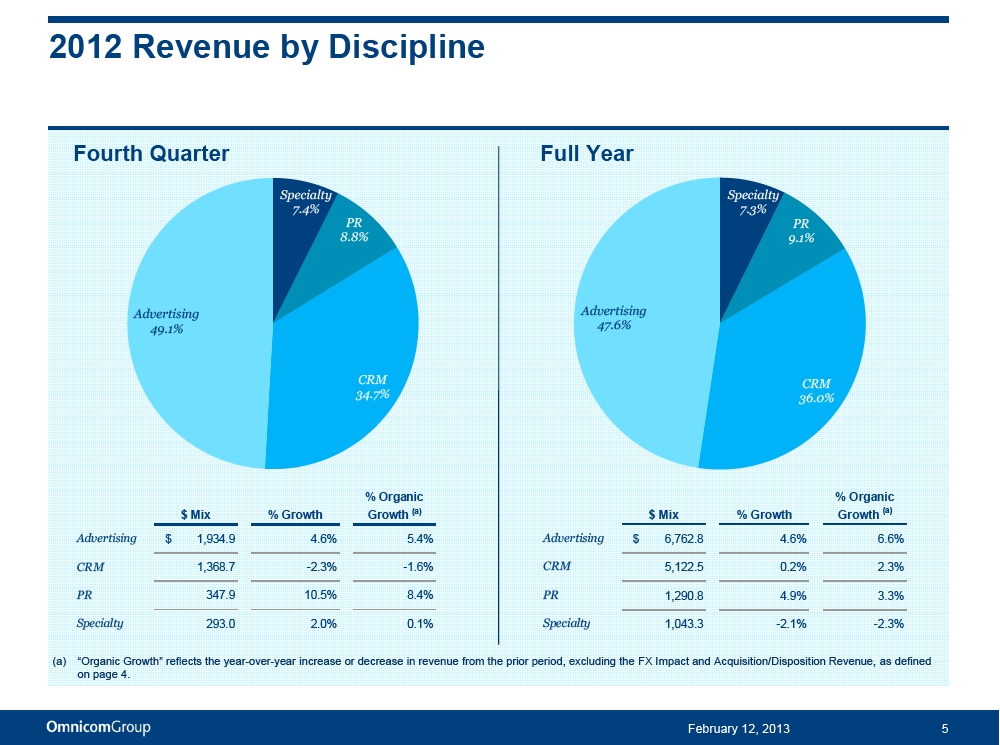
2012 Revenue by Discipline
Fourth Quarter Full Year
Specialty Specialty 7.4% 7.3% PR PR
8.8% 9.1%
Advertising Advertising 49.1% 47.6%
CRM CRM 34.7% 36.0%
% Organic % Organic $ Mix % Growth Growth(a)$ Mix % Growth Growth(a)
Advertising$ 1,934.9 4.6% 5.4%Advertising$ 6,762.8 4.6% 6.6%CRM1,368.7 -2.3% -1.6%CRM5,122.5 0.2% 2.3%PR347.9 10.5% 8.4%PR1,290.8 4.9% 3.3%Specialty293.0 2.0% 0.1%Specialty1,043.3 -2.1% -2.3%
(a) “Organic Growth” reflects the year-over-year increase or decrease in revenue from the prior period, excluding the FX Impact and Acquisition/Disposition Revenue, as defined on page 4.
February 12, 2013 5
2012 Revenue by Geography
Fourth Quarter Full Year
UK UK
8.7% 8.8%Rest of Rest of World World 23.2% 23.1%
Euro Euro Markets Markets
16.7% U.S. 16.3% U.S. 51.4% 51.8%
February 12, 2013 6
2012 Revenue by Geography
Fourth Quarter Full Year
$ Mix $ Growth $ Mix $ Growth United States $ 2,026.6 $ 97.9 United States $ 7,363.7 $ 315.0
Organic95.5Organic317.8Acquisition2.4Acquisition(2.8)
International $ 1,917.9 $ (6.3) International $ 6,855.7 $ 31.9
Organic9.2Organic244.1Acquisition12.7Acquisition97.8
FX(28.2)FX(310.0)
%Organic %Organic $ Mix %Growth Growth(a)$ Mix %Growth Growth(a)
United States$ 2,026.6 5.1% 5.0%United States$ 7,363.7 4.5% 4.5%
Euro Currency Markets659.6 -8.8% -3.7%Euro Currency Markets2,311.9 -10.4% -1.8%
United Kingdom343.1 4.5% -0.7%United Kingdom1,255.1 2.3% 1.5%Rest of World915.2 4.9% 4.4%Rest of World3,288.7 9.0% 9.0%
(a) “Organic Growth” reflects the year-over-year increase or decrease in revenue from the prior period, excluding the FX Impact and Acquisition/Disposition Revenue, as defined on page 4.
February 12, 2013 7
Revenue by Industry
Full Year – 2012 Full Year – 2011
Growth
T&E Auto T&E AutoAuto14.7%
6% 8% 6% 7% Telcom Telcom
6% 7% ConsumerFood & Beverage-0.1%Consumer Products Tech Products 9%
9%Consumer Products4.1%
9% Tech
Financial
Financial 9% ServicesFinancial Services-6.0%Services 9% Retail 9%Pharma &Retail-1.3%
8%Healthcare7%
T&E2.7%
Food & Food & Beverage Pharma & Beverage Pharma &
13% Health 14%Retail17.5%Health 10% 10%Technology6.5%
Other OtherTelecom-7.1%22% 22%Other Industries1.7%
February 12, 2013 8
Cash Flow Performance
Full Year 2012 2011
Net Income $ 1,117.5 $ 1,060.4
Depreciation and Amortization Expense282.7 273.7
Share-Based Compensation Expense80.8 74.5
Other Non-Cash Items to Reconcile to Net Cash Provided by Operating
(54.9)(b)(161.3)(c)
Activities, net
Free Cash Flow(a)$ 1,426.1 $ 1,247.3
Additional information regarding our cash flows can be found in our condensed cash flow statement on page 18.
(a) The Free Cash Flow amounts presented above are non-GAAP financial measures. See page 26 for the definition and page 20 for GAAP reconciliation. (b) 2012 figures include a $29.2 million non-cash impairment charge on an equity method investment in Egypt.
(c) 2011 figures include a $123.4 million non-cash gain on remeasurement of our equity interest in Clemenger Group.
February 12, 2013 9
Cash Flow Performance
Full Year 2012 2011
Free Cash Flow(a)$ 1,426.1 $ 1,247.3 Primary Uses of Cash:
Dividends(b)397.8 269.1
Dividends paid to Noncontrolling Interest Shareholders98.4 101.3
Capital Expenditures226.3 185.5Acquisitions and Payments for Additional Interest in Controlled Subsidiaries including Contingent Purchase Price Payments, net of188.3 447.6Proceeds from Sale of Investments Stock Repurchases, net832.0 701.1
Primary Uses of Cash(a)1,742.8 1,704.6 Net Free Cash Flow(a)$ (316.7) $ (457.3)
Additional information regarding our cash flows can be found in our condensed cash flow statement on page 18.
(a) The Free Cash Flow, Primary Uses of Cash and Net Free Cash Flow amounts presented above are non-GAAP financial measures. See page 26 for the definition of these measures and page 20 for the reconciliation of non-GAAP measures.
(b) In November 2012, the Company declared that its fourth quarter 2012 dividend was to be paid in December 2012. As a result, there were five dividend payments in 2012 compared to four payments in 2011. The Company expects that there will be three payments in 2013.
February 12, 2013 10
Current Credit Picture
Full Year
2012 2011
EBITDA(a)$ 2,086.9 $ 1,944.8
Gross Interest Expense179.7 158.1EBITDA / Gross Interest Expense11.6 x 12.3 xTotal Debt / EBITDA2.1 x 1.6 xNet Debt(b)/ EBITDA0.8 x 0.7 x
Debt
Bank Loans (Due Less Than 1 Year)$ 6 $ 10CP & Borrowings Issued Under Revolver- -Convertible Notes(c)660 660Senior Notes(c)3,750 2,500Other Debt39 23
Total Debt $ 4,455 $ 3,193
Cash and Short Term Investments2,699 1,805
Net Debt(b)$ 1,756 $ 1,388
(a) EBITDA is a non-GAAP financial measure. See page 26 for the definition of this measure and page 19 for the reconciliation of non-GAAP measures. (b) Net Debt is a non-GAAP financial measure. See page 26 for the definition of this measure.
(c) See pages 15 and 16 for additional information on our Convertible Notes and Senior Notes.
February 12, 2013 11
Historical Returns
Return on Invested Capital (ROIC)(a):
Twelve Months Ended December 31, 201218.6%
Twelve Months Ended December 31, 201118.8%
Return on Equity(b):
Twelve Months Ended December 31, 201228.7%
Twelve Months Ended December 31, 201126.9%
(a) Return on Invested Capital is After Tax Operating Income (a non-GAAP measure – see page 26 for the definition of this measure and page 20 for the reconciliation of non-GAAP measures) divided by the average of Invested Capital at the beginning and the end of the period (book value of all long-term liabilities and short-term interest bearing debt plus shareholders’ equity less cash, cash equivalents and short term investments).
(b) Return on Equity is Net Income for the given period divided by the average of shareholders equity at the beginning and end of the period.
February 12, 2013 12
Net Cash Returned to Shareholders through Dividends and Share Repurchases
Omnicom’s Revenues and Net Income has doubled since 2002(a). From 2002 through 2012, Omnicom distributed over 99% of Net Income to shareholders through Dividends and Share Repurchases.
10.0
9.0 $9.12 $9.05 8.0
7.0 $6.79
Billions
6.0
5.0in
$4.0
3.0 $2.26 2.0
1.0
-
2002 2003 2004 2005 2006 2007 2008 2009 2010 2011 2012 Cumulative Dividends Paid
Cumulative Cost of Net Shares Repurchased, defined as payments for repurchases of common stock less proceeds from stock plans Cash Returned to Shareholders, defined as the sum of Cumulative Dividends paid and Cumulative Cost of Net Shares Repurchased Cumulative Net Income - Omnicom Group Inc.
(a) Omnicom Revenue increased from $6.9 billion to $14.2 billion and Net Income increased from $455 million to $998 million in 2001 and 2012, respectively.
February 12, 2013 13

Supplemental Financial Information
February 12, 2013 14
DRAFT
Omnicom Debt Structure
Bank Loans $6
2032 Convert2038 Convert$253$407
2016 Senior Notes $1,000
2019 Senior Notes 2022 Senior Notes $500 $1,250
2020 Senior Notes $1,000
The above chart sets forth Omnicom’s debt outstanding at December 31, 2012. The amounts reflected above for the 2016, 2019, 2020 and 2022 Senior Notes represent the principal amount of these notes at maturity on April 15, 2016, July 15, 2019, August 15, 2020 and May 1, 2022, respectively.
February 12, 2013 15
DRAFT
Omnicom Debt Maturity Profile
2022 Senior Notes$1,250
2016 2020 Senior Notes Senior Notes$1,000
$750
2019 Senior Notes$5002038 Convert 2032 Convert$250
Other Borrowings$0
Our 2038 Convertible Notes are putable in June 2013, 2018, 2023 and annually thereafter until maturity. Our 2032 Convertible Notes are putable on July 31, 2013 and annually in July thereafter until maturity.
Other borrowings at December 31, 2012 include short-term borrowings of $6 million which are due in less than one year. For purposes of this presentation we have included these borrowings as outstanding through October 2016, the date of expiration of our five-year credit facility.
February 12, 2013 16
DRAFT
2012 Acquisition Related Expenditures
Full Year
Acquisitions of Businesses and Affiliates(a)$ 101.1Additional Interest in Controlled Subsidiaries(b)32.0Earn-outs on acquisitions completed prior to January 1, 2009(c)31.7Earn-outs on acquisitions completed after January 1, 2009(c)32.2
Total Acquisition Expenditures(d)$ 197.0
(a) Includes acquisitions of a majority interest in agencies resulting in their consolidation, including additional interest in existing affiliate agencies resulting in majority ownership. (b) Includes the acquisition of additional equity interests in already consolidated subsidiary agencies which are recorded to Equity – Noncontrolling Interest.
(c) Includes additional consideration paid for acquisitions completed in prior periods. (d) Total Acquisition Expenditures figure is net of cash acquired.
February 12, 2013 17
DRAFT
Condensed Cash Flow
Full Year 2012 2011 Net Income $ 1,117.5 $ 1,060.4
Share-Based Compensation Expense80.8 74.5Depreciation and Amortization282.7 273.7Gain on Remeasurement of Equity Interest in Clemenger Group- (123.4)Gain on Remeasurement of Equity Interest in Affiliates(2.1) (15.1)Impairment Charge on Equity Interest in Egyptian Affiliate29.2 -Other Non-Cash Items to Reconcile to Net Cash Provided by Operating Activities, net(82.0) (22.8)Changes in Operating Capital25.2 68.0
Net Cash Provided by Operating Activities1,451.3 1,315.3
Capital Expenditures(226.3) (185.5)Acquisitions, net of Proceeds from Sale of Investments(124.1) (389.1)
Net Cash Used in Investing Activities(350.4) (574.6)
Dividends(397.8) (269.1)
Dividends paid to Noncontrolling Interest Shareholders(98.4) (101.3)Proceeds from/(Repayments of) Short-term & Long-term Debt, net1,269.9 (43.1)Repayment of Convertible Debt- (0.1)Stock Repurchases, net of Proceeds from Stock Plans and Excess Tax Benefit from Stock Plans(832.0) (701.1)Payments for Additional Interest in Controlled Subsidiaries(32.0) (38.8)Contingent Purchase Price Payments(32.2) (19.7)Other Financing Activities, net(97.6) (32.5)
Net Cash Used in Financing Activities(220.1) (1,205.7)Effect of exchange rate changes on cash and cash equivalents16.3 (42.5)Net Increase/(Decrease) in Cash and Cash Equivalents $ 897.1 $ (507.5)
February 12, 2013 18
DRAFT
Reconciliation of Non-GAAP Measures
3 Months Ended December 31 Full Year
2012 2011 2012 2011
Revenue$ 3,944.5 $ 3,852.9 $ 14,219.4 $ 13,872.5
Operating Expenses, excluding Depreciation and Amortization3,324.4 3,295.3 12,132.5 11,927.7
EBITDA620.1 557.6 2,086.9 1,944.8Depreciation46.2 46.5 181.6 182.3EBITA573.9 511.1 1,905.3 1,762.5
Amortization of Intangibles25.9 23.7 101.1 91.4
Operating Income548.0 487.4 1,804.2 1,671.1
Net Interest Expense40.3 30.3 144.6 122.1
Income Before Tax507.7 457.1 1,659.6 1,549.0Taxes137.3 156.8 527.1 505.8
Income/(Loss) from Equity Method Investments(26.8) 6.9 (15.0) 17.2
Net Income343.6 307.2 1,117.5 1,060.4
Less: Net Income Attributed to Noncontrolling Interests36.5 35.3 119.2 107.8
Net Income - Omnicom Group$ 307.1 $ 271.9 $ 998.3 $ 952.6
The above reconciles EBITDA & EBITA to the GAAP financial measures for the periods presented.
EBITDA and EBITA are non-GAAP financial measures within the meaning of applicable SEC rules and regulations. Our credit facility defines EBITDA as earnings before deducting interest expense, income taxes, depreciation and amortization. Our credit facility uses EBITDA to measure our compliance with covenants, such as interest coverage and leverage ratios, as presented on page 11 of this presentation.
February 12, 2013 19
DRAFT
Reconciliation of Non-GAAP Measures
Full Year 2012 2011 Net Free Cash Flow $ (316.7) $ (457.3) Cash Flow items excluded from Net Free Cash Flow:
Changes in Operating Capital25.2 68.0Proceeds from Short-term & Long-term Debt, net1,269.9 (43.1)Repayment of Convertible Debt- (0.1)Other Financing Activities, net(97.6) (32.5)Effect of exchange rate changes on cash and cash equivalents16.3 (42.5)
Net Increase/(Decrease) in Cash and Cash Equivalents $ 897.1 $ (507.5)
Full Year 2012 2011 Operating Income $ 1,804.2 $ 1,671.1
Effective Tax Rate for the applicable period31.8% 32.7%Income Taxes on Operating Income573.7 546.4
After Tax Operating Income $ 1,230.5 $ 1,124.7
February 12, 2013 20
DRAFT
Fourth Quarter Acquisition
Established in 2003, Promise Corporation is a co-creation consultancy specializing in innovation, brand strategy and customer insights. Co-creation is the act of bringing together multiple stakeholder groups to help solve business challenges and take advantage of opportunities; helping them better understand the interaction between brand perception and consumer experience.
With offices in London and New York, Promise will be fully integrated into the Communispace group of companies within the Diversified Agency Services network.
February 12, 2013 21
DRAFT
Fourth Quarter Acquisition
Established in 1995, Capstrat is a strategic communications firm. The Company provides an integrated service offering to their clients that includes Public Relations, Public Affairs and Marketing Communications (branding, identity development, graphic design, etc). Also included in their offering is a sophisticated set of tools for analytics and metrics, CRM, animation, and mobile and web design.
Located in Raleigh, North Carolina, Capstrat will operate as part of the Ketchum Public Relations division within the Diversified Agency Services network.
February 12, 2013 22
DRAFT
Fourth Quarter Acquisition
Formed in 1992, Mother Tongue Writers specializes in marketing translation, creative adaptation of advertising copy and transcreation services. It has an international network of experienced copywriters and is recognized for quality, speed and cost effectiveness, ensuring that translations are not just technically correct, but engaging and culturally relevant.
Mother Tongue is headquartered in London and also has offices in Singapore and New York. It will align with the E-Graphics brand within the TBWA\ Worldwide network.
February 12, 2013 23
DRAFT
Fourth Quarter Acquisition
Founded in 2000, Magnon Group is an award winning digital agency specializing in graphic design for web and mobile, digital marketing including search and social media optimization, applications development, online brand strategy consulting, and eCommerce solutions. Magnon Group operates under two divisions – Magnon Solutions and Magnon International.
Magnon Group has offices in Mumbai and New Delhi, India and will become part of the TBWA\ Worldwide network. Magnon Solutions will join TBWA’s global Digital Arts Network, while Magnon International will become part of E-Graphics.
February 12, 2013 24
DRAFT
Fourth Quarter Acquisition
Founded in 2005, Toinen Helsinki was created with the mission to create powerful engagements between brands and consumers across all areas of media. Ainoa, a subsidiary company, was founded in 2008 to focus on online campaign implementation, optimization and analytics.
Toinen Helsinki and Ainoa are both based in Helsinki, Finland and will be merged with OMG Finland within the Omnicom Media Group network.
February 12, 2013 25
DRAFT
Disclosure
The preceding materials have been prepared for use in the February 12, 2013 conference call on Omnicom’s results of operations for the period ended December 31, 2012. The call will be archived on the Internet at http://www.omnicomgroup.com/financialwebcasts.
Forward-Looking Statements
Certain of the statements in this presentation constitute forward-looking statements within the meaning of the Private Securities Litigation Reform Act of 1995. In addition, from time to time, we or our representatives have made or may make forward-looking statements, orally or in writing. These statements relate to future events or future financial performance and involve known and unknown risks and other factors that may cause our actual or our industry’s results, levels of activity or achievement to be materially different from those expressed or implied by any forward-looking statements. These risks and uncertainties, including those that are described in our 2011 Annual Report of Form 10-K under Item 1A - Risk Factors and Item 7 -Management’s Discussion and Analysis of Financial Condition and Results of Operations, include, but are not limited to, our future financial position and results of operations, global economic conditions, conditions in the credit markets, losses on media purchases and production costs incurred on behalf of clients, reductions in client spending and/or a slowdown in client payments, competitive factors, changes in client communication requirements, managing conflicts of interest, the hiring and retention of personnel, maintaining a highly skilled workforce, our ability to attract new clients and retain existing clients, reliance on information technology systems, changes in government regulations impacting our advertising and marketing strategies, risks associated with assumptions we make in connection with our critical accounting estimates and legal proceedings, and our international operations, which are subject to the risks of currency fluctuations and foreign exchange controls. In some cases, forward-looking statements can be identified by terminology such as “may,” “will,” “could,” “would,” “should,” “expect,” “plan,” “anticipate,” “intend,” “believe,” “estimate,” “predict,” “potential” or “continue” or the negative of those terms or other comparable terminology. These statements are our present expectations. Actual events or results may differ. We undertake no obligation to update or revise any forward-looking statement, except as required by law.
Non-GAAP Financial Measures
We present financial measures determined in accordance with generally accepted accounting principles in the United States (“GAAP”) and adjustments to the GAAP presentation (“Non-GAAP”), which we believe are meaningful for understanding our performance. Non-GAAP financial measures should not be considered in isolation from, or as a substitute for, financial information presented in compliance with GAAP. Non-GAAP financial measures as reported by us may not be comparable to similarly titled amounts reported by other companies. We provide a reconciliation of non-GAAP measures to the comparable GAAP measures on pages 19 and 20.
The non-GAAP measures used in this presentation include the following:
Net Free Cash Flow, defined as Free Cash Flow (defined below) less the Primary Uses of Cash (defined below). Net Free Cash Flow is one of the metrics used by us to assess our sources and uses of cash and was derived from our consolidated statements of cash flows. We believe that this presentation is meaningful for understanding our primary sources and primary uses of that cash flow. Free Cash Flow, defined as net income plus depreciation, amortization, share based compensation expense and gain on re-measurement of equity interest in affiliates less other non-cash items to reconcile to net cash provided by operating activities. Primary Uses of Cash, defined as dividends to common shareholders, dividends paid to non-controlling interest shareholders, capital expenditures, cash paid on acquisitions, payments for additional interest in controlled subsidiaries and stock repurchases, net of the proceeds and excess tax benefit from our stock plans, and excludes changes in working capital and other investing and financing activities, including commercial paper issuances and redemptions used to fund working capital changes.
EBITDA, defined as operating income before interest, taxes, depreciation and amortization. We believe EBITDA is meaningful because the financial covenants in our credit facilities are based on EBITDA.
EBITA, defined as operating income before interest, taxes and amortization. We use EBITA as an additional operating performance measure, which excludes acquisition-related amortization expense, because we believe that EBITA is a useful measure to evaluate the performance of our businesses.
Net Debt, defined as total debt less cash, cash equivalents and short-term investments. We believe net debt, together with the comparable GAAP measures, reflects one of the metrics used by us to assess our cash management.
After Tax Operating Income, defined as operating income less income taxes calculated using the effective tax rate for the applicable period.
Other Information
All dollar amounts are in millions except for per share amounts and figures shown on page 3. The information contained in this document has not been audited, although some data has been derived from Omnicom’s historical financial statements, including its audited financial statements. In addition, industry, operational and other non-financial data contained in this document have been derived from sources that we believe to be reliable, but we have not independently verified such information, and we do not, nor does any other person, assume responsibility for the accuracy or completeness of that information. Certain amounts in prior periods have been reclassified to conform to our current presentation.
The inclusion of information in this presentation does not mean that such information is material or that disclosure of such information is required.
February 12, 2013 26