Exhibit 99.2

First Quarter 2019 Results
April 16, 2019
Investor Presentation
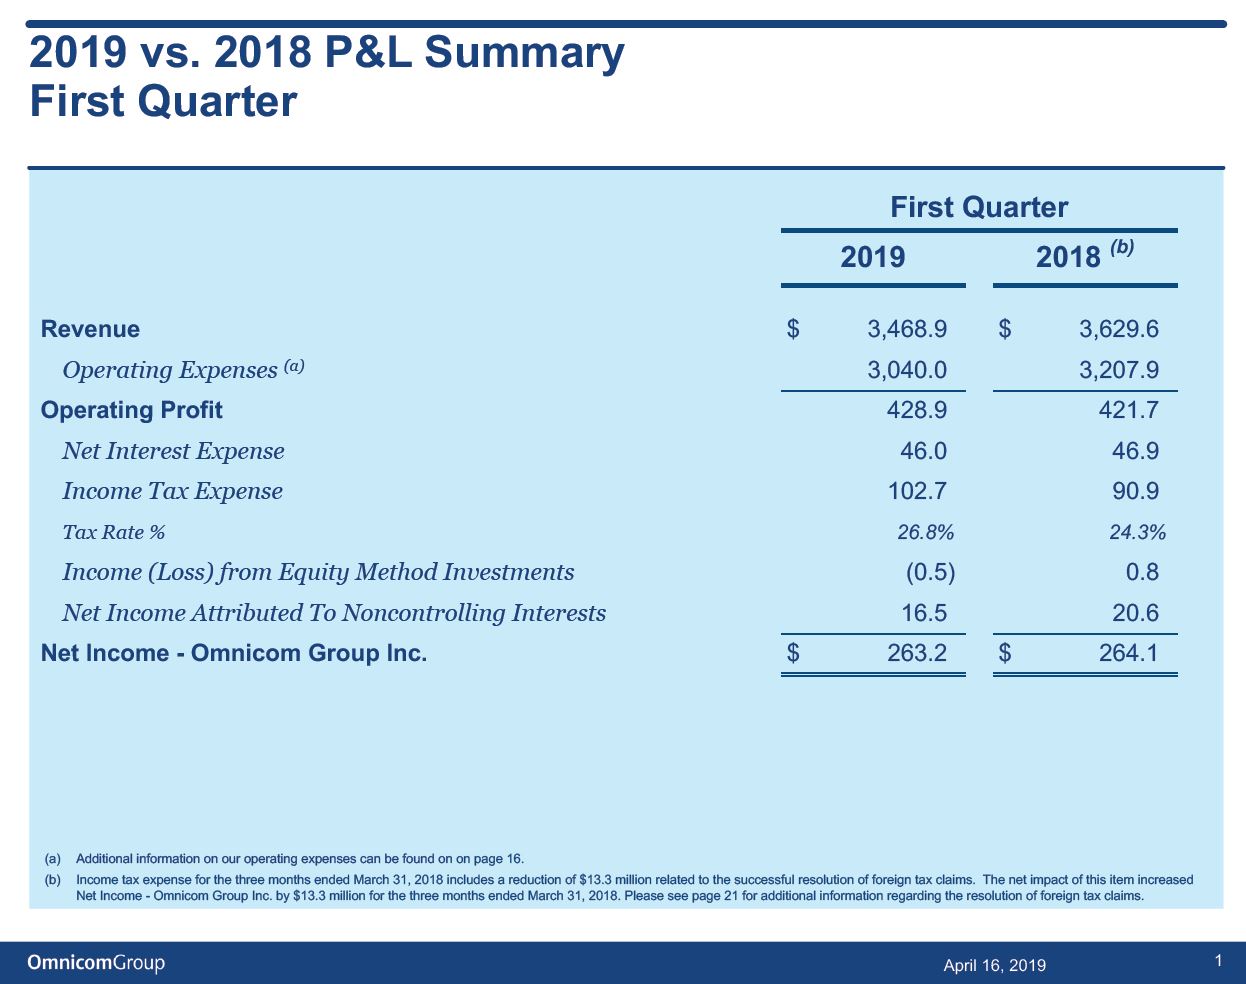
2019 vs. 2018 P&L Summary First Quarter
First Quarter
2019 2018(b)
Revenue$ 3,468.9 $ 3,629.6
Operating Expenses(a)3,040.0 3,207.9
Operating Profit428.9 421.7
Net Interest Expense46.0 46.9Income Tax Expense102.7 90.9
Tax Rate % 26.8% 24.3%
Income (Loss) from Equity Method Investments(0.5) 0.8Net Income Attributed To Noncontrolling Interests16.5 20.6
Net Income - Omnicom Group Inc.$ 263.2 $ 264.1
(a) Additional information on our operating expenses can be found on on page 16.
(b) Income tax expense for the three months ended March 31, 2018 includes a reduction of $13.3 million related to the successful resolution of foreign tax claims. The net impact of this item increased Net Income - Omnicom Group Inc. by $13.3 million for the three months ended March 31, 2018. Please see page 21 for additional information regarding the resolution of foreign tax claims.
April 16, 2019 1
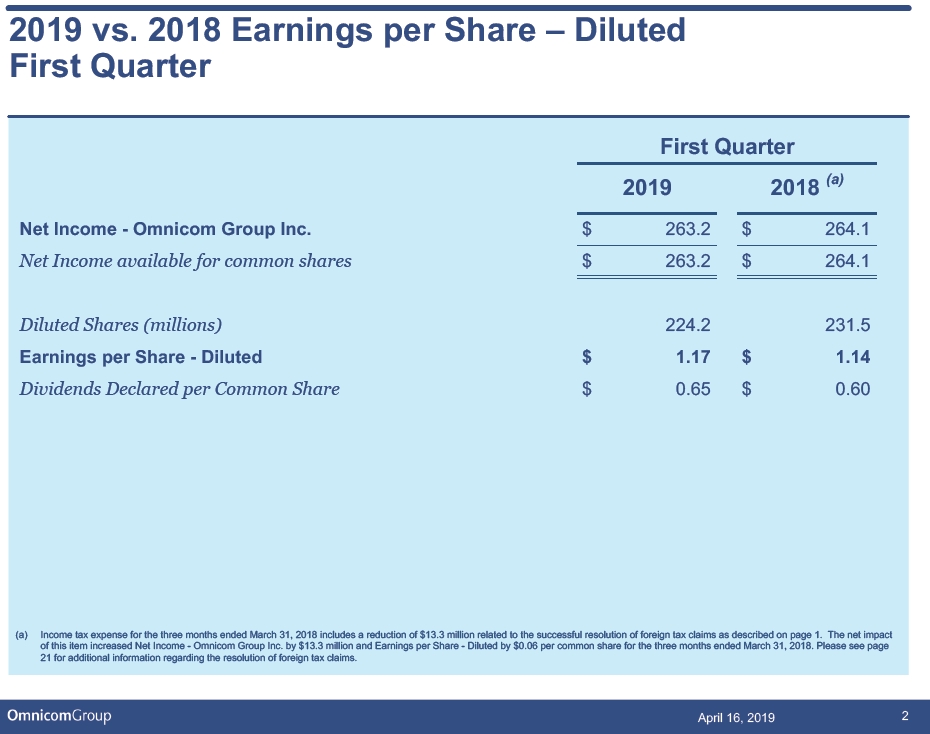
2019 vs. 2018 Earnings per Share – Diluted First Quarter
First Quarter
2019 2018(a)
Net Income - Omnicom Group Inc.$ 263.2 $ 264.1
Net Income available for common shares$ 263.2 $ 264.1
Diluted Shares (millions)224.2 231.5
Earnings per Share - Diluted $ 1.17 $ 1.14
Dividends Declared per Common Share$ 0.65 $ 0.60
(a) Income tax expense for the three months ended March 31, 2018 includes a reduction of $13.3 million related to the successful resolution of foreign tax claims as described on page 1. The net impact of this item increased Net Income - Omnicom Group Inc. by $13.3 million and Earnings per Share - Diluted by $0.06 per common share for the three months ended March 31, 2018. Please see page 21 for additional information regarding the resolution of foreign tax claims.
April 16, 2019 2
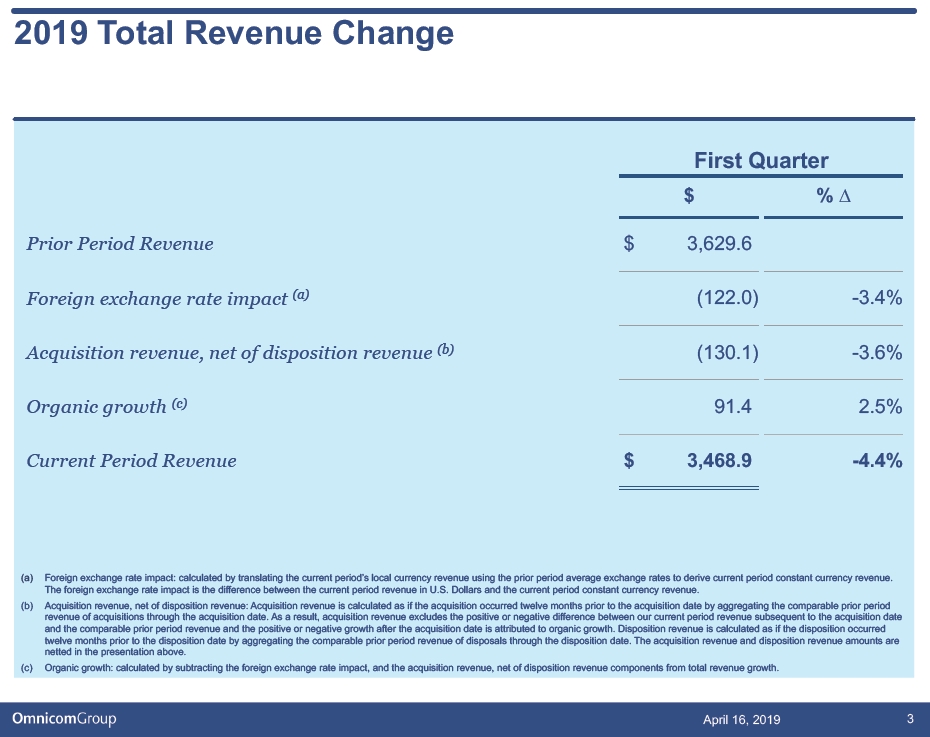
2019 Total Revenue Change
First Quarter
$ %
Prior Period Revenue$ 3,629.6
Foreign exchange rate impact(a)(122.0) -3.4%Acquisition revenue, net of disposition revenue(b)(130.1) -3.6%Organic growth(c)91.4 2.5%Current Period Revenue$ 3,468.9 -4.4%
(a) Foreign exchange rate impact: calculated by translating the current period’s local currency revenue using the prior period average exchange rates to derive current period constant currency revenue. The foreign exchange rate impact is the difference between the current period revenue in U.S. Dollars and the current period constant currency revenue.
(b) Acquisition revenue, net of disposition revenue: Acquisition revenue is calculated as if the acquisition occurred twelve months prior to the acquisition date by aggregating the comparable prior period revenue of acquisitions through the acquisition date. As a result, acquisition revenue excludes the positive or negative difference between our current period revenue subsequent to the acquisition date and the comparable prior period revenue and the positive or negative growth after the acquisition date is attributed to organic growth. Disposition revenue is calculated as if the disposition occurred twelve months prior to the disposition date by aggregating the comparable prior period revenue of disposals through the disposition date. The acquisition revenue and disposition revenue amounts are netted in the presentation above.
(c) Organic growth: calculated by subtracting the foreign exchange rate impact, and the acquisition revenue, net of disposition revenue components from total revenue growth.
April 16, 2019 3
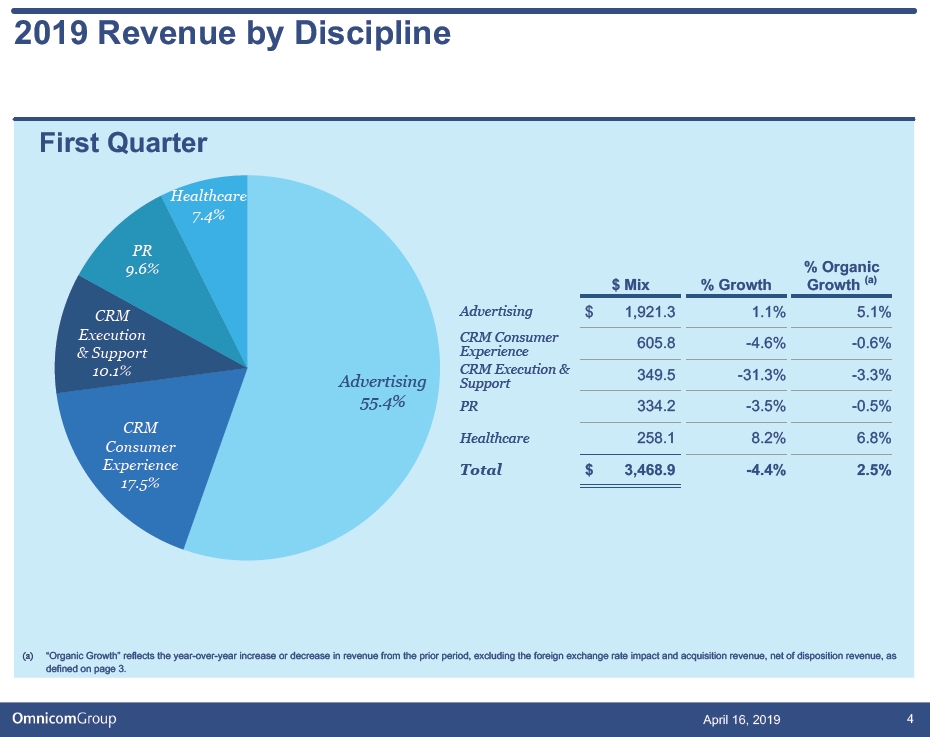
2019 Revenue by Discipline
First Quarter
Healthcare 7.4%
PR
9.6%% Organic $ Mix % Growth Growth(a)
CRM Advertising$ 1,921.3 1.1% 5.1%
Execution CRM Consumer
605.8 -4.6% -0.6%
& Support Experience 10.1% CRM Execution &
349.5 -31.3% -3.3%
Advertising Support
55.4% PR334.2 -3.5% -0.5%
CRM
Healthcare258.1 8.2% 6.8%
Consumer
ExperienceTotal$ 3,468.9 -4.4% 2.5%
17.5%
(a) “Organic Growth” reflects the year-over-year increase or decrease in revenue from the prior period, excluding the foreign exchange rate impact and acquisition revenue, net of disposition revenue, as defined on page 3.
April 16, 2019 4
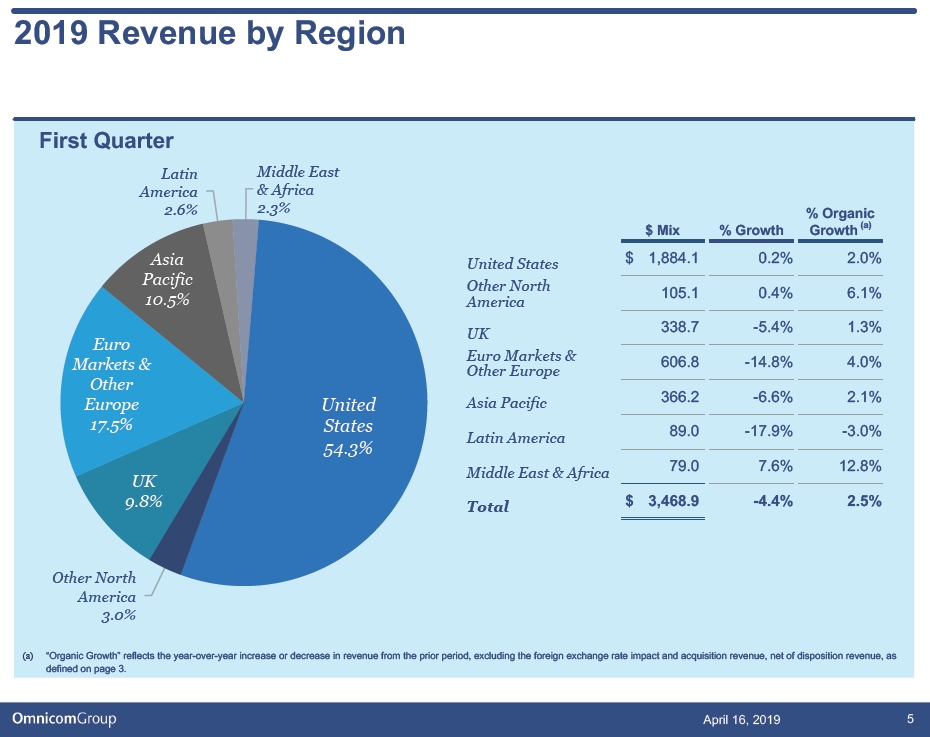
2019 Revenue by Region
First Quarter
Latin Middle East America & Africa 2.6% 2.3%
% Organic $ Mix % Growth Growth(a)
Asia$ 1,884.1 0.2% 2.0%
United States Pacific Other North
105.1 0.4% 6.1%
10.5% America
338.7 -5.4% 1.3%
UK Euro
Euro Markets &
Markets &606.8 -14.8% 4.0%
Other Europe Other
366.2 -6.6% 2.1%
Europe United Asia Pacific
17.5% States
89.0 -17.9% -3.0%
Latin America
54.3%
79.0 7.6% 12.8%
Middle East & Africa UK
9.8%$ 3,468.9 -4.4% 2.5%
Total
Other North America 3.0%
(a) “Organic Growth” reflects the year-over-year increase or decrease in revenue from the prior period, excluding the foreign exchange rate impact and acquisition revenue, net of disposition revenue, as defined on page 3.
April 16, 2019 5

Revenue by Industry
First Quarter – 2019 First Quarter – 2018
Auto Auto T&E T&E
11% 10%
7% 7% Telcom Telcom
5% 5% Consumer Consumer Products Products 9% Tech 9%
7% Tech 9%
Financial Financial Services Retail Services 8%
5% 8%
Retail 6%
Food & Pharma & Food & Beverage Health Beverage Pharma & 13% 14% 13% Health 12%
Other Other 21% 21%
April 16, 2019 6
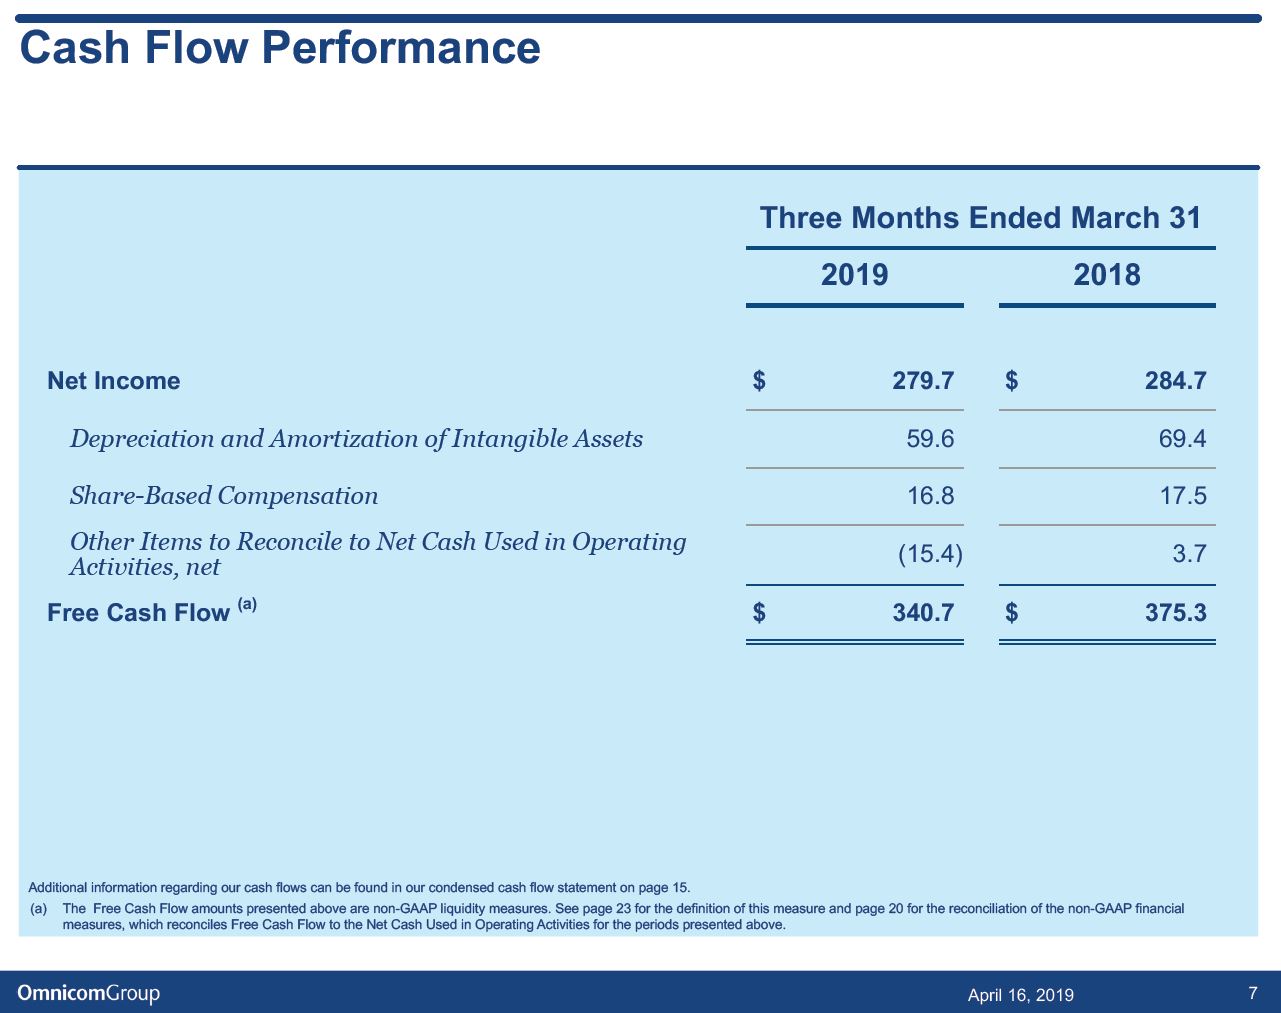
Cash Flow Performance
Three Months Ended March 31
2019 2018
Net Income $ 279.7 $ 284.7
Depreciation and Amortization of Intangible Assets59.6 69.4
Share-Based Compensation16.8 17.5
Other Items to Reconcile to Net Cash Used in Provided by Operating
(15.4) 3.7
Activities, net
Free Cash Flow(a)$ 340.7 $ 375.3
Additional information regarding our cash flows can be found in our condensed cash flow statement on page 15.
(a) The Free Cash Flow amounts presented above are non-GAAP liquidity measures. See page 23 for the definition of this measure and page 20 for the reconciliation of the non-GAAP financial measures, which reconciles Free Cash Flow to the Net Cash Used in Operating Activities for the periods presented above.
April 16, 2019 7
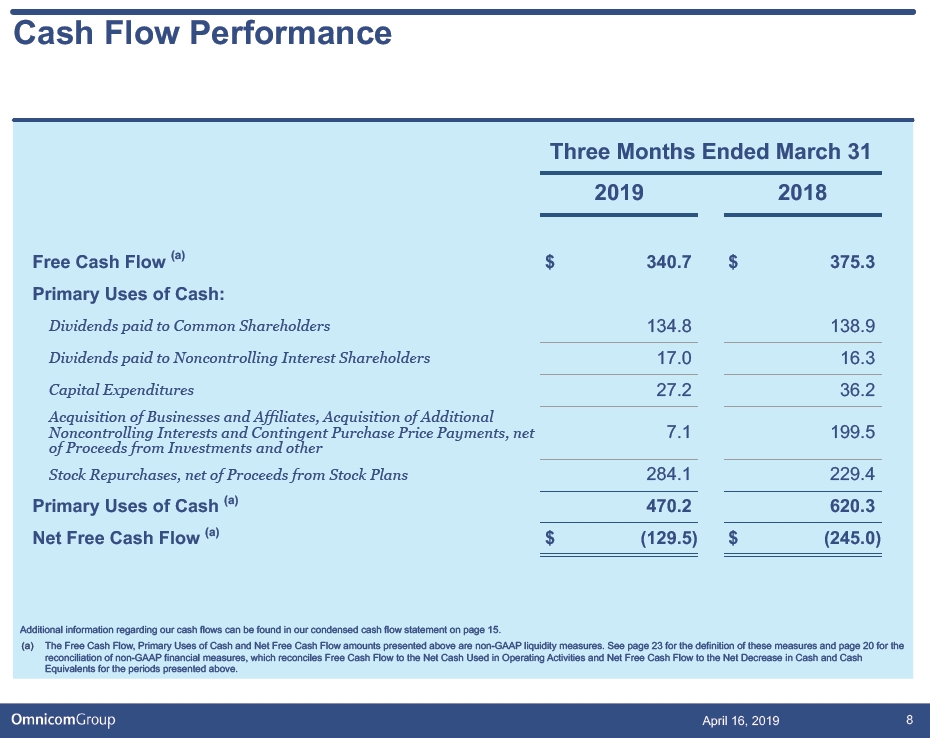
Cash Flow Performance
Three Months Ended March 31
2019 2018
Free Cash Flow(a)$ 340.7 $ 375.3
Primary Uses of Cash:
Dividends paid to Common Shareholders134.8 138.9
Dividends paid to Noncontrolling Interest Shareholders17.0 16.3
Capital Expenditures27.2 36.2Acquisition of Businesses and Affiliates, Acquisition of Additional Noncontrolling Interests and Contingent Purchase Price Payments, net7.1 199.5of Proceeds from Investments and other
Stock Repurchases, net of Proceeds from Stock Plans284.1 229.4
Primary Uses of Cash(a)470.2 620.3
Net Free Cash Flow(a)$ (129.5) $ (245.0)
Additional information regarding our cash flows can be found in our condensed cash flow statement on page 15.
(a) The Free Cash Flow, Primary Uses of Cash and Net Free Cash Flow amounts presented above are non-GAAP liquidity measures. See page 23 for the definition of these measures and page 20 for the reconciliation of non-GAAP financial measures, which reconciles Free Cash Flow to the Net Cash Used in Operating Activities and Net Free Cash Flow to the Net Decrease in Cash and Cash Equivalents for the periods presented above.
April 16, 2019 8
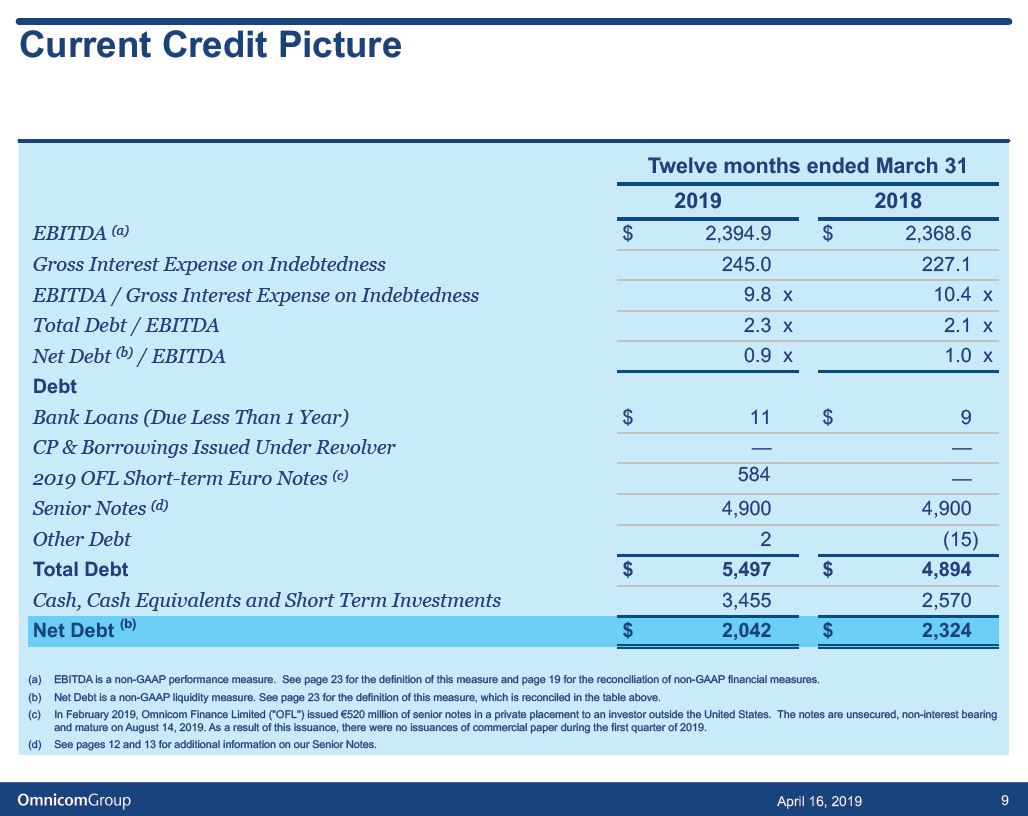
Current Credit Picture
Twelve months ended March 31
2019 2018
EBITDA(a)$ 2,394.9 $ 2,368.6
Gross Interest Expense on Indebtedness245.0 227.1EBITDA / Gross Interest Expense on Indebtedness9.8 x 10.4 xTotal Debt / EBITDA2.3 x 2.1 xNet Debt(b)/ EBITDA0.9 x 1.0 x
Debt
Bank Loans (Due Less Than 1 Year)$ 11 $ 9CP & Borrowings Issued Under Revolver— —2019 OFL Short-term Euro Notes(c)584 —Senior Notes(d)4,900 4,900Other Debt2 (15)
Total Debt $ 5,497 $ 4,894
Cash, Cash Equivalents and Short Term Investments3,455 2,570
Net Debt(b)$ 2,042 $ 2,324
(a) EBITDA is a non-GAAP performance measure. See page 23 for the definition of this measure and page 19 for the reconciliation of non-GAAP financial measures. (b) Net Debt is a non-GAAP liquidity measure. See page 23 for the definition of this measure, which is reconciled in the table above.
(c) In February 2019, Omnicom Finance Limited ("OFL") issued €520 million of senior notes in a private placement to an investor outside the United States. The notes are unsecured, non-interest bearing and mature on August 14, 2019. As a result of this issuance, there were no issuances of commercial paper during the first quarter of 2019.
(d) See pages 12 and 13 for additional information on our Senior Notes.
April 16, 2019 9
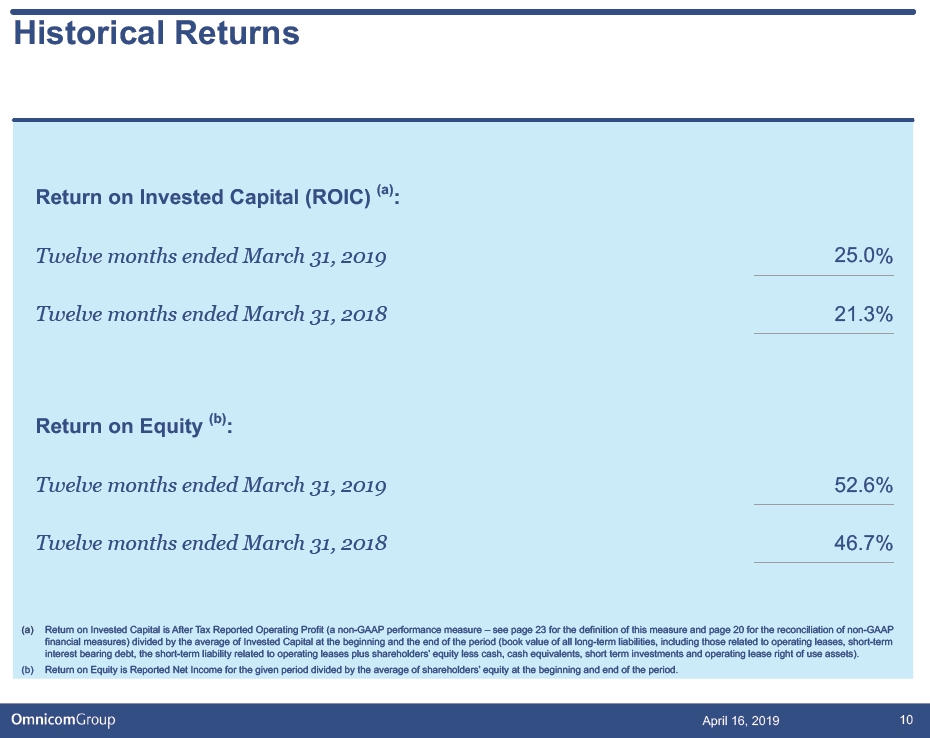
Historical Returns
Return on Invested Capital (ROIC)(a):
Twelve months ended March 31, 201925.0%
Twelve months ended March 31, 201821.3%
Return on Equity(b):
Twelve months ended March 31, 201952.6%
Twelve months ended March 31, 201846.7%
(a) Return on Invested Capital is After Tax Reported Operating Profit (a non-GAAP performance measure – see page 23 for the definition of this measure and page 20 for the reconciliation of non-GAAP financial measures) divided by the average of Invested Capital at the beginning and the end of the period (book value of all long-term liabilities, including those related to operating leases, short-term interest bearing debt, the short-term liability related to operating leases plus shareholders’ equity less cash, cash equivalents, short term investments and operating lease right of use assets).
(b) Return on Equity is Reported Net Income for the given period divided by the average of shareholders’ equity at the beginning and end of the period.
April 16, 2019 10

Supplemental Financial Information
April 16, 2019 11

Omnicom Debt Structure
Short-term Debt $11
2019 OFL Short-term Euro Notes
2026 Senior $584 2019 Senior Notes Notes $1,400 $500
2020 Senior Notes
2024 Senior $1,000 Notes $750
2022 Senior Notes $1,250
The above chart sets forth Omnicom’s debt outstanding at March 31, 2019. The amounts reflected above for the 2019, 2020, 2022, 2024 and 2026 Senior Notes and the 2019 OFL Short-term Euro Notes represent the principal amount of these notes at maturity on July 15, 2019, August 15, 2020, May 1, 2022, November 1, 2024, April 15, 2026 and August 14 2019, respectively.
April 16, 2019 12
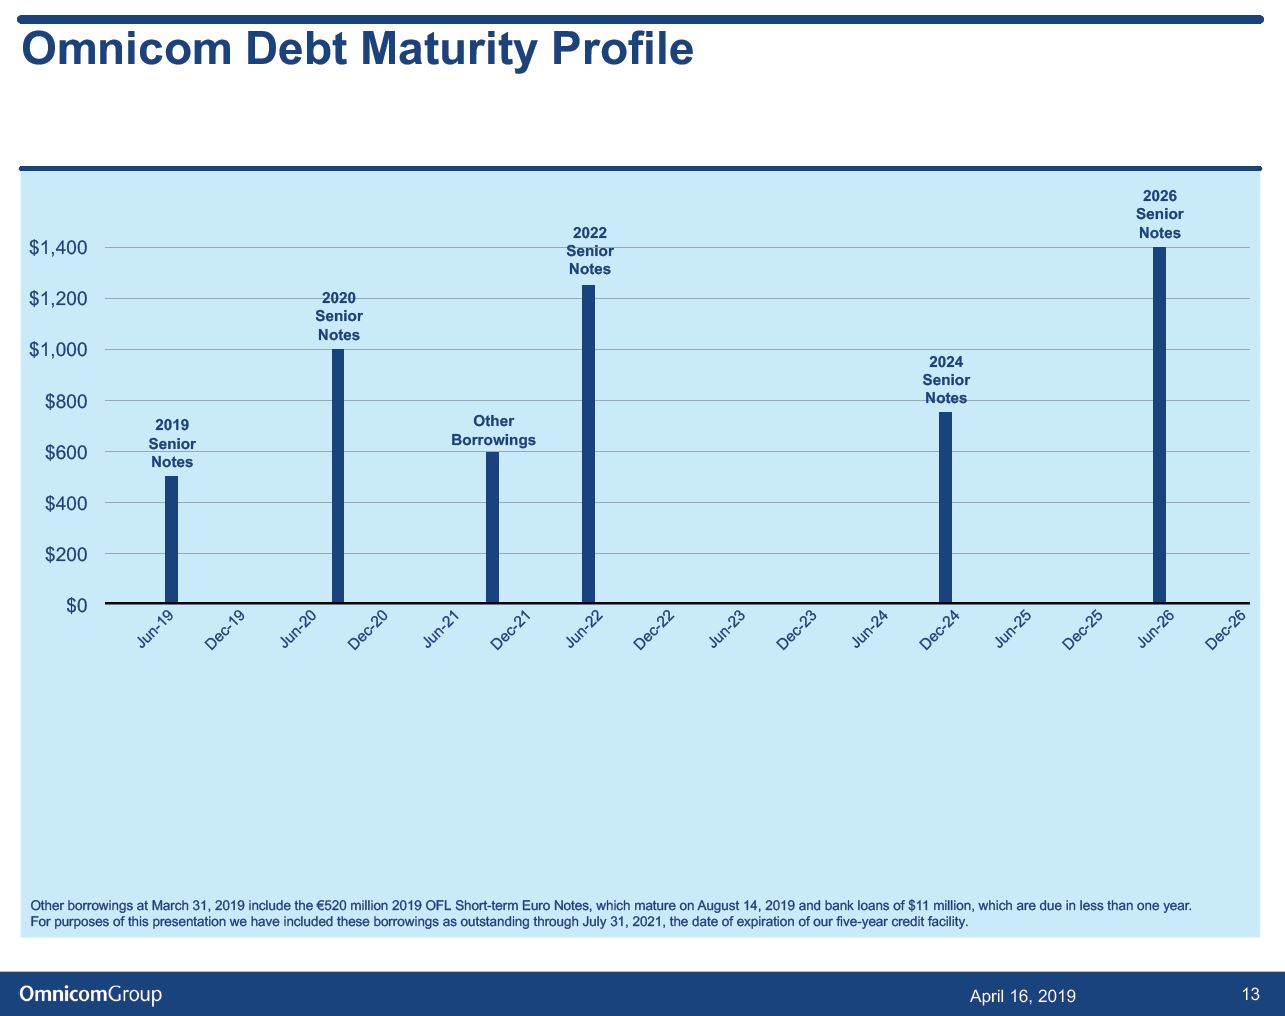
Omnicom Debt Maturity Profile
2026 Senior 2022 Notes
$1,400Senior
Notes
$1,2002020
Senior Notes
$1,000
2024 Senior$800Notes 2019 Other Senior Borrowings
$600
Notes
$400
$200
$0
19 19 20 20 21 21 22-22 23 23 24-24-25-25-26-26 ----------Jun Dec Jun Dec Jun Dec Jun Dec Jun Dec Jun Dec Jun Dec Jun Dec
Other borrowings at March 31, 2019 include the €520 million 2019 OFL Short-term Euro Notes, which mature on August 14, 2019 and bank loans of $11 million, which are due in less than one year. For purposes of this presentation we have included these borrowings as outstanding through July 31, 2021, the date of expiration of our five-year credit facility.
April 16, 2019 13
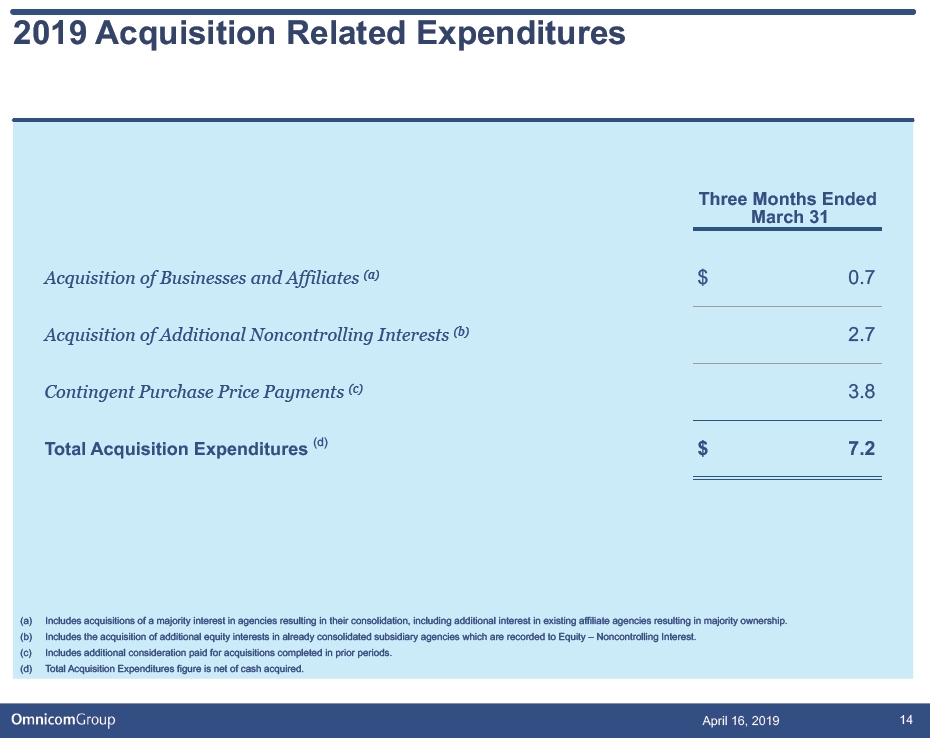
2019 Acquisition Related Expenditures
Three Months Ended March 31
Acquisition of Businesses and Affiliates(a)$ 0.7Acquisition of Additional Noncontrolling Interests(b)2.7Contingent Purchase Price Payments(c)3.8
Total Acquisition Expenditures(d)$ 7.2
(a) Includes acquisitions of a majority interest in agencies resulting in their consolidation, including additional interest in existing affiliate agencies resulting in majority ownership. (b) Includes the acquisition of additional equity interests in already consolidated subsidiary agencies which are recorded to Equity – Noncontrolling Interest.
(c) Includes additional consideration paid for acquisitions completed in prior periods. (d) Total Acquisition Expenditures figure is net of cash acquired.
April 16, 2019 14
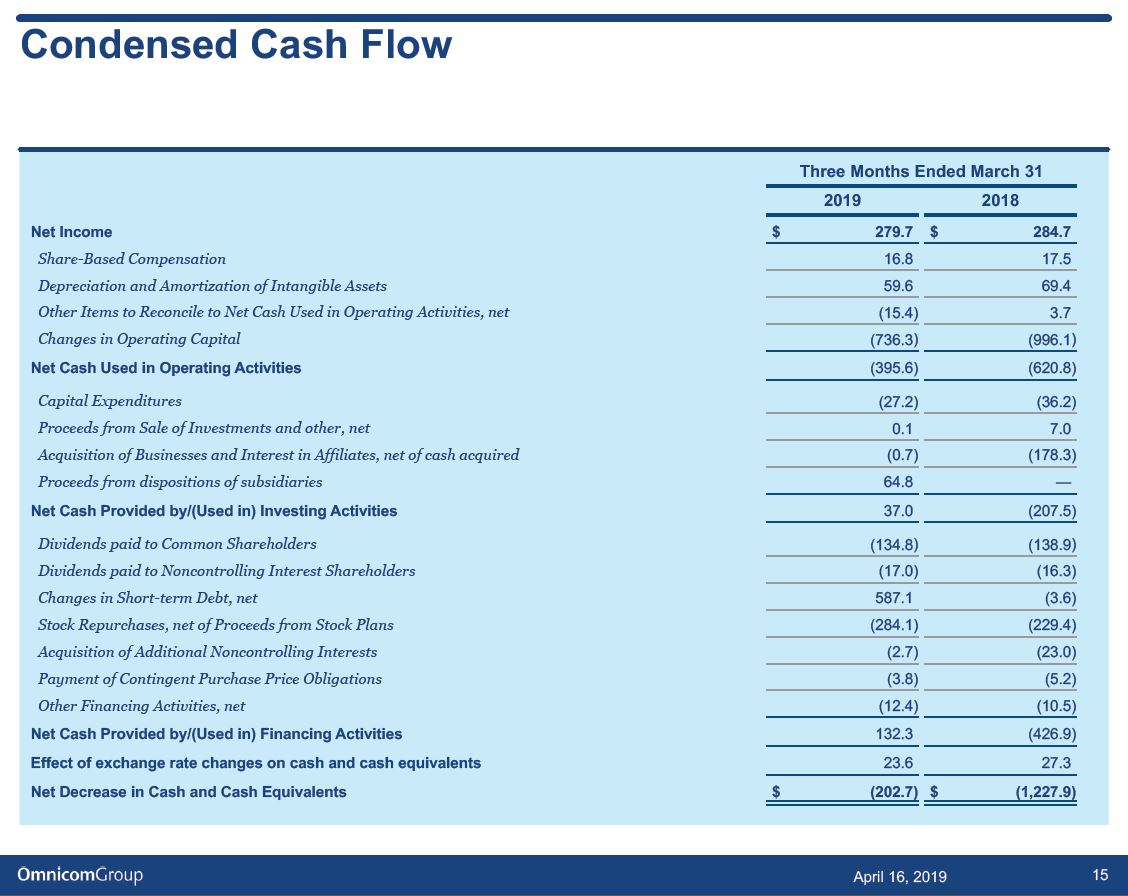
Condensed Cash Flow
Three Months Ended March 31 2019 2018 Net Income $ 279.7 $ 284.7
Share-Based Compensation16.8 17.5Depreciation and Amortization of Intangible Assets59.6 69.4Other Items to Reconcile to Net Cash Used in Operating Activities, net(15.4) 3.7Changes in Operating Capital(736.3) (996.1)
Net Cash Used in Operating Activities(395.6) (620.8)
Capital Expenditures(27.2) (36.2)Proceeds from Sale of Investments and other, net0.1 7.0Acquisition of Businesses and Interest in Affiliates, net of cash acquired(0.7) (178.3)Proceeds from dispositions of subsidiaries64.8 —
Net Cash Provided by/(Used in) Investing Activities37.0 (207.5)
Dividends paid to Common Shareholders(134.8) (138.9)Dividends paid to Noncontrolling Interest Shareholders(17.0) (16.3)Changes in Short-term Debt, net587.1 (3.6)Stock Repurchases, net of Proceeds from Stock Plans(284.1) (229.4)Acquisition of Additional Noncontrolling Interests(2.7) (23.0)Payment of Contingent Purchase Price Obligations(3.8) (5.2)Other Financing Activities, net(12.4) (10.5)
Net Cash Provided by/(Used in) Financing Activities132.3 (426.9)Effect of exchange rate changes on cash and cash equivalents23.6 27.3Net Decrease in Cash and Cash Equivalents $ (202.7) $ (1,227.9)
April 16, 2019 15
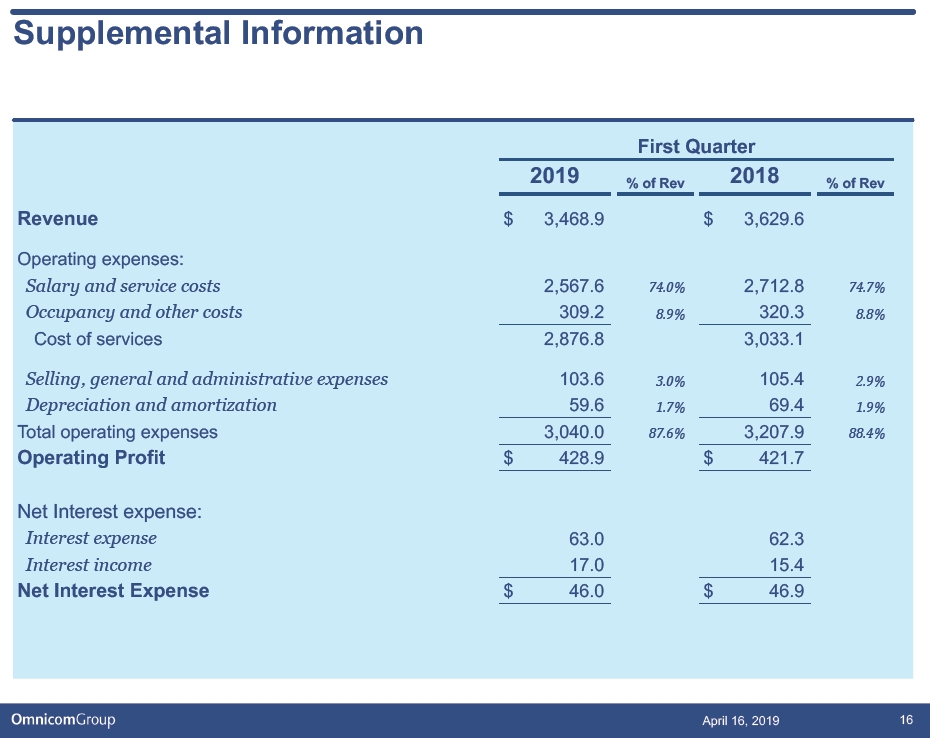
Supplemental Information
First Quarter
2019 2018
% of Rev % of Rev
Revenue$ 3,468.9 $ 3,629.6
Operating expenses:
Salary and service costs2,567.674.0%2,712.874.7% Occupancy and other costs309.28.9%320.38.8%
Cost of services 2,876.8 3,033.1
Selling, general and administrative expenses103.63.0%105.42.9% Depreciation and amortization59.61.7%69.41.9%
Total operating expenses 3,040.087.6%3,207.988.4%
Operating Profit$ 428.9 $ 421.7
Net Interest expense:
Interest expense63.0 62.3Interest income17.0 15.4
Net Interest Expense$ 46.0 $ 46.9
April 16, 2019 16
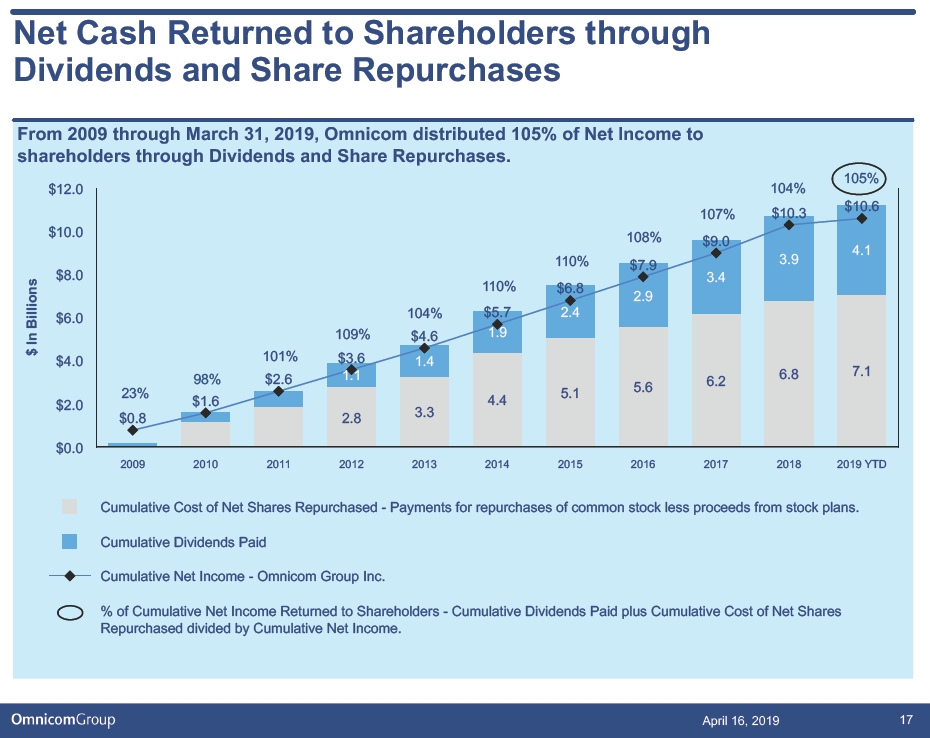
Net Cash Returned to Shareholders through Dividends and Share Repurchases
From 2009 through March 31, 2019, Omnicom distributed 105% of Net Income to shareholders through Dividends and Share Repurchases.
105% $12.0 104% $10.6 107% $10.3 $10.0 108% $9.0 4.1 110% 3.9 $7.9 $8.0 3.4
Billions110% $6.8
2.9 104% $5.7 2.4 $6.0 109% $4.6 1.9
In
$101% $4.0 $3.6 1.4
1.1 6.8 7.1 98% $2.6 6.2 5.6 23% 5.1 $2.0 $1.6 4.4 3.3 $0.8 2.8
$0.0
2009 2010 2011 2012 2013 2014 2015 2016 2017 2018 2019 YTD
Cumulative Cost of Net Shares Repurchased - Payments for repurchases of common stock less proceeds from stock plans. Cumulative Dividends Paid Cumulative Net Income - Omnicom Group Inc.
% of Cumulative Net Income Returned to Shareholders - Cumulative Dividends Paid plus Cumulative Cost of Net Shares Repurchased divided by Cumulative Net Income.
April 16, 2019 17
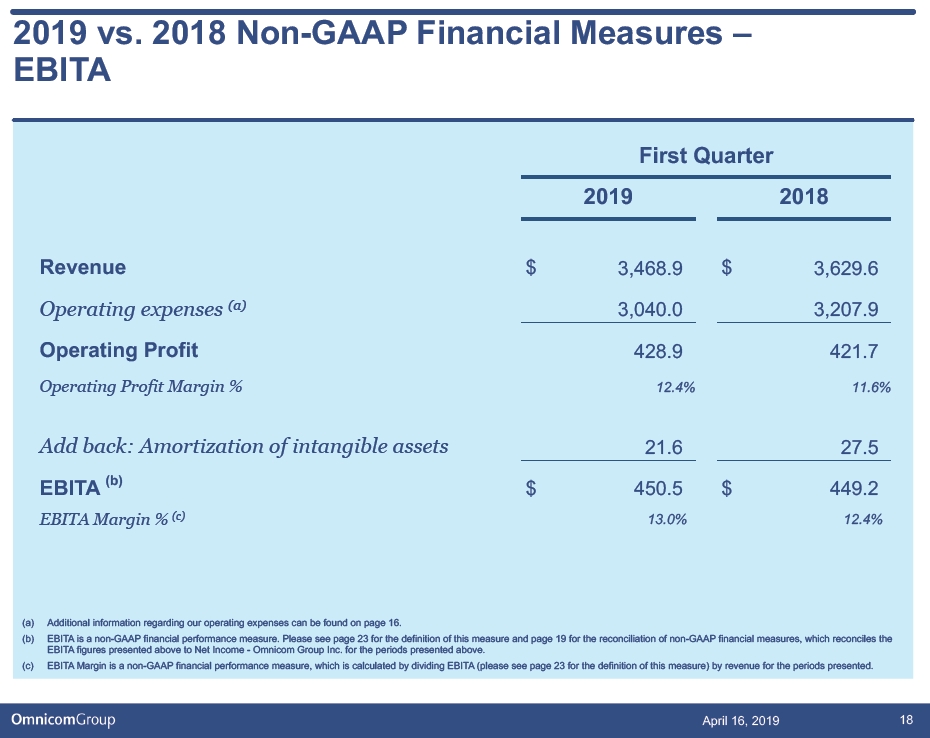
2019 vs. 2018 Non-GAAP Financial Measures –EBITA
First Quarter
2019 2018
Revenue$ 3,468.9 $ 3,629.6
Operating expenses(a)3,040.0 3,207.9
Operating Profit428.9 421.7
Operating Profit Margin % 12.4% 11.6%
Add back: Amortization of intangible assets21.6 27.5
EBITA(b)$ 450.5 $ 449.2
EBITA Margin %(c)13.0% 12.4%
(a) Additional information regarding our operating expenses can be found on page 16.
(b) EBITA is a non-GAAP financial performance measure. Please see page 23 for the definition of this measure and page 19 for the reconciliation of non-GAAP financial measures, which reconciles the EBITA figures presented above to Net Income - Omnicom Group Inc. for the periods presented above.
(c) EBITA Margin is a non-GAAP financial performance measure, which is calculated by dividing EBITA (please see page 23 for the definition of this measure) by revenue for the periods presented.
April 16, 2019 18
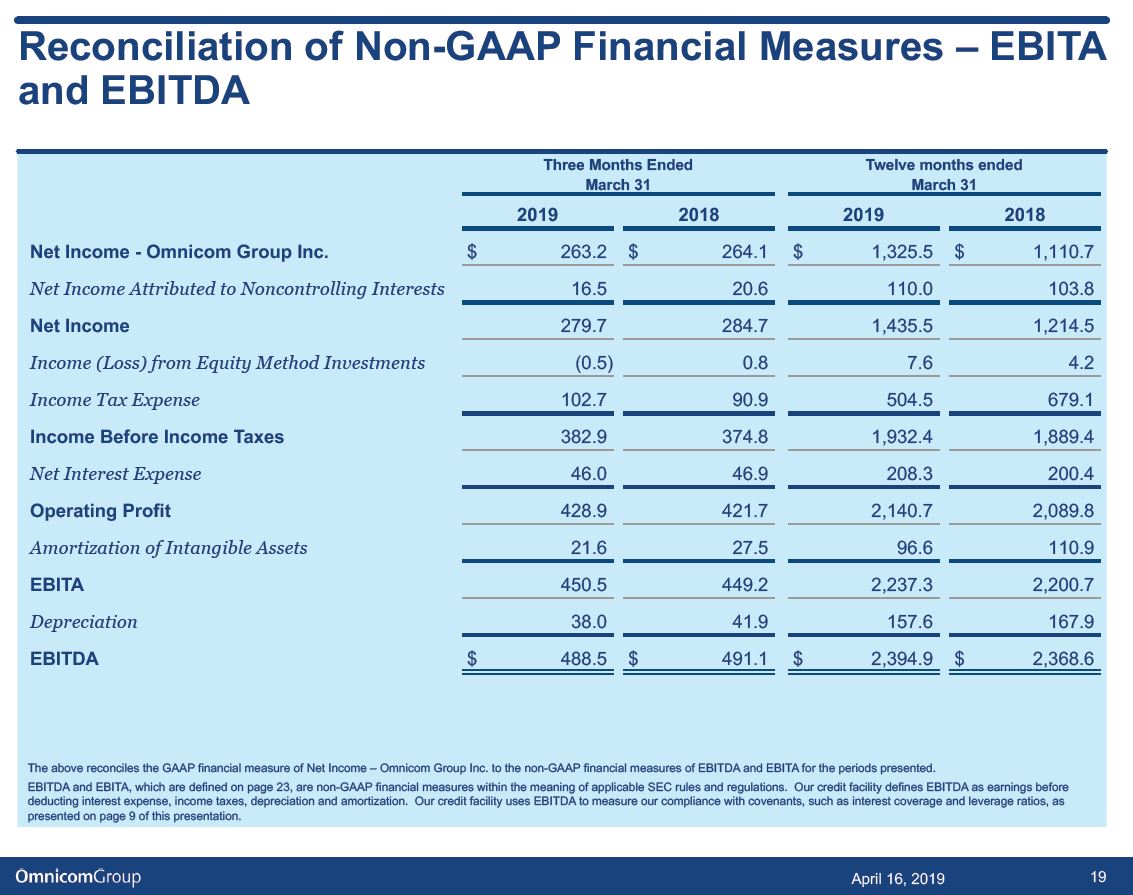
Reconciliation of Non-GAAP Financial Measures – EBITA and EBITDA
Three Months Ended Twelve months ended March 31 March 31
2019 2018 2019 2018
Net Income - Omnicom Group Inc.$ 263.2 $ 264.1 $ 1,325.5 $ 1,110.7
Net Income Attributed to Noncontrolling Interests16.5 20.6 110.0 103.8
Net Income279.7 284.7 1,435.5 1,214.5
Income (Loss) from Equity Method Investments(0.5) 0.8 7.6 4.2
Income Tax Expense102.7 90.9 504.5 679.1
Income Before Income Taxes382.9 374.8 1,932.4 1,889.4
Net Interest Expense46.0 46.9 208.3 200.4
Operating Profit428.9 421.7 2,140.7 2,089.8
Amortization of Intangible Assets21.6 27.5 96.6 110.9
EBITA450.5 449.2 2,237.3 2,200.7Depreciation38.0 41.9 157.6 167.9EBITDA$ 488.5 $ 491.1 $ 2,394.9 $ 2,368.6
The above reconciles the GAAP financial measure of Net Income – Omnicom Group Inc. to the non-GAAP financial measures of EBITDA and EBITA for the periods presented.
EBITDA and EBITA, which are defined on page 23, are non-GAAP financial measures within the meaning of applicable SEC rules and regulations. Our credit facility defines EBITDA as earnings before deducting interest expense, income taxes, depreciation and amortization. Our credit facility uses EBITDA to measure our compliance with covenants, such as interest coverage and leverage ratios, as presented on page 9 of this presentation.
April 16, 2019 19
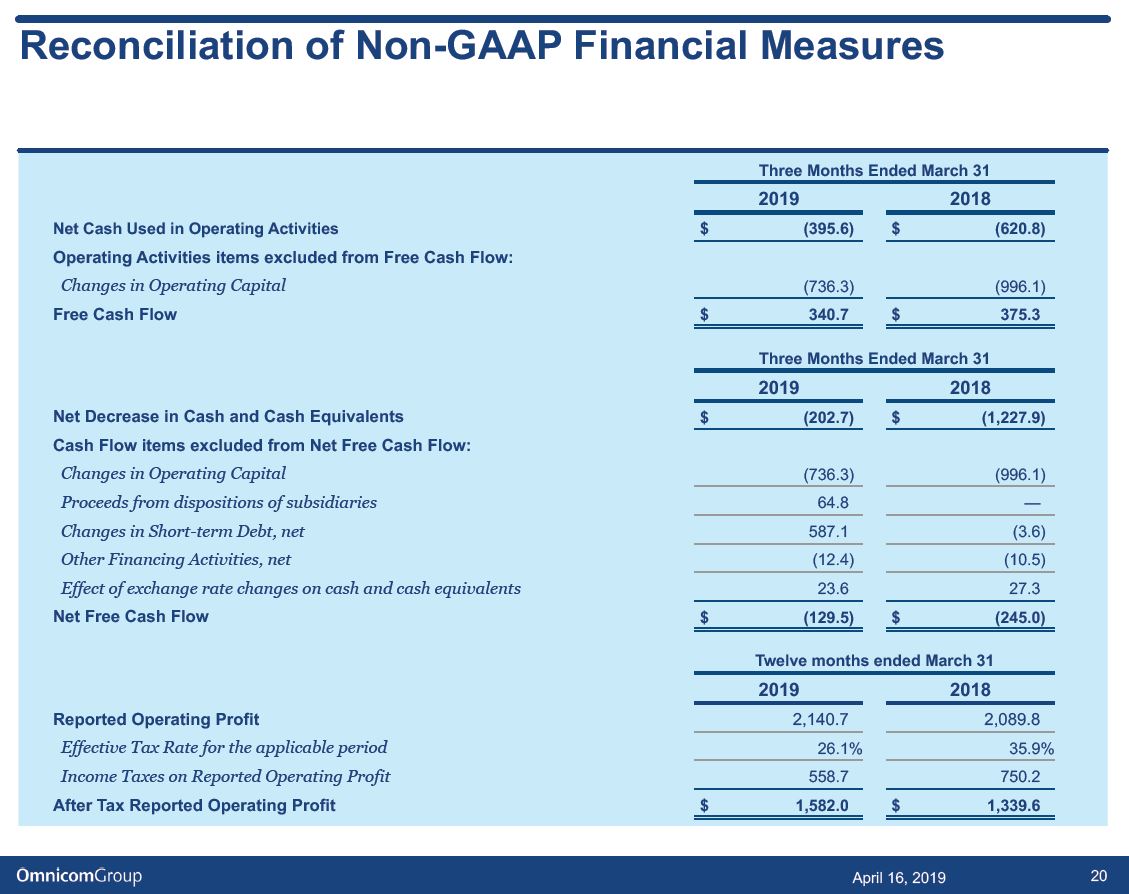
Reconciliation of Non-GAAP Financial Measures
Three Months Ended March 31 2019 2018 Net Cash Used in Operating Activities $ (395.6) $ (620.8) Operating Activities items excluded from Free Cash Flow:
Changes in Operating Capital(736.3) (996.1)
Free Cash Flow $ 340.7 $ 375.3
Three Months Ended March 31
2019 2018 Net Decrease in Cash and Cash Equivalents $ (202.7) $ (1,227.9)
Cash Flow items excluded from Net Free Cash Flow:
Changes in Operating Capital(736.3) (996.1)Proceeds from dispositions of subsidiaries64.8 —Changes in Short-term Debt, net587.1 (3.6)Other Financing Activities, net(12.4) (10.5)Effect of exchange rate changes on cash and cash equivalents23.6 27.3
Net Free Cash Flow $ (129.5) $ (245.0)
Twelve months ended March 31
2019 2018 Reported Operating Profit2,140.7 2,089.8
Effective Tax Rate for the applicable period26.1% 35.9%Income Taxes on Reported Operating Profit558.7 750.2
After Tax Reported Operating Profit $ 1,582.0 $ 1,339.6
April 16, 2019 20
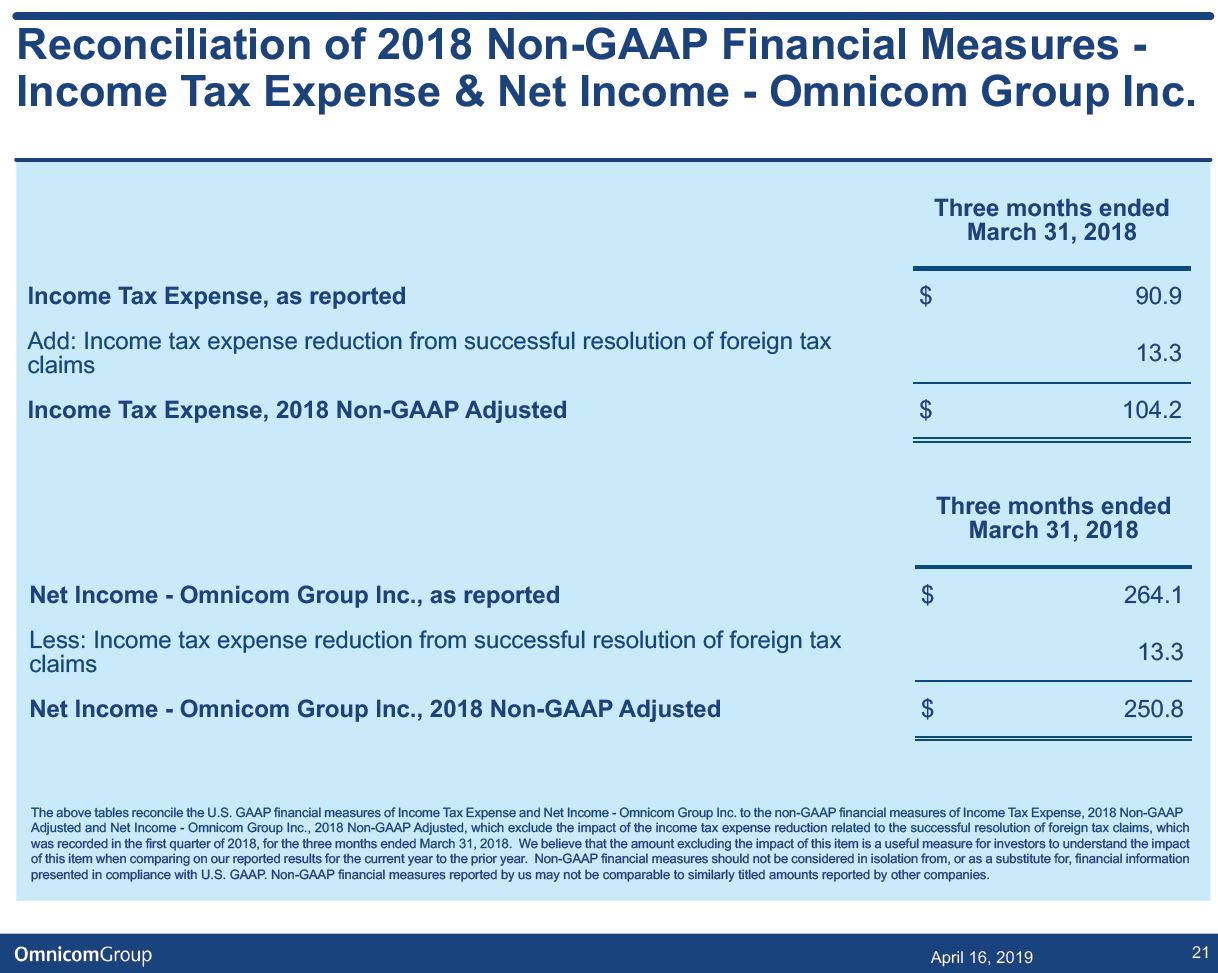
Reconciliation of 2018 Non-GAAP Financial Measures -Income Tax Expense & Net Income - Omnicom Group Inc.
Three months ended March 31, 2018
Income Tax Expense, as reported$ 90.9
Add: Income tax expense reduction from successful resolution of foreign tax
13.3 claims
Income Tax Expense, 2018 Non-GAAP Adjusted$ 104.2
Three months ended March 31, 2018
Net Income - Omnicom Group Inc., as reported$ 264.1
Less: Income tax expense reduction from successful resolution of foreign tax
13.3 claims
Net Income - Omnicom Group Inc., 2018 Non-GAAP Adjusted$ 250.8
The above table reconciles the U.S. GAAP financial measures of Income Tax Expense and Net Income - Omnicom Group Inc. to the non-GAAP financial measures of Income Tax Expense, 2018 Non-GAAP Adjusted and Net Income - Omnicom Group Inc., 2018 Non-GAAP Adjusted, which exclude the impact of the income tax expense reduction related to the successful resolution of foreign tax claims, which was recorded in the first quarter of 2018, for the three months ended March 31, 2018. We believe that the amount excluding the impact of this item is a useful measure for investors to understand the impact of this item when comparing on our reported results for the current year to the prior year. Non-GAAP financial measures should not be considered in isolation from, or as a substitute for, financial information presented in compliance with U.S. GAAP. Non-GAAP financial measures reported by us may not be comparable to similarly titled amounts reported by other companies.
April 16, 2019 21

First Quarter Acquisition
TBWA\Worldwide has acquired a majority interest in De Vloer, an independent creative agency located in Antwerp, Belgium.
Founded in 2013, De Vloer is a full-service creative agency offering a range of advertising and marketing services.
De Vloer will operate as a separate brand within the TBWA\Belgium group, along with TBWA\Brussels.
April 16, 2019 22
Disclosure
The preceding materials have been prepared for use in the April 16, 2019 conference call on Omnicom’s results of operations for the three months ended March 31, 2019. The call will be archived on the Internet athttp:// investor.omnicomgroup.com/investor-relations/news-events-and-filings/.
Forward-Looking Statements
Certain statements in this presentation constitute forward-looking statements, including statements within the meaning of the Private Securities Litigation Reform Act of 1995. In addition, from time to time, the Company or its representatives have made, or may make, forward-looking statements, orally or in writing. These statements may discuss goals, intentions and expectations as to future plans, trends, events, results of operations or financial condition, or otherwise, based on current beliefs of the Company’s management as well as assumptions made by, and information currently available to, the Company’s management. Forward-looking statements may be accompanied by words such as “aim,” “anticipate,” “believe,” “plan,” “could,” “should,” “would,” “estimate,” “expect,” “forecast,” “future,” “guidance,” “intend,” “may,” “will,” “possible,” “potential,” “predict,” “project” or similar words, phrases or expressions. These forward-looking statements are subject to various risks and uncertainties, many of which are outside the Company’s control. Therefore, you should not place undue reliance on such statements. Factors that could cause actual results to differ materially from those in the forward-looking statements include: international, national or local economic conditions that could adversely affect the Company or its clients; losses on media purchases and production costs incurred on behalf of clients; reductions in client spending, a slowdown in client payments and a deterioration in the credit markets; the ability to attract new clients and retain existing clients in the manner anticipated; changes in client advertising, marketing and corporate communications requirements; failure to manage potential conflicts of interest between or among clients; unanticipated changes relating to competitive factors in the advertising, marketing and corporate communications industries; ability to hire and retain key personnel; currency exchange rate fluctuations; reliance on information technology systems; changes in legislation or governmental regulations affecting the Company or its clients; risks associated with assumptions the Company makes in connection with its critical accounting estimates and legal proceedings; and the Company’s international operations, which are subject to the risks of currency repatriation restrictions, social or political conditions and regulatory environment. The foregoing list of factors is not exhaustive. You should carefully consider the foregoing factors and the other risks and uncertainties that may affect the Company’s business, including those described in the “Risk Factors” in Omnicom’s Annual Report on Form 10-K for the year ended December 31, 2018 and other documents filed from time to time with the Securities and Exchange Commission. Except as required under applicable law, the Company does not assume any obligation to update these forward-looking statements.
Non-GAAP Financial Measures
We present financial measures determined in accordance with generally accepted accounting principles in the United States (“GAAP”) and adjustments to the GAAP presentation (“Non-GAAP”), which we believe are meaningful for understanding our performance. Non-GAAP financial measures should not be considered in isolation from, or as a substitute for, financial information presented in compliance with GAAP. Non-GAAP financial measures as reported by us may not be comparable to similarly titled amounts reported by other companies. We provide a reconciliation of non-GAAP measures to the comparable GAAP measures on pages 19 to 21.
The Non-GAAP measures used in this presentation include the following:
Non-GAAP 2018 Adjusted results, including Adjusted Income Taxes and Adjusted Net Income - Omnicom Group Inc., defined as our operating results excluding the impact of the income tax expense reduction related to the successful resolution of foreign tax claims, which was recorded in the first quarter of 2018. We believe that this is a meaningful operating performance measure to understand the impact this item had on our reported results.
Free Cash Flow, defined as net income plus depreciation, amortization, share based compensation expense plus/(less) other items to reconcile to net cash provided by operating activities. We believe Free Cash Flow is a useful measure of liquidity to evaluate our ability to generate excess cash from our operations.
Primary Uses of Cash, defined as dividends to common shareholders, dividends paid to non-controlling interest shareholders, capital expenditures, cash paid on acquisitions, payments for additional interest in controlled subsidiaries and stock repurchases, net of the proceeds from our stock plans, and excludes changes in operating capital and other investing and financing activities, including commercial paper issuances and redemptions used to fund working capital changes. We believe this liquidity measure is useful in identifying the significant uses of our cash.
Net Free Cash Flow, defined as Free Cash Flow less the Primary Uses of Cash. Net Free Cash Flow is one of the metrics used by us to assess our sources and uses of cash and was derived from our consolidated statements of cash flows. We believe that this liquidity measure is meaningful for understanding our primary sources and primary uses of that cash flow.
EBITDA, defined as operating profit before interest, taxes, depreciation and amortization of intangible assets. We believe EBITDA is a meaningful operating performance measure because the financial covenants in our credit facilities are based on EBITDA.
EBITA, defined as operating profit before interest, taxes and amortization of intangible assets and EBITA margin, defined as EBITA divided by revenue. We use EBITA and EBITA margin as additional operating performance measures, which excludes the non-cash amortization expense of intangible assets (primarily consisting of amortization arising from acquisitions). Accordingly, we believe it is a useful measure for investors to evaluate the performance of our business.
Net Debt, defined as total debt less cash, cash equivalents and short-term investments. We believe net debt, together with the comparable GAAP measures, reflects one of the liquidity metrics used by us to assess our cash management.
After Tax Reported Operating Profit, defined as reported operating profit less income taxes calculated using the effective tax rate for the applicable period. Management uses after tax operating profit as a measure of after tax operating performance as it excludes the after tax effects of financing and investing activities on results of operations.
Other Information
All dollar amounts are in millions except for per share figures on page 2 and the net cash returned to shareholders figures on page 17. The information contained in this document has not been audited, although some data has been derived from Omnicom’s historical financial statements, including its audited financial statements. In addition, industry, operational and other non-financial data contained in this document have been derived from sources that we believe to be reliable, but we have not independently verified such information, and we do not, nor does any other person, assume responsibility for the accuracy or completeness of that information. Certain amounts in prior periods have been reclassified to conform to our current presentation. The inclusion of information in this presentation does not mean that such information is material or that disclosure of such information is required.
April 16, 2019 23