UNITED STATES
SECURITIES AND EXCHANGE COMMISSION
Washington, D.C. 20549
FORM N-CSR
CERTIFIED SHAREHOLDER REPORT OF REGISTERED MANAGEMENT
INVESTMENT COMPANIES
Investment Company Act file number 811-02201
Insight Select Income Fund
(Exact name of registrant as specified in charter)
200 Park Avenue, 7th Floor
New York, NY 10166
(Address of principal executive offices) (Zip code)
Gautam Khanna
200 Park Avenue, 7th Floor
New York, NY 10166
(Name and address of agent for service)
Registrant’s telephone number, including area code: 212-527-1800
Date of fiscal year end: March 31
Date of reporting period: September 30, 2022
Item 1. Reports to Stockholders.
| (a) | The Report to Shareholders is attached herewith. |
Online:
Visit www.computershare.com/investor to log into your account and select “Communication Preferences” to set your preference.
Telephone:
Contact the Fund at 866-333-6685
Overnight Mail:
Computershare Investor Services, 462 South 4th Street, Suite 1600, Louisville, KY, 40202
Regular Mail:
Computershare Investor Services, PO Box 505000, Louisville, KY, 40233-5000
| 1 |
For the Six-Month Period Ended 09/30/22
November 2, 2022
DEAR SHAREHOLDERS:
The reporting period was marked by rising inflation and aggressive Federal Reserve (the “Fed”) monetary tightening, resulting in rising recession concerns. Further, Russia’s ongoing war in Ukraine added to market uncertainty. Most financial assets lost value across the globe.
The Fed took an increasingly aggressive stance with respect to monetary policy, driven by stronger-than-expected inflation. Initially, at the start of the period, the Fed was still not noticeably concerned about pricing pressures. However, as the Consumer Price Index (“CPI”) increased north of 9% the Fed became increasingly concerned, and vocal, about the risk of inflation becoming structurally embedded within the economy, which then drove it towards a more aggressive pace of monetary policy tightening. After peaking at 9.1%, the CPI has retreated towards 8% perhaps indicative that some of the policy tightening already in place is having the intended affect. A more concerning aspect of CPI has been a recent shift in pricing pressure from flexible components of the index, such as food, energy, and goods, to ‘stickier’ components of the index such as core services including rents, medical services, and education-related costs. In these stickier segments, inflation is more likely to be persistent.
Consistent with the concerns that inflation was not longer considered transitory, the Fed became increasingly hawkish, with its median forecast for end-2022 interest rates rising from 1.875% being predicted in March 2022 to 4.4% being predicted in September 20221. For end-2023, the forecast shifted from 2.75% to 4.6%. The Fed began tapering its bond purchases by $15 billion a month in November 2021, then swiftly accelerated the tapering to $30 billion a month later and that pace continues to this day. The Fed began raising interest rates in March 2022, including three consecutive 75 basis points (bps) hikes in June, July, and September. The Fed Funds rate ended the reporting period at 3.25%, well above its previous long-term estimate of the neutral rate being at 2.5% as of the same period end.
The US entered two quarters of negative real growth, at -0.41% and -0.14% for the first and second quarters of 2022 respectively, albeit real growth remained positive in nominal terms. It remains to be seen if the US will fall into an official recession (as will be determined by NBER, the National Bureau of Economic Research).
Other major central banks continued to adjust their monetary tightening policies. As a result, government bonds issued by the US and by other governments weakened significantly, with the 10-year US Treasury yield rising by 149bps to 3.8% during the period. Credit markets generally declined more than government bonds, as spreads widened by 44bps for US investment grade corporate bonds, albeit US credit markets significantly outperformed European credit markets generally.
Geopolitical events contributed to roiled markets early in 2022. The February 2022 invasion of Ukraine and the global sanctions imposed on Russia have led to spikes in energy and commodity prices. With these two countries being major producers of wheat and corn, those prices, as well as other industrial commodities, have risen since the start of the period. While Russian authorities may have expected to swiftly achieve their objective, their military advances slowed and, in some cases, have been reversed, leading to expectations that the conflict will persist for the foreseeable future.
| 1 | Federal Reserve quarterly projections, September 2022, https://www.federalreserve.gov/monetarypolicy/fomcprojtabl20220921.htm |
| 2 |
Toward the end of the period, US and global markets also suffered volatility attributable to geopolitical developments when Chancellor of the Exchequer, Kwasi Kwarteng, a minister of the Crown within the Government of the United Kingdom, announced unfunded tax cuts aimed at stimulating the UK economy. This called into question the UK’s fiscal health, resulting in investors selling UK assets. Sharply rising UK government bond yields forced certain pension funds with liability-driven investment strategies to liquidate assets to meet collateral calls, setting off a feedback loop of further rising yields and more collateral calls. The Bank of England intervened by buying long-dated gilts and postponing planned sales of assets, which calmed UK and international markets with respect to this market event.
Towards the end of the period, the Fund began to moderate its high-yield and emerging market exposure given the aggressive pace of monetary policy tightening by many developed nations’ central banks which could increase the odds of the current economic expansion coming to an end. The current market volatility does create market dislocations and the Fund maintains adequate liquidity to capitalize on idiosyncratic opportunities that may present themselves. While being generally exposed to the credit markets, we continue to adjust the Fund’s portfolio positioning to focus on the parts of the credit curve that we believe provide the best tradeoff between risk and reward, in a volatile interest rate environment that we expect to continue to be volatile over the next year. Balance remains paramount as there are risks on both sides of any forecast. The Fund’s performance was a function of navigating a difficult rate environment while positioning the Fund to effectively target, durable and high-quality sources of predictable income from the now higher level of prevailing interest rates and credit spreads. We continue to resist the temptation to sacrifice portfolio liquidity in the hunt for yield, and we want to own assets we see exhibiting good visibility into the credit worthiness of issuers, stability of balance sheets, and overall staying power.
As of September 30, 2022, the Fund had a net asset value (NAV) of $16.67 per share. This represents a 14.91% decrease from $19.59 per share on March 31, 2022. On September 30, 2022, the Fund’s closing price on the New York Stock Exchange was $15.37 per share, representing a 7.80% discount to NAV per share, compared with an 8.78% discount as of March 31, 2022. One of the primary objectives of the Fund is to maintain a high level of income. On September 8, 2022, the Board of Trustees declared a dividend payment of $0.18 per share payable on October 12, 2022 to shareholders of record on September 30, 2022. On an annualized basis, including the pending dividend, the annual dividend payment from ordinary income equates to a total of $0.74 per share, representing a 4.94% dividend yield based on the market price on November 3, 2022 of $14.99 per share. The dividend is evaluated on a quarterly basis and is based on the income generation capability of the portfolio and is not guaranteed for any period of time.
Yield represents the major component of return in most fixed income portfolios. Given this Fund’s emphasis on income and the dividend, we generally will not have material exposure to low-yielding US Treasuries and will maintain meaningful exposure to corporate bonds. When it comes to management of credit risk, we try to look through periods of volatility to focus on an investment’s long-term creditworthiness to assess whether it will provide an attractive yield to the Fund over time.
| 3 |
The Fund’s performance will continue to be subject to trends in long-term interest rates and to corporate yield spreads. Consistent with our investment discipline, we continue to emphasize diversification and risk management within the bounds of income stability. The pie chart below summarizes the portfolio quality of the Fund’s assets as of September 30, 2022:
Percent of Total Investment (Lower of S&P and Moody’s Ratings)1
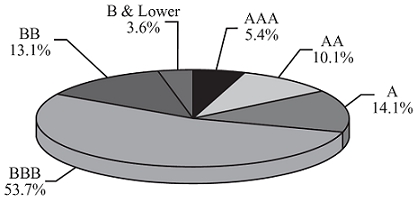
| 1 | For financial reporting purposes, credit quality ratings shown above reflect the lowest rating assigned by either Standard & Poor’s (“S&P”) or Moody’s Investors Service (“Moody’s”) if ratings differ. These rating agencies are independent, nationally recognized statistical rating organizations and are widely used. Investment grade ratings are credit ratings of BBB/Baa or higher. Below investment grade ratings are credit ratings of BB/Ba or lower. Investments designated NR are not rated by either rating agency. Unrated investments do not necessarily indicate low credit quality. Credit quality ratings and the Fund’s allocation to the ratings categories are subject to change at any time without notice. |
We would like to remind shareholders of the opportunities presented by the Fund’s dividend reinvestment plan referred to in the Shareholder Information section of this report. The dividend reinvestment plan affords shareholders a price advantage by allowing them to purchase additional shares at NAV or market price, whichever is lower. This means that the reinvestment price is at market price when the Fund is trading at a discount to NAV, as is currently the situation, or at NAV per share when market trading is at a premium to that value. To participate in the plan, please contact Computershare Investor Services, the Fund’s Transfer Agent and Dividend Paying Agent, at 1-866-333-6685. The Fund’s investment adviser, Insight North America LLC, may be reached at 1-212-527-1800.

Gautam Khanna
President
Mr. Khanna’s comments reflect the investment adviser’s views generally regarding the market and the economy and are compiled from the investment adviser’s research. These comments reflect opinions as of the date written and are subject to change at any time.
Opinions expressed herein are current opinions of Insight and are subject to change without notice. Insight assumes no responsibility to update such information or to notify a client of any changes. Any outlooks, forecasts or portfolio
| 4 |
weightings presented herein are as of the date appearing on this material only and are also subject to change without notice. Insight disclaims any responsibility to update such views. No forecasts can be guaranteed.
Information herein may contain, include or is based upon forward-looking statements within the meaning of the federal securities laws, specifically Section 21E of the Securities Exchange Act of 1934, as amended. Forward-looking statements include all statements, other than statements of historical fact, that address future activities, events or developments, including without limitation, business or investment strategy or measures to implement strategy, competitive strengths, goals expansion and growth of our business, plans, prospects and references to future or success. You can identify these statements by the fact that they do not relate strictly to historical or current facts. Words such as ‘anticipate,’ ‘estimate,’ ‘expect,’ ‘project,’ ‘intend,’ ‘plan,’ ‘believe,’ and other similar words are intended to identify these forward-looking statements. Forward-looking statements can be affected by inaccurate assumptions or by known or unknown risks and uncertainties. Many such factors will be important in determining our actual future results or outcomes. Consequently, no forward-looking statement can be guaranteed. Our actual results or outcomes may vary materially. Given these uncertainties, you should not place undue reliance on these forward-looking statements.
Past performance is not a guide to future performance, which will vary. The value of investments and any income from them will fluctuate and is not guaranteed (this may partly be due to exchange rate changes). Future returns are not guaranteed and a loss of principal may occur.
The quoted benchmarks within this presentation do not reflect deductions for fees, expenses or taxes. These benchmarks are unmanaged and cannot be purchased directly by investors. Benchmark performance is shown for illustrative purposes only and does not predict or depict the performance of any investment. There may be material factors relevant to any such comparison such as differences in volatility, and regulatory and legal restrictions between the indices shown and the strategy.
| 5 |
Total Return-Percentage Change (Annualized for periods longer than 1 year)
In Net Asset Value Per Share with All Distributions Reinvested1
| 6 Months to 9/30/22 | 1 Year to 9/30/22 | 3 Years to 9/30/22 | 5 Years to 9/30/22 | 10 Years | |||||
| Insight Select Income Fund | -12.03% | -18.12% | -2.66% | 0.69% | 2.94% | ||||
| Bloomberg U.S. Credit Index2 | -7.21% | -4.16% | 2.81% | 3.18% | 3.44% |
| 1 − | Dividends and distributions, if any, are assumed for purposes of this calculation to be reinvested at prices obtained under the Fund’s dividend reinvestment plan. Total investment return does not reflect brokerage commissions. The total investment return, if for less than a full year, is not annualized. Past performance is not a guarantee of future results. |
| 2 − | Source: Bloomberg as of September 30, 2022. Comprised primarily of US investment grade corporate bonds (Fund’s Benchmark). |
| 6 |
| SCHEDULE OF INVESTMENTS (Unaudited) | September 30, 2022 |
| Moody’s/ Standard & Poor’s Rating(a) | Principal Amount (000’s) | Value (Note1) | ||||||||
| CORPORATE DEBT SECURITIES (76.96%) | ||||||||||
| AEROSPACE/DEFENSE (1.93%) | ||||||||||
| Boeing Co., Sr. Unsec. Notes, 4.875%, 05/01/25(b) | Baa2/BBB- | $ | 1,657 | $ | 1,618,726 | |||||
| Boeing Co., Sr. Unsec. Notes, 5.805%, 05/01/50(b) | Baa2/BBB- | 463 | 403,285 | |||||||
| Northrop Grumman Corp., Sr. Unsec. Notes, 3.250%, 01/15/28(b) | Baa1/BBB+ | 365 | 332,674 | |||||||
| Northrop Grumman Corp., Sr. Unsec. Notes, 7.750%, 06/01/29 | Baa1/BBB+ | 500 | 560,057 | |||||||
| Raytheon Technologies Corp., Sr. Unsec. Notes, 3.750%, 11/01/46(b) | Baa1/A- | 700 | 526,448 | |||||||
| 3,441,190 | ||||||||||
| AGRICULTURE (0.41%) | ||||||||||
| Altria Group, Inc., Co. Gty., 4.800%, 02/14/29(b) | A3/BBB | 97 | 89,576 | |||||||
| Altria Group, Inc., Co. Gty., 5.950%, 02/14/49(b) | A3/BBB | 329 | 272,437 | |||||||
| BAT International Finance PLC, Co. Gty., 1.668%, 03/25/26(b) | Baa2/BBB+ | 425 | 367,507 | |||||||
| 729,520 | ||||||||||
| AIRLINES (3.70%) | ||||||||||
| Air Canada, Sr. Sec. Notes, 3.875%, 08/15/26, 144A(b) | Ba2/BB- | 56 | 48,090 | |||||||
| Air Canada Pass Through Certs., Series 2020-2, Class A, 5.250%, 04/01/29, 144A | NA/A | 226 | 212,075 | |||||||
| American Airlines Group, Inc. Pass Through Certs., Series 2017-1, Class AA, 3.650%, 02/15/29 | Baa1/NA | 809 | 714,054 | |||||||
| American Airlines Group, Inc. Pass Through Certs., Series 2017-2, Class AA, 3.350%, 10/15/29 | Baa1/NA | 1,243 | 1,084,944 | |||||||
| American Airlines Group, Inc. Pass Through Certs., Series 2019-1, Class AA, 3.150%, 02/15/32 | Baa1/A- | 704 | 586,993 | |||||||
| American Airlines, Inc., Sr. Sec. Notes, 5.500%, 04/20/26, 144A | Ba2/NA | 354 | 332,466 | |||||||
| American Airlines, Inc., Sr. Sec. Notes, 5.750%, 04/20/29, 144A | Ba2/NA | 162 | 141,345 | |||||||
| British Airways PLC Pass Through Certs., Series 2020-1, Class A, 4.250%, 11/15/32, 144A | NA/A | 109 | 97,867 | |||||||
| Delta Air Lines, Inc., Sr. Sec. Notes, 4.500%, 10/20/25, 144A | Baa1/NA | 120 | 116,489 | |||||||
| Delta Air Lines, Inc., Sr. Sec. Notes, 4.750%, 10/20/28, 144A | Baa1/NA | 209 | 194,740 | |||||||
| JetBlue Airways Corp. Pass Through Certs., Series 2020-1, Class A, 4.000%, 11/15/32 | A2/NA | 968 | 861,306 | |||||||
| United Airlines, Inc., Sr. Sec. Notes, 4.375%, 04/15/26, 144A(b) | Ba1/BB- | 65 | 58,013 | |||||||
| United Airlines, Inc., Sr. Sec. Notes, 4.625%, 04/15/29, 144A(b) | Ba1/BB- | 318 | 263,940 | |||||||
| United Airlines, Inc. Pass Through Certs., Series 2018-1, Class B, 4.600%, 03/01/26 | Baa3/NA | 570 | 519,537 | |||||||
| United Airlines, Inc. Pass Through Certs., Series 2019-1, Class AA, 4.150%, 08/25/31 | A2/NA | 364 | 327,351 | |||||||
| United Airlines, Inc. Pass Through Certs., Series 2019-2, Class AA, 2.700%, 05/01/32 | A2/NA | 995 | 794,223 | |||||||
| United Airlines, Inc. Pass Through Certs., Series 2020-1, Class A, 5.875%, 10/15/27 | A3/A | 260 | 251,128 | |||||||
| 6,604,561 | ||||||||||
| AUTO MANUFACTURERS (2.94%) | ||||||||||
| Ford Holdings LLC, Co. Gty., 9.300%, 03/01/30 | Ba2/BB+ | 1,000 | 1,102,900 | |||||||
| Ford Motor Credit Co. LLC, Sr. Unsec. Notes, 3.370%, 11/17/23 | Ba2/BB+ | 500 | 483,715 | |||||||
| Ford Motor Credit Co. LLC, Sr. Unsec. Notes, 2.300%, 02/10/25(b) | Ba2/BB+ | 1,199 | 1,062,765 | |||||||
| Ford Motor Credit Co. LLC, Sr. Unsec. Notes, 4.542%, 08/01/26(b) | Ba2/BB+ | 1,356 | 1,206,972 | |||||||
| General Motors Co., Sr. Unsec. Notes, 6.800%, 10/01/27(b) | Baa3/BBB | 405 | 409,211 | |||||||
| General Motors Financial Co., Inc., Sr. Unsec. Notes, 3.600%, 06/21/30(b) | Baa3/BBB | 1,027 | 831,702 | |||||||
| Stellantis Finance US, Inc., Co. Gty., 2.691%, 09/15/31, 144A(b) | Baa2/BBB | 221 | 157,611 | |||||||
| 5,254,876 | ||||||||||
| BANKS (11.18%) | ||||||||||
| AIB Group PLC, Sr. Unsec. Notes, (3M LIBOR + 1.874%), 4.263%, 04/10/25, 144A(b),(c) | A3/BBB- | 582 | 557,987 | |||||||
| Citigroup, Inc., Jr. Sub. Notes, (H15T5Y + 3.597%), 4.000%, 12/10/25(b),(c),(d) | Ba1/BB+ | 635 | 533,489 | |||||||
| Citigroup, Inc., Sr. Unsec. Notes, 8.125%, 07/15/39 | A3/BBB+ | 70 | 82,910 | |||||||
| Citigroup, Inc., Sr. Unsec. Notes, (3M LIBOR + 1.563%), 3.887%, 01/10/28(b),(c) | A3/BBB+ | 1,100 | 1,012,774 | |||||||
| Citigroup, Inc., Sr. Unsec. Notes, (SOFRRATE + 1.887%), 4.658%, 05/24/28(b),(c) | A3/BBB+ | 1,302 | 1,239,395 | |||||||
| Citigroup, Inc., Sub. Notes, 4.600%, 03/09/26 | Baa2/BBB | 988 | 955,577 | |||||||
| Citigroup, Inc., Sub. Notes, 5.300%, 05/06/44 | Baa2/BBB | 926 | 807,046 | |||||||
| Credit Agricole SA, Sub. Notes, (SW5+ 1.644%), 4.000%, 01/10/33, 144A(b),(c) | Baa1/BBB+ | 1,025 | 883,773 | |||||||
| Credit Suisse AG, Sr. Unsec. Notes, (SOFRINDX + 1.260%), 3.969%, 02/21/25(e) | A2/A | 1,250 | 1,218,774 | |||||||
The accompanying notes are an integral part of these financial statements.
| 7 |
SCHEDULE OF INVESTMENTS (Unaudited) — continued
| Moody’s/ Standard & Poor’s Rating(a) | Principal Amount (000’s) | Value (Note1) | ||||||||
| CORPORATE DEBT SECURITIES (Continued) | ||||||||||
| BANKS (Continued) | ||||||||||
| Credit Suisse Group AG, Sr. Unsec. Notes, (SOFRRATE + 1.560%), 2.593%, 09/11/25, 144A(b),(c) | Baa2/BBB | $ | 1,242 | $ | 1,129,075 | |||||
| Goldman Sachs Group, Inc., Sr. Unsec. Notes, (3M LIBOR + 1.750%), 4.543%, 10/28/27(b),(e) | A2/BBB+ | 550 | 546,682 | |||||||
| Goldman Sachs Group, Inc., Sr. Unsec. Notes, (SOFRRATE + 1.725%), 4.482%, 08/23/28(b),(c) | A2/BBB+ | 703 | 660,378 | |||||||
| HSBC Capital Funding Dollar 1 LP, Co. Gty., (3M LIBOR + 4.980%), 10.176%, 06/30/30, 144A(b),(c),(d) | Baa3/BB+ | 2,180 | 2,753,159 | |||||||
| HSBC USA, Inc., Sr. Unsec. Notes, 3.750%, 05/24/24 | A1/A- | 1,955 | 1,916,588 | |||||||
| ING Groep NV, Sr. Unsec. Notes, (SOFRRATE + 1.640%), 3.869%, 03/28/26(b),(c) | Baa1/A- | 782 | 741,460 | |||||||
| Morgan Stanley, Sub. Notes, 4.350%, 09/08/26 | Baa1/BBB+ | 1,500 | 1,429,188 | |||||||
| PNC Financial Services Group, Inc., Jr. Sub. Notes, (3M LIBOR + 3.300%), 5.000%, 11/01/26(b),(c),(d) | Baa2/BBB- | 757 | 660,129 | |||||||
| Synchrony Bank, Sr. Unsec. Notes, 5.400%, 08/22/25(b) | NA/BBB | 305 | 297,431 | |||||||
| Truist Financial Corp., Jr. Sub. Notes, (H15T5Y + 3.003%), 4.800%, 09/01/24(b),(c),(d) | Baa2/BBB- | 1,136 | 1,011,346 | |||||||
| Wells Fargo & Co., Jr. Sub. Notes, (H15T5Y + 3.453%), 3.900%, 03/15/26(b),(c),(d) | Baa2/BB+ | 1,162 | 981,890 | |||||||
| Westpac Banking Corp., Sub. Notes, (H15T5Y + 1.750%), 2.668%, 11/15/35(b),(c) | Baa1/BBB+ | 753 | 553,491 | |||||||
| 19,972,542 | ||||||||||
| BEVERAGES (0.56%) | ||||||||||
| Anheuser-Busch Cos. LLC, Co. Gty., 4.700%, 02/01/36(b) | Baa1/BBB+ | 645 | 582,158 | |||||||
| Anheuser-Busch Cos. LLC, Co. Gty., 4.900%, 02/01/46(b) | Baa1/BBB+ | 446 | 386,528 | |||||||
| Anheuser-Busch InBev Worldwide, Inc., Co. Gty., 8.200%, 01/15/39 | Baa1/BBB+ | 27 | 32,601 | |||||||
| 1,001,287 | ||||||||||
| BIOTECHNOLOGY (0.53%) | ||||||||||
| Royalty Pharma PLC, Co. Gty., 2.200%, 09/02/30(b) | Baa3/BBB- | 930 | 709,982 | |||||||
| Royalty Pharma PLC, Co. Gty., 2.150%, 09/02/31(b) | Baa3/BBB- | 326 | 240,016 | |||||||
| 949,998 | ||||||||||
| BUILDING MATERIALS (0.71%) | ||||||||||
| Builders FirstSource, Inc., Co. Gty., 6.375%, 06/15/32, 144A(b) | Ba2/BB- | 64 | 56,857 | |||||||
| Cemex SAB de CV, Co. Gty., 7.375%, 06/05/27, 144A(b) | NA/BB | 200 | 198,000 | |||||||
| Masco Corp., Sr. Unsec. Notes, 1.500%, 02/15/28(b) | Baa2/BBB | 647 | 522,338 | |||||||
| Masonite International Corp., Co. Gty., 3.500%, 02/15/30, 144A(b) | Ba1/BB+ | 53 | 40,510 | |||||||
| SRM Escrow Issuer LLC, Sr. Sec. Notes, 6.000%, 11/01/28, 144A(b) | Ba3/B+ | 548 | 442,456 | |||||||
| 1,260,161 | ||||||||||
| CHEMICALS (2.88%) | ||||||||||
| Alpek SAB de CV, Co. Gty., 3.250%, 02/25/31, 144A(b) | Baa3/BBB- | 418 | 309,283 | |||||||
| Braskem Idesa SAPI, Sr. Sec. Notes, 7.450%, 11/15/29, 144A(b) | NA/B+ | 273 | 206,791 | |||||||
| Braskem Idesa SAPI, Sr. Sec. Notes, 6.990%, 02/20/32, 144A(b) | NA/B+ | 528 | 353,760 | |||||||
| Braskem Netherlands Finance BV, Co. Gty., 5.875%, 01/31/50, 144A | NA/BBB- | 1,181 | 836,739 | |||||||
| Celanese US Holdings LLC, Co. Gty., 6.165%, 07/15/27(b) | Baa3/BBB | 787 | 742,500 | |||||||
| Orbia Advance Corp. SAB de CV, Co. Gty., 2.875%, 05/11/31, 144A(b) | Baa3/BBB- | 574 | 417,988 | |||||||
| Trinseo Materials Operating SCA, Co. Gty., 5.125%, 04/01/29, 144A(b) | B2/B | 105 | 61,950 | |||||||
| Union Carbide Corp., Sr. Unsec. Notes, 7.750%, 10/01/96 | Baa1/BBB | 2,000 | 2,212,425 | |||||||
| 5,141,436 | ||||||||||
| COMMERCIAL SERVICES (1.78%) | ||||||||||
| Ashtead Capital, Inc., Co. Gty., 4.000%, 05/01/28, 144A(b) | Baa3/BBB- | 555 | 485,228 | |||||||
| Ashtead Capital, Inc., Co. Gty., 4.250%, 11/01/29, 144A(b) | Baa3/BBB- | 200 | 174,576 | |||||||
| Atento Luxco 1 SA, Sr. Sec. Notes, 8.000%, 02/10/26, 144A(b) | Ba3/NA | 249 | 105,162 | |||||||
| ERAC USA Finance LLC, Co. Gty., 7.000%, 10/15/37, 144A | Baa1/A- | 1,500 | 1,565,569 | |||||||
| Global Payments, Inc., Sr. Unsec. Notes, 5.400%, 08/15/32(b) | Baa3/BBB- | 274 | 253,092 | |||||||
The accompanying notes are an integral part of these financial statements.
| 8 |
SCHEDULE OF INVESTMENTS (Unaudited) — continued
| Moody’s/ Standard & Poor’s Rating(a) | Principal Amount (000’s) | Value (Note1) | ||||||||
| CORPORATE DEBT SECURITIES (Continued) | ||||||||||
| COMMERCIAL SERVICES (Continued) | ||||||||||
| Prime Security Services Borrower LLC, Sr. Sec. Notes, 3.375%, 08/31/27, 144A(b) | Ba3/BB- | $ | 559 | $ | 469,655 | |||||
| Triton Container International, Ltd., Co. Gty., 3.150%, 06/15/31, 144A(b) | NA/BBB- | 167 | 122,258 | |||||||
| 3,175,540 | ||||||||||
| COMPUTERS (0.62%) | ||||||||||
| Dell International LLC, Co. Gty., 3.450%, 12/15/51, 144A(b) | Baa2/BBB | 529 | 300,755 | |||||||
| Dell International LLC, Sr. Unsec. Notes, 5.850%, 07/15/25(b) | Baa2/BBB | 342 | 344,676 | |||||||
| Dell International LLC, Sr. Unsec. Notes, 8.350%, 07/15/46(b) | Baa2/BBB | 209 | 225,453 | |||||||
| Kyndryl Holdings, Inc., Sr. Unsec. Notes, 2.050%, 10/15/26(b) | NR/BBB- | 153 | 122,938 | |||||||
| Western Digital Corp., Sr. Unsec. Notes, 2.850%, 02/01/29(b) | Baa3/BB+ | 146 | 114,351 | |||||||
| 1,108,173 | ||||||||||
| DIVERSIFIED FINANCIAL SERVICES (1.33%) | ||||||||||
| AerCap Ireland Capital DAC, Co. Gty., 3.300%, 01/30/32(b) | Baa3/BBB | 519 | 389,786 | |||||||
| Intercontinental Exchange, Inc., Sr. Unsec. Notes, 4.350%, 06/15/29(b) | A3/A- | 358 | 338,827 | |||||||
| LSEGA Financing PLC, Co. Gty., 1.375%, 04/06/26, 144A(b) | A3/A | 612 | 536,394 | |||||||
| LSEGA Financing PLC, Co. Gty., 2.500%, 04/06/31, 144A(b) | A3/A | 264 | 214,319 | |||||||
| PennyMac Financial Services, Inc., Co. Gty., 5.750%, 09/15/31, 144A(b) | Ba3/BB- | 522 | 374,162 | |||||||
| Synchrony Financial, Sr. Unsec. Notes, 2.875%, 10/28/31(b) | NA/BBB- | 747 | 530,650 | |||||||
| 2,384,138 | ||||||||||
| ELECTRIC (6.52%) | ||||||||||
| AES Andes SA, Jr. Sub. Notes, (H15T5Y + 4.917%), 6.350%, 10/07/79, 144A(b),(c) | Ba2/BB | 878 | 755,269 | |||||||
| AES Panama Generation Holdings Srl, Sr. Sec. Notes, 4.375%, 05/31/30, 144A(b) | Baa3/NA | 549 | 432,337 | |||||||
| American Electric Power Co., Inc., Jr. Sub. Notes, 2.031%, 03/15/24 | Baa3/BBB+ | 1,952 | 1,868,586 | |||||||
| Berkshire Hathaway Energy Co., Sr. Unsec. Notes, 2.850%, 05/15/51(b) | A3/A- | 1,000 | 615,507 | |||||||
| Black Hills Corp., Sr. Unsec. Notes, 3.875%, 10/15/49(b) | Baa2/BBB+ | 1,175 | 843,587 | |||||||
| CMS Energy Corp., Jr. Sub. Notes, (H15T5Y + 2.900%), 3.750%, 12/01/50(b),(c) | Baa3/BBB- | 238 | 174,930 | |||||||
| Consorcio Transmantaro SA, Sr. Unsec. Notes, 4.700%, 04/16/34, 144A | Baa3/NA | 200 | 172,613 | |||||||
| Edison International, Jr. Sub. Notes, (H15T5Y + 4.698%), 5.375%, 03/15/26(b),(c),(d) | Ba2/BB+ | 638 | 528,742 | |||||||
| Edison International, Sr. Unsec. Notes, 3.550%, 11/15/24(b) | Baa3/BBB- | 575 | 552,205 | |||||||
| Evergy Metro, Inc., Sr. Sec. Notes, 4.200%, 06/15/47(b) | A2/A+ | 917 | 745,262 | |||||||
| FirstEnergy Corp., Sr. Unsec. Notes, 5.350%, 07/15/47(b),(f) | Ba1/BB+ | 1,570 | 1,325,064 | |||||||
| IPALCO Enterprises, Inc., Sr. Sec. Notes, 4.250%, 05/01/30(b) | Baa3/BBB- | 462 | 400,674 | |||||||
| Jersey Central Power & Light Co., Sr. Unsec. Notes, 2.750%, 03/01/32, 144A(b) | A3/BBB | 323 | 255,345 | |||||||
| Light Servicos de Eletricidade SA, Co. Gty., 4.375%, 06/18/26, 144A(b) | Ba3/NA | 456 | 378,740 | |||||||
| MidAmerican Funding LLC, Sr. Sec. Notes, 6.927%, 03/01/29 | A2/A- | 500 | 530,171 | |||||||
| Pacific Gas and Electric Co., 2.100%, 08/01/27(b) | Baa3/BBB- | 391 | 316,225 | |||||||
| Pacific Gas and Electric Co., 3.500%, 08/01/50(b) | Baa3/BBB- | 617 | 375,536 | |||||||
| Puget Energy, Inc., Sr. Sec. Notes, 2.379%, 06/15/28(b) | Baa3/BBB- | 247 | 205,626 | |||||||
| Transelec SA, Sr. Unsec. Notes, 4.250%, 01/14/25, 144A(b) | Baa1/BBB | 750 | 727,500 | |||||||
| Transelec SA, Sr. Unsec. Notes, 3.875%, 01/12/29, 144A(b) | Baa1/BBB | 490 | 436,713 | |||||||
| 11,640,632 | ||||||||||
| ENGINEERING & CONSTRUCTION (0.21%) | ||||||||||
| Sydney Airport Finance Co. Pty, Ltd., Sr. Sec. Notes, 3.375%, 04/30/25, 144A(b) | Baa1/BBB+ | 400 | 375,217 | |||||||
| ENTERTAINMENT (0.39%) | ||||||||||
| Lions Gate Capital Holdings LLC, Co. Gty., 5.500%, 04/15/29, 144A(b) | B3/CCC+ | 386 | 287,570 | |||||||
| Warnermedia Holdings, Inc., Co. Gty., 3.638%, 03/15/25, 144A | Baa3/BBB- | 441 | 417,692 | |||||||
| 705,262 | ||||||||||
| FOOD (0.56%) | ||||||||||
| Bimbo Bakeries USA, Inc., Co. Gty., 4.000%, 05/17/51, 144A(b) | Baa2/BBB | 363 | 266,178 | |||||||
| JBS USA LUX SA, Co. Gty., 3.750%, 12/01/31, 144A(b) | Baa3/BBB- | 54 | 43,229 | |||||||
| JBS USA LUX SA, Co. Gty., 3.625%, 01/15/32, 144A(b) | Baa3/NA | 211 | 164,844 | |||||||
| Kraft Heinz Foods Co., Co. Gty., 5.500%, 06/01/50(b) | Baa3/BBB- | 346 | 311,296 | |||||||
The accompanying notes are an integral part of these financial statements.
| 9 |
SCHEDULE OF INVESTMENTS (Unaudited) — continued
| Moody’s/ Standard & Poor’s Rating(a) | Principal Amount (000’s) | Value (Note1) | ||||||||
| CORPORATE DEBT SECURITIES (Continued) | ||||||||||
| FOOD (Continued) | ||||||||||
| Kroger Co., Sr. Unsec. Notes, 5.400%, 01/15/49(b) | Baa1/BBB | $ | 68 | $ | 63,253 | |||||
| MARB BondCo PLC, Co. Gty., 3.950%, 01/29/31, 144A(b) | NA/BB+ | 213 | 154,159 | |||||||
| 1,002,959 | ||||||||||
| FOREST PRODUCTS & PAPER (0.42%) | ||||||||||
| Inversiones CMPC SA, Co. Gty., 3.850%, 01/13/30, 144A(b) | Baa3/BBB- | 580 | 468,350 | |||||||
| Suzano Austria GmbH, Co. Gty., 3.750%, 01/15/31(b) | NA/BBB- | 351 | 274,991 | |||||||
| 743,341 | ||||||||||
| GAS (2.18%) | ||||||||||
| NiSource, Inc., Jr. Sub. Notes, (H15T5Y + 2.843%), 5.650%, 06/15/23(b),(c),(d) | NA/BBB- | 696 | 642,060 | |||||||
| Piedmont Natural Gas Co., Inc., Sr. Unsec. Notes, 3.500%, 06/01/29(b) | A3/BBB+ | 1,120 | 985,546 | |||||||
| Southern Co. Gas Capital Corp., Co. Gty., 5.875%, 03/15/41(b) | Baa1/BBB+ | 992 | 951,079 | |||||||
| Southern Co. Gas Capital Corp., Co. Gty., 3.950%, 10/01/46(b) | Baa1/BBB+ | 539 | 395,082 | |||||||
| Southern Co. Gas Capital Corp., Co. Gty., 4.400%, 05/30/47(b) | Baa1/BBB+ | 1,164 | 915,281 | |||||||
| 3,889,048 | ||||||||||
| HEALTHCARE-PRODUCTS (0.14%) | ||||||||||
| STERIS Irish FinCo UnLtd Co., Co. Gty., 2.700%, 03/15/31(b) | Baa2/BBB- | 329 | 258,420 | |||||||
| HEALTHCARE-SERVICES (0.36%) | ||||||||||
| CommonSpirit Health, Sr. Sec. Notes, 2.782%, 10/01/30(b) | Baa1/A- | 432 | 344,630 | |||||||
| HCA, Inc., Co. Gty., 3.125%, 03/15/27, 144A(b) | Baa3/BBB- | 119 | 105,396 | |||||||
| Tenet Healthcare Corp., Sr. Sec. Notes, 4.875%, 01/01/26, 144A(b) | B1/BB- | 201 | 186,783 | |||||||
| 636,809 | ||||||||||
| HOUSEWARES (0.16%) | ||||||||||
| Newell Brands, Inc., Sr. Unsec. Notes, 6.375%, 09/15/27(b) | Ba1/BBB- | 157 | 155,466 | |||||||
| Newell Brands, Inc., Sr. Unsec. Notes, 6.625%, 09/15/29(b) | Ba1/BBB- | 139 | 135,905 | |||||||
| 291,371 | ||||||||||
| INSURANCE (8.43%) | ||||||||||
| Allianz SE, Jr. Sub. Notes, (H15T5Y + 2.165%), 3.200%, 10/30/27, 144A(b),(c),(d) | Baa1/A | 200 | 128,999 | |||||||
| Allianz SE, Jr. Sub. Notes, (H15T5Y + 2.973%), 3.500%, 11/17/25, 144A(b),(c),(d) | Baa1/A | 400 | 306,176 | |||||||
| Allstate Corp., Jr. Sub. Notes, (3M LIBOR + 2.120%), 6.500%, 05/15/57(b),(c) | Baa1/BBB | 2,200 | 2,154,432 | |||||||
| Farmers Exchange Capital, Sub. Notes, 7.200%, 07/15/48, 144A | Baa2/BBB+ | 2,250 | 2,397,715 | |||||||
| Guardian Life Insurance Co. of America, Sub. Notes, 4.850%, 01/24/77, 144A | Aa3/AA- | 148 | 120,285 | |||||||
| Jackson National Life Global Funding, 1.750%, 01/12/25, 144A | A2/A | 656 | 602,911 | |||||||
| Liberty Mutual Group, Inc., Co. Gty., 3.951%, 10/15/50, 144A(b) | Baa2/BBB | 250 | 168,229 | |||||||
| Liberty Mutual Group, Inc., Co. Gty., (3M LIBOR + 7.120%), 10.750%, 06/15/58, 144A(b),(c) | Baa3/BB+ | 1,000 | 1,309,630 | |||||||
| Massachusetts Mutual Life Insurance Co., Sub. Notes, 3.729%, 10/15/70, 144A | A2/AA- | 243 | 161,441 | |||||||
| Massachusetts Mutual Life Insurance Co., Sub. Notes, 4.900%, 04/01/77, 144A | A2/AA- | 980 | 790,797 | |||||||
| MetLife, Inc., Jr. Sub. Notes, 6.400%, 12/15/36(b) | Baa2/BBB | 637 | 614,567 | |||||||
| MetLife, Inc., Jr. Sub. Notes, 10.750%, 08/01/39(b) | Baa2/BBB | 1,000 | 1,302,259 | |||||||
| MetLife, Inc., Jr. Sub. Notes, 9.250%, 04/08/38, 144A(b) | Baa2/BBB | 1,059 | 1,215,569 | |||||||
| Nationwide Mutual Insurance Co., Sub. Notes, 8.250%, 12/01/31, 144A | A3/A- | 500 | 562,997 | |||||||
| Nationwide Mutual Insurance Co., Sub. Notes, 9.375%, 08/15/39, 144A | A3/A- | 215 | 273,006 | |||||||
| New York Life Insurance Co., Sub. Notes, 6.750%, 11/15/39, 144A | Aa2/AA- | 103 | 111,998 | |||||||
| Principal Financial Group, Inc., Co. Gty., (3M LIBOR + 3.044%), 5.949%, 05/15/55(b),(e) | Baa2/BBB | 1,135 | 1,084,842 | |||||||
| Prudential Financial, Inc., Jr. Sub. Notes, (3M LIBOR + 2.665%), 5.700%, 09/15/48(b),(c) | Baa1/BBB+ | 1,241 | 1,158,784 | |||||||
| Prudential Financial, Inc., Jr. Sub. Notes, (3M LIBOR + 3.920%), 5.625%, 06/15/43(b),(c) | Baa1/BBB+ | 600 | 591,156 | |||||||
| 15,055,793 | ||||||||||
The accompanying notes are an integral part of these financial statements.
| 10 |
SCHEDULE OF INVESTMENTS (Unaudited) — continued
| Moody’s/ Standard & Poor’s Rating(a) | Principal Amount (000’s) | Value (Note1) | ||||||||
| CORPORATE DEBT SECURITIES (Continued) | ||||||||||
| INTERNET (0.42%) | ||||||||||
| Meta Platforms, Inc., Sr. Unsec. Notes, 4.450%, 08/15/52, 144A(b) | A1/AA- | $ | 500 | $ | 408,101 | |||||
| Prosus NV, Sr. Unsec. Notes, 4.987%, 01/19/52, 144A(b) | Baa3/BBB | 540 | 350,266 | |||||||
| 758,367 | ||||||||||
| MEDIA (6.94%) | ||||||||||
| AMC Networks, Inc., Co. Gty., 4.250%, 02/15/29(b) | Ba3/BB | 885 | 654,182 | |||||||
| CCO Holdings LLC, Sr. Unsec. Notes, 4.500%, 05/01/32(b) | B1/BB- | 1,017 | 775,635 | |||||||
| Charter Communications Operating LLC, Sr. Sec. Notes, 5.750%, 04/01/48(b) | Ba1/BBB- | 389 | 314,003 | |||||||
| Comcast Corp., Co. Gty., 7.050%, 03/15/33 | A3/A- | 2,000 | 2,192,219 | |||||||
| Cox Communications, Inc., Sr. Unsec. Notes, 6.800%, 08/01/28 | Baa2/BBB | 1,500 | 1,540,309 | |||||||
| Cox Enterprises, Inc., Sr. Unsec. Notes, 7.375%, 07/15/27, 144A. | Baa2/BBB | 500 | 526,393 | |||||||
| CSC Holdings LLC, Co. Gty., 6.500%, 02/01/29, 144A(b) | Ba3/BB- | 954 | 845,793 | |||||||
| CSC Holdings LLC, Sr. Unsec. Notes, 4.625%, 12/01/30, 144A(b) | B3/B | 1,336 | 906,944 | |||||||
| Grupo Televisa SAB, Sr. Unsec. Notes, 6.625%, 01/15/40 | Baa2/BBB+ | 159 | 156,030 | |||||||
| Paramount Global, Sr. Unsec. Notes, 4.200%, 05/19/32(b) | Baa2/BBB | 641 | 518,701 | |||||||
| Paramount Global, Sr. Unsec. Notes, 6.875%, 04/30/36 | Baa2/BBB | 179 | 167,469 | |||||||
| Radiate Holdco LLC, Sr. Sec. Notes, 4.500%, 09/15/26, 144A(b) | B1/B | 124 | 101,709 | |||||||
| Scripps Escrow II, Inc., Sr. Sec. Notes, 3.875%, 01/15/29, 144A(b) | Ba3/BB | 42 | 33,742 | |||||||
| Time Warner Entertainment Co. LP, Sr. Sec. Notes, 8.375%, 07/15/33 | Ba1/BBB- | 1,360 | 1,450,163 | |||||||
| Virgin Media Finance PLC, Co. Gty., 5.000%, 07/15/30, 144A(b) | B2/B | 200 | 150,094 | |||||||
| VTR Finance NV, Sr. Unsec. Notes, 6.375%, 07/15/28, 144A(b) | B1/B | 443 | 244,757 | |||||||
| Walt Disney Co., Co. Gty., 7.900%, 12/01/95 | A2/BBB+ | 1,400 | 1,815,506 | |||||||
| 12,393,649 | ||||||||||
| MINING (0.64%) | ||||||||||
| Alcoa Nederland Holding BV, Co. Gty., 5.500%, 12/15/27, 144A(b) | Baa3/BB+ | 655 | 610,886 | |||||||
| AngloGold Ashanti Holdings PLC, Co. Gty., 3.750%, 10/01/30(b) | Baa3/BB+ | 339 | 262,764 | |||||||
| Newcrest Finance Pty, Ltd., Co. Gty., 3.250%, 05/13/30, 144A(b) | Baa2/BBB | 319 | 265,715 | |||||||
| 1,139,365 | ||||||||||
| MISCELLANEOUS MANUFACTURING (0.16%) | ||||||||||
| GE Capital International Funding Co Unlimited Co., Co. Gty., 4.418%, 11/15/35 | Baa1/BBB+ | 318 | 285,432 | |||||||
| OIL & GAS (3.02%) | ||||||||||
| Aker BP ASA, Co. Gty., 3.100%, 07/15/31, 144A(b) | Baa2/BBB | 426 | 333,382 | |||||||
| CITGO Petroleum Corp., Sr. Sec. Notes, 7.000%, 06/15/25, 144A(b) | B3/B+ | 248 | 236,971 | |||||||
| Endeavor Energy Resources LP, Sr. Unsec. Notes, 5.750%, 01/30/28, 144A(b) | Ba2/BB+ | 473 | 451,124 | |||||||
| EQT Corp., Sr. Unsec. Notes, 5.678%, 10/01/25(b) | Ba1/BBB- | 124 | 123,362 | |||||||
| Exxon Mobil Corp., Sr. Unsec. Notes, 4.227%, 03/19/40(b) | Aa2/AA- | 1,402 | 1,217,438 | |||||||
| Parkland Corp., Co. Gty., 4.500%, 10/01/29, 144A(b) | Ba3/BB | 667 | 538,511 | |||||||
| Petroleos Mexicanos, Co. Gty., 5.950%, 01/28/31(b) | B1/BBB | 552 | 372,821 | |||||||
| Petroleos Mexicanos, Co. Gty., 6.950%, 01/28/60(b) | B1/BBB | 195 | 108,011 | |||||||
| Saudi Arabian Oil Co., Sr. Unsec. Notes, 2.250%, 11/24/30, 144A(b) | A1/NA | 853 | 687,931 | |||||||
| Valero Energy Corp., Sr. Unsec. Notes, 8.750%, 06/15/30 | Baa2/BBB | 1,000 | 1,164,424 | |||||||
| Valero Energy Corp., Sr. Unsec. Notes, 4.000%, 06/01/52(b) | Baa2/BBB | 215 | 155,151 | |||||||
| 5,389,126 | ||||||||||
| OIL & GAS SERVICES (0.16%) | ||||||||||
| Baker Hughes Holdings LLC, Sr. Unsec. Notes, 2.061%, 12/15/26(b) | A3/A- | 326 | 286,661 | |||||||
| PACKAGING & CONTAINERS (0.51%) | ||||||||||
| Ardagh Metal Packaging Finance USA LLC, Sr. Sec. Notes, 6.000%, 06/15/27, 144A(b) | Ba2/BB | 200 | 188,341 | |||||||
| Ardagh Metal Packaging Finance USA LLC, Sr. Unsec. Notes, 4.000%, 09/01/29, 144A(b) | B3/B+ | 200 | 147,000 | |||||||
| LABL, Inc., Sr. Sec. Notes, 5.875%, 11/01/28, 144A(b) | B2/B- | 173 | 140,112 | |||||||
| Sealed Air Corp., Sr. Sec. Notes, 1.573%, 10/15/26, 144A(b) | Baa2/BBB- | 524 | 438,885 | |||||||
| 914,338 | ||||||||||
The accompanying notes are an integral part of these financial statements.
| 11 |
SCHEDULE OF INVESTMENTS (Unaudited) — continued
| Moody’s/ Standard & Poor’s Rating(a) | Principal Amount (000’s) | Value (Note1) | ||||||||
| CORPORATE DEBT SECURITIES (Continued) | ||||||||||
| PHARMACEUTICALS (1.12%) | ||||||||||
| AbbVie, Inc., Sr. Unsec. Notes, 4.050%, 11/21/39(b) | Baa2/BBB+ | $ | 615 | $ | 496,086 | |||||
| Astrazeneca Finance LLC, Co. Gty., 1.750%, 05/28/28(b) | A3/A- | 475 | 399,438 | |||||||
| Organon & Co, Sr. Sec. Notes, 4.125%, 04/30/28, 144A(b) | Ba2/BB | 200 | 170,106 | |||||||
| Takeda Pharmaceutical Co., Ltd., Sr. Unsec. Notes, 5.000%, 11/26/28(b) | Baa2/BBB+ | 500 | 484,265 | |||||||
| Takeda Pharmaceutical Co., Ltd., Sr. Unsec. Notes, 3.175%, 07/09/50(b) | Baa2/BBB+ | 684 | 453,837 | |||||||
| 2,003,732 | ||||||||||
| PIPELINES (6.73%) | ||||||||||
| Cheniere Energy Partners LP, Co. Gty., 3.250%, 01/31/32(b) | Ba1/BB+ | 91 | 70,687 | |||||||
| DT Midstream, Inc., Sr. Sec. Notes, 4.300%, 04/15/32, 144A(b) | Baa2/BBB- | 432 | 370,290 | |||||||
| EIG Pearl Holdings Sarl, Sr. Sec. Notes, 4.387%, 11/30/46, 144A | A1/NA | 700 | 493,704 | |||||||
| Enbridge, Inc., Sub. Notes, (3M LIBOR + 3.890%), 6.000%, 01/15/77(b),(c) | Baa3/BBB- | 750 | 670,887 | |||||||
| Energy Transfer LP, Sr. Unsec. Notes, 3.750%, 05/15/30(b) | Baa3/BBB- | 398 | 336,881 | |||||||
| Enterprise Products Operating LLC, Co. Gty., (3M LIBOR + 2.570%), 5.375%, 02/15/78(b),(c) | Baa2/BBB- | 342 | 256,780 | |||||||
| Florida Gas Transmission Co. LLC, Sr. Unsec. Notes, 9.190%, 11/01/24, 144A | Baa2/BBB+ | 30 | 29,927 | |||||||
| Global Partners LP, Co. Gty., 7.000%, 08/01/27(b) | B2/B+ | 1,076 | 979,730 | |||||||
| Hess Midstream Operations LP, Co. Gty., 5.500%, 10/15/30, 144A(b) | Ba2/BB+ | 70 | 60,092 | |||||||
| Howard Midstream Energy Partners LLC, Sr. Unsec. Notes, 6.750%, 01/15/27, 144A(b) | B3/B | 110 | 98,116 | |||||||
| Kinder Morgan, Inc., Co. Gty., 8.050%, 10/15/30 | Baa2/BBB | 1,000 | 1,067,771 | |||||||
| Kinder Morgan, Inc., Co. Gty., 5.550%, 06/01/45(b) | Baa2/BBB | 1,755 | 1,529,837 | |||||||
| MPLX LP, Sr. Unsec. Notes, 4.250%, 12/01/27(b) | Baa2/BBB | 901 | 839,218 | |||||||
| MPLX LP, Sr. Unsec. Notes, 5.500%, 02/15/49(b) | Baa2/BBB | 694 | 589,093 | |||||||
| MPLX LP, Sr. Unsec. Notes, 4.900%, 04/15/58(b) | Baa2/BBB | 561 | 418,709 | |||||||
| NGPL PipeCo LLC, Sr. Unsec. Notes, 7.768%, 12/15/37, 144A | Baa3/BBB- | 880 | 888,984 | |||||||
| Panhandle Eastern Pipe Line Co. LP, Sr. Unsec. Notes, 7.000%, 07/15/29 | Baa3/BBB- | 1,000 | 1,007,592 | |||||||
| Targa Resources Partners LP, Co. Gty., 5.500%, 03/01/30(b) | Baa3/BBB- | 1,177 | 1,062,125 | |||||||
| Transcontinental Gas Pipe Line Co. LLC, Sr. Unsec. Notes, 3.950%, 05/15/50(b) | Baa1/BBB | 384 | 283,386 | |||||||
| Williams Cos., Inc., Sr. Unsec. Notes, 7.500%, 01/15/31 | Baa2/BBB | 911 | 976,831 | |||||||
| 12,030,640 | ||||||||||
| REITS (1.78%) | ||||||||||
| EPR Properties, Sr. Unsec. Notes, 3.600%, 11/15/31(b) | Baa3/BBB- | 533 | 380,640 | |||||||
| Extra Space Storage LP, Co. Gty., 3.900%, 04/01/29(b) | Baa2/BBB | 371 | 330,467 | |||||||
| Extra Space Storage LP, Co. Gty., 2.350%, 03/15/32(b) | Baa2/BBB | 267 | 196,626 | |||||||
| GLP Capital LP, Co. Gty., 3.250%, 01/15/32(b) | Ba1/BBB- | 154 | 115,923 | |||||||
| Iron Mountain, Inc., Co. Gty., 5.000%, 07/15/28, 144A(b) | Ba3/BB- | 59 | 50,740 | |||||||
| SBA Tower Trust, 2.593%, 10/15/31, 144A(b) | A2/NA | 454 | 354,239 | |||||||
| Scentre Group Trust 2, Co. Gty., (H15T5Y + 4.379%), 4.750%, 09/24/80, 144A(b),(c) | Baa1/BBB+ | 2,007 | 1,723,602 | |||||||
| WEA Finance LLC, Co. Gty., 4.625%, 09/20/48, 144A(b) | Baa2/BBB+ | 36 | 25,029 | |||||||
| 3,177,266 | ||||||||||
| RETAIL (1.01%) | ||||||||||
| Macy’s Retail Holdings LLC, Co. Gty., 5.875%, 03/15/30, 144A(b) | Ba2/BB | 314 | 248,358 | |||||||
| Murphy Oil USA, Inc., Co. Gty., 3.750%, 02/15/31, 144A(b) | Ba2/BB+ | 119 | 95,638 | |||||||
| Starbucks Corp., Sr. Unsec. Notes, 4.450%, 08/15/49(b) | Baa1/BBB+ | 1,781 | 1,455,554 | |||||||
| 1,799,550 | ||||||||||
| SEMICONDUCTORS (1.25%) | ||||||||||
| Broadcom, Inc., Co. Gty., 3.750%, 02/15/51, 144A(b) | Baa3/BBB- | 166 | 108,877 | |||||||
| Broadcom, Inc., Sr. Unsec. Notes, 3.469%, 04/15/34, 144A(b) | Baa3/BBB- | 1,655 | 1,241,000 | |||||||
| Broadcom, Inc., Sr. Unsec. Notes, 3.187%, 11/15/36, 144A(b) | Baa3/BBB- | 1,109 | 758,017 | |||||||
| Micron Technology, Inc., Sr. Unsec. Notes, 2.703%, 04/15/32(b) | Baa3/BBB- | 164 | 119,111 | |||||||
| 2,227,005 | ||||||||||
| SOFTWARE (1.60%) | ||||||||||
| Oracle Corp., Sr. Unsec. Notes, 2.300%, 03/25/28(b) | Baa2 -/BBB | 1,130 | 944,250 | |||||||
The accompanying notes are an integral part of these financial statements.
| 12 |
SCHEDULE OF INVESTMENTS (Unaudited) — continued
| Moody’s/ Standard & Poor’s Rating(a) | Principal Amount (000’s) | Value (Note1) | ||||||||
| CORPORATE DEBT SECURITIES (Continued) | ||||||||||
| SOFTWARE (Continued) | ||||||||||
| Oracle Corp., Sr. Unsec. Notes, 3.650%, 03/25/41(b) | Baa2 -/BBB | $ | 1,745 | $ | 1,185,769 | |||||
| Take-Two Interactive Software, Inc., Sr. Unsec. Notes, 3.700%, 04/14/27(b) | Baa2/BBB | 165 | 153,240 | |||||||
| VMware, Inc., Sr. Unsec. Notes, 2.200%, 08/15/31(b) | Baa3/BBB- | 788 | 573,291 | |||||||
| 2,856,550 | ||||||||||
| TELECOMMUNICATIONS (3.13%) | ||||||||||
| AT&T, Inc., Sr. Unsec. Notes, 4.500%, 05/15/35(b) | Baa2/BBB | 515 | 445,178 | |||||||
| AT&T, Inc., Sr. Unsec. Notes, 4.750%, 05/15/46(b) | Baa2/BBB | 425 | 356,257 | |||||||
| AT&T, Inc., Sr. Unsec. Notes, 3.550%, 09/15/55(b) | Baa2/BBB | 2,195 | 1,439,690 | |||||||
| Deutsche Telekom International Finance BV, Co. Gty., 8.750%, 06/15/30(f) | Baa1/BBB | 2,000 | 2,290,597 | |||||||
| Frontier Communications Holdings LLC, Sr. Sec. Notes, 5.000%, 05/01/28, 144A(b) | B3/B | 255 | 218,841 | |||||||
| Verizon Communications, Inc., Sr. Unsec. Notes, 2.550%, 03/21/31(b) | Baa1/BBB+ | 457 | 365,277 | |||||||
| Verizon Communications, Inc., Sr. Unsec. Notes, 3.550%, 03/22/51(b) | Baa1/BBB+ | 674 | 474,004 | |||||||
| 5,589,844 | ||||||||||
| TRANSPORTATION (0.55%) | ||||||||||
| BNSF Funding Trust I, Co. Gty., (3M LIBOR + 2.350%), 6.613%, 12/15/55(b),(c) | Baa2/A | 250 | 234,004 | |||||||
| Simpar Europe SA, Co. Gty., 5.200%, 01/26/31, 144A(b) | NA/BB- | 544 | 383,068 | |||||||
| Union Pacific Corp., Sr. Unsec. Notes, 3.839%, 03/20/60(b) | A3/A- | 503 | 372,265 | |||||||
| 989,337 | ||||||||||
| TOTAL CORPORATE DEBT SECURITIES (Cost of $156,162,556) | 137,463,136 | |||||||||
| ASSET-BACKED SECURITIES (12.51%) | ||||||||||
| Aligned Data Centers Issuer LLC, Series 2021-1A, Class A2, 1.937%, 08/15/46, 144A(b) | NA/A- | 904 | 771,010 | |||||||
| Amur Equipment Finance Receivables XI LLC, Series 2022-2A, Class A2, 5.300%, 06/21/28, 144A(b) | Aaa/NA | 100 | 99,396 | |||||||
| Antares CLO, Ltd., Series 2017-1A, Class CR, (3M LIBOR + 2.700%), 5.410%, 04/20/33, 144A(b),(e) | NA/A | 1,092 | 959,400 | |||||||
| Apidos CLO XXXIX, Series 2022-39A, Class A1, (TSFR3M + 1.300%), 2.039%, 04/21/35, 144A(b),(e) | Aaa/AA+ | 950 | 901,908 | |||||||
| Blackbird Capital Aircraft, Series 2021-1A, Class B, 3.446%, 07/15/46, 144A(b) | Baa1/NA | 348 | 261,485 | |||||||
| Cerberus Loan Funding XXXVII LP, Series 2022-1A, Class A1, (TSFR3M + 1.780%), 4.108%, 04/15/34, 144A(b),(e) | Aaa/NA | 1,500 | 1,426,209 | |||||||
| CF Hippolyta Issuer LLC, Series 2020-1, Class A1, 1.690%, 07/15/60, 144A(b) | NA/AA- | 626 | 556,108 | |||||||
| DataBank Issuer, Series 2021-2A, Class A2, 2.400%, 10/25/51, 144A(b) | NA/NA | 583 | 502,047 | |||||||
| DB Master Finance LLC, Series 2021-1A, Class A2I, 2.045%, 11/20/51, 144A(b) | NA/BBB | 603 | 513,971 | |||||||
| Domino’s Pizza Master Issuer LLC, Series 2021-1A, Class A2I, 2.662%, 04/25/51, 144A(b) | NA/BBB+ | 545 | 450,816 | |||||||
| DRB Prime Student Loan Trust, Series 2017-A, Class A2B, 2.850%, 05/27/42, 144A(b) | NA/NA | 61 | 60,884 | |||||||
| Eaton Vance CLO, Ltd., Series 2020-1A, Class AR, (3M LIBOR + 1.170%), 3.682%, 10/15/34, 144A(b),(e) | NA/AAA | 1,500 | 1,435,437 | |||||||
| Flexential Issuer, Series 2021-1A, Class A2, 3.250%, 11/27/51, 144A(b) | NA/NA | 555 | 482,832 | |||||||
| Ford Credit Auto Owner Trust, Series 2022-C, Class B, 5.030%, 02/15/28(b) | Aaa/AA+ | 565 | 559,509 | |||||||
| Fortress Credit Opportunities IX CLO, Ltd., Series 2017-9A, Class A1TR, (3M LIBOR + 1.550%), 4.062%, 10/15/33, 144A(b),(e) | NA/AAA | 600 | 567,987 | |||||||
| Golub Capital Partners CLO 36m, Ltd., Series 2018-36A, Class C, (3M LIBOR + 2.100%), 4.932%, 02/05/31, 144A(b),(e) | NA/A | 2,250 | 2,031,014 | |||||||
| ITE Rail Fund Levered LP, Series 2021-1A, Class A, 2.250%, 02/28/51, 144A(b) | NA/A | 188 | 160,183 | |||||||
| IVY Hill Middle Market Credit Fund XII, Ltd., Series 12A, Class BR, (3M LIBOR + 2.900%), 5.610%, 07/20/33, 144A(b),(e) | NA/A- | 866 | 756,933 | |||||||
| LoanCore Issuer, Ltd., Series 2018-CRE1, Class A, (1M LIBOR + 1.130%), 3.948%, 05/15/28, 144A(b),(e) | Aaa/AA+ | 6 | 6,136 | |||||||
| Marlette Funding Trust, Series 2022-3A, Class A, 5.180%, 11/15/32, 144A(b) | NA/NA | 129 | 128,469 | |||||||
| MCF CLO IX, Ltd., Series 2019-1A, Class A1R, (TSFR3M + 1.500%), 3.981%, 07/17/31, 144A(b),(e) | NA/AAA | 556 | 540,397 | |||||||
| MF1, Ltd., Series 2021-FL7, Class AS, (1M LIBOR + 1.450%), 4.443%, 10/16/36, 144A(b),(e) | NA/NA | 923 | 885,607 | |||||||
The accompanying notes are an integral part of these financial statements.
| 13 |
SCHEDULE OF INVESTMENTS (Unaudited) — continued
| Moody’s/ Standard & Poor’s Rating(a) | Principal Amount (000’s) | Value (Note1) | ||||||||
| ASSET-BACKED SECURITIES (Continued) | ||||||||||
| MF1, Ltd., Series 2022-FL8, Class C, (SOFRRATE 30 Day Average + 2.200%), 4.484%, 02/19/37, 144A(b),(e) | NA/NA | $ | 448 | $ | 427,201 | |||||
| Navient Private Education Refi Loan Trust, Series 2021-A, Class A, 0.840%, 05/15/69, 144A(b) | NA/AAA | 113 | 99,414 | |||||||
| Neuberger Berman Loan Advisers CLO 47, Ltd., Series 2022-47A, Class A, (TSFR3M + 1.300%), 3.598%, 04/14/35, 144A(b),(e) | Aaa/NA | 937 | 896,791 | |||||||
| New Economy Assets Phase 1 Sponsor LLC, Series 2021-1, Class A1, 1.910%, 10/20/61, 144A(b) | NA/AA- | 1,063 | 899,791 | |||||||
| PMT Issuer Trust - FMSR, Series 2021-FT1, Class A, (1M LIBOR + 3.000%), 6.084%, 03/25/26, 144A(b),(e) | NA/NA | 566 | 528,680 | |||||||
| Purewest Funding LLC, Series 2021-1, Class A1, 4.091%, 12/22/36, 144A(b) | NA/NA | 236 | 223,980 | |||||||
| Santander Drive Auto Receivables Trust, Series 2022-5, Class C, 4.740%, 10/16/28(b) | Aa1/A | 352 | 342,725 | |||||||
| Slam, Ltd., Series 2021-1A, Class A, 2.434%, 06/15/46, 144A(b) | A1/NA | 1,240 | 1,017,420 | |||||||
| SMB Private Education Loan Trust, Series 2017-B, Class A2B, (1M LIBOR + 0.750%), 3.568%, 10/15/35, 144A(b),(e) | Aaa/AAA | 341 | 336,949 | |||||||
| Sofi Professional Loan Program LLC, Series 2017-C, Class B, 3.560%, 07/25/40, 144A(b),(e) | NA/AA+ | 1,099 | 1,023,085 | |||||||
| Textainer Marine Containers VII, Ltd., Series 2021-1A, Class A, 1.680%, 02/20/46, 144A(b) | NA/A | 900 | 761,073 | |||||||
| TIF Funding II LLC, Series 2021-1A, Class A, 1.650%, 02/20/46, 144A(b) | NA/A | 480 | 397,194 | |||||||
| United States Small Business Administration, Series 2010-20F, Class 1, 3.880%, 06/01/30 | Aaa/AA+ | 43 | 42,289 | |||||||
| Willis Engine Structured Trust IV, Series 2018-A, Class A, 4.750%, 09/15/43, 144A(b),(g) | NA/A | 1,132 | 813,409 | |||||||
| Willis Engine Structured Trust VI, Series 2021-A, Class A, 3.104%, 05/15/46, 144A(b) | NA/NA | 643 | 470,915 | |||||||
| TOTAL ASSET-BACKED SECURITIES (Cost of $25,004,461) | 22,338,654 | |||||||||
| COMMERCIAL MORTGAGE-BACKED SECURITIES (0.67%) | ||||||||||
| Angel Oak Mortgage Trust I LLC, Series 2019-2, Class A1, 3.628%, 03/25/49, 144A(b),(e) | NA/NA | 1 | 636 | |||||||
| BXHPP Trust, Series 2021-FILM, Class C, (1M LIBOR + 1.100%), 3.918%, 08/15/36, 144A(b),(e) | NA/NA | 167 | 154,261 | |||||||
| New Residential Mortgage Loan Trust, Series 2022-NQM1, Class A1, 2.277%, 01/25/26, 144A(b),(e) | NA/NA | 962 | 814,253 | |||||||
| New Residential Mortgage Loan Trust, Series 2021-NQ2R, Class A1, 0.941%, 10/25/58, 144A(b),(e) | NA/NA | 235 | 220,377 | |||||||
| TOTAL COMMERCIAL MORTGAGE-BACKED SECURITIES (Cost of $1,364,920) | 1,189,527 | |||||||||
| RESIDENTIAL MORTGAGE-BACKED SECURITIES (0.12%) | ||||||||||
| FHLMC Pool #A15675, 6.000%, 11/01/33 | Aaa/AA+ | 40 | 42,431 | |||||||
| FNMA Pool #754791, 6.500%, 12/01/33 | Aaa/AA+ | 118 | 121,592 | |||||||
| FNMA Pool #763852, 5.500%, 02/01/34 | Aaa/AA+ | 54 | 54,877 | |||||||
| GNSF Pool #417239, 7.000%, 02/15/26. | Aaa/AA+ | 2 | 1,599 | |||||||
| GNSF Pool #780374, 7.500%, 12/15/23(h) | Aaa/AA+ | 0 | 139 | |||||||
| TOTAL RESIDENTIAL MORTGAGE-BACKED SECURITIES (Cost of $204,056) | 220,638 | |||||||||
| MUNICIPAL BONDS (1.30%) | ||||||||||
| City of San Francisco CA Public Utilities Commission Water Revenue, Build America Bonds, 6.000%, 11/01/40 | Aa2/AA- | 145 | 155,932 | |||||||
| State of California, Build America Bonds, GO, 7.625%, 03/01/40 | Aa2/AA- | 1,500 | 1,860,767 | |||||||
| University of Michigan, 3.599%, 04/01/47 | Aaa/AAA | 365 | 303,156 | |||||||
| TOTAL MUNICIPAL BONDS (Cost of $2,041,467) | 2,319,855 | |||||||||
| U.S. TREASURY OBLIGATIONS (5.16%) | ||||||||||
| United States Treasury Bonds, 2.375%, 02/15/42 | Aaa/AA+ | 169 | 129,293 | |||||||
| United States Treasury Bonds, 3.250%, 05/15/42 | Aaa/AA+ | 637 | 565,526 | |||||||
| United States Treasury Bonds, 1.250%, 05/15/50 | Aaa/AA+ | 4,254 | 2,381,797 | |||||||
| United States Treasury Bonds, 2.875%, 05/15/52 | Aaa/AA+ | 553 | 463,913 | |||||||
| United States Treasury Bonds, 3.000%, 08/15/52 | Aaa/AA+ | 77 | 66,842 | |||||||
| United States Treasury Notes, 0.500%, 04/30/27 | Aaa/AA+ | 466 | 396,695 | |||||||
| United States Treasury Notes, 0.500%, 06/30/27 | Aaa/AA+ | 45 | 38,286 | |||||||
| United States Treasury Notes, 2.250%, 08/15/27 | Aaa/AA+ | 519 | 477,255 | |||||||
The accompanying notes are an integral part of these financial statements.
| 14 |
SCHEDULE OF INVESTMENTS (Unaudited) — continued
Moody’s/ Standard & Poor’s Rating(a) | Principal Amount (000’s) | Value (Note1) | ||||||||
| U.S. TREASURY OBLIGATIONS (Continued) | ||||||||||
| United States Treasury Notes, 0.625%, 11/30/27 | Aaa/AA+ | $ | 623 | $ | 523,594 | |||||
| United States Treasury Notes, 1.250%, 09/30/28 | Aaa/AA+ | 231 | 196,747 | |||||||
| United States Treasury Notes, 2.375%, 03/31/29 | Aaa/AA+ | 845 | 765,566 | |||||||
| United States Treasury Notes, 3.250%, 06/30/29 | Aaa/AA+ | 195 | 186,645 | |||||||
| United States Treasury Notes, 1.625%, 08/15/29 | Aaa/AA+ | 95 | 81,780 | |||||||
| United States Treasury Notes, 3.125%, 08/31/29 | Aaa/AA+ | 110 | 104,543 | |||||||
| United States Treasury Notes, 1.875%, 02/15/32 | Aaa/AA+ | 438 | 371,153 | |||||||
| United States Treasury Notes, 2.875%, 05/15/32 | Aaa/AA+ | 999 | 923,387 | |||||||
| United States Treasury Notes, 2.750%, 08/15/32 | Aaa/AA+ | 1,701 | 1,554,280 | |||||||
| TOTAL U.S. TREASURY OBLIGATIONS (Cost of $10,230,468) | 9,227,302 | |||||||||
| GOVERNMENT BONDS (1.63%) | ||||||||||
| Hungary Government International Bond, Sr. Unsec. Notes, 5.500%, 06/16/34, 144A | Baa2/BBB | 410 | 345,773 | |||||||
| Hydro-Quebec, 8.250%, 04/15/26 | Aa2/AA- | 1,550 | 1,728,502 | |||||||
| Korea National Oil Corp., Sr. Unsec. Notes, 1.750%, 04/18/25, 144A | Aa2/AA | 208 | 191,310 | |||||||
| Mexico Government International Bond, Sr. Unsec. Notes, 5.000%, 04/27/51(b) | Baa2/BBB | 711 | 546,795 | |||||||
| Ukraine Government International Bond, Sr. Unsec. Notes, 7.253%, 03/15/35, 144A | NA/CCC+ | 551 | 101,181 | |||||||
| TOTAL GOVERNMENT BONDS (Cost of $3,347,357) | 2,913,561 | |||||||||
| Shares | ||||||||||
| PREFERRED STOCKS (1.12%) | ||||||||||
| CoBank ACB, Series F, (3M LIBOR + 4.557%), 6.250%, 10/01/22(b),(c),(d) | NA/BBB+ | 20,000 | 2,000,000 | |||||||
| TOTAL INVESTMENTS (99.47%) (Cost of $200,440,285) | 177,672,673 | |||||||||
| OTHER ASSETS AND LIABILITIES (0.53%) | 950,841 | |||||||||
| NET ASSETS (100.00%) | $ | 178,623,514 | ||||||||
At September 30, 2022, the Fund had the following open futures contracts:
| Long Futures Outstanding | Expiration Month | Number of Contracts | Notional Amount | Value | Unrealized Appreciation (Depreciation) | |||||||||||
| U.S. Treasury 2-Year Notes | 12/22 | 9 | $ | 1,862,914 | $ | 1,848,516 | $ | (14,398 | ) | |||||||
| U.S. Treasury Long Bonds | 12/22 | 136 | 18,474,223 | 17,191,250 | (1,282,973 | ) | ||||||||||
| U.S. Treasury Ultra Bonds | 12/22 | 30 | 4,411,311 | 4,110,000 | (301,311 | ) | ||||||||||
| (1,598,682 | ) | |||||||||||||||
| Short Futures Outstanding | ||||||||||||||||
| U.S. Treasury 10-Year Notes | 12/22 | 28 | (3,254,668 | ) | (3,137,750 | ) | 116,918 | |||||||||
| U.S. Treasury 5-Year Notes | 12/22 | 137 | (15,016,092 | ) | (14,728,570 | ) | 287,522 | |||||||||
| U.S. Treasury Ultra 10-Year Notes | 12/22 | 128 | (16,028,153 | ) | (15,166,001 | ) | 862,152 | |||||||||
| 1,266,592 | ||||||||||||||||
| Net unrealized depreciation on open futures contracts | $ | (332,090 | ) | |||||||||||||
| (a) | Ratings for debt securities are unaudited. All ratings are as of September 30, 2022 and may have changed subsequently. |
| (b) | This security is callable. |
| (c) | Fixed to floating rate security. Fixed rate indicated is rate effective at September 30, 2022. Security will convert at a future date to a floating rate of reference rate and spread in the description above. |
| (d) | Security is perpetual. Date shown is next call date. |
| (e) | Variable rate security. Rate indicated is rate effective at September 30, 2022. |
| (f) | Multi-Step Coupon. Rate disclosed is as of September 30, 2022. |
The accompanying notes are an integral part of these financial statements.
| 15 |
SCHEDULE OF INVESTMENTS (Unaudited) — continued
| (g) | Denotes a step-up bond. The rate indicated is the current coupon as of September 30, 2022. |
| (h) | Principal amount less than $1,000. |
| 144A | Securities were purchased pursuant to Rule 144A under the Securities Act of 1933 and may not be resold subject to that rule except to qualified institutional buyers. At September 30, 2022, these securities amounted to $66,143,937 or 37.03% of net assets. |
Legend
Certs. – Certificates
CLO – Collateralized Loan Obligation
Co. Gty. – Company Guaranty
FHLMC – Federal Home Loan Mortgage Corporation
FNMA – Federal National Mortgage Association
GNSF – Government National Mortgage Association (Single Family)
GO – Government Obligation
H15T5Y – US Treasury Yield Curve Rate T Note Constant Maturity 5 Year
Jr. – Junior
LIBOR – London Interbank Offered Rate
LLC – Limited Liability Company
LP – Limited Partnership
Ltd. – Limited
PLC – Public Limited Company
REIT – Real Estate Investment Trust
Sec. – Secured
SOFRRATE – Secured Overnight Financing Rate
Sr. – Senior
Sub. – Subordinated
SW5 – 5-year USD Swap Semiannual 30/360
TSFR3M – 3 Month Term Secured Overnight Financing Rate
Unsec. – Unsecured
The accompanying notes are an integral part of these financial statements.
| 16 |
SCHEDULE OF INVESTMENTS (Unaudited) — continued
Following is a description of the valuation techniques applied to the Fund’s major categories of assets measured at fair value on a recurring basis as of September 30, 2022.
| Assets: | Total Market Value at 09/30/22 | Level 1 Quoted Price | Level 2 Significant Observable Inputs | Level 3 Significant Unobservable Inputs | ||||||||||||
| LONG-TERM INVESTMENTS | ||||||||||||||||
| CORPORATE DEBT SECURITIES | $ | 137,463,136 | $ | — | $ | 137,463,136 | $ | — | ||||||||
| U.S. TREASURY OBLIGATIONS | 9,227,302 | — | 9,227,302 | — | ||||||||||||
| MUNICIPAL BONDS | 2,319,855 | — | 2,319,855 | — | ||||||||||||
| GOVERNMENT BONDS | 2,913,561 | — | 2,913,561 | — | ||||||||||||
| COMMERCIAL MORTGAGE-BACKED SECURITIES | 1,189,527 | — | 1,189,527 | — | ||||||||||||
| ASSET-BACKED SECURITIES | 22,338,654 | — | 22,338,654 | — | ||||||||||||
| PREFERRED STOCKS | 2,000,000 | 2,000,000 | — | — | ||||||||||||
| RESIDENTIAL MORTGAGE-BACKED SECURITIES | 220,638 | — | 220,638 | — | ||||||||||||
| DERIVATIVES | ||||||||||||||||
| SHORT FUTURES | 1,266,592 | 1,266,592 | — | — | ||||||||||||
| TOTAL ASSETS | $ | 178,939,265 | $ | 3,266,592 | $ | 175,672,673 | $ | — | ||||||||
| Liabilities: | ||||||||||||||||
| FUTURES CONTRACTS | $ | 1,598,682 | $ | 1,598,682 | $ | — | $ | — | ||||||||
The accompanying notes are an integral part of these financial statements.
| 17 |
STATEMENT OF ASSETS AND LIABILITIES (Unaudited)
September 30, 2022
| Assets: | ||||
| Investment in securities, at value (amortized cost $200,440,285) (Note 1) | $ | 177,672,673 | ||
| Cash | 607,709 | |||
| Interest receivable | 2,200,496 | |||
| Receivable from broker—variation margin on open futures contracts | 1,266,592 | |||
| Dividend receivable | 31,250 | |||
| Deposits with brokers for open futures contracts | 676,694 | |||
| TOTAL ASSETS | 182,455,414 | |||
| Liabilities: | ||||
| Dividend payable (Note 9) | 1,928,414 | |||
| Payable to broker—variation margin on open futures contracts | 1,598,682 | |||
| Securities purchased | 124,000 | |||
| Management fees payable | 69,655 | |||
| Audit fees payable | 44,090 | |||
| Printing fees payable | 20,925 | |||
| Administration and accounting fees payable | 13,864 | |||
| Custodian fees payable | 11,578 | |||
| Transfer agency fees payable | 1,980 | |||
| Accrued fees payable | 18,712 | |||
| TOTAL LIABILITIES | 3,831,900 | |||
| Net assets: (equivalent to $16.67 per share based on 10,713,411 shares of capital stock outstanding) | $ | 178,623,514 | ||
| NET ASSETS consisted of: | ||||
| Par value | $ | 107,134 | ||
| Capital paid-in | 206,647,413 | |||
| Distributable earnings | (28,131,033 | ) | ||
| $ | 178,623,514 |
The accompanying notes are an integral part of these financial statements.
| 18 |
STATEMENT OF OPERATIONS (Unaudited)
For the six months ended September 30, 2022
| Investment Income: | ||||||||
| Interest | $ | 4,459,041 | ||||||
| Dividends | 62,500 | |||||||
| Total Investment Income | 4,521,541 | |||||||
| Expenses: | ||||||||
| Investment advisory fees (Note 4) | $ | 439,031 | ||||||
| Administration fees | 85,541 | |||||||
| Trustees’ fees (Note 4) | 76,562 | |||||||
| Legal fees and expenses | 51,051 | |||||||
| Reports to shareholders | 25,524 | |||||||
| Custodian fees | 18,811 | |||||||
| Insurance | 17,991 | |||||||
| NYSE fee | 15,463 | |||||||
| Transfer agent fees | 14,957 | |||||||
| Audit fees | 14,590 | |||||||
| ICI fee | 9,046 | |||||||
| Interest expense (Note 6) | 1,834 | |||||||
| Miscellaneous | 42,269 | |||||||
| Total Expenses | 812,670 | |||||||
| Net Investment Income | 3,708,871 | |||||||
| Realized and unrealized (loss) from: | ||||||||
| Net realized (loss) from: | ||||||||
| Investment securities | (904,002 | ) | ||||||
| Futures contracts | (275,729 | ) | ||||||
| Swap agreements | (29,404 | ) | ||||||
| Net Realized Loss | (1,209,135 | ) | ||||||
| Change in net unrealized (depreciation) of: | ||||||||
| Investment securities | (27,557,447 | ) | ||||||
| Futures contracts | (383,004 | ) | ||||||
| Change in Net Unrealized Depreciation | (27,940,451 | ) | ||||||
| Net loss on investments and futures contracts | (29,149,586 | ) | ||||||
| Net decrease in net assets resulting from operations | $ | (25,440,715 | ) | |||||
The accompanying notes are an integral part of these financial statements.
| 19 |
STATEMENTS OF CHANGES IN NET ASSETS
| Six months ended September 30, 2022 (Unaudited) | Year ended March 31, 2022 | |||||||
| Increase (decrease) in net assets: | ||||||||
| Operations: | ||||||||
| Net investment income | $ | 3,708,871 | $ | 7,536,451 | ||||
| Net realized gain (loss) | (1,209,135 | ) | 2,002,564 | |||||
| Change in unrealized depreciation | (27,940,451 | ) | (15,198,222 | ) | ||||
| Net decrease in net assets resulting from operations | (25,440,715 | ) | (5,659,207 | ) | ||||
| Distributions: | ||||||||
| From distributed earnings | (5,785,242 | ) | (12,199,801 | ) | ||||
| Fund Share Transactions: | ||||||||
| Increase from shares issued under the dividend and distribution reinvestment plan (Note 5) | — | 71,360 | ||||||
| Decrease in net assets | (31,225,957 | ) | (17,787,648 | ) | ||||
| Net Assets: | ||||||||
| Beginning of period | 209,849,471 | 227,637,119 | ||||||
| End of period | $ | 178,623,514 | $ | 209,849,471 | ||||
The accompanying notes are an integral part of these financial statements.
| 20 |
FINANCIAL HIGHLIGHTS
The table below sets forth financial data for a share of capital stock outstanding throughout each period presented.
| Six-months ended September 30, 2022 | Year ended March 31, | |||||||||||||||||||||||
| (Unaudited) | 2022 | 2021 | 2020 | 2019 | 2018 | |||||||||||||||||||
| Per Share Operating Performance | ||||||||||||||||||||||||
| Net asset value, beginning of period | $ | 19.59 | $ | 21.25 | $ | 19.67 | $ | 20.57 | $ | 20.55 | $ | 20.75 | ||||||||||||
| Net investment income | 0.35 | 0.70 | 0.77 | 0.79 | 0.85 | 0.87 | ||||||||||||||||||
| Net gain (loss) on investments and futures contracts | (2.73 | ) | (1.22 | ) | 2.10 | (0.50 | ) | (0.03 | ) | (0.03 | ) | |||||||||||||
| Total from investment operations | (2.38 | ) | (0.52 | ) | 2.87 | 0.29 | 0.82 | 0.84 | ||||||||||||||||
| Less distributions: | ||||||||||||||||||||||||
| Dividends from net investment income | (0.54 | ) | (0.80 | ) | (0.80 | ) | (0.97 | ) | (0.67 | ) | (0.80 | ) | ||||||||||||
| Distributions from net realized gains | — | (0.34 | ) | (0.49 | ) | (0.22 | ) | (0.13 | ) | (0.24 | ) | |||||||||||||
| Total distributions | (0.54 | ) | (1.14 | ) | (1.29 | ) | (1.19 | ) | (0.80 | ) | (1.04 | ) | ||||||||||||
| Net asset value, end of period | $ | 16.67 | $ | 19.59 | $ | 21.25 | $ | 19.67 | $ | 20.57 | $ | 20.55 | ||||||||||||
| Per share market price, end of period | $ | 15.37 | $ | 17.87 | $ | 20.45 | $ | 19.74 | $ | 19.22 | $ | 19.37 | ||||||||||||
| Total Investment Return(1) | ||||||||||||||||||||||||
| Based on net asset value | (12.03 | )% | (2.80 | )% | 14.71 | % | 1.51 | % | 4.52 | % | 4.26 | % | ||||||||||||
| Based on market value | (11.09 | )% | (7.87 | )% | 10.00 | % | 9.03 | % | 3.60 | % | 6.43 | % | ||||||||||||
| Ratios/Supplemental Data | ||||||||||||||||||||||||
| Net assets, end of period (000s) | $ | 178,624 | $ | 209,849 | $ | 227,637 | $ | 210,632 | $ | 220,355 | $ | 220,141 | ||||||||||||
| Ratio of expenses to average net assets (gross of waivers/reimbursements) | 0.84 | % | 0.85 | % | 0.81 | % | 0.76 | % | 0.80 | % | 0.75 | % | ||||||||||||
| Ratio of expenses to average net assets (net of waivers/reimbursements) | 0.84 | % | 0.85 | % | 0.79 | % | 0.76 | % | 0.77 | % | 0.74 | % | ||||||||||||
| Ratio of net investment income to average net assets | 3.82 | % | 3.31 | % | 3.56 | % | 3.76 | % | 4.24 | % | 4.15 | % | ||||||||||||
| Portfolio turnover rate | 20.13 | % | 51.47 | % | 88.81 | % | 59.99 | % | 63.00 | % | 55.62 | % | ||||||||||||
| Number of shares outstanding at the end of the period (in 000’s) | 10,713 | 10,713 | 10,710 | 10,710 | 10,710 | 10,710 | ||||||||||||||||||
| (1) | Total investment return is calculated assuming a purchase of common shares at the market price on the first day and a sale at the market price on the last day of the period reported. Dividends and distributions, if any, are assumed for purposes of this calculation to be reinvested at prices obtained under the Fund’s dividend reinvestment plan. Total investment return does not reflect brokerage commissions. The total investment return, if for less than a full year, is not annualized. Past performance is not a guarantee of future results. |
The accompanying notes are an integral part of these financial statements.
| 21 |
NOTES TO FINANCIAL STATEMENTS (Unaudited)
Note 1 − Significant Accounting Policies – The Insight Select Income Fund (the “Fund”), a Delaware statutory trust, is registered under the Investment Company Act of 1940, as amended (“1940 Act”), as a diversified closed-end, management investment company. The Fund’s investment objective is to seek a high rate of return, primarily from interest income and trading activity, from a portfolio principally consisting of debt securities. The Fund follows the accounting and reporting guidance under Financial Accounting Standards Board Accounting Standards Codification Topic 946, “Financial Services – Investment Companies”. The following is a summary of significant accounting policies consistently followed by the Fund in preparation of its financial statements. The policies are in conformity with generally accepted accounting principles within the United States of America (“GAAP”).
| A. | Security Valuation – In valuing the Fund’s net assets, all securities for which representative market quotations are available will be valued at the last quoted sales price on the security’s principal exchange on the day of valuation. If there are no sales of the relevant security on such day, the security will be valued at the bid price at the time of computation. For securities traded in the over-the-counter market, including listed debt and preferred securities, whose primary market is believed to be over-the-counter, the Fund uses recognized industry pricing services which are unaffiliated with Insight North America LLC (‘‘INA’’ or the ‘‘Adviser’’) - and uses broker quotes provided by market makers of securities not valued by these and other recognized pricing sources. |
In the event that market quotations are not readily available, or when such quotations are deemed not to reflect current market value, the securities will be valued at their respective fair value as determined by the Fund’s Valuation Designee pursuant to its procedures and subject to oversight by the Board. The Valuation Designee considers all relevant facts that are reasonably available when determining the fair value of a security, including but not limited to the last sale price or initial purchase price (if a when-issued security) and subsequently adjusting the value based on changes in company specific fundamentals, changes in an appropriate securities index, or changes in the value of similar securities which may be further adjusted for any discounts related to security-specific resale restrictions. When possible, observable market inputs such as unadjusted quoted prices of similar securities, observable interest rates, currency rates and yield curves are utilized. At September 30, 2022, there were no securities valued using fair value procedures.
The Fund adopted policies to comply with the SEC’s new Rule 2a-5 under the 1940 Act, which established a new regulatory framework for registered investment company fair valuation practices. The Fund’s fair value policies and procedures and valuation practices were updated prior to the rule’s required compliance date of September 8, 2022. Under Rule 2a-5, the Fund’s Board of Directors designated the Advisor as the Fund’s “Valuation Designee” to make fair value determinations.
Fair Value Measurements – The Fund has adopted authoritative fair value accounting standards which establish a definition of fair value and set out a hierarchy for measuring fair value. These standards require additional disclosures about the various inputs and valuation techniques used to develop the measurements of fair value, a discussion in changes in valuation techniques and related inputs during the period and expanded disclosure of valuation levels for major security types. These inputs are summarized in the three broad levels listed below:
| • Level 1 – | Unadjusted quoted prices in active markets for identical assets or liabilities that the Fund has the ability to access. |
| 22 |
NOTES TO FINANCIAL STATEMENTS (Unaudited) — continued
| • Level 2 – | Observable inputs other than quoted prices included in level 1 that are observable for the asset or liability, either directly or indirectly. These inputs may include quoted prices for the identical instrument on an inactive market, prices for similar instruments, interest rates, prepayment speeds, credit risk, yield curves, default rates and similar data. | |
| • Level 3 – | Unobservable inputs for the asset or liability, to the extent relevant observable inputs are not available, representing the Fund’s own assumptions about the assumptions a market participant would use in valuing the asset or liability, and would be based on the best information available. |
At the end of each calendar quarter, management evaluates the Level 1, 2 and 3 assets and liabilities for changes in liquidity, including but not limited to: whether a broker is willing to execute at the quoted price, the depth and consistency of prices from third party services, and the existence of contemporaneous, observable trades in the market. Additionally, management evaluates Level 1 and 2 assets and liabilities on a quarterly basis for changes in listings or delistings on national exchanges. Due to the inherent uncertainty of determining the fair value of investments that do not have a readily available market value, the fair value of the Fund’s investments may fluctuate from period to period. Additionally, the fair value of investments may differ significantly from the values that would have been used had a ready market existed for such investments and may differ materially from the values the Fund may ultimately realize. Further, such investments may be subject to legal and other restrictions on resale or otherwise less liquid than publicly traded securities.
Level 3 investments are categorized as Level 3 with values derived utilizing prices from prior transactions or third party pricing information without adjustment (broker quotes, pricing services and net asset values). A significant change in third party pricing information could result in a significantly lower or higher value in such Level 3 investments. As of September 30, 2022, the Fund did not hold any Level 3 securities.
When-Issued Securities — The Fund may enter into commitments to purchase securities on a forward or when-issued basis. When-issued securities are securities purchased for delivery beyond the normal settlement date at a stated price and yield. In the Fund’s case, these securities are subject to settlement within 45 days of the purchase date. The interest rate realized on these securities is fixed as of the purchase date. The Fund does not pay for such securities prior to the settlement date and no interest accrues to the Fund before settlement. These securities are subject to market fluctuation due to changes in market interest rates. The Fund will enter into these commitments with the intent of buying the security but may dispose of such security prior to settlement. At the time the Fund makes the commitment to purchase securities on a when-issued basis, it will record the transaction and thereafter reflect the value of such security purchased in determining its net asset value (‘‘NAV’’). At the time of delivery of the security, its value may be more or less than the fixed purchase price.
Futures Contracts — The Fund uses futures contracts generally to gain exposure to, or hedge against, changes in interest rates or gain exposure to, or hedge against, changes in certain asset classes. A futures contract represents a commitment for the future purchase or sale of an asset at a specified price on a specified date.
Upon entering into a futures contract, the Fund is required to deposit cash or cash equivalents with a broker in an amount equal to a certain percentage of the contract amount. This is known as the ‘‘initial margin’’ and
| 23 |
NOTES TO FINANCIAL STATEMENTS (Unaudited) — continued
subsequent payments (‘‘variation margin’’) are made or received by the Fund each day, depending on the daily fluctuation in the value of the contract. For certain futures, including foreign denominated futures, variation margin is not settled daily, but is recorded as a net variation margin payable or receivable. The daily changes in contract value are recorded as unrealized gains or losses in the Statement of Operations and the Fund recognizes a realized gain or loss when the contract is closed.
Futures contracts involve, to varying degrees, risk of loss in excess of the amounts reflected in the financial statements. In addition, there is the risk that the Fund may not be able to enter into a closing transaction because of an illiquid secondary market.
Swap Contracts — Fund may enter into swap transactions to help enhance the value of its portfolio or manage its exposure to different types of investments. Swaps are financial instruments that typically involve the exchange of cash flows between two parties on specified dates (settlement dates), where the cash flows are based on agreed-upon prices, rates, indexes, etc. The nominal amount on which the cash flows are calculated is called the notional amount. Swaps are individually negotiated and structured to include exposure to a variety of different types of investments or market factors, such as interest rates, foreign currency rates, mortgage securities, corporate borrowing rates, security prices, indexes or inflation rates.
Swap agreements may increase or decrease the overall volatility of the investments of a Fund and its share price. The performance of swap agreements may be affected by a change in the specific interest rate, currency, or other factors that determine the amounts of payments due to and from a Fund. If a swap agreement calls for payments by a Fund, the Fund must be prepared to make such payments when due. In addition, if the counterparty’s creditworthiness declines, the value of a swap agreement would be likely to decline, potentially resulting in losses.
Generally, bilateral swap agreements, OTC swaps have a fixed maturity date that will be agreed upon by the parties. The agreement can be terminated before the maturity date only under limited circumstances, such as default by one of the parties or insolvency, among others, and can be transferred by a party only with the prior written consent of the other party. A Fund may be able to eliminate its exposure under a swap agreement either by assignment or by other disposition, or by entering into an offsetting swap agreement with the same party or a similarly creditworthy party. If the counterparty is unable to meet its obligations under the contract, declares bankruptcy, defaults or becomes insolvent, a Fund may not be able to recover the money it expected to receive under the contract.
Cleared swaps are transacted through futures commission merchants that are members of central clearing-houses with the clearinghouses serving as a central counterparty. Pursuant to rules promulgated under the Dodd-Frank Act, central clearing of swap agreements is currently required for certain market participants trading certain instruments, and central clearing for additional instruments is expected to be implemented by regulators until the majority of the swaps market is ultimately subject to central clearing.
Swaps are marked-to-market daily based upon values received from third party vendors or quotations from market makers. For OTC swaps, any upfront premiums paid or received are recorded as assets or liabilities, respectively, and are shown as premium paid on swap agreements or premium received on swap agreements in the Statements of Assets and Liabilities. For swaps that are centrally cleared, initial margins, determined by each relevant clearing agency, are posted and are segregated at a broker account registered with the Com-
| 24 |
NOTES TO FINANCIAL STATEMENTS (Unaudited) — continued
modity Futures Trading Commission, or the applicable regulator. The change in value of swaps, including accruals of periodic amounts of interest to be paid or received on swaps, is recorded as unrealized appreciation or depreciation. Daily changes in the value of centrally cleared swaps are recorded in the Statements of Assets and Liabilities as receivable or payable for variation margin on swap agreements and settled daily. Upfront premiums and liquidation payments received or paid are recorded as realized gains or losses at the termination or maturity of the swap. Net periodic payments received or paid by the Fund are recorded as realized gain or loss.
A swap agreement can be a form of leverage, which can magnify the Fund’s gains or losses. In order to reduce the risk associated with leveraging, the Fund may cover its current obligations under swap agreements.
The following table sets forth the fair value and the location of the Fund’s derivative financial instruments within the Statement of Assets and Liabilities by primary risk exposure as of September 30, 2022:
Fair Value of Derivative Instruments as of September 30, 2022:
| Derivatives not accounted for as | |||
| hedging instruments under ASC 815 | Assets | Liabilities | |
| Futures — Interest Rate Contracts | $1,266,592 | $(1,598,682) |
The following table sets forth the effect of the Fund’s derivative financial instruments by primary risk exposure on the Statements of Operations for the six months ended September 30, 2022:
The Effect of Derivative Investments on the Statement of Operations for the six months ended September 30, 2022:
| Realized | Change in Net Unrealized | ||
| Derivatives not accounted for as | Gain (Loss) | Appreciation (Depreciation) | |
| hedging instruments under ASC 815 | on Derivatives | on Derivatives | |
| Futures — Interest Rate Contracts | $(275,729) | $(383,004) | |
| Swaps — Interest Rate Contracts | $ (29,404) | $ — |
The average notional value of long and short futures contracts held by the Fund throughout the period was $24,398,748 and $30,642,558, respectively. This is based on amounts held as of each quarter-end throughout the fiscal period.
The average notional value of credit default swaps contracts held by Fund throughout the period was $10,252. This is based on amounts held daily throughout the six-month period ended September 30, 2022.
| B. | Determination of Gains or Losses on Sale of Securities — Gains or losses on the sale of securities are calculated for financial reporting purposes and for federal tax purposes using the identified cost basis. The identified cost basis for financial reporting purposes differs from that used for federal tax purposes in that the amortized cost of the securities sold is used for financial reporting purposes and the original cost of the securities sold is used for federal tax purposes, except for those instances where tax regulations require the use of amortized cost. |
| 25 |
NOTES TO FINANCIAL STATEMENTS (Unaudited) — continued
| C. | Federal Income Taxes — It is the Fund’s policy to continue to comply with the requirements of the Internal Revenue Code applicable to regulated investment companies and to distribute all of its taxable income to its shareholders. Therefore, no federal income tax provision is required. |
Management has analyzed the Fund’s tax positions taken on federal income tax returns for all open tax years (tax years March 31, 2020-2022) or expected to be taken on the Fund’s 2022 tax return, and has concluded that no provision for federal income tax is required in the Fund’s financial statements. The Fund’s federal and state income and federal excise tax returns for tax years for which the applicable statutes of limitations have not expired are subject to examination by the Internal Revenue Service and state departments of revenue.
| D. | Other — Security transactions are accounted for on the trade date. Interest income is accrued daily. Premiums and discounts are amortized using the interest method. Paydown gains and losses on mortgage-backed and asset-backed securities are presented as an adjustment to interest income. Dividend income and distributions to shareholders are recorded on the ex-dividend date. |
| E. | Distributions to Shareholders and Book/Tax Differences – Distributions of net investment income will be made quarterly. Distributions of any net realized capital gains will be made annually. Income and capital gain distributions are determined in accordance with federal income tax regulations, which may differ from GAAP. These differences are primarily due to differing treatments for amortization of market premium and accretion of market discount. |
Distributions during the fiscal years ended March 31, 2022 and 2021 were characterized as follows for tax purposes:
Ordinary Income | Return of Capital | Capital Gain | Total Distribution | ||||||||||||||
| FY 2022 | $ | 10,167,036 | $ | — | $ | 2,032,765 | $ | 12,199,801 | |||||||||
| FY 2021 | $ | 10,586,870 | $ | — | $ | 3,251,566 | $ | 13,838,436 | |||||||||
At March 31, 2022, the components of distributable earnings on a tax basis were as follows:
| Total | Accumulated Ordinary Income | Undistributed Long-Term Capital Gains | Post October Loss | Net Unrealized Appreciation | |||||
| $3,094,924 | $9,784 | $645,037 | $(307,859) | $2,747,962 |
Realized net capital gains can be offset by capital loss carryforwards from prior years. As of March 31, 2022, there were no capital loss carryforwards.
Under current laws, certain capital losses realized after October 31 and certain ordinary losses realized after December 31 may be deferred and treated as occurring on the first day of the following fiscal year. For the year ended March 31, 2022, the Fund elected to defer short-term capital losses of $307,859.
At September 30, 2022, the following table shows for federal tax purposes the aggregate cost of investments, the net unrealized appreciation of those investments, the aggregate gross unrealized appreciation of all secu-
| 26 |
NOTES TO FINANCIAL STATEMENTS (Unaudited) — continued
rities with an excess of market value over tax cost and the aggregate gross unrealized depreciation of all securities with an excess of tax cost over market value:
| Cost | Gross Unrealized Appreciation | Gross Unrealized Depreciation | Net Unrealized Appreciation (Depreciation) | |||||
| Securities | $200,440,285 | $3,506,117 | $(26,273,729) | $(22,767,612) |
The difference between book basis and tax-basis unrealized appreciation is attributable primarily to the differing treatments for wash sales, amortization of market premium and accretion of market discount.
| F. | Use of Estimates in the Preparation of Financial Statements — The preparation of financial statements in conformity with GAAP requires management to make estimates and assumptions that may affect the reported amounts of assets and liabilities at the date of the financial statements and the reported amounts of revenue and expenses during the reporting period. Actual results could differ from those estimates. |
Note 2 − Portfolio Transactions — The following is a summary of the security transactions, other than short-term investments, for the six months ended September 30, 2022:
Cost of Purchases | Proceeds from Sales or Maturities | |||
| U.S. Government Securities | $22,771,806 | $18,227,155 | ||
| Other Investment Securities | $16,657,354 | $19,972,978 |
Note 3 − Capital Stock — At September 30, 2022, there were an unlimited number of shares of beneficial interest ($0.01 par value) authorized, with 10,713,411 shares issued and outstanding.
Note 4 − Investment Advisory Contract, Accounting and Administration, Custodian, Transfer Agent and Trustee Compensation — INA serves as investment adviser to the Fund. The Adviser is entitled to a monthly investment advisory fee at the annualized rate of 0.50% of the first $100,000,000 of the Fund’s average daily Managed Assets and 0.40% of the Fund’s average daily Managed Assets in excess of $100,000,000. Effective December 1, 2022, the annualized rate will be 0.50% of the first $100,000,000 of the Fund’s average daily Managed Assets, 0.40% of the Fund’s average daily Managed Assets in excess of $100,000,000 but less than $200,000,000, and 0.30% of the Fund’s average daily Managed Assets in excess of $200,000,000. The ‘‘Managed Assets’’ of the Fund shall be defined as the total assets of the Fund, less its liabilities other than Fund liabilities incurred for investment purposes.
BNY Mellon Investment Servicing (US) Inc. (‘‘BNY Mellon’’), an indirect wholly-owned subsidiary of The Bank of New York Mellon Corporation, provides accounting and administrative services to the Fund. The Bank of New York Mellon is the Fund’s custodian responsible for the custody of Fund’s assets. Computershare Investor Services (‘‘Computershare’’) is the contractual Transfer Agent to the Fund.
The Adviser is a wholly owned subsidiary of The Bank of New York Mellon Corporation. The Adviser works closely with and is administered by Insight Investment Management (Global) Limited (‘‘Insight’’), another of The Bank of New York Mellon Corporation’s investment management subsidiaries. The Adviser is subject to The Bank of New York Mellon Corporation’s Code of Conduct and various policies and procedures designed to address the potential for conflicts of interest that may arise in connection with the Adviser’s status as an affiliated person of The Bank of New York Mellon Corporation and its subsidiaries.
| 27 |
NOTES TO FINANCIAL STATEMENTS (Unaudited) — continued
The Trustees of the Fund receive an annual retainer, meeting fees and out of pocket expenses for meetings attended. The aggregate remuneration paid to the Trustees by the Fund during the six months ended September 30, 2022 was $76,562. All officers of the Fund are also officers and/or employees of the investment adviser. None of the Fund’s officers on the Statement of Operations receives compensation from the Fund.
Note 5 − Dividend and Distribution Reinvestment — In accordance with the terms of the Amended and Restated Automatic Dividend Investment Plan (the ‘‘Plan’’), for shareholders who so elect, dividends and distributions are made in the form of previously unissued Fund shares at the net asset value if on the Friday preceding the payment date (the ‘‘Valuation Date’’) the closing New York Stock Exchange price per share, plus the brokerage commissions applicable to one such share equals or exceeds the net asset value per share. However, if the net asset value is less than 95% of the market price on the Valuation Date, the shares issued will be valued at 95% of the market price. If the net asset value per share exceeds market price plus commissions, the dividend or distribution proceeds are used to purchase Fund shares on the open market for participants in the Plan. During the six months ended September 30, 2022, the Fund did not issue any shares under this Plan.
Note 6 − Committed Facility Agreement — On November 19, 2021, the Fund entered into a Committed Facility Agreement (the “Credit Agreement”) with BNP Paribas Prime Brokerage International, under which the Fund may borrow up to $125,000,000 on a revolving basis. The credit facility is secured by certain assets of the Fund in amounts required by the Credit Agreement, which are maintained in a segregated account by the Fund Custodian. As of September 30, 2022, there was no outstanding balance. All borrowings under the Credit Agreement constitute financial leverage. The Credit Agreement contains customary representations, warranties, covenants, and default provisions. The Fund is charged interest based on the Overnight Bank Funding Rate plus (i) 72 basis points (in respect of investment grade corporate bonds and US Government Securities), or (ii) 92 basis points (in respect of other securities). The Fund is at all times subject to the asset coverage requirements imposed by the Investment Company Act. With respect to these borrowings, interest expense of $1,834 is included in the Statement of Operations. On April 13, 2022, the Fund paid off the outstanding loan balance and the accrued interest of $5,004,218.
Note 7 − Principal Risks — An investment in the Fund is not a bank deposit. It is not insured or guaranteed by the Federal Deposit Insurance Corporation (FDIC) or any other government agency. It is not a complete investment program. The fund’s share price fluctuates, sometimes dramatically, which means you could lose money.
Fixed-income market risk. The market value of a fixed-income security may decline due to general market conditions that are not specifically related to a particular company, such as real or perceived adverse economic conditions, changes in the outlook for corporate earnings, changes in interest or currency rates or adverse investor sentiment generally. The fixed-income securities market can be susceptible to increases in volatility and decreases in liquidity. Liquidity can decline unpredictably in response to overall economic conditions or credit tightening. Increases in volatility and decreases in liquidity may be caused by a rise in interest rates (or the expectation of a rise in interest rates). Federal Reserve policy in response to market conditions, including with respect to interest rates, may adversely affect the value, volatility and liquidity of dividend and interest paying securities. Policy and legislative changes worldwide are affecting many aspects of financial regulation. The impact of these changes on the markets and the practical implications for market participants may not be fully known for some time.
Interest rate risk. Prices of bonds and other fixed rate fixed-income securities tend to move inversely with changes in interest rates. Typically, a rise in rates will adversely affect fixed-income securities and, accordingly, will cause the value of the Fund’s investments in these securities to decline. During periods of very low interest rates, which occur
| 28 |
NOTES TO FINANCIAL STATEMENTS (Unaudited) — continued
from time to time due to market forces or actions of governments and/or their central banks, including the Board of Governors of the Federal Reserve System in the U.S., the Fund may be subject to a greater risk of principal decline from rising interest rates. When interest rates fall, the Fund’s investments in new securities may be at lower yields and may reduce the Fund’s income. The magnitude of these fluctuations in the market price of fixed-income securities is generally greater for securities with longer effective maturities and durations because such instruments do not mature, reset interest rates or become callable for longer periods of time. The change in the value of a fixed-income security or portfolio can be approximated by multiplying its duration by a change in interest rates. For example, the market price of a fixed-income security with a duration of three years would be expected to decline 3% if interest rates rose 1%. Conversely, the market price of the same security would be expected to increase 3% if interest rates fell 1%.
Credit risk. Failure of an issuer of a security to make timely interest or principal payments when due, or a decline or perception of a decline in the credit quality of the security, can cause the security’s price to fall. The lower a security’s credit rating, the greater the chance that the issuer of the security will default or fail to meet its payment obligations.
Cybersecurity and operational risk. Cybersecurity breaches may allow an unauthorized party to gain access to Fund assets, customer data, or proprietary information, or cause the Fund or its service providers to suffer data corruption or lose operational functionality. Similar incidents affecting issuers of the Fund’s securities may negatively impact performance. Operational risk may arise from human error, error by third parties, communication errors, or technology failures, among other causes.
Derivatives risk. The Fund may utilize a variety of derivative instruments. Generally, derivatives are financial contracts whose values depend on, or are derived from, the value of an underlying asset, reference rate or index. The underlying security, measure or other instrument on which a derivative is based, or the derivative itself, may not perform as expected. In addition, derivatives are subject to a number of risks, such as liquidity risk, interest rate risk, credit risk and management risk. Derivatives are also subject to counterparty risk, which is the risk that the other party in the transaction will not fulfill its contractual obligation. Changes in the credit quality of the companies that serve as the Fund’s counterparties with respect to its derivative transactions will affect the value of those instruments. If the Fund invests in a derivative instrument, it could lose more than the principal amount invested.
Economic and market events risk. Events in the U.S. and global financial markets, including actions taken by the U.S. Federal Reserve or foreign central banks to stimulate or stabilize economic growth, may at times result in unusually high market volatility, which could negatively impact performance. Reduced liquidity in credit and fixed-income markets could adversely affect issuers worldwide. Banks and financial services companies could suffer losses if interest rates rise or economic conditions deteriorate.
| 29 |
NOTES TO FINANCIAL STATEMENTS (Unaudited) — continued
As a result of continued political tensions and armed conflicts, including the Russian invasion of Ukraine commencing in February of 2022, the extent and ultimate result of which are unknown at this time, the United States and the European Union, along with the regulatory bodies of a number of countries, have imposed economic sanctions on certain Russian corporate entities and individuals, and certain sectors of Russia’s economy, which may result in, among other things, the continued valuation of Russian currency, a downgrade in the country’s credit rating, and/or a decline in the value and liquidity of Russian securities, property or interests. These sanctions could also result in the immediate freeze of Russian securities and/or funds invested in prohibited assets, impairing the ability of the Fund to buy, sell, receive or deliver those securities and/or assets. Economic sanctions and other actions against Russian institutions, companies, and individuals resulting from the ongoing conflict may also have a substantial negative impact on other economies and securities markets both regionally and globally, as well as on companies with operations in the conflict region, the extent to which is unknown at this time.
ETF and other investment company risk. To the extent the Fund invests in pooled investment vehicles, such as ETFs and other investment companies, the Fund will be affected by the investment policies, practices and performance of such entities in direct proportion to the amount of assets the Fund has invested therein. The risks of investing in other investment companies, including ETFs, typically reflect the risks associated with the types of instruments in which the investment companies invest. When the Fund invests in an ETF or other investment company, shareholders of the Fund will bear indirectly their proportionate share of the expenses of the ETF or other investment company (including management fees) in addition to the expenses of the Fund.
Foreign investment risk. To the extent the Fund invests in foreign securities, the Fund’s performance will be influenced by political, social and economic factors affecting investments in foreign issuers. Special risks associated with investments in foreign issuers include exposure to currency fluctuations, less liquidity, less developed or less efficient trading markets, lack of comprehensive company information, political and economic instability and differing auditing and legal standards. Investments denominated in foreign currencies are subject to the risk that such currencies will decline in value relative to the U.S. dollar and affect the value of these investments held by the Fund.
Government securities risk. Not all obligations of the U.S. government, its agencies and instrumentalities are backed by the full faith and credit of the U.S. Treasury. Some obligations are backed only by the credit of the issuing agency or instrumentality, and in some cases there may be some risk of default by the issuer. Any guarantee by the U.S. government or its agencies or instrumentalities of a security held by the Fund does not apply to the market value of such security or to shares of the Fund itself.
High yield securities risk. High yield (“junk”) securities involve greater credit risk, including the risk of default, than investment grade securities, and are considered predominantly speculative with respect to the issuer’s ability to make principal and interest payments. The prices of high yield securities can fall in response to bad news about the issuer or its industry, or the economy in general, to a greater extent than those of higher rated securities.
Issuer risk. A security’s market value may decline for a number of reasons which directly relate to the issuer, such as management performance, financial leverage and reduced demand for the issuer’s products or services, or factors that affect the issuer’s industry, such as labor shortages or increased production costs and competitive conditions within an industry.
Leverage risk. The use of leverage (borrowing money to purchase properties or securities) will cause the Fund to incur additional expenses and significantly magnify losses in the event of underperformance of the assets purchased with
| 30 |
NOTES TO FINANCIAL STATEMENTS (Unaudited) — continued
borrowed money. In addition, a lender may terminate or refuse to renew any credit facility. If the Fund is unable to access additional credit, it may be forced to sell investments at inopportune times, which may further depress the returns of the Fund.
Liquidity risk. When there is little or no active trading market for specific types of securities, it can become more difficult to sell the securities in a timely manner at or near their perceived value. In such a market, the value of such securities and the Fund’s share price may fall dramatically. Investments that are illiquid or that trade in lower volumes may be more difficult to value. The market for below investment grade securities may be less liquid and therefore these securities may be harder to value or sell at an acceptable price, especially during times of market volatility or decline. Investments in foreign securities tend to have greater exposure to liquidity risk than domestic securities.
Management risk. The investment process used by the Fund’s portfolio managers could fail to achieve the Fund’s investment goal and cause your fund investment to lose value.
Market risk. The value of the securities in which the Fund invests may be affected by political, regulatory, economic and social developments, and developments that impact specific economic sectors, industries or segments of the market. In addition, turbulence in financial markets and reduced liquidity in equity, credit and/or fixed income markets may negatively affect many issuers, which could adversely affect the Fund. Global economies and financial markets are becoming increasingly interconnected, and conditions and events in one country, region or financial market may adversely impact issuers in a different country, region or financial market. These risks may be magnified if certain events or developments adversely interrupt the global supply chain; in these and other circumstances, such risks might affect companies world-wide. Recent examples include pandemic risks related to coronavirus outbreaks and aggressive measures taken world-wide in response by governments, and by businesses, including changes to operations and reducing staff.
The impact of pandemic risks may last for an extended period of time and result in a substantial economic downturn. Any such impact could adversely affect the Fund’s performance.
Risk of market price discount from net asset value. Shares of closed-end funds frequently trade at a market price that is below their NAV. This is commonly referred to as ‘‘trading at a discount.’’ This characteristic of shares of closed-end funds is a risk separate and distinct from the risk that the Fund’s NAV may decrease. The risk of purchasing shares of a closed-end fund that might trade at a discount or unsustainable premium is more pronounced for investors who wish to sell their shares in a relatively short period of time after purchasing them because, for those investors, realization of a gain or loss on their investments is likely to be more dependent upon the existence of a premium or discount than upon portfolio performance.
Valuation risk. When market quotations are not readily available or are deemed to be unreliable, the Fund values its investments at fair value as determined in good faith pursuant to policies and procedures approved by the Board of Trustees. Fair value pricing may require subjective determinations about the value of a security or other asset. As a result, there can be no assurance that fair value pricing will result in adjustments to the prices of securities or other assets, or that fair value pricing will reflect actual market value, and it is possible that the fair value determined for a security or other asset will be materially different from quoted or published prices, from the prices used by others for the same security or other asset and/or from the value that actually could be or is realized upon the sale of that security or other asset.
| 31 |
NOTES TO FINANCIAL STATEMENTS (Unaudited) — continued
Note 8 − Regulatory Updates — Effective August 19, 2022, the Fund was required to comply with Rule 18f-4 under the 1940 Act, which governs the use of derivatives by registered investment companies. Rule 18f-4 permits funds to enter into derivatives transactions (as defined in Rule 18f-4) and certain other transactions notwithstanding the restrictions on the issuance of “senior securities” under Section 18 of the 1940 Act. Rule 18f-4 requires a fund to establish and maintain a comprehensive derivatives risk management program (“DRMP”), appoint a derivatives risk manager and comply with a relative or absolute limit on fund leverage risk calculated based on value-at-risk (“VaR”), unless the fund uses derivatives in only a limited manner. The Fund has established and maintains a DRMP and has appointed a derivatives risk manager to administer the DRMP and provide periodic reports to the Board.
Note 9 − Subsequent Event — The Fund declared a quarterly dividend on September 8, 2022 with an ex-dividend date of September 29, 2022. The distribution was paid on October 12, 2022 to shareholders of record at the close of business on September 30, 2022. Management has evaluated the impact of all subsequent events on the Fund through the date the financial statements were issued, and has determined that there were no additional subsequent events requiring recognition or disclosure in the financial statements.
Note 10 − Other Matters — Many credit instruments, derivatives and other financial instruments, including those in which the fund may invest, utilize LIBOR as the reference or benchmark rate for variable interest rate calculations. However, the use of LIBOR started to come under pressure following manipulation allegations in 2012. Despite increased regulation and other corrective actions since that time, concerns have arisen regarding its viability as a benchmark, due largely to reduced activity in the financial markets that it measures. In July 2017, the Financial Conduct Authority announced plans to phase out the use of LIBOR by the end of 2021. It was subsequently announced that tenors of US Dollar LIBOR would continue to be published through June 30, 2023, other than one week and two month USD LIBOR settings which ceased publication on December 31, 2021. Various financial industry groups around the world have been planning the transition to the use of different benchmarks. In the United States, the Federal Reserve Board and the New York Fed convened the Alternative Reference Rates Committee, comprised of a group of private-market participants, which recommended the Secured Overnight Financing Rate as an alternative reference rate to USD LIBOR. Neither the effect of the transition process, in the United States or elsewhere, nor its ultimate success, can yet be known. While some instruments tied to LIBOR may include a replacement rate in the event LIBOR is discontinued, not all instruments have such fallback provisions and the effectiveness of such replacement rates remains uncertain. The transition process might lead to increased volatility and illiquidity in markets that currently rely on the LIBOR to determine interest rates. The potential cessation of LIBOR could affect the value and liquidity of investments tied to LIBOR, especially those that do not include fallback provisions, and may result in costs incurred in connection with closing out positions and entering into new trades.
| 32 |
Fees and Expenses (unaudited)
As a shareholder of the Fund, you incur two types of cost: (1) transaction costs, including brokerage commissions paid on purchases and sales of fund shares, and (2) ongoing costs, including management fees and other fund expenses. The expense examples below are intended to help you understand your ongoing costs (in dollars) of investing in the Fund and to compare these costs with the ongoing costs of investing in other funds.
The examples in the table is based on the investment of $1,000 invested at the beginning of the six-month period and held for the entire period (April 1, 2022 to September 30, 2022).
Actual expenses
The first line in the following table provides information about actual account values and actual expenses. You may use the information in this line, together with the amount you invest to estimate the expenses that you paid over the period. Simply divide your account value by $1,000 (for example, an $8,600 account value divided by $1,000= 8.6), then multiply the result by the number in the first line under the heading “Expenses Paid During the Period” to estimate the expenses you paid on your account during this period.
Hypothetical example for comparison purposes
The second line in the following table provides information about hypothetical account values and hypothetical expenses based on the Fund’s actual expense ratios and an assumed rate of return of 5% per year before expenses (which is not the Funds’ actual return). The hypothetical account values and expenses may not be used to estimate the actual ending account balance or expenses you paid for the period. You may use this information to compare the ongoing costs of investing in the Fund and other funds. To do so, compare this 5% hypothetical example with the 5% hypothetical examples that appear in the shareholders reports of the other funds.
Please note that the expenses shown in the tables are meant to highlight your ongoing costs only, and do not reflect any transactional costs. Therefore, the second line in the table is useful for comparing ongoing costs only, and will not help you determine the relative total costs of owning different funds. In addition, if these transactional costs were included, your costs would have been higher.
Beginning Account Value April 01, 2022 | Ending Account Value September 30, 2022 | Annualized Expense Ratio | Expenses Paid During the Period Per $1,000 | |||||
| Insight Select Income Fund | ||||||||
| Actual | $1,000.00 | $879.70 | 0.84% | $3.96 | ||||
| Hypothetical (5% return before expenses) | $1,000.00 | $1,020.86 | 0.84% | $4.26 |
| 33 |
SHAREHOLDER INFORMATION (Unaudited)
The following information in this annual report is a summary of certain information about the Fund and changes that occurred during the prior fiscal year. (the “prior disclosure date”). This information may not reflect all of the changes that have occurred since you purchased the Fund.
Summary of information regarding the Fund (unaudited)
INVESTMENT OBJECTIVE AND POLICIES
Investment Objective
There have been no changes in the Fund’s investment objective since the prior disclosure date.
The Fund’s investment objective is to seek a high rate of return, primarily from interest income and trading activity, from a portfolio principally consisting of debt securities. The Fund’s investment objective may be changed by the Board of Trustees of the Fund without shareholder approval. There can be no assurance that the Fund will achieve its objective.
Principal Investment Strategies and Policies
There have been no material changes in the Fund’s Principal Investment Strategies and Policies since the prior disclosure that have not been approved by shareholders.
Under normal market conditions, the Fund invests at least 80% of its Managed Assets (defined below) in debt securities (the “80% Policy”). Seventy-five percent of the Fund’s Managed Assets will be invested in following types of higher quality, non-convertible debt securities (including bonds and debentures):
| • | debt securities (with or without attached warrants) rated, at the time of purchase, within the four highest grades as determined by a nationally recognized statistical ratings organization, such as Moody’s (i.e., Aaa, Aa, A or Baa) or Standard & Poor’s (i.e., AAA, AA, A or BBB) (collectively, the “NRSRO Rated Securities”); |
| • | short-term debt securities (“debentures”) which are not NRSRO Rated Securities, but which are obligations of issuers having, at the time of purchase, any NRSRO Rated Securities and which debentures are considered by the Adviser to have an investment quality comparable to NRSRO Rated Securities; |
| • | obligations of the United States Government, its agencies or instrumentalities; and |
| • | bank debt securities (with or without attached warrants) which, although not NRSRO Rated Securities, are considered by the Adviser to have an investment quality comparable NRSRO Rated Securities. |
“Managed Assets” means net assets, plus the proceeds from borrowings and the issuance of senior securities for investment purposes. The ratings criteria described above apply at the time of acquisition of the security. In the event that a security held in this portion of the Fund’s portfolio is downgraded to below Baa or BBB, the Fund will no longer include such security in this portion of the Fund’s portfolio. The Fund does not expect that the value of warrants in this part of its portfolio will often be significant.
The balance of the Fund’s investments is expected to be principally in debt securities that do not meet the standards described above and in preferred stocks which may be convertible or may be accompanied by warrants or other equity securities. Any securities in this part of the portfolio may be of lower quality and may not be rated by any NRSRO.
| 34 |
SHAREHOLDER INFORMATION (Unaudited) — continued
Fixed-income securities rated below Baa/BBB are considered below investment grade (“high yield” or “junk” bonds). All warrants remaining after sale of the securities to which they were attached and common stocks acquired on conversion or exercise of warrants will be included in this part of the Fund’s portfolio. Any such warrants or common stocks may be held until a long-term holding period has been established for tax purposes, after which they ordinarily will be sold.
From time to time, the Fund may also purchase futures contracts, including interest rate futures, (“futures contracts”) and related options thereon, to hedge the Funds interest rate risk and/or duration risk. A futures contract sale creates an obligation by the Fund, as a seller, to deliver the specific type of instrument called for in the contract at a specified future time for a specified price. A futures contract purchase creates an obligation by the Fund, as purchaser, to take delivery of the specific type of financial instrument at a specified future time at a specified price.
The Fund has established a credit facility secured by the Fund’s assets from which the Fund will be able to borrow money to be invested pursuant to the Fund’s investment strategy. The Fund is permitted to borrow up to the limit permitted under the 1940 Act.
The Fund focuses on a relative value strategy. The Fund seeks to identify opportunities to purchase securities with high risk-adjusted yields across various fixed income sectors in order to maintain and increase the Fund’s income, and therefore the Fund’s dividend payment. In constructing the Fund’s portfolio, the Adviser relies primarily on proprietary, internally-generated credit research. This credit research focuses on both industry/sector analysis and detailed individual security selection. The fund’s Adviser seeks to identify investment opportunities for the Fund based on its evaluation of the relative value of securities. The Adviser analyzes individual issuer credit risk based on factors such as management depth and experience, competitive advantage, market and product position and overall financial strength. The Adviser may supplement its internal research with external, third-party credit research and related credit tools.
The Fund’s average duration is expected to be near the duration of the Bloomberg U.S. Credit Index which is the Fund’s benchmark. On September 30, 2022, the Fund’s duration was 6.70 years and the duration of the Fund’s benchmark was 6.89 years. The Adviser expects that the Fund’s duration will remain between 4 and 8 years; however, the Fund’s duration may be lengthened or shortened depending on market conditions. Duration is a measure of the expected life of a debt security that is used to determine the sensitivity of the security’s price to changes in interest rates. Generally, the longer the Fund’s duration, the more sensitive the Fund will be to changes in interest rates. For example, the price of a fixed income fund with a duration of five years would be expected to fall approximately 5% if interest rates rose 1%.
The type of fixed-income securities in which the Fund may invest include: (i) securities issued or guaranteed by the U.S. government, its agencies or government sponsored enterprises (U.S. government securities); (ii) corporate debt securities, including bonds, notes, debentures, convertible securities, preferred stock and corporate commercial paper; issued by U.S. and non-U.S. corporations and other entities, such as master limited partnerships; (iii) mortgage-related securities; (iv) asset-backed securities; (v) inflation indexed bonds issued by governments or corporations; (vi) structured notes (i.e., specially designed debt instruments whose return is determined by reference to an index or security); (vii) bank loans, including participations and assignments; (viii) delayed funding loans and revolving credit facilities; (ix) bank certificates of deposit, fixed time deposits and bankers’ acceptances; (x) repurchase agreements and reverse repurchase agreements; (xi) debt securities issued by states or local governments or their agencies, authorities or other government sponsored enterprises (municipal securities); (xii) obligations of foreign governments or their subdivisions, agencies or government sponsored enterprises; and (xiii) obligations of international agencies or supranational entities. These securities may have all types of interest rate payment and reset terms, including fixed rate, adjustable rate, floating rate, zero coupon, contingent, deferred, payment in kind and auction rate features.
| 35 |
SHAREHOLDER INFORMATION (Unaudited) — continued
The Fund’s 80% policy set forth above may be changed upon 60 days written notice to shareholders.
When the Adviser believes that market conditions make it appropriate, for temporary, defensive purposes the Fund may invest up to 100% of its assets in cash, high quality short-term money market instruments, and in bills, notes or bonds issued by the U.S. Treasury Department or by other agencies of the U.S. Government. When the Fund makes investments for defensive purposes, it may not achieve its investment objective.
Investment Restrictions
The Fund is subject to a number of investment restrictions, some of which are deemed fundamental and may not be changed without the affirmative vote of a majority of the outstanding voting securities of the Fund, and some of which are not fundamental and may be changed by the Fund’s Board. The Fund’s fundamental investment policies may be changed only with the approval of the holders of a “majority of the Fund’s outstanding voting securities,’’ which, as used in this prospectus, means the lesser of (1) 67% of the Shares represented at a meeting at which more than 50% of the outstanding Shares are present in person or by proxy, or (2) more than 50% of the outstanding Shares. Any investment policy or restriction which involves a maximum percentage of securities or assets is not considered to be violated unless an excess over the percentage occurs immediately after an acquisition of securities or utilization of assets and results therefrom. The Fund’s fundamental policies are set forth below.
| 1. | The Fund will not borrow money, except to the extent permitted under the 1940 Act, as such may be interpreted or modified by regulatory authorities having jurisdiction, from time to time. |
| 2. | The Fund will not issue senior securities, except to the extent permitted under the 1940 Act, as such may be interpreted or modified by regulatory authorities having jurisdiction, from time to time. |
| 3. | The Fund will not act as an underwriter of securities within the meaning of the Securities Act of 1933, as amended, except to the extent permitted under the 1940 Act, as such may be interpreted or modified by regulatory authorities having jurisdiction, from time to time. |
| 4. | The Fund will not “concentrate” its investments in an industry, except to the extent permitted under the 1940 Act, as such may be interpreted or modified by regulatory authorities having jurisdiction, from time to time. |
| 5. | The Fund will not purchase or sell real estate, except to the extent permitted under the 1940 Act, as such may be interpreted or modified by regulatory authorities having jurisdiction, from time to time. |
| 6. | The Fund will not purchase or sell commodities, except to the extent permitted under the 1940 Act, as such may be interpreted or modified by regulatory authorities having jurisdiction, from time to time. |
| 7. | The Fund will not make loans to other persons, except to the extent permitted under the 1940 Act, as such may be interpreted or modified by regulatory authorities having jurisdiction, from time to time. |
The foregoing policies are fundamental and may not be changed without shareholder approval.
The Fund’s policies which are not deemed fundamental and which may be changed by the Board without shareholder approval are set forth below:
| 1. | The Fund will not invest in companies for the purpose of exercising control or management. |
| 36 |
SHAREHOLDER INFORMATION (Unaudited) — continued
| 2. | The Fund may not invest in the securities of other investment companies, except that it may invest in securities of no-load open-end money market investment companies and investment companies that invest in high yield debt securities if, immediately after any purchase of the securities of any such investment company: (i) securities issued by such investment company and all other investment companies owned by the Fund do not have an aggregate value in excess of 10% of the value of the total assets of the Fund; (ii) the Fund does not own more than three percent of the total outstanding voting stock of such investment company; and (iii) the Fund does not own securities issued by such investment company having an aggregate value in excess of 5% of the value of the total assets of the Fund. The Fund’s investment in securities of other investment companies will be subject to the proportionate share of the management fees and other expenses attributable to such securities of other investment companies. |
| 3. | The Fund will not invest in the securities of foreign issuers, except for (i) those securities of the Canadian Government, its provinces and municipalities which are payable in United States currency, and (ii) securities of foreign issuers which are payable in United States dollars (“Yankee Bonds”). The Fund may also invest in Euro-dollar obligations with maturities up to one year, but the Fund will not acquire Yankee Bonds or Euro-dollar obligations if the acquisition would cause more than 15% of the Fund’s assets to be invested in Yankee Bonds and Euro-dollar obligations. |
| 4. | The Fund will not invest more than 2% of the value of its total assets in warrants (valued at the lower of cost or market), except warrants acquired on initial issuance where the warrants are attached to or otherwise in a unit with other securities. |
Principal Risks
An investment in the Fund is not a bank deposit. It is not insured or guaranteed by the FDIC or any other government agency. It is not a complete investment program. The fund’s share price fluctuates, sometimes dramatically, which means you could lose money.
For a discussion of the principal risk factors associated with an investment in the Fund, refer to Note 7 to the Fund’s financial statements in this Annual Report.
BOARD CONSIDERATION OF RENEWAL OF INVESTMENTADVISORY CONTRACT
At an in-person meeting held on September 8, 2022 (the “Meeting”), the Board of Trustees (“Board” or “Trustees”) of Insight Select Income Fund (the “Fund”), including a majority of those trustees who are not “interested persons” of the Fund (the “Independent Trustees”) as defined in the Investment Company Act of 1940, as amended (“Investment Company Act”), unanimously approved the continuation of the existing investment advisory agreement effective December 1, 2020 (the “Agreement”) between the Insight Select Income Fund (the “Fund”) and Insight North America, LLC (the “Adviser”) for an additional one-year period ending December 1, 2023. The Adviser is a wholly owned subsidiary of The Bank of New York Mellon Corporation (“BNY Mellon”).
Prior to the Meeting, the Trustees requested and received information from the Adviser in accordance with Section 15(c) of the Investment Company Act. Specifically, the Trustees received information regarding (i) the services performed for the Fund, (ii) the size and qualifications of the Adviser’s portfolio management staff, (iii) any potential or actual material conflicts of interest which may arise in connection with a portfolio managers’ management of the Fund, (iv) investment performance of the Fund, (v) the capitalization and financial condition of the Adviser and BNY Mellon,
| 37 |
SHAREHOLDER INFORMATION (Unaudited) — continued
(vi) brokerage selection procedures, (vii) the procedures for allocating investment opportunities between the Fund and other clients of the Adviser, (viii) results of any independent audit or regulatory examination, including any recommendations or deficiencies noted, (ix) any litigation, investigation or administrative proceeding which may have a material impact on the Adviser’s ability to service the Fund, and (x) the compliance with the Fund’s investment objective, policies and practices (including codes of ethics and proxy voting policies), federal securities laws and other regulatory requirements. Included with this information was also information regarding the advisory fees received and an analysis of those fees in relation to the delivery of services to the Fund, the costs of providing such services, the profitability of the Adviser in general and as a result of the fees received from the Fund and any other ancillary benefit resulting from the Adviser’s relationship with the Fund. The Trustees also received a copy of the Agreement and the Adviser’s current Form ADV. The Trustees were provided with a memorandum from legal counsel regarding the legal standard applicable to their review of the Agreement. The Trustees also reviewed comparative performance data and comparative statistics and fee data for the Fund relative to four other non-leveraged investment grade corporate bond closed-end funds with similar investment objectives, strategies and policies (the “Peer Group”); and other comparative statistics and expense data for unlevered funds and inclusive of levered fund groups. In addition to the information provided, the Board met with representatives of the Adviser during the Meeting to discuss the Adviser’s history, performance, investment strategy, and compliance program in connection with the continuation of the Agreement.
The Trustees considered and weighed the above information based upon their accumulated experience in governing the Fund and working with the Adviser on matters relating to the Fund. During their deliberations on whether to approve the continuation of the Agreement, the Trustees considered many factors, the information provided by the Adviser as described above, and all other factors the Trustees believed to be relevant to evaluate the Agreement. In their deliberations, the Trustees did not identify any particular information that was controlling, and different Trustees may have attributed different weights to the various factors. However, the Trustees determined that the overall arrangement with the Adviser with respect to the Fund, as provided in the Agreement, including the investment advisory fees, is fair and reasonable in light of the services performed, expenses incurred and such other matters as the Trustees considered relevant. In making their decision, the Trustees gave attention to the information furnished by the Adviser in connection with the Agreement’s approval and throughout the year. The following discussion, however, identifies the primary factors taken into account by the Trustees and the conclusions reached in approving the Agreement.
Nature, Extent, and Quality of Services. The Trustees considered the services provided by the Adviser to the Fund. The Trustees considered the Adviser’s personnel and the depth of their experience necessary to provide investment management services to the Fund. Based on the information provided by the Adviser, the Trustees concluded that (i) the nature, extent and quality of the services provided by the Adviser are appropriate and consistent with the terms of the Advisory Agreement, (ii) the quality of those services has been consistent with industry norms, (iii) the Fund is likely to benefit from the continued provision of those services by the Adviser, (iv) the Adviser has sufficient personnel, with the appropriate education and experience, to serve the Fund effectively and has demonstrated its continuing ability to attract and retain qualified personnel, and (v) the satisfactory nature, extent, and quality of services currently provided to the Fund and its shareholders is likely to continue.
Investment Performance. The Trustees considered the overall investment performance of the Adviser and the Fund since the Adviser was appointed the Fund’s investment adviser on June 2, 2005. The Trustees reviewed and considered comparative performance data and the Fund’s performance relative to the average performance of the Peer Group and its respective benchmark index, the Bloomberg Barclays Capital U.S. Credit Index, which is comprised primarily of U.S. investment grade corporate bonds (the “Benchmark”). The Trustees noted that the Fund had underperformed its Benchmark and Peer Group average for the one-year period, and outperformed its Benchmark and Peer Group average,
| 38 |
SHAREHOLDER INFORMATION (Unaudited) — continued
for the three-, five- and ten-year periods ended June 30, 2022. The Trustees also noted their review and evaluation of the Fund’s investment performance on an on-going basis throughout the year. The Trustees considered the overall consistency of performance results and the short-term and long-term performance of the Fund. Although the Fund underperformed versus its Peer Group and Benchmark in certain periods, the Board concluded that the performance of the Fund was within an acceptable range to other fixed-income closed-end funds with similar investment objectives, strategies and policies.
Comparative Expenses. The Trustees considered the costs of the services provided by the Adviser, the compensation and benefits received by the Adviser in providing services to the Fund, as well as the Adviser’s profitability. The Trustees were provided with and had reviewed BNY Mellon’s financial statements for the year ended December 31, 2021. In addition, the Trustees considered any direct or indirect revenues received by affiliates of the Adviser, noting that The Bank of New York Mellon Corporation, BNY Mellon and its affiliates provided custodial and administrative services to the Fund for which the Fund pays service fees. The Trustees were satisfied that the Adviser’s profits were sufficient to continue as a viable concern generally and as investment adviser of the Fund specifically. The Trustees concluded that the Adviser’s fees and profits (if any) derived from its relationship with the Fund in light of the Fund’s expenses were reasonable in relation to the nature and quality of the services provided, taking into account the fees charged by other investment advisers for managing comparable funds with similar strategies. The Trustees noted that the contractual advisory fee rates for the Fund were within the range of the advisory fees charged by the Peer Group. The Trustees noted that the Fund’s net expense ratio was higher than the average net expense ratio based upon the comparison to the unlevered funds but was lower or on par when the comparison was inclusive of levered funds. The Trustees also concluded that the overall expense ratio of the Fund was reasonable, taking into account the size of the Fund, the quality of services provided by the Adviser, and the investment performance of the Fund. On the basis of these considerations, together, with the other information it considered, the Board determined that the investment advisory fee to be received by the Adviser is reasonable in light of the services provided.
Economies of Scale. The Trustees considered the extent to which economies of scale would be realized relative to fee levels as the Fund grows, and whether the advisory fee levels reflect these economies of scale for the benefit of shareholders. The Trustees determined that economies of scale would be achieved at higher levels of managed assets of the Fund to the benefit of Fund shareholders due to the break-point reduction in the advisory fee of 10 basis points on managed assets in excess of $100 million (such that managed assets in excess of $100 million are subject to an annual management fee rate of 0.40% of average daily managed assets). The Trustees then requested that the Adviser consider an additional break-point reduction in the fee structure of the Fund. The Adviser proposed, and the Board approved the adoption of an additional 10 basis point break point reduction in the advisory fee on managed assets in excess of $200 million (such that managed assets in excess of $200 million are subject to an annual management fee rate of 0.30% of average daily managed assets).
Conclusion. After consideration of all the factors, taking into consideration the information presented at the Meeting, and deliberating in executive session, the entire Board (all of which are independent) unanimously approved the Agreement for an additional one-year period ending December 1, 2023. The Board concluded that the investment advisory fee rate under the Agreement is reasonable in relation to the services provided and that continuation of the Agreement is in the best interests of the shareholders of the Fund. The Trustees also concluded that the investment advisory fees are at acceptable levels in light of the quality of services provided to the Fund. On these bases, the Trustees concluded that the investment advisory fees for the Fund under the Agreement are reasonable. In arriving at their decision, the Trustees did not identify any single matter as controlling, but made their determination in light of all the circumstances.
| 39 |
SHAREHOLDER INFORMATION (Unaudited) — continued
RESULTS OF ANNUAL SHAREHOLDER MEETING
The Annual Meeting of Shareholders of the Fund was held on June 22, 2022. At the meeting, shareholders voted on the election of all trustees. Forty percent (40%) of the shares entitled to vote on the matter shall constitute a quorum. If a quorum is present, a plurality of all votes cast at the meeting is sufficient for the election of Trustees. A quorum was present and the proposal was approved, the details of which are as follows:
| Proposal | Votes Cast In Favor | Withheld | ||
| 1. | W. Thacher Brown | 7,536,601 | 1,693,960 | |
| 2. | Ellen D. Harvey | 7,649,642 | 1,580,918 | |
| 3. | Thomas E. Spock | 7,619,090 | 1,611,470 | |
| 4. | Suzanne P. Welsh | 7,641,031 | 1,589,529 | |
HOW TO GET INFORMATION REGARDING PROXIES
The Fund has adopted the Adviser’s proxy voting policies and procedures to govern the voting of proxies relating to the voting securities of the Fund. You may obtain a copy of these proxy voting procedures, without charge, by emailing clientservicena@insightinvestment.com or on the Securities and Exchange Commission website at www.sec.gov.
Information regarding how the Fund voted proxies relating to portfolio securities during the most recent 12-month period ended June 30 is available, without charge, by emailing clientservicena@insightinvestment.com or on the SEC’s website at www.sec.gov.
QUARTERLY STATEMENT OF INVESTMENTS
The Fund files quarterly schedules of portfolio holdings with the Securities and Exchange Commission (SEC) for the first and third quarters of each fiscal year as an exhibit to its report on Form N-PORT. The Fund’s Form N-PORT reports are available on the SEC’s EDGAR database at www.sec.gov.
ADDITIONAL TAX INFORMATION
For corporate shareholders, the percentage of investment income (dividend income and short-term gains, if any) for the Fund that qualify for the dividends-received deductions for the year ended March 31, 2022 was 1.42%.
For the year ended March 31, 2022, certain dividends paid by the Fund may be subject to a maximum tax rate of 15%, as provided by the Jobs and Growth Tax Relief Reconciliation Act of 2003. Of the distributions made by the Fund, 1.20% represents the amount of each distribution which may qualify for the 15% dividend income tax rate. Shareholders should not use this tax information to prepare their tax returns. The information will be included with your Form 1099 DIV which will be sent to you separately in January 2023.
For the fiscal year ended March 31, 2022, the Fund designated long-term capital gains of $2,032,765.
| 40 |
SHAREHOLDER INFORMATION (Unaudited) — continued
DIVIDEND REINVESTMENT PLAN
The Fund has established a plan for the automatic investment of dividends and distributions pursuant to which dividends and capital gain distributions to shareholders will be paid in or reinvested in additional shares of the Fund. All shareholders of record are eligible to join the Plan. Computershare Investor Services acts as the agent (the “Agent”) for participants under the Plan.
Shareholders whose shares are registered in their own names may elect to participate in the Plan by completing an authorization form and returning it to the Agent. Shareholders whose shares are held in the name of a broker or nominee should contact such broker or nominee to determine whether or how they may participate in the Plan.
Dividends and distributions are reinvested under the Plan as follows. If the market price per share on the Friday before the payment date for the dividend or distribution (the “Valuation Date”), plus this brokerage commissions applicable to one such share, equals or exceeds the net asset value per share on that date, the Fund will issue new shares to participants valued at the net asset value or, if the net asset value is less than 95% of the market price on the Valuation Date, then valued at 95% of the market price. If net asset value per share on the Valuation Date exceeds the market price per share on that date, plus the brokerage commissions applicable to one such share, the Agent will buy shares on the open market, on the New York Stock Exchange, for the participants’ accounts. If before the Agent has completed its purchases, the market price exceeds the net asset value of shares, the average per share purchase price paid by the Agent may exceed the net asset value of shares, resulting in the acquisition of fewer shares than if the dividend or distribution has been paid in shares issued by the Fund at net asset value.
There is no charge to participants for reinvesting dividends or distributions payable in either shares or cash. The Agent’s fees for handling of reinvestment of such dividends and distributions will be paid by the Fund. There will be no brokerage charges with respect to shares issued directly by the Fund as a result of dividends or distributions payable either in shares or cash. However, each participant will be charged by the Agent a pro rata share of brokerage commissions incurred with respect to Agent’s open market purchases in connection with the reinvestment of dividends or distributions payable only in cash.
For purposes of determining the number of shares to be distributed under the Plan, the net asset value is computed on the Valuation Date and compared to the market value of such shares on such date. The Plan may be terminated by a participant by delivery of written notice of termination to the Agent at the address shown below. Upon termination, the Agent will cause a certificate or certificates for the full shares held for a participant under the Plan and a check for any fractional shares to be delivered to the former participant.
Distributions of investment company taxable income that are invested in additional shares generally are taxable to shareholders as ordinary income. A capital gain distribution that is reinvested in shares is taxable to shareholders as long-term capital gain, regardless of the length of time a shareholder has held the shares or whether such gain was realized by the Fund before the shareholder acquired such shares and was reflected in the price paid for the shares.
Plan information and authorization forms are available from Computershare Investor Services, PO Box 505000, Louisville, KY 40233-5000.
| 41 |
SHAREHOLDER INFORMATION (Unaudited) — continued
PRIVACY POLICY
The Fund has adopted procedures designed to maintain and secure the non-public personal information of its clients from inappropriate disclosure to third parties. The Fund is committed to keeping personal information collected from potential, current, and former clients confidential and secure. The proper handling of personal information is one of our highest priorities. The Fund never sells information relating to its clients to any outside third parties.
Client Information
The Fund will only collect and keep information which is necessary for it to provide the services requested by its shareholders, and to administer a shareholder account.
The Fund may collect nonpublic personal information from clients or potential clients such as name, address, tax identification or social security number, assets, income, net worth, copies of financial documents and other information that we may receive on applications or other forms, correspondence or conversations, or via other methods in order to conduct business.
The Fund may also collect information about your transactions with the Fund, Adviser, Adviser’s affiliates, or others, including, but not limited to, your account number and balance, payments history, parties to transactions, cost basis information, and other financial information.
This information may be obtained as a result of transactions with the Fund, Adviser, Adviser’s affiliates, its clients, or others. This could include transactions completed with affiliates or information received from outside vendors to complete transactions or to effect financial goals.
Sharing Information
The Fund only shares the nonpublic personal information of its shareholders with non-affiliated companies or individuals (i) as permitted by law and as required to provide services to shareholders, such as with representatives within Adviser, securities clearing firms, the Fund or insurance companies, and other financial services providers; or (ii) to comply with legal or regulatory requirements. The Fund may also disclose nonpublic personal information to another financial services provider in connection with the transfer of an account to such financial services provider. Further, in the normal course of business, the Fund may disclose information it collects about shareholders to companies or individuals that contract with the Fund or Adviser to perform servicing functions including, but not limited to, recordkeeping, consulting, and/or technology services.
Companies hired to provide support services are not permitted to use personal information for their own purposes, and are contractually obligated to maintain strict confidentiality. The Fund limits the use of personal information to the performance of the specific service requested.
The Fund does not provide personally identifiable information to mailing list vendors or solicitors for any purpose. When the Fund provides personal information to service providers, it requires these providers to agree to safeguard such information, to use the information only for the intended purpose, and to abide by applicable law.
| 42 |
SHAREHOLDER INFORMATION (Unaudited) — continued
Employee Access to Information
Only employees with a valid business reason have the ability to access a clients’ personal information. These employees are educated on the importance of maintaining the confidentiality and security of this information. They are required to abide by our information handling practices.
Protection of Information
The Fund maintains security standards to protect shareholders’ information, whether written, spoken, physical, or electronic. The Fund updates and checks its physical mechanisms and electronic systems to ensure the protection and integrity of information.
Maintaining Accurate Information
The Fund’s goal is to maintain accurate, up to date client records in accordance with industry standards. The Fund has procedures in place to keep information current and complete, including timely correction of inaccurate information.
Disclosure of our Privacy Policy
The Fund recognizes and respects the privacy concerns of its potential, current, and former shareholders. The Fund, Adviser and Adviser’s affiliates are committed to safeguarding this information and may provide this Privacy Policy for informational purposes to shareholders and employees, and will distribute and update it as required by law. It is also available upon request.
The Fund seeks to carefully safeguard shareholder information and, to that end, restricts access to non-public personal information about our shareholders to those employees and other persons who need to know the information to enable the Fund to provide services to its shareholders. The Fund, Adviser and their service agents maintain physical, electronic, and procedural safeguards that comply with federal standards to guard your non-public personal information. In the event that you maintain an account through a financial intermediary, including, but not limited to, a broker-dealer, bank, or trust company, the privacy policy of your financial intermediary would govern how your non-public personal information would be shared with unaffiliated third parties.
| 43 |
[THIS PAGE INTENTIONALLY LEFT BLANK]
| 44 |
[THIS PAGE INTENTIONALLY LEFT BLANK]
| 45 |
[THIS PAGE INTENTIONALLY LEFT BLANK]
| 46 |
HOW TO GET ASSISTANCE WITH SHARE TRANSFER OR DIVIDENDS
Contact Your Transfer Agent: Computershare Investor Services PO Box 505000, Louisville, KY 40233-5000, or call 1-866-333-6685 |
TRUSTEES W. THACHER BROWN ELLEN D. HARVEY THOMAS E. SPOCK SUZANNE P. WELSH
OFFICERS GAUTAM KHANNA President JAMES DICHIARO Vice President THOMAS E. STABILE Treasurer and Vice President SETH GELMAN Secretary and Chief Compliance Officer
INVESTMENT ADVISER INSIGHT NORTH AMERICA LLC 200 PARK AVE, 7TH FLOOR NEW YORK, NY 10166
CUSTODIAN THE BANK OF NEW YORK MELLON 2 HANSON PLACE BROOKLYN, NY 11217
TRANSFER AGENT COMPUTERSHARE INVESTOR SERVICES PO Box 505000, Louisville, KY 40233-5000 866-333-6685
COUNSEL TROUTMAN PEPPER HAMILTON SANDERS LLP 3000 TWO LOGAN SQUARE EIGHTEENTH & ARCH STREETS PHILADELPHIA, PA 19103
INDEPENDENT REGISTERED PUBLIC ACCOUNTING FIRM TAIT, WELLER & BAKER LLP 50 SOUTH 16TH STREET SUITE 2900 PHILADELPHIA, PA 19102 |
Insight Select Income Fund
Semi-Annual Report September 30, 2022
|


| (b) | Not applicable. | |
Item 2. Code of Ethics.
Not applicable.
Item 3. Audit Committee Financial Expert.
Not applicable.
Item 4. Principal Accountant Fees and Services.
Not applicable.
Item 5. Audit Committee of Listed Registrants.
Not applicable.
Item 6. Investments.
| (a) | Schedule of Investments in securities of unaffiliated issuers as of the close of the reporting period is included as part of the report to shareholders filed under Item 1(a) of this form. | |
| (b) | Not applicable. | |
Item 7. Disclosure of Proxy Voting Policies and Procedures for Closed-End Management Investment Companies.
Not applicable.
Item 8. Portfolio Managers of Closed-End Management Investment Companies.
There has been no change, as of the date of this filing, in any of the portfolio managers identified in response to paragraph (a)(1) of this Item in the registrant’s most recently filed annual report on Form N-CSR.
Item 9. Purchases of Equity Securities by Closed-End Management Investment Company and Affiliated Purchasers.
Not applicable.
Item 10. Submission of Matters to a Vote of Security Holders.
There have been no material changes to the procedures by which the shareholders may recommend nominees to the registrant’s board of trustees, where those changes were implemented after the registrant last provided disclosure
in response to the requirements of Item 407(c)(2)(iv) of Regulation S-K (17 CFR 229.407) (as required by Item 22(b)(15) of Schedule 14A (17 CFR 240.14a-101)), or this Item.
Item 11. Controls and Procedures.
| (a) | The registrant’s principal executive and principal financial officers, or persons performing similar functions, have concluded that the registrant’s disclosure controls and procedures (as defined in Rule 30a-3(c) under the Investment Company Act of 1940, as amended (the “1940 Act”) (17 CFR 270.30a-3(c))) are effective, as of a date within 90 days of the filing date of the report that includes the disclosure required by this paragraph, based on their evaluation of these controls and procedures required by Rule 30a-3(b) under the 1940 Act (17 CFR 270.30a-3(b)) and Rules 13a-15(b) or 15d-15(b) under the Securities Exchange Act of 1934, as amended (17 CFR 240.13a-15(b) or 240.15d-15(b)). |
| (b) | There were no changes in the registrant’s internal control over financial reporting (as defined in Rule 30a-3(d) under the 1940 Act (17 CFR 270.30a-3(d))) that occurred during the period covered by this report that has materially affected, or is reasonably likely to materially affect, the registrant’s internal control over financial reporting. |
Item 12. Disclosure of Securities Lending Activities for Closed-End Management Investment Companies.
Not applicable.
Item 13. Exhibits.
| (a)(1) | Not applicable. |
| (a)(2) | Certifications pursuant to Rule 30a-2(a) under the 1940 Act and Section 302 of the Sarbanes-Oxley Act of 2002 are attached hereto. |
| (a)(2)(1) | Not applicable. |
| (a)(2)(2) | Not applicable. |
| (b) | Certifications pursuant to Rule 30a-2(b) under the 1940 Act and Section 906 of the Sarbanes-Oxley Act of 2002 are attached hereto. |
SIGNATURES
Pursuant to the requirements of the Securities Exchange Act of 1934 and the Investment Company Act of 1940, the registrant has duly caused this report to be signed on its behalf by the undersigned, thereunto duly authorized.
| (Registrant) | Insight Select Income Fund |
| By (Signature and Title)* | /s/ Gautam Khanna | |
| Gautam Khanna, President | ||
| (Principal Executive Officer) |
| Date | 11/18/22 |
Pursuant to the requirements of the Securities Exchange Act of 1934 and the Investment Company Act of 1940, this report has been signed below by the following persons on behalf of the registrant and in the capacities and on the dates indicated.
| By (Signature and Title)* | /s/ Gautam Khanna | |
| Gautam Khanna, President | ||
| (Principal Executive Officer) |
| Date | 11/18/22 |
| By (Signature and Title)* | /s/ Thomas E. Stabile | |
| Thomas E. Stabile, Treasurer | ||
| (Principal Financial Officer) |
| Date | 11/18/22 |