| UNITED STATES | |||
| SECURITIES AND EXCHANGE COMMISSION | |||
| Washington, D.C. 20549 | |||
| FORM N-CSR | |||
| CERTIFIED SHAREHOLDER REPORT OF REGISTERED MANAGEMENT | |||
| INVESTMENT COMPANIES | |||
| Investment Company Act file number 811-0523 | |||
| THE DREYFUS FUND INCORPORATED | |||
| (Exact name of Registrant as specified in charter) | |||
| c/o The Dreyfus Corporation | |||
| 200 Park Avenue | |||
| New York, New York 10166 | |||
| (Address of principal executive offices) | (Zip code) | ||
| Mark N. Jacobs, Esq. | |||
| 200 Park Avenue | |||
| New York, New York 10166 | |||
| (Name and address of agent for service) | |||
| Registrant's telephone number, including area code: | (212) 922-6000 | ||
| Date of fiscal year end: | 12/31 | ||
| Date of reporting period: | 12/31/03 | ||
SSL-DOCS2 70128344v6
FORM N-CSR
Item 1. Reports to Stockholders.
The Dreyfus Fund Incorporated
A N N UA L R E P O RT
December 31, 2003
![]()
The views expressed in this report reflect those of the portfolio manager only through the end of the period covered and do not necessarily represent the views of Dreyfus or any other person in the Dreyfus organization. Any such views are subject to change at any time based upon market or other conditions and Dreyfus disclaims any responsibility to update such views.These views may not be relied on as investment advice and, because investment decisions for a Dreyfus fund are based on numerous factors, may not be relied on as an indication of trading intent on behalf of any Dreyfus fund.
Not FDIC-Insured • Not Bank-Guaranteed • May Lose Value
Contents
THE FUND
| 2 | Letter from the Chairman |
| 3 | Discussion of Fund Performance |
| 6 | Fund Performance |
| 7 | Statement of Investments |
| 13 | Statement of Financial Futures |
| 14 | Statement of Assets and Liabilities |
| 15 | Statement of Operations |
| 16 | Statement of Changes in Net Assets |
| 17 | Financial Highlights |
| 18 | Notes to Financial Statements |
| 24 | Report of Independent Auditors |
| 25 | Important Tax Information |
| 26 | Board Members Information |
| 28 | Officers of the Fund |
| FOR MORE INFORMATION | |
| Back Cover | |
The Dreyfus Fund Incorporated
LETTER FROM THE CHAIRMAN
The Fund

Dear Shareholder:
This annual report for The Dreyfus Fund Incorporated covers the 12-month period from January 1, 2003, through December 31, 2003. Inside, you’ll find valuable information about how the fund was managed during the reporting period, including a discussion with the fund’s portfolio managers, Douglas D. Ramos, CFA, and Hilary R. Woods, CFA.
Despite headwinds caused by economic and geopolitical uncertainty early in the year, stocks generally bounced back in 2003, with many stock market indexes generating their first full calendar year of gains since 1999. The combination of historically low interest rates, lower federal income tax rates, progress in the war on terrorism and above-trend economic growth during the second half of the year helped propel stock prices higher.
While stocks in general may no longer be priced as attractively as they were at the start of the year, we believe that market fundamentals remain favorable based on recent forecasts of continued economic growth. However, our optimism is tempered by the understanding that some companies, industries and market sectors always perform better than others.As always, we urge you to speak regularly with your financial advisor, who may be in the best position to suggest the Dreyfus funds designed to meet your current needs, future goals and tolerance for risk.
Thank you for your continued confidence and support.
Sincerely,

Stephen E. Canter
Chairman and Chief Executive Officer The Dreyfus Corporation
January 15, 2004
2

DISCUSSION OF FUND PERFORMANCE
Douglas D. Ramos, CFA, and Hilary R. Woods, CFA, Portfolio Managers
How did The Dreyfus Fund Incorporated perform relative to its benchmark?
For the 12-month period ended December 31, 2003, the fund produced a total return of 24.94%.1 In comparison, the Standard & Poor’s 500 Composite Stock Price Index (“S&P 500 Index”), the portfolio’s benchmark, provided a total return of 28.67% for the same period.2
We attribute these results to a sharp upswing in stock prices that began in March 2003 and, despite some short-term volatility, continued through the remainder of the year. The swift end to major combat operations in Iraq and mounting evidence of stronger than expected U.S. economic growth created a more favorable environment for stocks across a wide range of industries. This was especially true of more speculative stocks with smaller market capitalizations and lower quality. The fund shared in the market’s rise to a significant degree, benefiting from particularly strong returns in the areas of materials and processing and financials. However, the fund delivered less robust returns than the benchmark in the technology, and consumer discretionary and energy sectors, where lower-quality stocks led the market’s advance.
What is the fund’s investment approach?
The fund seeks long-term capital growth consistent with the preservation of capital. Current income is a secondary goal.To pursue these goals, the fund primarily invests in common stocks issued by U.S. companies, including, to a limited degree, those issued in initial public offerings.The fund may invest up to 20% of its assets in foreign securities.
When choosing stocks, the fund focuses on large-capitalization companies with strong positions in their industries and a catalyst that
The Fund 3
DISCUSSION OF FUND PERFORMANCE (continued)
can trigger a price increase. The portfolio managers use fundamental analysis to create a broadly diversified core portfolio composed of growth stocks, value stocks and stocks that exhibit characteristics of both investment styles.The managers select stocks based on:
- Value, or how a stock is priced relative to its perceived intrinsic worth;
- Growth, in this case the sustainability or growth of earnings or cash flow; and
- Financial Profile, which measures the financial health of the company.
The fund typically sells a security when the portfolio managers believe that there has been a negative change in the fundamental factors surrounding the company, the company has become fully valued, the company has lost favor in the current market or economic environment, or a more attractive opportunity has been identified.
What other factors influenced the fund’s performance?
Throughout the reporting period, the fund consistently emphasized stocks that we believed were well-positioned to benefit from U.S. and global economic expansion. For example, in the financials sector, we focused primarily on large, diversified financial institutions, such as Citigroup; mortgage lenders such as Countrywide Financial; brokerage firms such as Morgan Stanley; and consumer credit companies such as American Express, all of which delivered relatively strong performance. In the area of materials and processing, the fund benefited from investments in companies meeting rising global demand for raw materials. Top performers were concentrated among metal mining companies such as copper producer Phelps Dodge and aluminum producer Alcoa.Among industrial stocks, relatively large positions in conglomerates such as General Electric, and heavy machinery producers such as Caterpillar, enabled the fund to keep pace with the benchmark’s rapid rise.
Although other areas also provided strongly positive returns for the fund, those returns proved to be more modest than the benchmark’s. Most notably, despite an overweighted position in technology stocks,
4
the fund’s gains fell short of those registered by the benchmark’s technology component. That’s because the benchmark’s technology returns were driven by some of its more volatile and speculative holdings. The fund’s company-by-company fundamental analysis downgraded most such stocks due to generally weak long-term business prospects. Similarly, our disciplined investment process led us to avoid energy stocks that, in our judgment, suffered from weak underlying fundamentals. However, such stocks led the benchmark’s energy sector gains during 2003.
What is the fund’s current strategy?
As of year-end, the U.S. and global economies appeared poised for continuing expansion.While much of the economy’s growth in 2003 was driven by high rates of consumer spending, we believe that increasing levels of consumer debt, decreasing consumer confidence and the current flat-to-rising interest rate environment are creating a less hospitable environment for consumer-related stocks. On the other hand, corporate capital spending shows evidence of accelerating, leading us to favor stocks of cyclical companies with significant exposure to industrial and capital markets activity. Accordingly, we have invested a relatively large proportion of the fund’s assets in the areas of technology, materials and processing and, to a lesser degree, energy. These same factors have led us to de-emphasize investments in traditionally defensive areas of health care and consumer staples, as well as in consumer discretionary stocks.
January 15, 2004
| 1 | Total return includes reinvestment of dividends and any capital gains paid. Past performance is no guarantee of future results. Share price and investment return fluctuate such that upon redemption, portfolio shares may be worth more or less than their original cost. |
| 2 | SOURCE: LIPPER INC. — Reflects reinvestment of dividends and, where applicable, capital gains distributions.The Standard & Poor’s 500 Composite Stock Price Index is a widely accepted, unmanaged index of U.S. stock market performance. |
The Fund 5
FUND PERFORMANCE
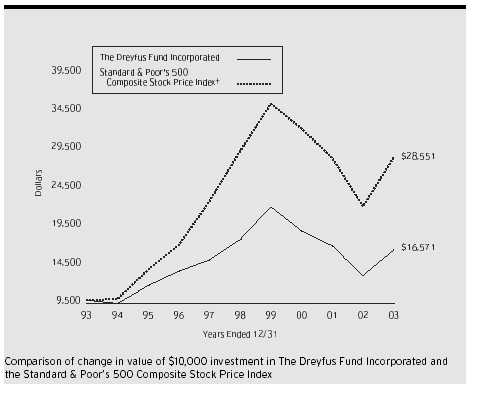
Average Annual Total Returns as of 12/31/03
1 Year 5 Years 10 Years
Fund 24.94 (1.43)% 5.18%
† Source: Lipper Inc.
Past performance is not predictive of future performance.The fund’s performance shown in the graph and table does not reflect the deduction of taxes that a shareholder would pay on fund distributions or the redemption of fund shares. The above graph compares a $10,000 investment made in The Dreyfus Fund Incorporated on 12/31/93 to a $10,000 investment made in the Standard & Poor’s 500 Composite Stock Price Index (the “Index”) on that date.All dividends and capital gain distributions are reinvested.
The fund’s performance shown in the line graph takes into account all applicable fees and expenses.The Index is a widely accepted, unmanaged index of U.S. stock market performance, which does not take into account charges, fees and other expenses. Further information relating to fund performance, including expense reimbursements, if applicable, is contained in the Financial Highlights section of the prospectus and elsewhere in this report.
6
| STATEMENT OF INVESTMENTS | ||||
| December 31, 2003 | ||||
| Common Stocks—98.4% | Shares | Value ($) | ||
| Consumer Discretionary—10.4% | ||||
| Bed Bath & Beyond | 90,000 a | 3,901,500 | ||
| Carnival | 100,000 b | 3,973,000 | ||
| Clear Channel Communications | 145,000 | 6,790,350 | ||
| Comcast, Cl. A | 235,000 a | 7,724,450 | ||
| Comcast, Special Cl. A | 95,000 b | 2,971,600 | ||
| Disney (Walt) | 470,000 | 10,965,100 | ||
| General Motors | 165,000 b | 8,811,000 | ||
| Home Depot | 354,000 | 12,563,460 | ||
| Kohl’s | 75,000 a | 3,370,500 | ||
| Liberty Media | 888,000 a | 10,558,320 | ||
| McDonald’s | 309,000 | 7,672,470 | ||
| SK Equity Fund, L.P. (Units) | 8.359 f | 21,044,089 | ||
| Starwood Hotels & Resorts Worldwide | 185,000 | 6,654,450 | ||
| Target | 200,000 | 7,680,000 | ||
| Time Warner | 960,000 a | 17,270,400 | ||
| Toyota Motor, ADR | 110,000 b | 7,562,500 | ||
| Viacom, Cl. B | 400,000 | 17,752,000 | ||
| 157,265,189 | ||||
| Consumer Staples—9.5% | ||||
| Altria Group | 355,000 | 19,319,100 | ||
| Anheuser-Busch Cos. | 85,000 | 4,477,800 | ||
| Campbell Soup | 150,000 | 4,020,000 | ||
| Coca-Cola | 375,000 | 19,031,250 | ||
| Colgate-Palmolive | 135,000 | 6,756,750 | ||
| Costco Wholesale | 185,000 a | 6,878,300 | ||
| Gillette | 170,000 | 6,244,100 | ||
| Kroger | 350,000 a | 6,478,500 | ||
| PepsiCo | 310,000 | 14,452,200 | ||
| Procter & Gamble | 134,000 | 13,383,920 | ||
| Sara Lee | 200,000 | 4,342,000 | ||
| Sysco | 160,000 | 5,956,800 | ||
| Wal-Mart Stores | 612,000 | 32,466,600 | ||
| 143,807,320 | ||||
| Energy—7.2% | ||||
| Anadarko Petroleum | 140,000 | 7,141,400 | ||
| Baker Hughes | 250,000 | 8,040,000 |
The Fund 7
| STATEMENT OF INVESTMENTS (continued) | ||||
| Common Stocks (continued) | Shares | Value ($) | ||
| Energy (continued) | ||||
| BP, ADR | 170,000 | 8,389,500 | ||
| ChevronTexaco | 160,000 | 13,822,400 | ||
| Devon Energy | 135,000 | 7,730,100 | ||
| Exxon Mobil | 944,500 | 38,724,500 | ||
| GlobalSantaFe | 185,000 | 4,593,550 | ||
| Halliburton | 150,000 | 3,900,000 | ||
| Noble | 130,000 a | 4,651,400 | ||
| Occidental Petroleum | 100,000 | 4,224,000 | ||
| Schlumberger | 150,000 | 8,208,000 | ||
| 109,424,850 | ||||
| Financials—19.6% | ||||
| American Express | 313,000 | 15,095,990 | ||
| American International Group | 475,886 | 31,541,724 | ||
| Bank of America | 235,000 b | 18,901,050 | ||
| Bank of New York | 143,000 | 4,736,160 | ||
| Bank One | 95,000 | 4,331,050 | ||
| CIT Group | 216,000 | 7,765,200 | ||
| Capital One Financial | 188,000 | 11,522,520 | ||
| Citigroup | 885,000 | 42,957,900 | ||
| Countrywide Financial | 94,667 | 7,180,465 | ||
| Federal Home Loan Mortgage | 142,000 | 8,281,440 | ||
| Federal National Mortgage Association | 194,000 | 14,561,640 | ||
| Fifth Third Bancorp | 90,000 | 5,319,000 | ||
| FleetBoston Financial | 185,000 | 8,075,250 | ||
| Goldman Sachs Group | 92,000 | 9,083,160 | ||
| HSBC Holdings, ADR | 85,000 | 6,699,700 | ||
| J.P. Morgan Chase & Co. | 278,000 | 10,210,940 | ||
| MBNA | 305,800 | 7,599,130 | ||
| Marsh & McLennan Cos. | 228,000 | 10,918,920 | ||
| Merrill Lynch | 157,000 | 9,208,050 | ||
| Morgan Stanley | 218,000 | 12,615,660 | ||
| National City | 175,000 | 5,939,500 | ||
| Travelers Property Casualty, Cl. A | 457,786 | 7,681,649 | ||
| U.S. Bancorp | 405,000 | 11,889,571 | ||
| Wachovia | 145,000 | 6,755,550 | ||
| Wells Fargo | 320,000 | 18,844,800 | ||
| 297,716,019 |
8
| Common Stocks (continued) | Shares | Value ($) | |||
| Health Care—10.4% | |||||
| Abbott Laboratories | 159,000 | 7,409,400 | |||
| Allergan | 54,000 | 4,147,740 | |||
| Amgen | 119,200 a | 7,366,560 | |||
| AstraZeneca Group, ADR | 97,000 b | 4,692,860 | |||
| Bard (C.R.) | 63,000 | 5,118,750 | |||
| Becton, Dickinson & Co. | 149,000 | 6,129,860 | |||
| Bristol-Myers Squibb | 259,000 | 7,407,400 | |||
| Eli Lilly & Co. | 156,800 | 11,027,744 | |||
| Galen Partners II, L.P. (Units) | 2.02 f | 1,370,124 | |||
| Johnson & Johnson | 279,000 | 14,413,140 | |||
| Medtronic | 209,000 | 10,159,490 | |||
| Merck & Co. | 232,000 | 10,718,400 | |||
| Novartis, ADR | 168,000 | 7,709,520 | |||
| Pfizer | 968,100 | 34,202,973 | |||
| St. Jude Medical | 117,000 a | 7,177,950 | |||
| Watson Pharmaceuticals | 104,000 a | 4,784,000 | |||
| Wyeth | 333,000 | 14,135,850 | |||
| 157,971,761 | |||||
| Industrials—11.2% | |||||
| Boeing | 130,000 | 5,478,200 | |||
| CSX | 105,000 | 3,773,700 | |||
| Caterpillar | 83,000 | 6,890,660 | |||
| Danaher | 65,000 | 5,963,750 | |||
| Deere & Co. | 105,000 | 6,830,250 | |||
| Dover | 136,000 | 5,406,000 | |||
| Emerson Electric | 120,000 | 7,770,000 | |||
| General Electric | 1,670,000 | 51,736,600 | |||
| Honeywell International | 230,000 | 7,688,900 | |||
| Illinois Tool Works | 100,000 | 8,391,000 | |||
| Lockheed Martin | 125,000 | 6,425,000 | |||
| Norfolk Southern | 250,000 | 5,912,500 | |||
| Northrop Grumman | 57,000 | 5,449,200 | |||
| Raytheon | 130,000 | 3,905,200 | |||
| Southwest Airlines | 200,000 | 3,228,000 | |||
| 3M | 110,000 | 9,353,300 | |||
| Tyco International | 375,000 | 9,937,500 |
The Fund 9
| STATEMENT OF INVESTMENTS (continued) | ||||
| Common Stocks (continued) | Shares | Value ($) | ||
| Industrials (continued) | ||||
| United Parcel Service, Cl. B | 92,000 | 6,858,600 | ||
| United Technologies | 95,000 | 9,003,150 | ||
| 170,001,510 | ||||
| Information Technology—20.8% | ||||
| Accenture | 361,600 a | 9,517,312 | ||
| Altera | 178,000 a | 4,040,600 | ||
| Applied Materials | 415,000 a | 9,316,750 | ||
| Cisco Systems | 1,145,003 a | 27,812,123 | ||
| Computer Associates International | 240,000 | 6,561,600 | ||
| Dell | 400,000 a | 13,584,000 | ||
| EMC | 818,700 a | 10,577,604 | ||
| First Data | 240,000 b | 9,861,600 | ||
| Hewlett-Packard | 330,645 | 7,594,916 | ||
| Intel | 1,115,000 | 35,903,000 | ||
| International Business Machines | 315,000 | 29,194,200 | ||
| Linear Technology | 186,000 | 7,825,020 | ||
| Microsoft | 1,909,000 | 52,573,860 | ||
| Motorola | 576,000 | 8,104,320 | ||
| Nokia Oyj, ADR | 415,000 | 7,055,000 | ||
| Novellus Systems | 170,000 a | 7,148,500 | ||
| Oracle | 999,800 | 13,197,360 | ||
| QUALCOMM | 103,000 | 5,554,790 | ||
| SAP, ADR | 134,000 | 5,569,040 | ||
| Taiwan Semiconductor Manufacturing, ADR | 672,100 a | 6,882,304 | ||
| VeriSign | 476,000 a | 7,758,800 | ||
| Veritas Software | 367,000 a | 13,637,720 | ||
| Xilinx | 207,000 a | 8,019,180 | ||
| Yahoo! | 171,000 a | 7,724,070 | ||
| 315,013,669 | ||||
| Materials—3.5% | ||||
| Alcan | 90,000 | 4,225,500 | ||
| Alcoa | 200,000 | 7,600,000 | ||
| BHP Billiton, ADR | 200,000 | 3,652,000 |
10
| Common Stocks (continued) | Shares | Value ($) | |||
| Materials (continued) | |||||
| du Pont (E.I) de Nemours | 160,000 | 7,342,400 | |||
| International Paper | 165,000 | 7,113,150 | |||
| PPG Industries | 75,000 | 4,801,500 | |||
| Phelps Dodge | 100,000 a | 7,609,000 | |||
| Praxair | 142,000 | 5,424,400 | |||
| Weyerhaeuser | 74,000 | 4,736,000 | |||
| 52,503,950 | |||||
| Telecommunication Services—3.0% | |||||
| BellSouth | 296,400 | 8,388,120 | |||
| SBC Communications | 601,288 | 15,675,578 | |||
| Telefonos de Mexico, ADR | 229,000 | 7,563,870 | |||
| Verizon Communications | 415,000 | 14,558,200 | |||
| 46,185,768 | |||||
| Utilities—2.8% | |||||
| Exelon | 144,000 | 9,555,840 | |||
| FPL Group | 111,000 | 7,261,620 | |||
| MCI | 162,000 a,c | 3,815,100 | |||
| Progress Energy | 98,000 | 4,435,480 | |||
| Southern | 250,000 | 7,562,500 | |||
| TXU | 190,000 | 4,506,800 | |||
| Wisconsin Energy | 148,000 | 4,950,600 | |||
| 42,087,940 | |||||
| Total Common Stocks | |||||
| (cost $ | 1,186,009,250) | 1,491,977,976 | |||
| Other Investments—1.3% | |||||
| Registered Investment Companies: | |||||
| Dreyfus Institutional Cash Advantage Fund | 6,725,667 d | 6,725,667 | |||
| Dreyfus Institutional Cash Advantage Plus Fund | 6,725,667 d | 6,725,667 | |||
| Dreyfus Institutional Preferred Plus Money Market Fund | 6,725,666 d | 6,725,666 | |||
| Total Other Investments | |||||
| (cost $ | 20,177,000) | 20,177,000 | |||
The Fund 11
STATEMENT OF INVESTMENTS (continued)
| Principal | ||||||
| Short-Term Investments—.1% | Amount ($) | Value ($) | ||||
| U.S. Treasury Bills: | ||||||
| .90%, 1/2/2004 | 150,000 | 150,000 | ||||
| .83%, 3/18/2004 | 50,000 | 49,912 | ||||
| .80%, 3/25/2004 | 700,000 | e | 698,607 | |||
| Total Short-Term Investments | ||||||
| (cost $ | 898,519) | 898,519 | ||||
| Investment of Cash Collateral | ||||||
| for Securities Loaned—3.4% | Shares | Value ($) | ||||
| Registered Investment Company; | ||||||
| Dreyfus Institutional Preferred Money Market Fund | ||||||
| (cost $ | 53,096,072) | 53,096,072 | 53,096,072 | |||
| Total Investments (cost $ | 1,260,180,841) | 103.2% | 1,566,149,567 | |||
| Liabilities, Less Cash and Receivables | (3.2%) | (49,020,725) | ||||
| Net Assets | 100.0% | 1,517,128,842 | ||||
| a Non-income producing. | |
| b | All or a portion of these securities are on loan.At December 31, 2003, the total market value of the fund’s securities on loan is $51,574,546 and the total market value of the collateral held by the fund is $53,096,072. |
| c | Purchased on a forward commitment basis. |
| d | Investments in affiliated money market mutual funds—see Note 3(d). |
| e | Partially held by a broker in a segregated account for open financial futures. |
| f | Securities restricted as to public resale. Investment in restricted securities with aggregate market value of $22,414,213 representing approximately 1.48% of net assets (see below). |
| Net | ||||||
| Acquisition | Purchase | Assets | ||||
| Issuer | Date | Price ($)* | �� | (%) | Valuation ($)** | |
| Galen Partners II, L.P. (Units) | 1/28/93-1/3/97 | 678,279 | .09 | 678,279 per unit | ||
| SK Equity Fund, L.P. (Units) | 2/6/92-10/30/96 | 983,975 | 1.39 | 2,517,537 per unit |
* Average cost.
** The valuation of these securities has been determined in good faith under the direction of the Board of Directors.
See notes financial statements.
12
STATEMENT OF FINANCIAL FUTURES
December 31, 2003
| Market Value | Unrealized | |||||
| Covered by | Appreciation | |||||
| Contracts | Contracts ($) | Expiration | at 12/31/2003 ($) | |||
| Financial Futures Long | ||||||
| Standard & Poor’s 500 | 35 | 9,717,750 | March 2004 | 145,384 |
See notes to financial statements.
The Fund 13
STATEMENT OF ASSETS AND LIABILITIES
| December 31, 2003 | |||||
| Cost | Value | ||||
| Assets ($): | |||||
| Investments in securities—See Statement of Investments | |||||
| (including securities on loan | |||||
| valued at $51,574,546)—Note 1(b) | 1,260,180,841 | 1,566,149,567 | |||
| Cash | 4,239,292 | ||||
| Receivable for investment securities sold | 3,974,649 | ||||
| Dividends and interest receivable | 1,754,746 | ||||
| Receivable for shares of Common Stock subscribed | 43,615 | ||||
| Receivable for futures variation margin—Note 4 | 25,375 | ||||
| Prepaid expenses | 49,511 | ||||
| 1,576,236,755 | |||||
| Liabilities ($): | |||||
| Due to The Dreyfus Corporation and affiliates | 951,716 | ||||
| Liability for securities on loan—Note 1(b) | 53,096,072 | ||||
| Payable for investment securities purchased | 4,334,229 | ||||
| Payable for shares of Common Stock redeemed | 459,106 | ||||
| Accrued expenses | 266,790 | ||||
| 59,107,913 | |||||
| Net Assets ( | $) | 1,517,128,842 | |||
| Composition of Net Assets ( | $): | ||||
| Paid-in capital | 1,323,961,123 | ||||
| Accumulated undistributed investment income—net | 2,638,265 | ||||
| Accumulated net realized gain (loss) on investments | (115,584,656) | ||||
| Accumulated net unrealized appreciation (depreciation) | |||||
| on investments (including $145,384 net unrealized | |||||
| appreciation on financial futures) | 306,114,110 | ||||
| Net Assets ( | $) | 1,517,128,842 | |||
| Shares Outstanding | |||||
| (500 million shares of $1 par value Common Stock authorized) | 158,652,597 | ||||
| Net Asset Value, | offering and redemption price per share ($) | 9.56 | |||
| See notes to financial statements. | |||||
14
STATEMENT OF OPERATIONS
Year Ended December 31, 2003
| Investment Income ( | $): | ||
| Income: | |||
| Cash dividends (net of $48,106 foreign taxes withheld at source) | 22,634,551 | ||
| Interest | 482,407 | ||
| Income from securities lending | 36,971 | ||
| Total Income | 23,153,929 | ||
| Expenses: | |||
| Management fee—Note 3(a) | 8,936,482 | ||
| Shareholder servicing costs—Note 3(a) | 1,249,017 | ||
| Prospectus and shareholders’ reports | 120,340 | ||
| Custodian fees—Note 3(a) | 86,907 | ||
| Professional fees | 78,654 | ||
| Directors’ fees and expenses—Note 3(b) | 31,337 | ||
| Registration fees | 27,563 | ||
| Loan commitment fees—Note 2 | 14,868 | ||
| Dividends on securities sold short | 12,592 | ||
| Interest expense—Note 2 | 735 | ||
| Miscellaneous | 6,992 | ||
| Total Expenses | 10,565,487 | ||
| Investment Income—Net | 12,588,442 | ||
| Realized and Unrealized Gain (Loss) on Investments—Note 4 ($): | |||
| Net realized gain (loss) on investments: | |||
| Long transactions | (38,027,987) | ||
| Short sale transactions | (457,737) | ||
| Net realized gain (loss) on financial futures | 6,088,948 | ||
| Net Realized Gain (Loss) | (32,396,776) | ||
| Net unrealized appreciation (depreciation) on investments (including | |||
| $425,433 net unrealized appreciation on financial futures) | 331,937,362 | ||
| Net Realized and Unrealized Gain (Loss) on Investments | 299,540,586 | ||
| Net Increase in Net Assets Resulting from Operations | 312,129,028 | ||
| See notes to financial statements. | |||
The Fund 15
STATEMENT OF CHANGES IN NET ASSETS
| Year Ended December 31, | ||||
| 2003 | 2002 | |||
| Operations ($): | ||||
| Investment income—net | 12,588,442 | 10,742,487 | ||
| Net realized gain (loss) on investments | (32,396,776) | (65,497,209) | ||
| Net unrealized appreciation | ||||
| (depreciation) on investments | 331,937,362 | (344,284,090) | ||
| Net Increase (Decrease) in Net Assets | ||||
| Resulting from Operations | 312,129,028 | (399,038,812) | ||
| Dividends to Shareholders from ($): | ||||
| Investment income—net | (12,170,901) | (10,768,412) | ||
| Capital Stock Transactions ($): | ||||
| Net proceeds from shares sold | 93,287,472 | 156,553,781 | ||
| Dividends reinvested | 10,227,030 | 9,034,442 | ||
| Cost of shares redeemed | (203,240,748) | (302,322,518) | ||
| Increase (Decrease) in Net Assets | ||||
| from Capital Stock Transactions | (99,726,246) | (136,734,295) | ||
| Total Increase (Decrease) in Net Assets | 200,231,881 | (546,541,519) | ||
| Net Assets ($): | ||||
| Beginning of Period | 1,316,896,961 | 1,863,438,480 | ||
| End of Period | 1,517,128,842 | 1,316,896,961 | ||
| Undistributed investment income—net | 2,638,265 | 2,220,724 | ||
| Capital Share Transactions (Shares): | ||||
| Shares sold | 11,236,007 | 16,643,433 | ||
| Shares issued for dividends reinvested | 1,215,229 | 1,098,812 | ||
| Shares redeemed | (24,467,316) | (33,553,807) | ||
| Net Increase (Decrease) in Shares Outstanding | (12,016,080) | (15,811,562) | ||
| See notes to financial statements. | ||||
16
FINANCIAL HIGHLIGHTS
The following table describes the performance for the fiscal periods indicated.Total return shows how much your investment in the fund would have increased (or decreased) during each period, assuming you had reinvested all dividends and dis-tributions.These figures have been derived from the fund’s financial statements.
| Year Ended December 31, | ||||||||||
| 2003 | 2002 | 2001 | 2000 | 1999 | ||||||
| Per Share Data ($): | ||||||||||
| Net asset value, | ||||||||||
| beginning of period | 7.72 | 9.99 | 11.20 | 13.28 | 11.52 | |||||
| Investment Operations: | ||||||||||
| Investment income—neta | .08 | .06 | .06 | .05 | .05 | |||||
| Net realized and unrealized | ||||||||||
| gain (loss) on investments | 1.83 | (2.27) | (1.19) | (1.92) | 2.65 | |||||
| Total from Investment Operations | 1.91 | (2.21) | (1.13) | (1.87) | 2.70 | |||||
| Distributions: | ||||||||||
| Dividends from investment | ||||||||||
| income—net | (.07) | (.06) | (.06) | (.05) | (.06) | |||||
| Dividends from net realized | ||||||||||
| gain on investments | — | — | — | (.11) | (.88) | |||||
| Dividends in excess of net | ||||||||||
| realized gain on investments | — | — | (.02) | (.05) | — | |||||
| Total Distributions | (.07) | (.06) | (.08) | (.21) | (.94) | |||||
| Net asset value, end of period | 9.56 | 7.72 | 9.99 | 11.20 | 13.28 | |||||
| Total Return (%) | 24.94 | (22.15) | (10.07) | (14.27) | 24.07 | |||||
| Ratios/Supplemental Data (%): | ||||||||||
| Ratio of expenses to | ||||||||||
| average net assets | .77 | .76 | .73 | .71 | .71 | |||||
| Ratio of net investment income | ||||||||||
| to average net assets | .91 | .68 | .63 | .42 | .43 | |||||
| Portfolio Turnover Rate | 55.14 | 49.46 | 60.55 | 79.41 | 58.61 | |||||
| Net Assets, end of period | ||||||||||
| ($ x 1,000) | 1,517,129 | 1,316,897 | 1,863,438 | 2,240,137 | 2,830,625 | |||||
a Based on average shares outstanding at each month end. See notes to financial statements.
The Fund 17
NOTES TO FINANCIAL STATEMENTS
NOTE 1—Significant Accounting Policies:
The Dreyfus Fund Incorporated (the “fund”) is registered under the Investment Company Act of 1940, as amended (the “Act”), as a diversified open-end management investment company.The fund’s investment objective is to provide investors with long-term capital growth consistent with the preservation of capital. The Dreyfus Corporation (the “Manager”) serves as the fund’s investment adviser.The Manager is a wholly-owned subsidiary of Mellon Bank, N.A. (“Mellon”), which is a wholly-owned subsidiary of Mellon Financial Corporation. Dreyfus Service Corporation (the “Distributor”), a wholly-owned subsidiary of the Manager, is the distributor of the fund’s shares, which are sold to the public without a sales charge.
The fund’s financial statements are prepared in accordance with accounting principles generally accepted in the United States, which may require the use of management estimates and assumptions.Actual results could differ from those estimates.
(a) Portfolio valuation: Investments in securities (including financial futures) are valued at the last sales price on the securities exchange on which such securities are primarily traded or at the last sales price on the national securities market. Effective April 14, 2003, the fund began pricing securities traded on the NASDAQ stock market using the NASDAQ official closing. Securities not listed on an exchange or the national securities market, or securities for which there were no transactions, are valued at the average of the most recent bid and asked prices. Bid price is used when no asked price is available. Securities for which there are no such valuations are valued at fair value as determined in good faith under the direction of the Board of Directors. Investments denominated in foreign currencies are translated to U.S. dollars at the prevailing rates of exchange.
(b) Securities transactions and investment income: Securities transactions are recorded on a trade date basis. Realized gain and loss from securities transactions are recorded on the identified cost basis.
18
Dividend income is recognized on the ex-dividend date and interest income, including, where applicable, amortization of discount and premium on investments, is recognized on the accrual basis. The fund receives net earnings credits based on available cash balances left on deposit.
The fund may lend securities to qualified institutions. At origination, all loans are secured by collateral of at least 102% of the value of U.S. securities loaned and 105% of the value of foreign securities loaned. Collateral equivalent to at least 100% of the market value of securities on loan will be maintained at all times. Cash collateral is invested in certain money market mutual funds managed by the Manager as shown in the fund’s Statement of Investments.The fund will be entitled to receive all income on securities loaned, in addition to income earned as a result of the lending transaction. Although each security loaned is fully collateralized, the fund would bear the risk of delay in recovery of, or loss of rights in, the securities loaned should a borrower fail to return the securities in a timely manner.
(c) Dividends to shareholders: Dividends are recorded on the ex-dividend date. Dividends from investment income-net are declared and paid on a quarterly basis. Dividends from net realized capital gain, if any, are normally declared and paid annually, but the fund may make distributions on a more frequent basis to comply with the distribution requirements of the Internal Revenue Code of 1986, as amended (the “Code”).To the extent that net realized capital gain can be offset by capital loss carryovers, it is the policy of the fund not to distribute such gain. Income and capital gain distributions are determined in accordance with income tax regulations, which may differ from accounting principles generally accepted in the United States.
(d) Federal income taxes: It is the policy of the fund to continue to qualify as a regulated investment company, if such qualification is in the best interests of its shareholders, by complying with the applicable provisions of the Code, and to make distributions of taxable income
The Fund 19
NOTES TO FINANCIAL STATEMENTS (continued)
sufficient to relieve it from substantially all federal income and excise taxes.
At December 31, 2003, the components of accumulated earnings on a tax basis were as follows: undistributed ordinary income $2,638,265, accumulated capital losses $111,385,639 and unrealized appreciation $302,060,477.
The accumulated capital loss carryover is available is available to be applied against future net securities profits, if any, realized subsequent to December 31, 2003. If not applied, $5,906,587 of the carryover expires in fiscal 2009, $58,361,928 expires in fiscal 2010 and $47,117,124 expires in fiscal 2011.
The tax character of distributions paid to shareholders during the fiscal periods ended December 31, 2003 and December 31, 2002, were as follows: ordinary income $12,170,901 and $10,768,412, respectively.
NOTE 2—Bank Line of Credit:
The fund participates with other Dreyfus-managed funds in a $350 million redemption credit facility (the “Facility”) to be utilized for temporary or emergency purposes, including the financing of redemptions. In connection therewith, the fund has agreed to pay commitment fees on its pro rata portion of the Facility. Interest is charged to the fund based on prevailing market rates in effect at the time of borrowings.
The average daily amount of borrowings outstanding during the period ended December 31, 2003 was approximately $51,000, with a related weighted average annualized interest rate of 1.44%.
NOTE 3—Management Fee and Other Transactions With Affiliates:
(a) Pursuant to a management agreement (the “Agreement”) with the Manager, the management fee is payable monthly, based on the fol-
20
lowing annual percentages of the value of the fund’s average daily net assets: .65 of 1% of the first $1.5 billion; .625 of 1% of the next $500 million; .60 of 1% of the next $500 million; and .55 of 1% over $2.5 billion.
The Agreement provides for an expense reimbursement from the Manager should the fund’s aggregate expenses, exclusive of taxes and brokerage commissions, exceed 1% of the value of the fund’s average daily net assets for any full year. No expense reimbursement was required pursuant to the Agreement for the period ended December 31, 2003.
The fund compensates Dreyfus Transfer, Inc., a wholly-owned subsidiary of the Manager, under a transfer agency agreement for providing personnel and facilities to perform transfer agency services for the fund. During the period ended December 31, 2003, the fund was charged $853,605 pursuant to the transfer agency agreement.
The fund compensates Mellon under a custody agreement for providing custodial services for the fund. During the period ended December 31, 2003, the fund was charged $86,907 pursuant to the custody agreement.
(b) Each Board member also serves as a Board member of other funds within the Dreyfus complex. Annual retainer fees and attendance fees are allocated to each fund based on net assets.
(c) During the period ended December 31, 2003, the fund incurred total brokerage commissions of $2,559,665 of which $5,700 was paid to Harborside Plus Inc., a wholly-owned subsidiary of Mellon Financial Corporation.
(d) Pursuant to an exemptive order from the Securities and Exchange Commission, the fund may invest its available cash balances in affiliated
The Fund 21
NOTES TO FINANCIAL STATEMENTS (continued)
money market mutual funds as shown in the portfolio’s Statement of Investments. Management fees are not charged to these accounts. During the period ended December 31, 2003, the fund derived $317,811 in income from these investments, which is included in dividend income in the fund’s Statement of Operations.
NOTE 4—Securities Transactions:
The following summarizes the aggregate amount of purchases and sales of investment securities and securities sold short, excluding short-term securities and financial futures, during the period ended December 31, 2003:
| Purchases ($) | Sales ($) | |||
| Long transactions | 738,591,471 | 827,681,852 | ||
| Short sale transactions | 11,607,368 | 1,145,046 | ||
| Total | 750,198,839 | 828,826,898 |
The fund is engaged in short-selling which obligates the fund to replace the security borrowed by purchasing the security at current market value.The fund would incur a loss if the price of the security increases between the date of the short sale and the date on which the fund replaces the borrowed security.The fund would realize a gain if the price of the security declines between those dates. Until the fund replaces the borrowed security, the fund will maintain daily a segregated account with a broker or custodian, of permissible liquid assets sufficient to cover its short position.At December 31, 2003, there were no securities sold short outstanding.
The fund may invest in financial futures contracts in order to gain exposure to or protect against changes in the market. The fund is exposed to market risk as a result of changes in the value of the underlying financial instruments. Investments in financial futures require the
22
fund to “mark to market” on a daily basis, which reflects the change in the market value of the contract at the close of each day’s trading. Accordingly, variation margin payments are received or made to reflect daily unrealized gains or losses.When the contracts are closed, the fund recognizes a realized gain or loss.These investments require initial margin deposits with a broker, which consist of cash or cash equivalents, up to approximately 10% of the contract amount.The amount of these deposits is determined by the exchange or Board of Trade on which the contract is traded and is subject to change. Contracts open at December 31, 2003 are set forth in the Statement of Financial Futures.
At December 31, 2003, the cost of investments for federal income tax purposes was $1,264,234,474; accordingly, accumulated net unrealized appreciation on investments was $301,915,093, consisting of $324,874,175 gross unrealized appreciation and $22,959,082 gross unrealized depreciation.
The Fund 23
REPORT OF INDEPENDENT AUDITORS
Shareholders and Board of Directors The Dreyfus Fund Incorporated
We have audited the accompanying statement of assets and liabilities of The Dreyfus Fund Incorporated, including the statements of investments and financial futures as of December 31, 2003, and the related statement of operations for the year then ended, the statement of changes in net assets for each of the two years in the period then ended, and financial highlights for each of the years indicated therein.These financial statements and financial highlights are the responsibility of the Fund’s management. Our responsibility is to express an opinion on these financial statements and financial highlights based on our audits.
We conducted our audits in accordance with auditing standards generally accepted in the United States. Those standards require that we plan and perform the audit to obtain reasonable assurance about whether the financial statements and financial highlights are free of material misstatement. An audit includes examining, on a test basis, evidence supporting the amounts and disclosures in the financial statements. Our procedures included verification by examination of securities held by the custodian as of December 31, 2003 and confirmation of securities not held by the custodian by correspondence with others. An audit also includes assessing the accounting principles used and significant estimates made by management, as well as evaluating the overall financial statement presentation.We believe that our audits provide a reasonable basis for our opinion.
In our opinion, the financial statements and financial highlights referred to above present fairly, in all material respects, the financial position of The Dreyfus Fund Incorporated at December 31, 2003, the results of its operations for the year then ended, the changes in its net assets for each of the two years in the period then ended, and the financial highlights for each of the indicated years, in conformity with accounting principles generally accepted in the United States.

New York, New York February 13, 2004
24
IMPORTANT TAX INFORMATION (Unaudited)
For federal tax purposes, the fund hereby designates 100% of the ordinary dividends paid during the fiscal year ended December 31, 2003 as qualifying for the corporate dividends received deduction and also designates 100% of the ordinary dividends paid during 2003 as qualified dividends, subject to a maximum tax rate of 15%, as provided for by the Jobs and Growth Tax Relief Reconciliation Act of 2003.
The Fund 25
BOARD MEMBERS INFORMATION (Unaudited)
Joseph S. DiMartino (60) Chairman of the Board (1995)
- Principal Occupation During Past 5Years:
Corporate Director and Trustee
Other Board Memberships and Affiliations: - The Muscular Dystrophy Association, Director
- Levcor International, Inc., an apparel fabric processor, Director
- Century Business Services, Inc., a provider of outsourcing functions for small and medium size companies, Director
- The Newark Group, a provider of a national market of paper recovery facilities, paperboard mills and paperboard converting plants, Director
No. of Portfolios for which Board Member Serves: 186
———————
Clifford L. Alexander, Jr. (70) Board Member (2003)
Principal Occupation During Past 5 Years:
- President of Alexander & Associates, Inc., a management consulting firm (January 1981-present)
- Chairman of the Board of Moody’s Corporation (October 2000-October 2003)
- Chairman of the Board and Chief Executive Officer of The Dun and Bradstreet
Corporation (October 1999-September 2000)
Other Board Memberships and Affiliations:
- Wyeth (formerly, American Home Products Corporation), a global leader in pharmaceuticals, consumer healthcare products and animal health products, Director
- Mutual of America Life Insurance Company, Director
No. of Portfolios for which Board Member Serves: 65
———————
Lucy Wilson Benson (76) Board Member (1981)
Principal Occupation During Past 5 Years:
• President of Benson and Associates, consultants to business and government (1980-present)
Other Board Memberships and Affiliations:
- The International Executive Services Corps, Director
- Citizens Network for Foreign Affairs,Vice Chairperson
- Council on Foreign Relations, Member
- Lafayette College Board of Trustees,Vice Chairperson
- Atlantic Council of the U.S., Director
No. of Portfolios for which Board Member Serves: 39
26
David W. Burke (67) Board Member (1994)
Principal Occupation During Past 5 Years:
• Corporate Director and Trustee
Other Board Memberships and Affiliations:
- John F. Kennedy Library Foundation, Director
- U.S.S. Constitution Museum, Director
No. of Portfolios for which Board Member Serves: 83
———————
Whitney I. Gerard (69) Board Member (1973)
Principal Occupation During Past 5 Years:
• Partner of Chadbourne & Parke LLP
No. of Portfolios for which Board Member Serves: 37
———————
Arthur A. Hartman (77) Board Member (1989)
Principal Occupation During Past 5 Years:
- Chairman of First NIS Regional Fund (ING/Barings Management) and New Russia Fund
- Advisory Council Member to Barings-Vostok
Other Board Memberships and Affiliations:
• APCO Associates, Inc., Senior Consultant
No. of Portfolios for which Board Member Serves: 37
———————
George L. Perry (69) Board Member (1989)
Principal Occupation During Past 5 Years:
• Economist and Senior Fellow at Brookings Institution
Other Board Memberships and Affiliations:
- State Farm Mutual Automobile Association, Director
- State Farm Life Insurance Company, Director
No. of Portfolios for which Board Member Serves: 37
———————
Once elected all Board Members serve for an indefinite term.Additional information about the Board Members, including their address is available in the fund’s Statement of Additional Information which can be obtained from Dreyfus free of charge by calling this toll free number: 1-800-554-4611.
The Fund 27
OFFICERS OF THE FUND (Unaudited)
STEPHEN E. CANTER, President since March 2000.
Chairman of the Board, Chief Executive Officer and Chief Operating Officer of the Manager, and an officer of 95 investment companies (comprised of 185 portfolios) managed by the Manager. Mr. Canter also is a Board member and, where applicable, an Executive Committee Member of the other investment management subsidiaries of Mellon Financial Corporation, each of which is an affiliate of the Manager. He is 58 years old and has been an employee of the Manager since May 1995.
STEPHEN R. BYERS, Executive Vice President since November 2002.
Chief Investment Officer,Vice Chairman and a Director of the Manager, and an officer of 95 investment companies (comprised of 185 portfolios) managed by the Manager. Mr. Byers also is an officer, director or an Executive Committee Member of certain other investment management subsidiaries of Mellon Financial Corporation, each of which is an affiliate of the Manager. He is 50 years old and has been an employee of the Manager since January 2000. Prior to joining the Manager, he served as an Executive Vice President-Capital Markets, Chief Financial Officer and Treasurer at Gruntal & Co., L.L.C.
MARK N. JACOBS, Vice President since March 2000.
Executive Vice President, Secretary and General Counsel of the Manager, and an officer of 96 investment companies (comprised of 201 portfolios) managed by the Manager. He is 57 years old and has been an employee of the Manager since June 1977.
28
MICHAEL A. ROSENBERG, Secretary since March 2000.
Associate General Counsel of the Manager, and an officer of 93 investment companies (comprised of 194 portfolios) managed by the Manager. He is 43 years old and has been an employee of the Manager since October 1991.
ROBERT R. MULLERY, Assistant Secretary since March 2000.
Associate General Counsel of the Manager, and an officer of 26 investment companies (comprised of 58 portfolios) managed by the Manager. He is 51 years old and has been an employee of the Manager since May 1986.
STEVEN F. NEWMAN, Assistant Secretary since March 2000.
Associate General Counsel and Assistant Secretary of the Manager, and an officer of 96 investment companies (comprised of 201 portfolios) managed by the Manager. He is 54 years old and has been an employee of the Manager since July 1980.
JEFF PRUSNOFSKY, Assistant Secretary since March 2000.
Associate General Counsel of the Manager, and an officer of 24 investment companies (comprised of 81 portfolios) managed by the Manager. He is 38 years old and has been an employee of the Manager since October 1990.
JAMES WINDELS, Treasurer since November 2001.
Director – Mutual Fund Accounting of the Manager, and an officer of 96 investment companies (comprised of 201 portfolios) managed by the Manager. He is 45 years old and has been an employee of the Manager since April 1985.
RICHARD CASSARO, Assistant Treasurer since August 2003.
Senior Accounting Manager – Equity Funds of the Manager, and an officer of 25 investment companies (comprised of 100 portfolios) managed by the Manager. He is 44 years old and has been an employee of the Manager since September 1982.
ROBERT SVAGNA, Assistant Treasurer since December 2002.
Senior Accounting Manager – Equity Funds of the Manager, and an officer of 25 investment companies (comprised of 101 portfolios) managed by the Manager. He is 36 years old and has been an employee of the Manager since November 1990.
KENNETH J. SANDGREN, Assistant Treasurer since November 2001.
Mutual Funds Tax Director of the Manager, and an officer of 96 investment companies (comprised of 201 portfolios) managed by the Manager. He is 49 years old and has been an employee of the Manager since June 1993.
WILLIAM GERMENIS, Anti-Money Laundering Compliance Officer since September 2002.
Vice President and Anti-Money Laundering Compliance Officer of the Distributor, and the Anti-Money Laundering Compliance Officer of 91 investment companies (comprised of 196 portfolios) managed by the Manager. He is 33 years old and has been an employee of the Distributor since October 1998. Prior to joining the Distributor, he was a Vice President of Compliance Data Center, Inc.
The Fund 29
For More Information
| The Dreyfus Fund |
| Incorporated |
| 200 Park Avenue |
| New York, NY 10166 |
| Manager |
| The Dreyfus Corporation |
| 200 Park Avenue |
| New York, NY 10166 |
| Custodian |
| Mellon Bank, N.A. |
| One Mellon Bank Center |
| Pittsburgh, PA 15258 |
| Transfer Agent & |
| Dividend Disbursing Agent |
| Dreyfus Transfer, Inc. |
| 200 Park Avenue |
| New York, NY 10166 |
| Distributor |
| Dreyfus Service Corporation |
| 200 Park Avenue |
| New York, NY 10166 |
To obtain information:
By telephone
Call 1-800-645-6561
| By mail Write to: |
| The Dreyfus Family of Funds |
| 144 Glenn Curtiss Boulevard |
| Uniondale, NY 11556-0144 |
By E-mail Send your request to info@dreyfus.com
On the Internet Information can be viewed online or downloaded from: http://www.dreyfus.com
A description of the policies and procedures that the fund uses to determine how to vote proxies relating to portfolio securities is available, without charge, by calling the telephone number listed above, or by visiting the SEC’s website at http://www.sec.gov

© 2004 Dreyfus Service Corporation
Item 2. Code of Ethics.
The Registrant has adopted a code of ethics that applies to the Registrant's principal executive officer, principal financial officer, principal accounting officer or controller, or persons performing similar functions.
Item 3. Audit Committee Financial Expert.
The Registrant's Board has determined that Joseph S. DiMartino, a member of the Audit Committee of the Board, is an audit committee financial expert as defined by the Securities and Exchange Commission (the "SEC"). Joseph S. DiMartino is "independent" as defined by the SEC for purposes of audit committee financial expert determinations.
Item 4. Principal Accountant Fees and Services.
(a) Audit Fees. The aggregate fees billed for each of the last two fiscal years (the
"Reporting Periods") for professional services rendered by the Registrant's principal accountant (the "Auditor") for the audit of the Registrant's annual financial statements, or services that are normally provided by the Auditor in connection with the statutory and regulatory filings or engagements for the Reporting Periods, were $30,300 in 2002 and $31,700 in 2003.
(b) Audit-Related Fees. The aggregate fees billed in the Reporting Periods for assurance and related services by the Auditor that are reasonably related to the performance of the audit of the Registrant's financial statements and are not reported under paragraph (a) of this Item 4 were $16,384 in 2002 and $16,664 in 2003. These services consisted of (i) security counts required by Rule 17f-2 under the Investment Company Act of 1940, as amended and (ii) advisory services as to the accounting or disclosure treatment of Registrant transactions or events.
The aggregate fees billed in the Reporting Periods for assurance and related services by the Auditor to the Registrant's investment adviser (not including any sub-investment adviser whose role is primarily portfolio management and is subcontracted with or overseen by another investment adviser), and any entity controlling, controlled by or under common control with the investment adviser that provides ongoing services to the Registrant ("Service Affiliates"), that were reasonably related to the performance of the annual audit of the Service Affiliate, which required pre-approval by the Audit Committee were $15,000 in 2002 and $288,500 in 2003.
Note: For the second paragraph in each of (b) through (d) of this Item 4, certain of such services were not pre-approved prior to May 6, 2003, when such services were required to be pre-approved. On and after May 6, 2003, 100% of all services provided by the Auditor were pre-approved as required. For comparative purposes, the fees shown assume that all such services were pre-approved, including services that were not pre-approved prior to the compliance date of the pre-approval requirement.
-2-
P:\Edgar Filings\Pending\026\N-CSR\coverpage.DOC
(c) Tax Fees. The aggregate fees billed in the Reporting Periods for professional services rendered by the Auditor for tax compliance, tax advice and tax planning ("Tax Services") were $2,909 in 2002 and $3,237 in 2003. These services consisted of (i) review or preparation of U.S. federal, state, local and excise tax returns; (ii) U.S. federal, state and local tax planning, advice and assistance regarding statutory, regulatory or administrative developments, (iii) tax advice regarding tax qualification matters and/or treatment of various financial instruments held or proposed to be acquired or held, and (iv) determination of Passive Foreign Investment Companies.
The aggregate fees billed in the Reporting Periods for Tax Services by the Auditor to Service Affiliates which required pre-approval by the Audit Committee were $0 in 2002 and $0 in 2003.
(d) All Other Fees. The aggregate fees billed in the Reporting Periods for products and services provided by the Auditor, other than the services reported in paragraphs (a) through (c) of this Item, were less than $0 in 2002 and $600 in 2003. These services consisted of a review of the Registrant's anti-money laundering program.
The aggregate fees billed in the Reporting Periods for Non-Audit Services by the Auditor to Service Affiliates, other than the services reported in paragraphs (b) and (c) of this Item, which required pre-approval by the Audit Committee were $0 in 2002 and $0 in 2003.
Audit Committee Pre-Approval Policies and Procedures. The Registrant's Audit Committee has established policies and procedures (the "Policy") for pre-approval (within specified fee limits) of the Auditor's engagements for non-audit services to the Registrant and Service Affiliates without specific case-by-case consideration. Pre-approval considerations include whether the proposed services are compatible with maintaining the Auditor's independence. Pre-approvals pursuant to the Policy are considered annually.
Non-Audit Fees. The aggregate non-audit fees billed by the Auditor for services rendered to the Registrant, and rendered to Service Affiliates, for the Reporting Periods were $471,337 in 2002 and $521,764 in 2003.
Auditor Independence. The Registrant's Audit Committee has considered whether the provision of non-audit services that were rendered to Service Affiliates which were not pre-approved (not requiring pre-approval) is compatible with maintaining the Auditor's independence.
| Item 5. | Audit Committee of Listed Registrants. | |
| Not applicable. | ||
| Item 6. | [Reserved] | |
| Item 7. | Disclosure of Proxy Voting Policies and Procedures for Closed-End Management | |
| Investment Companies. | ||
| Not applicable. | ||
| Item 8. | Purchases of Equity Securities by Closed-End Management Investment Companies and | |
| Affiliated Purchasers. | ||
| -3- |
SSL-DOCS2 70128344v6
Not applicable.
Item 9. Submission of Matters to a Vote of Security Holders.
Not applicable.
Item 10. Controls and Procedures.
(a) The Registrant's principal executive and principal financial officers have concluded, based on their evaluation of the Registrant's disclosure controls and procedures as of a date within 90 days of the filing date of this report, that the Registrant's disclosure controls and procedures are reasonably designed to ensure that information required to be disclosed by the Registrant on Form N-CSR is recorded, processed, summarized and reported within the required time periods and that information required to be disclosed by the Registrant in the reports that it files or submits on Form N-CSR is accumulated and communicated to the Registrant's management, including its principal executive and principal financial officers, as appropriate to allow timely decisions regarding required disclosure.
(b) There were no changes to the Registrant's internal control over financial reporting that occurred during the Registrant's most recently ended fiscal half-year that have materially affected, or are reasonably likely to materially affect, the Registrant's internal control over financial reporting.
Item 11. Exhibits.
(a)(1) Code of ethics referred to in Item 2.
(a)(2) Certifications of principal executive and principal financial officers as required by Rule 30a-2(a) under the Investment Company Act of 1940.
(a)(3) Not applicable.
(b) Certification of principal executive and principal financial officers as required by Rule 30a-2(b) under the Investment Company Act of 1940.
-4-
SSL-DOCS2 70128344v6
SIGNATURES
Pursuant to the requirements of the Securities Exchange Act of 1934 and the Investment Company Act of 1940, the Registrant has duly caused this Report to be signed on its behalf by the undersigned, thereunto duly authorized.
| THE DREYFUS FUND INCORPORATED | |
| By: | /s/ Stephen E. Canter |
| Stephen E. Canter | |
| President | |
| Date: | February 25, 2004 |
Pursuant to the requirements of the Securities Exchange Act of 1934 and the Investment Company Act of 1940, this Report has been signed below by the following persons on behalf of the Registrant and in the capacities and on the dates indicated.
| By: | /s/ Stephen E. Canter |
| Stephen E. Canter | |
| Chief Executive Officer | |
| Date: | February 25, 2004 |
| By: | /s/ James Windels |
| James Windels | |
| Chief Financial Officer | |
| Date: | February 25, 2004 |
EXHIBIT INDEX
(a)(1) Code of ethics referred to in Item 2.
(a)(2) Certifications of principal executive and principal financial officers as required by Rule 30a-2(a) under the Investment Company Act of 1940. (EX-99.CERT)
(b) Certification of principal executive and principal financial officers as required by Rule 30a-2(b) under the Investment Company Act of 1940. (EX-99.906CERT)
-5-
SSL-DOCS2 70128344v6