| UNITED STATES |
| SECURITIES AND EXCHANGE COMMISSION |
| Washington, D.C. 20549 |
| |
| |
| FORM N-CSR |
| |
| CERTIFIED SHAREHOLDER REPORT OF REGISTERED MANAGEMENT |
| INVESTMENT COMPANIES |
| |
| Investment Company Act file number 811-2625 |
| |
| Dreyfus A Bonds Plus, Inc. |
| (Exact name of Registrant as specified in charter) |
| |
| |
| c/o The Dreyfus Corporation |
| 200 Park Avenue |
| New York, New York 10166 |
| (Address of principal executive offices) (Zip code) |
| |
| Mark N. Jacobs, Esq. |
| 200 Park Avenue |
| New York, New York 10166 |
| (Name and address of agent for service) |
| |
| Registrant's telephone number, including area code: (212) 922-6000 |
| Date of fiscal year end: | | 3/31 |
| Date of reporting period: | | 3/31/07 |
FORM N-CSR
Item 1. Reports to Stockholders.

Save time. Save paper. View your next shareholder report online as soon as it’s available. Log into www.dreyfus.com and sign up for Dreyfus eCommunications. It’s simple and only takes a few minutes.
The views expressed in this report reflect those of the portfolio manager only through the end of the period covered and do not necessarily represent the views of Dreyfus or any other person in the Dreyfus organization. Any such views are subject to change at any time based upon market or other conditions and Dreyfus disclaims any responsibility to update such views.These views may not be relied on as investment advice and, because investment decisions for a Dreyfus fund are based on numerous factors, may not be relied on as an indication of trading intent on behalf of any Dreyfus fund.
Not FDIC-Insured • Not Bank-Guaranteed • May Lose Value
| | | Contents |
| |
| | | T H E F U N D |
| |
|
| 2 | | A Letter from the CEO |
| 3 | | Discussion of Fund Performance |
| 6 | | Fund Performance |
| 7 | | Understanding Your Fund’s Expenses |
| 7 | | Comparing Your Fund’s Expenses |
| | | With Those of Other Funds |
| 8 | | Statement of Investments |
| 29 | | Statement of Financial Futures |
| 30 | | Statement of Assets and Liabilities |
| 31 | | Statement of Operations |
| 32 | | Statement of Changes in Net Assets |
| 33 | | Financial Highlights |
| 34 | | Notes to Financial Statements |
| 47 | | Report of Independent Registered |
| | | Public Accounting Firm |
| 48 | | Important Tax Information |
| 49 | | Information About the Review and Approval |
| | | of the Fund’s Management Agreement |
| 53 | | Board Members Information |
| 56 | | Officers of the Fund |
| |
| | | F O R M O R E I N F O R M AT I O N |
| |
|
| | | Back Cover |
Dreyfus
A Bonds Plus, Inc.
The Fund

A L E T T E R F R O M T H E C E O
Dear Shareholder:
We are pleased to present this annual report for Dreyfus A Bonds Plus, Inc., covering the 12-month period from April 1, 2006, through March 31, 2007.
Recent volatility in U.S. stock and bond markets has suggested to us that investors’ appetite for risk may be waning. Until late February 2007, the appetite for risk was relatively high, even in market sectors where the danger of fundamental deterioration was clear,such as “sub-prime”mort-gages. While overall valuation levels within the broad stock and bond markets seemed appropriate to us, prices of many lower-quality assets did not fully compensate investors for the risks they typically entail.
Heightened volatility sometimes signals a shift in the economy,but we do not believe this currently is the case.We continue to expect a midcycle economic slowdown and a monetary policy of “prolonged pause and eventual ease.”Tightness in the labor market should ease, with the unemployment rate driven somewhat higher by housing-related layoffs.While we believe there will be a gradual moderation of both CPI and PCE “core” inflation — a measure of underlying long-term inflation that generally excludes energy and food products — we expect the Fed to remain vigilant against inflation risks as it continues to closely monitor upcoming data. As always, your financial advisor can help you identify the investments that may help you potentially profit from these trends and maintain an asset allocation strategy that’s suited for your needs.
For information about how the fund performed during the reporting period, as well as market perspectives, we have provided a Discussion of Fund Performance given by the fund’s Portfolio Manager.
Thank you for your continued confidence and support.

2

D I S C U S S I O N O F F U N D P E R F O R M A N C E
Catherine Powers, Portfolio Manager
How did Dreyfus A Bonds Plus perform relative to its benchmark?
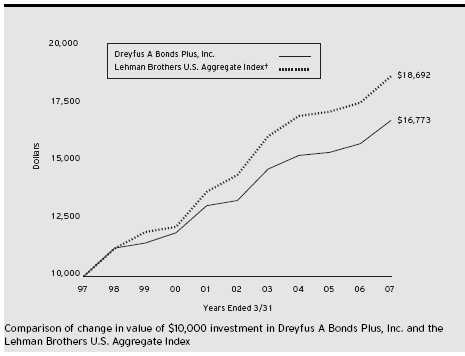
For the 12-month period ended March 31, 2007, the fund achieved a total return of 6.48% and produced aggregate income dividends of $0.62 per share.1 In comparison, the fund’s benchmark, the Lehman Brothers U.S.Aggregate Index (the “Index”), achieved a total return of 6.59% for the same period.2
Despite occasional bouts of heightened volatility, bonds fared relatively well in an environment of moderating economic growth, subdued inflationary pressures and, over much of the reporting period, stable interest rates.The fund’s return was generally in line with the Index, exceeding it on a gross of fee basis. The fund’s performance can be attributed mainly to our duration strategy and sector allocations.
What is the fund’s investment approach?
The fund seeks to maximize total return, consisting of capital appreciation and current income.The fund invests at least 80% of its assets in bonds that, when purchased, are rated single-A or better, or if unrated, deemed to be of comparable quality by Dreyfus.
When selecting securities for the fund, we first examine U.S. and global economic conditions and other market factors in an effort to determine what we believe is the likely direction of long- and short-term interest rates. Using a research-driven investment process, we then attempt to identify potentially profitable sectors before they are widely perceived by the market. Finally, we look for underpriced or mispriced securities within those sectors that, in our opinion, appear likely to perform well over time.
T h e F u n d 3
D I S C U S S I O N O F F U N D P E R F O R M A N C E (continued)
What other factors influenced the fund’s performance?
Although the market encountered heightened volatility at times during the reporting period, bonds generally rallied in response to slowing U.S. economic growth, with particular weakness coming from the housing market.The Federal Reserve Board (the “Fed”) continued to raise short-term interest rates early in the reporting period, but it held the overnight federal funds rate steady at 5.25% between July 2006 and the reporting period’s end.The Fed’s move to the sidelines came after more than two years of steady rate hikes.
Despite the economic slowdown, business fundamentals remained healthy in most industries. In this environment, corporate bonds outperformed Treasuries, with especially strong returns from lower quality debt.As a result, the portfolio’s positions in high yield corporate bonds boosted performance during the reporting period. In the international markets, we established unhedged positions in countries with high inflation-adjusted interest rates, such as Brazil and Mexico.The portfolio benefited from this allocation to non-U.S. bonds, due to a positive yield advantage and improving currency exchange rates relative to the U.S. dollar. Our security selection strategy in investment-grade corporate bonds also contributed positively to the fund’s relative performance. We focused primarily on BBB-rated bonds from issuers in regulated industries where LBO activities are less likely or issuers offering strong covenant protections to bondholders.
Our duration management strategy also achieved good results, as a slightly short position early in the reporting period proved to be a positive influence on performance while the Fed was still raising rates, and a longer position subsequently boosted the fund’s participation in the rally that occurred in later months. Our “bulleted” yield curve strategy also helped support returns when the yield curve steepened in the first quarter of 2007.
Low levels of volatility helped mortgage-backed securities and other high-quality,“yield advantaged” instruments outperform U.S.Treasury securities during the reporting period. While the fund’s under-
4
weighted position in mortgage-backed securities detracted modestly from its relative performance, any resulting weakness was offset by an overweighted position in high-quality asset-backed and commercial mortgage-backed securities. A tactical position in Treasury Inflation Protected Securities (“TIPS”) underperformed as energy prices fell from the record highs set during the summer of 2006.
What is the fund’s current strategy?
We currently expect the Fed to leave the fund’s rate unchanged as policymakers wait to see if moderating economic growth brings down inflation.The Fed’s comments late in the reporting period that inflation may not fall as expected effectively pushed back investors’ previous expectations of a rate cut by mid-2007.
We recently increased the fund’s allocation to hedged non-dollar securities, seeking to benefit from the yield advantages currently available in global markets, including Japan and Sweden. We have remained defensive regarding corporate bonds in light of the slowing U.S. economy and robust M&A and LBO activity. In our view, these strategies position the portfolio for a slower-growth environment.
| 1 | | Total return includes reinvestment of dividends and any capital gains paid. Past performance is no |
| | | guarantee of future results. Share price, yield and investment return fluctuate such that upon |
| | | redemption, fund shares may be worth more or less than their original cost. Return figure provided |
| | | reflects the absorption of certain fund expenses by The Dreyfus Corporation pursuant to an |
| | | agreement in effect until June 30, 2007, at which time it may be extended, modified or |
| | | terminated. Had these expenses not been absorbed, the fund’s return would have been lower. |
| 2 | | SOURCE: LIPPER INC. — Reflects reinvestment of dividends and, where applicable, capital |
| | | gain distributions.The Lehman Brothers U.S. Aggregate Index is a widely accepted, unmanaged |
| | | total return index of corporate, U.S. government and U.S. government agency debt instruments, |
| | | mortgage-backed securities and asset-backed securities with an average maturity of 1-10 years. |
T h e F u n d 5
F U N D P E R F O R M A N C E
| Average Annual Total Returns | | as of 3/31/07 | | | | | | |
| | | | | 1 Year | | 5 Years | | 10 Years |
| |
| |
| |
| |
|
| Fund | | | | 6.48% | | 4.76% | | 5.31% |
† Source: Lipper Inc.
Past performance is not predictive of future performance.The fund’s performance shown in the graph and table does not reflect the deduction of taxes that a shareholder would pay on fund distributions or the redemption of fund shares. The above graph compares a $10,000 investment made in Dreyfus A Bonds Plus, Inc. on 3/31/97 to a $10,000 investment made in the Lehman Brothers U.S. Aggregate Index (the “Index”) on that date. All dividends and capital gain distributions are reinvested.
The fund’s performance shown in the line graph takes into account all applicable fees and expenses.The Index is a widely accepted, unmanaged total return index of corporate, government and government agency debt instruments, mortgage-backed securities and asset-backed securities with an average maturity of 1-10 years and does not take into account charges, fees and other expenses. Further information relating to fund performance, including expense reimbursements, if applicable, is contained in the Financial Highlights section of the prospectus and elsewhere in this report.
6
U N D E R S TA N D I N G YO U R F U N D ’ S E X P E N S E S ( U n a u d i t e d )
As a mutual fund investor, you pay ongoing expenses, such as management fees and other expenses. Using the information below, you can estimate how these expenses affect your investment and compare them with the expenses of other funds.You also may pay one-time transaction expenses, including sales charges (loads) and redemption fees, which are not shown in this section and would have resulted in higher total expenses. For more information, see your fund’s prospectus or talk to your financial adviser.
Review your fund’s expenses
The table below shows the expenses you would have paid on a $1,000 investment in Dreyfus A Bonds Plus, Inc. from October 1, 2006 to March 31, 2007. It also shows how much a $1,000 investment would be worth at the close of the period, assuming actual returns and expenses.
| Expenses and Value of a $1,000 Investment |
| assuming actual returns for the six months ended March 31, 2007 |
|
| |
| Expenses paid per $1,000 † | | $ 4.60 |
| Ending value (after expenses) | | $1,029.70 |
C O M P A R I N G Y O U R F U N D ’ S E X P E N S E S W I T H T H O S E O F O T H E R F U N D S ( U n a u d i t e d )
Using the SEC’s method to compare expenses
The Securities and Exchange Commission (SEC) has established guidelines to help investors assess fund expenses. Per these guidelines, the table below shows your fund’s expenses based on a $1,000 investment, assuming a hypothetical 5% annualized return. You can use this information to compare the ongoing expenses (but not transaction expenses or total cost) of investing in the fund with those of other funds.All mutual fund shareholder reports will provide this information to help you make this comparison. Please note that you cannot use this information to estimate your actual ending account balance and expenses paid during the period.
| Expenses and Value of a $1,000 Investment |
| assuming a hypothetical 5% annualized return for the six months ended March 31, 2007 |
|
| |
| Expenses paid per $1,000 † | | $ 4.58 |
| Ending value (after expenses) | | $1,020.39 |
† Expenses are equal to the fund’s annualized expense ratio of .91%; multiplied by the average account value over the period, multiplied by 182/365 (to reflect the one-half year period).
T h e F u n d 7
| S TAT E M E N T | | O F | | I N V E S T M E N T S |
| M a r c h 3 1 , 2 0 0 7 | | | | |
| | | Coupon | | Maturity | | Principal | | |
| Bonds and Notes—134.9% | | Rate (%) | | Date | | Amount ($) | | Value ($) |
| |
| |
| |
| |
|
| Aerospace & Defense—.5% | | | | | | | | |
| L-3 Communications, | | | | | | | | |
| Gtd. Notes, Ser. B | | 6.38 | | 10/15/15 | | 190,000 | | 189,288 |
| L-3 Communications, | | | | | | | | |
| Gtd. Notes | | 7.63 | | 6/15/12 | | 730,000 | | 755,550 |
| Raytheon, | | | | | | | | |
| Sr. Notes | | 5.50 | | 11/15/12 | | 375,000 | | 381,946 |
| | | | | | | | | 1,326,784 |
| Agricultural—.6% | | | | | | | | |
| Philip Morris, | | | | | | | | |
| Debs. | | 7.75 | | 1/15/27 | | 1,475,000 | | 1,767,743 |
| Airlines—.0% | | | | | | | | |
| U.S. Air, | | | | | | | | |
| Enhanced Equip. Notes, | | | | | | | | |
| Ser. CL C | | 8.93 | | 10/15/09 | | 904,468 a,b | | 90 |
| Asset-Backed Ctfs./ | | | | | | | | |
| Auto Receivables—2.3% | | | | | | | | |
| Chase Manhattan Auto Owner Trust, | | | | | | |
| Ser. 2005-B, Cl. A2 | | 4.77 | | 3/15/08 | | 126,383 | | 126,434 |
| Ford Credit Auto Owner Trust, | | | | | | | | |
| Ser. 2005-B, Cl. B | | 4.64 | | 4/15/10 | | 1,140,000 | | 1,134,107 |
| Ford Credit Auto Owner Trust, | | | | | | | | |
| Ser. 2006-C, Cl. C | | 5.47 | | 9/15/12 | | 340,000 | | 341,397 |
| WFS Financial Owner Trust, | | | | | | | | |
| Ser. 2003-3, Cl. A4 | | 3.25 | | 5/20/11 | | 4,491,726 | | 4,459,106 |
| WFS Financial Owner Trust, | | | | | | | | |
| Ser. 2005-2, Cl. B | | 4.57 | | 11/19/12 | | 575,000 | | 570,935 |
| | | | | | | | | 6,631,979 |
| Asset-Backed Ctfs./Credit Cards—2.8% | | | | | | |
| BA Credit Card Trust, | | | | | | | | |
| Ser. 2007-C1, Cl. C1 | | 5.61 | | 6/15/14 | | 2,875,000 c | | 2,873,765 |
| Citibank Credit Card Issuance | | | | | | | | |
| Trust, Ser. 2006-C4, Cl. C4 | | 5.54 | | 1/9/12 | | 4,530,000 c | | 4,531,613 |
| Credit Suisse Mortgage Capital | | | | | | | | |
| Certificates, Ser. 2007-1, | | | | | | | | |
| Cl. 1A6A | | 5.86 | | 2/25/37 | | 960,000 c | | 964,609 |
| | | | | | | | | 8,369,987 |
8
| | | Coupon | | Maturity | | Principal | | |
| Bonds and Notes (continued) | | Rate (%) | | Date | | Amount ($) | | Value ($) |
| |
| |
| |
| |
|
| Asset-Backed Ctfs./ | | | | | | | | |
| Home Equity Loans—10.2% | | | | | | | | |
| Accredited Mortgage Loan Trust, | | | | | | | | |
| Ser. 2006-1, Cl. A1 | | 5.38 | | 4/25/36 | | 471,467 c | | 471,812 |
| Accredited Mortgage Loan Trust, | | | | | | | | |
| Ser. 2005-3, Cl. A2A | | 5.42 | | 9/25/35 | | 34,702 c | | 34,702 |
| Ameriquest Mortgage Securities, | | | | | | | | |
| Ser. 2003-11, Cl. AF6 | | 5.14 | | 1/25/34 | | 925,000 c | | 918,157 |
| Carrington Mortgage Loan Trust, | | | | | | | | |
| Ser. 2006-RFC1, Cl. A1 | | 5.36 | | 5/25/36 | | 450,043 c | | 450,343 |
| Centex Home Equity, | | | | | | | | |
| Ser. 2006-A, Cl. AV1 | | 5.37 | | 6/25/36 | | 325,650 c | | 325,853 |
| Citicorp Residential Mortgage | | | | | | | | |
| Securities, Ser. 2006-2, Cl. A2 | | 5.56 | | 9/25/36 | | 1,600,000 c | | 1,602,119 |
| Citicorp Residential Mortgage | | | | | | | | |
| Securities, Ser. 2006-2, | | | | | | | | |
| Cl. A1A | | 5.87 | | 9/25/36 | | 1,165,568 c | | 1,164,812 |
| Citicorp Residential Mortgage | | | | | | | | |
| Securities, Ser. 2006-1, Cl. A1 | | 5.96 | | 7/25/36 | | 2,402,045 c | | 2,401,873 |
| Countrywide Asset-Backed | | | | | | | | |
| Certificates, Ser. 2006-SPS1, | | | | | | | | |
| Cl. A | | 5.43 | | 12/25/25 | | 1,318,329 c | | 1,318,931 |
| Countrywide Asset-Backed | | | | | | | | |
| Certificates, Ser. 2004-3, | | | | | | | | |
| Cl. M3 | | 6.19 | | 5/25/34 | | 290,000 c | | 291,188 |
| Credit-Based Asset Servicing and | | | | | | | | |
| Securitization, Ser. 2005-CB7, | | | | | | | | |
| Cl. AF1 | | 5.21 | | 11/25/35 | | 434,745 c | | 433,130 |
| Credit-Based Asset Servicing and | | | | | | | | |
| Securitization, Ser. 2005-CB4, | | | | | | | | |
| Cl. AV1 | | 5.42 | | 8/25/35 | | 174,552 c | | 174,657 |
| Credit-Based Asset Servicing and | | | | | | | | |
| Securitization, Ser. 2005-CB8, | | | | | | | | |
| Cl. AF1B | | 5.45 | | 12/25/35 | | 533,531 c | | 531,713 |
| Credit-Based Asset Servicing and | | | | | | | | |
| Securitization, Ser. 2006-CB1, | | | | | | | | |
| Cl. AF1 | | 5.46 | | 1/25/36 | | 948,321 c | | 944,719 |
T h e F u n d 9
S TAT E M E N T O F I N V E S T M E N T S (continued)
| | | Coupon | | Maturity | | Principal | | |
| Bonds and Notes (continued) | | Rate (%) | | Date | | Amount ($) | | Value ($) |
| |
| |
| |
| |
|
| Asset-Backed Ctfs./ | | | | | | | | |
| Home Equity Loans (continued) | | | | | | | | |
| Credit-Based Asset Servicing and | | | | | | | | |
| Securitization, Ser. 2006-CB2, | | | | | | | | |
| Cl. AF1 | | 5.72 | | 12/25/36 | | 187,290 c | | 186,750 |
| First NLC Trust, | | | | | | | | |
| Ser. 2005-3, Cl. AV2 | | 5.55 | | 12/25/35 | | 724,938 c | | 725,819 |
| GSAA Trust, | | | | | | | | |
| Ser. 2006-7, Cl. AV1 | | 5.40 | | 3/25/46 | | 844,228 c | | 844,631 |
| GSAMP Trust, | | | | | | | | |
| Ser. 2006-S4, Cl. A1 | | 5.41 | | 5/25/36 | | 455,897 c | | 456,199 |
| Home Equity Asset Trust, | | | | | | | | |
| Ser. 2005-5, Cl. 2A1 | | 5.43 | | 11/25/35 | | 348,540 c | | 348,793 |
| Home Equity Asset Trust, | | | | | | | | |
| Ser. 2005-8, Cl. 2A1 | | 5.43 | | 2/25/36 | | 247,680 c | | 247,872 |
| Home Equity Mortgage Trust, | | | | | | | | |
| Ser. 2006-3, Cl. A1 | | 5.47 | | 9/25/36 | | 481,305 c | | 481,801 |
| Home Equity Mortgage Trust, | | | | | | | | |
| Ser. 2006-5, Cl. A1 | | 5.50 | | 1/25/37 | | 1,824,087 c | | 1,829,965 |
| Home Equity Mortgage Trust, | | | | | | | | |
| Ser. 2006-4, Cl. A1 | | 5.67 | | 11/25/36 | | 936,673 c | | 939,254 |
| J.P. Morgan Mortgage Acquisition, | | | | | | | | |
| Ser. 2006-CW1, Cl. A2 | | 5.36 | | 5/25/36 | | 336,995 c | | 337,219 |
| Morgan Stanley ABS Capital I, | | | | | | | | |
| Ser. 2006-HE3, Cl. A2A | | 5.36 | | 4/25/36 | | 306,950 c | | 307,141 |
| Morgan Stanley ABS Capital I, | | | | | | | | |
| Ser. 2005-WMC6, Cl. A2A | | 5.43 | | 7/25/35 | | 89,632 c | | 89,697 |
| Morgan Stanley Home Equity Loans, | | | | | | |
| Ser. 2006-3, Cl. A1 | | 5.37 | | 4/25/36 | | 495,729 c | | 496,038 |
| Morgan Stanley Mortgage Loan | | | | | | | | |
| Trust, Ser. 2006-15XS, Cl. A6B | | 5.83 | | 11/25/36 | | 485,000 c | | 488,637 |
| Newcastle Mortgage Securities | | | | | | | | |
| Trust, Ser. 2006-1, Cl. A1 | | 5.39 | | 3/25/36 | | 803,717 c | | 804,320 |
| Ownit Mortgage Loan Asset Backed | | | | | | |
| Certificates, Ser. 2006-1, | | | | | | | | |
| Cl. AF1 | | 5.42 | | 12/25/36 | | 1,004,353 c | | 999,997 |
| Popular ABS Mortgage Pass-Through | | | | | | |
| Trust, Ser. 2005-D, Cl. A1 | | 5.36 | | 1/25/36 | | 605,409 c | | 602,930 |
| Renaissance Home Equity Loan | | | | | | | | |
| Trust, Ser. 2006-2, Cl. AF1 | | 6.00 | | 8/25/36 | | 1,772,441 c | | 1,769,347 |
10
| | | Coupon | | Maturity | | Principal | | |
| Bonds and Notes (continued) | | Rate (%) | | Date | | Amount ($) | | Value ($) |
| |
| |
| |
| |
|
| Asset-Backed Ctfs./ | | | | | | | | |
| Home Equity Loans (continued) | | | | | | | | |
| Renaissance Home Equity Loan | | | | | | | | |
| Trust, Ser. 2006-2, Cl. M1 | | 6.25 | | 8/25/36 | | 1,115,000 c | | 1,135,129 |
| Residential Asset Mortgage | | | | | | | | |
| Products, Ser. 2005-EFC5, | | | | | | | | |
| Cl. A1 | | 5.42 | | 10/25/35 | | 374,933 c | | 375,206 |
| Residential Asset Securities, | | | | | | | | |
| Ser. 2006-EMX4, Cl. A1 | | 5.36 | | 6/25/36 | | 486,323 c | | 486,649 |
| Residential Asset Securities, | | | | | | | | |
| Ser. 2006-EMX3, Cl. A1 | | 5.38 | | 4/25/36 | | 524,944 c | | 525,325 |
| Residential Asset Securities, | | | | | | | | |
| Ser. 2005-AHL2, Cl. A1 | | 5.42 | | 10/25/35 | | 121,253 c | | 121,336 |
| Residential Asset Securities, | | | | | | | | |
| Ser. 2005-EMX3, Cl. AI1 | | 5.43 | | 9/25/35 | | 252,267 c | | 252,449 |
| Residential Asset Securities, | | | | | | | | |
| Ser. 2003-KS7, Cl. MI3 | | 5.75 | | 9/25/33 | | 265,962 | | 260,339 |
| Residential Funding Mortgage | | | | | | | | |
| Securities II, Ser. 2006-HSA2, | | | | | | | | |
| Cl. AI2 | | 5.50 | | 3/25/36 | | 240,000 c | | 239,613 |
| Saxon Asset Securities Trust, | | | | | | | | |
| Ser. 2004-2, Cl. AF2 | | 4.15 | | 8/25/35 | | 1,602,058 c | | 1,593,026 |
| Soundview Home Equity Loan Trust, | | | | | | |
| Ser. 2005-B, Cl. M3 | | 5.83 | | 5/25/35 | | 450,000 c | | 445,294 |
| Specialty Underwriting & | | | | | | | | |
| Residential Finance, | | | | | | | | |
| Ser. 2006-BC2, Cl. A2A | | 5.38 | | 2/25/37 | | 957,481 c | | 958,160 |
| Wells Fargo Home Equity Trust, | | | | | | | | |
| Ser. 2006-1, Cl. A1 | | 5.35 | | 5/25/36 | | 554,688 c | | 554,798 |
| | | | | | | | | 29,967,743 |
| Asset-Backed Ctfs./ | | | | | | | | |
| Manufactured Housing—.5% | | | | | | | | |
| Green Tree Financial, | | | | | | | | |
| Ser. 1994-7, Cl. M1 | | 9.25 | | 3/15/20 | | 499,686 | | 517,490 |
| Origen Manufactured Housing, | | | | | | | | |
| Ser. 2005-A, Cl. A1 | | 4.06 | | 7/15/13 | | 176,657 | | 176,244 |
| Origen Manufactured Housing, | | | | | | | | |
| Ser. 2005-B, Cl. A1 | | 5.25 | | 2/15/14 | | 771,253 | | 768,994 |
| | | | | | | | | 1,462,728 |
T h e F u n d 11
S TAT E M E N T O F I N V E S T M E N T S (continued)
| | | Coupon | | Maturity | | Principal | | |
| Bonds and Notes (continued) | | Rate (%) | | Date | | Amount ($) | | Value ($) |
| |
| |
| |
| |
|
| Automobile Manufacturers—.2% | | | | | | | | |
| DaimlerChrysler N.A. Holding, | | | | | | | | |
| Notes | | 4.88 | | 6/15/10 | | 295,000 | | 292,220 |
| DaimlerChrysler N.A. Holding, | | | | | | | | |
| Gtd. Notes | | 8.50 | | 1/18/31 | | 325,000 | | 407,058 |
| | | | | | | | | 699,278 |
| Automotive, Trucks & Parts—.1% | | | | | | |
| Johnson Controls, | | | | | | | | |
| Sr. Notes | | 5.25 | | 1/15/11 | | 195,000 | | 195,441 |
| Banks—9.7% | | | | | | | | |
| Chevy Chase Bank, | | | | | | | | |
| Sub. Notes | | 6.88 | | 12/1/13 | | 480,000 | | 506,400 |
| Chuo Mitsui Trust & Banking, | | | | | | | | |
| Sub. Notes | | 5.51 | | 12/29/49 | | 1,005,000 c,d | | 972,134 |
| Colonial Bank N.A./ | | | | | | | | |
| Montgomery, AL, Sub. Notes | | 6.38 | | 12/1/15 | | 750,000 | | 779,870 |
| Colonial Bank N.A./ | | | | | | | | |
| Montgomery, AL, Sub. Notes | | 8.00 | | 3/15/09 | | 250,000 | | 261,411 |
| Glitnir Banki, | | | | | | | | |
| Sub. Notes | | 6.69 | | 6/15/16 | | 450,000 c,d | | 472,164 |
| Glitnir Banki, | | | | | | | | |
| Unscd. Bonds | | 7.45 | | 9/14/49 | | 350,000 c,d | | 376,392 |
| HBOS Capital Funding, | | | | | | | | |
| Bank Gtd. Bonds | | 6.07 | | 6/29/49 | | 5,410,000 c,d,e | | 5,519,103 |
| ICICI Bank, | | | | | | | | |
| Bonds | | 5.90 | | 1/12/10 | | 400,000 c,d | | 400,770 |
| Landsbanki Islands, | | | | | | | | |
| Notes | | 6.10 | | 8/25/11 | | 850,000 d | | 873,131 |
| Manufacturers & Traders Trust, | | | | | | | | |
| Sub. Notes | | 5.59 | | 12/28/20 | | 475,000 c | | 474,306 |
| Merrill Lynch and Company, | | | | | | | | |
| Sr. Unscd. Notes, Ser. 1 | | 5.45 | | 3/23/10 | | 3,010,000 c | | 3,012,543 |
| NB Capital Trust IV, | | | | | | | | |
| Gtd. Cap. Secs. | | 8.25 | | 4/15/27 | | 1,000,000 | | 1,040,139 |
| Northern Rock, | | | | | | | | |
| Sub. Notes | | 5.60 | | 4/29/49 | | 975,000 c,d | | 951,380 |
| Regions Financial, | | | | | | | | |
| Sr. Notes | | 5.44 | | 8/8/08 | | 1,450,000 c | | 1,452,166 |
| Resona Bank, | | | | | | | | |
| Notes | | 5.85 | | 9/29/49 | | 835,000 c,d | | 832,361 |
12
| | | Coupon | | Maturity | | Principal | | |
| Bonds and Notes (continued) | | Rate (%) | | Date | | Amount ($) | | Value ($) |
| |
| |
| |
| |
|
| Banks (continued) | | | | | | | | |
| Shinsei Finance Cayman, | | | | | | | | |
| Jr. Sub. Bonds | | 6.42 | | 1/29/49 | | 795,000 c,d | | 804,400 |
| Societe Generale, | | | | | | | | |
| Notes | | 5.92 | | 12/29/49 | | 800,000 c,d,f | | 801,008 |
| Sovereign Bancorp, | | | | | | | | |
| Sr. Notes | | 5.30 | | 9/1/10 | | 925,000 c | | 910,311 |
| Sovereign Bancorp, | | | | | | | | |
| Sr. Unscd. Notes | | 5.58 | | 3/23/10 | | 585,000 c | | 585,184 |
| Sumitomo Mitsui Banking, | | | | | | | | |
| Notes | | 5.63 | | 7/29/49 | | 560,000 c,d | | 552,531 |
| SunTrust Preferred Capital I, | | | | | | | | |
| Bank Gtd. Notes | | 5.85 | | 12/31/49 | | 705,000 c,e | | 715,591 |
| USB Capital IX, | | | | | | | | |
| Gtd. Notes | | 6.19 | | 4/15/49 | | 1,000,000 c | | 1,026,253 |
| Wachovia Bank N.A., | | | | | | | | |
| Sub. Notes | | 5.00 | | 8/15/15 | | 850,000 | | 825,911 |
| Washington Mutual, | | | | | | | | |
| Sub. Notes | | 4.63 | | 4/1/14 | | 1,695,000 | | 1,587,835 |
| Washington Mutual, | | | | | | | | |
| Notes | | 5.66 | | 1/15/10 | | 810,000 c | | 810,868 |
| Wells Fargo & Co., | | | | | | | | |
| Sub. Notes | | 6.38 | | 8/1/11 | | 540,000 | | 565,873 |
| Zions Bancorporation, | | | | | | | | |
| Sr. Unscd. Notes | | 5.48 | | 4/15/08 | | 620,000 c | | 620,753 |
| Zions Bancorporation, | | | | | | | | |
| Sub. Notes | | 6.00 | | 9/15/15 | | 825,000 | | 841,656 |
| | | | | | | | | 28,572,444 |
| Building & Construction—.2% | | | | | | | | |
| Masco, | | | | | | | | |
| Sr. Unscd. Notes | | 5.66 | | 3/12/10 | | 410,000 c | | 410,271 |
| Owens Corning, | | | | | | | | |
| Sr. Unscd. Notes | | 6.50 | | 12/1/16 | | 210,000 d | | 214,876 |
| | | | | | | | | 625,147 |
| Chemicals—.8% | | | | | | | | |
| Equistar Chemicals/Funding, | | | | | | | | |
| Gtd. Notes | | 10.13 | | 9/1/08 | | 360,000 | | 380,700 |
| ICI Wilmington, | | | | | | | | |
| Gtd. Notes | | 4.38 | | 12/1/08 | | 725,000 | | 714,567 |
T h e F u n d 13
S TAT E M E N T O F I N V E S T M E N T S (continued)
| | | Coupon | | Maturity | | Principal | | |
| Bonds and Notes (continued) | | Rate (%) | | Date | | Amount ($) | | Value ($) |
| |
| |
| |
| |
|
| Chemicals (continued) | | | | | | | | |
| Lubrizol, | | | | | | | | |
| Sr. Notes | | 4.63 | | 10/1/09 | | 815,000 | | 805,606 |
| Lubrizol, | | | | | | | | |
| Sr. Notes | | 5.50 | | 10/1/14 | | 450,000 | | 441,077 |
| | | | | | | | | 2,341,950 |
| Commercial & Professional Services—.4% | | | | | | |
| ERAC USA Finance, | | | | | | | | |
| Bonds | | 5.60 | | 5/1/15 | | 550,000 d | | 551,437 |
| ERAC USA Finance, | | | | | | | | |
| Notes | | 5.61 | | 4/30/09 | | 200,000 c,d | | 200,580 |
| ERAC USA Finance, | | | | | | | | |
| Notes | | 7.95 | | 12/15/09 | | 360,000 d | | 384,728 |
| | | | | | | | | 1,136,745 |
| Commercial Mortgage | | | | | | | | |
| Pass-Through Ctfs.—7.1% | | | | | | | | |
| Banc of America Commercial | | | | | | | | |
| Mortgage, Ser. 2005-2, Cl. A2 | | 4.25 | | 7/10/43 | | 1,481,876 | | 1,469,221 |
| Bayview Commercial Asset Trust, | | | | | | | | |
| Ser. 2006-SP1, Cl. A1 | | 5.59 | | 4/25/36 | | 478,354 c,d | | 478,503 |
| Bayview Commercial Asset Trust, | | | | | | | | |
| Ser. 2004-1, Cl. A | | 5.68 | | 4/25/34 | | 391,746 c,d | | 392,480 |
| Bayview Commercial Asset Trust, | | | | | | | | |
| Ser. 2003-1, Cl. A | | 5.90 | | 8/25/33 | | 272,184 c,d | | 272,410 |
| Bayview Commercial Asset Trust, | | | | | | | | |
| Ser. 2003-2, Cl. A | | 5.90 | | 12/25/33 | | 367,512 c,d | | 368,087 |
| Bayview Commercial Asset Trust, | | | | | | | | |
| Ser. 2006-2A, Cl. B2 | | 6.79 | | 7/25/36 | | 722,898 c,d | | 722,615 |
| Bayview Commercial Asset Trust, | | | | | | | | |
| Ser. 2005-3A, Cl. B3 | | 8.32 | | 11/25/35 | | 212,601 c,d | | 215,952 |
| Bayview Commercial Asset Trust, | | | | | | | | |
| Ser. 2005-4A, Cl. B3 | | 8.82 | | 1/25/36 | | 203,688 c,d | | 203,688 |
| Bear Stearns Commercial Mortgage | | | | | | |
| Securities, Ser. 2006-PW13, | | | | | | | | |
| Cl. A3 | | 5.52 | | 9/11/41 | | 350,000 | | 354,722 |
| Bear Stearns Commercial Mortgage | | | | | | |
| Securities, Ser. 2006-T24, | | | | | | | | |
| Cl. AAB | | 5.53 | | 10/12/41 | | 775,000 | | 785,321 |
| Bear Stearns Commercial Mortgage | | | | | | |
| Securities, Ser. 2006-PW12, | | | | | | | | |
| Cl. AAB | | 5.69 | | 9/11/38 | | 715,000 c | | 734,194 |
14
| | | Coupon | | Maturity | | Principal | | |
| Bonds and Notes (continued) | | Rate (%) | | Date | | Amount ($) | | Value ($) |
| |
| |
| |
| |
|
| Commercial Mortgage | | | | | | | | |
| Pass-Through Ctfs. (continued) | | | | | | |
| Calwest Industrial Trust, | | | | | | | | |
| Ser. 2002-CALW, Cl. A | | 6.13 | | 2/15/17 | | 1,750,000 d | | 1,822,592 |
| Citigroup/Deutsche Bank Commercial | | | | | | |
| Mortgage Trust, Ser. 2006-CD2, | | | | | | | | |
| Cl. A2 | | 5.41 | | 1/15/46 | | 580,000 | | 584,937 |
| Credit Suisse/Morgan Stanley | | | | | | | | |
| Commercial Mortgage | | | | | | | | |
| Certificates, Ser. 2006-HC1A, | | | | | | | | |
| Cl. A1 | | 5.51 | | 5/15/23 | | 725,000 c,d | | 725,610 |
| Crown Castle Towers, | | | | | | | | |
| Ser. 2005-1A, Cl. D | | 5.61 | | 6/15/35 | | 445,000 d | | 443,544 |
| Crown Castle Towers, | | | | | | | | |
| Ser. 2006-1A, Cl. D | | 5.77 | | 11/15/36 | | 550,000 d | | 544,858 |
| Global Signal Trust, | | | | | | | | |
| Ser. 2006-1, Cl. D | | 6.05 | | 2/15/36 | | 580,000 d | | 580,696 |
| Global Signal Trust, | | | | | | | | |
| Ser. 2006-1, Cl. E | | 6.50 | | 2/15/36 | | 320,000 d | | 320,156 |
| J.P. Morgan Chase Commercial | | | | | | | | |
| Mortgage Securities, | | | | | | | | |
| Ser. 2005-LDP5, Cl. A2 | | 5.20 | | 12/15/44 | | 1,250,000 | | 1,252,876 |
| J.P. Morgan Chase Commercial | | | | | | | | |
| Mortgage Securities, | | | | | | | | |
| Ser. 2006-LDP7, Cl. ASB | | 5.88 | | 4/15/45 | | 710,000 c | | 735,964 |
| Merrill Lynch Mortgage Trust, | | | | | | | | |
| Ser. 2005-CIP1, Cl. A2 | | 4.96 | | 7/12/38 | | 885,000 | | 881,452 |
| Merrill Lynch Mortgage Trust, | | | | | | | | |
| Ser. 2005-CKI1, Cl. A2 | | 5.22 | | 11/12/37 | | 300,000 c | | 301,793 |
| Morgan Stanley Capital I, | | | | | | | | |
| Ser. 2006-T21, Cl. A2 | | 5.09 | | 10/12/52 | | 1,000,000 | | 999,387 |
| Morgan Stanley Capital I, | | | | | | | | |
| Ser. 2006-IQ12, Cl. AAB | | 5.33 | | 12/15/43 | | 1,540,000 | | 1,541,678 |
| Morgan Stanley Capital I, | | | | | | | | |
| Ser. 2006-HQ9, Cl. A3 | | 5.71 | | 7/12/44 | | 1,550,000 | | 1,587,101 |
| SBA CMBS Trust, | | | | | | | | |
| Ser. 2006-1A, Cl. D | | 5.85 | | 11/15/36 | | 235,000 d | | 233,556 |
| Washington Mutual Asset | | | | | | | | |
| Securities, Ser. 2003-C1A, | | | | | | | | |
| Cl. A | | 3.83 | | 1/25/35 | | 2,490,947 d | | 2,420,748 |
| | | | | | | | | 20,974,141 |
T h e F u n d 15
S TAT E M E N T O F I N V E S T M E N T S (continued)
| | | Coupon | | Maturity | | Principal | | |
| Bonds and Notes (continued) | | Rate (%) | | Date | | Amount ($) | | Value ($) |
| |
| |
| |
| |
|
| Diversified Financial Services—9.3% | | | | | | |
| American Express, | | | | | | | | |
| Sub. Debs. | | 6.80 | | 9/1/66 | | 325,000 c,e | | 346,711 |
| Ameriprise Financial, | | | | | | | | |
| Jr. Sub. Notes | | 7.52 | | 6/1/66 | | 792,000 c,e | | 856,257 |
| Amvescap, | | | | | | | | |
| Gtd. Notes | | 5.38 | | 2/27/13 | | 1,000,000 | | 999,734 |
| Amvescap, | | | | | | | | |
| Sr. Unscd. Notes | | 5.38 | | 12/15/14 | | 500,000 | | 495,529 |
| Bear Stearns Cos., | | | | | | | | |
| Sr. Unscd. Notes | | 5.50 | | 8/15/11 | | 785,000 | | 793,719 |
| Boeing Capital, | | | | | | | | |
| Sr. Notes | | 7.38 | | 9/27/10 | | 890,000 | | 956,608 |
| Cit Group, | | | | | | | | |
| Sr. Notes | | 5.48 | | 3/12/10 | | 1,530,000 c | | 1,530,148 |
| Countrywide Financial, | | | | | | | | |
| Gtd. Notes | | 5.50 | | 1/5/09 | | 1,450,000 c | | 1,448,177 |
| Countrywide Home Loans, | | | | | | | | |
| Gtd. Notes, Ser. L | | 4.00 | | 3/22/11 | | 505,000 | | 479,143 |
| Credit Suisse USA, | | | | | | | | |
| Sr. Unsub. Notes | | 5.50 | | 8/16/11 | | 1,215,000 | | 1,234,333 |
| Fuji JGB Investment, | | | | | | | | |
| Sub. Bonds | | 9.87 | | 12/29/49 | | 750,000 c,d | | 789,601 |
| Glencore Funding, | | | | | | | | |
| Gtd. Notes | | 6.00 | | 4/15/14 | | 440,000 d | | 436,741 |
| Goldman Sachs Group, | | | | | | | | |
| Notes | | 4.50 | | 6/15/10 | | 920,000 | | 905,099 |
| HSBC Finance Capital Trust IX, | | | | | | | | |
| Gtd. Notes | | 5.91 | | 11/30/35 | | 400,000 c | | 397,719 |
| HSBC Finance, | | | | | | | | |
| Notes | | 5.50 | | 1/19/16 | | 800,000 | | 796,603 |
| Jefferies Group, | | | | | | | | |
| Sr. Unscd. Debs. | | 6.25 | | 1/15/36 | | 1,195,000 | | 1,156,938 |
| John Deere Capital, | | | | | | | | |
| Notes | | 5.40 | | 9/1/09 | | 555,000 c | | 555,329 |
| JPMorgan Chase & Co., | | | | | | | | |
| Sub. Notes | | 5.13 | | 9/15/14 | | 1,460,000 | | 1,439,338 |
| Kaupthing Bank, | | | | | | | | |
| Sub. Notes | | 7.13 | | 5/19/16 | | 750,000 d,e | | 812,667 |
| Lehman Brothers Holdings E-Capital | | | | | | |
| Trust I, Gtd. Notes | | 6.14 | | 8/19/65 | | 170,000 c | | 172,167 |
16
| | | Coupon | | Maturity | | Principal | | |
| Bonds and Notes (continued) | | Rate (%) | | Date | | Amount ($) | | Value ($) |
| |
| |
| |
| |
|
| Diversified Financial Services (continued) | | | | | | |
| Lehman Brothers Holdings, | | | | | | | | |
| Notes | | 5.50 | | 4/4/16 | | 315,000 | | 313,772 |
| MBNA, | | | | | | | | |
| Notes | | 6.13 | | 3/1/13 | | 1,345,000 | | 1,402,582 |
| Morgan Stanley, | | | | | | | | |
| Sub. Notes | | 4.75 | | 4/1/14 | | 1,919,000 | | 1,825,303 |
| Morgan Stanley, | | | | | | | | |
| Sr. Unscd. Notes | | 5.47 | | 2/9/09 | | 820,000 c | | 821,079 |
| MUFG Capital Finance 1, | | | | | | | | |
| Bank Gtd. Bonds | | 6.35 | | 7/29/49 | | 590,000 c | | 610,052 |
| Nuveen Investments, | | | | | | | | |
| Sr. Unscd. Notes | | 5.00 | | 9/15/10 | | 500,000 | | 495,547 |
| Residential Capital, | | | | | | | | |
| Gtd. Notes | | 6.13 | | 11/21/08 | | 350,000 | | 349,955 |
| Residential Capital, | | | | | | | | |
| Gtd. Notes | | 6.38 | | 6/30/10 | | 815,000 | | 815,369 |
| Residential Capital, | | | | | | | | |
| Sr. Notes | | 6.50 | | 4/17/13 | | 100,000 | | 99,173 |
| Residential Capital, | | | | | | | | |
| Gtd. Notes | | 7.19 | | 4/17/09 | | 900,000 c,d | | 892,647 |
| SLM, | | | | | | | | |
| Notes, Ser. A | | 5.50 | | 7/27/09 | | 1,600,000 c | | 1,601,154 |
| SMFG Preferred Capital, | | | | | | | | |
| Bonds | | 6.08 | | 1/29/49 | | 835,000 c,d | | 840,795 |
| St. George Funding, | | | | | | | | |
| Bonds | | 8.49 | | 12/29/49 | | 475,000 c,d | | 496,943 |
| Windsor Financing, | | | | | | | | |
| Gtd. Notes | | 5.88 | | 7/15/17 | | 191,113 d | | 192,072 |
| | | | | | | | | 27,359,004 |
| Diversified Metals & Mining—.3% | | | | | | | | |
| Alcan, | | | | | | | | |
| Notes | | 6.13 | | 12/15/33 | | 600,000 | | 585,312 |
| Reliance Steel & Aluminum, | | | | | | | | |
| Gtd. Notes | | 6.20 | | 11/15/16 | | 425,000 d | | 427,871 |
| | | | | | | | | 1,013,183 |
| Electric Utilities—3.3% | | | | | | | | |
| American Electric Power, | | | | | | | | |
| Sr. Unsub. Notes | | 5.25 | | 6/1/15 | | 625,000 | | 615,798 |
| Cleveland Electris Illumination, | | | | | | | | |
| Sr. Unscd. Notes | | 5.70 | | 4/1/17 | | 825,000 e | | 821,583 |
T h e F u n d 17
S TAT E M E N T O F I N V E S T M E N T S (continued)
| | | Coupon | | Maturity | | Principal | | |
| Bonds and Notes (continued) | | Rate (%) | | Date | | Amount ($) | | Value ($) |
| |
| |
| |
| |
|
| Electric Utilities (continued) | | | | | | | | |
| Consolidated Edison of NY, | | | | | | | | |
| Sr. Unscd. Debs., Ser. D | | 5.30 | | 12/1/16 | | 675,000 | | 671,172 |
| Consumers Energy, | | | | | | | | |
| First Mortgage Bonds | | 5.00 | | 2/15/12 | | 1,160,000 | | 1,147,423 |
| Dominion Resources/VA, | | | | | | | | |
| Sr. Unscd. Notes, Ser. E | | 7.20 | | 9/15/14 | | 835,000 e | | 919,160 |
| DTE Energy, | | | | | | | | |
| Sr. Unsub. Notes | | 6.35 | | 6/1/16 | | 415,000 | | 434,754 |
| FPL Energy National Wind, | | | | | | | | |
| Scd. Bonds | | 5.61 | | 3/10/24 | | 183,288 d | | 181,419 |
| FPL Group Capital, | | | | | | | | |
| Gtd. Debs. | | 5.63 | | 9/1/11 | | 1,570,000 | | 1,598,747 |
| Gulf Power, | | | | | | | | |
| Sr. Unsub. Notes, Ser. M | | 5.30 | | 12/1/16 | | 800,000 | | 795,464 |
| National Grid, | | | | | | | | |
| Sr. Unscd. Notes | | 6.30 | | 8/1/16 | | 1,000,000 | | 1,046,149 |
| NiSource Finance, | | | | | | | | |
| Gtd. Notes | | 5.25 | | 9/15/17 | | 650,000 | | 615,107 |
| NiSource Finance, | | | | | | | | |
| Gtd. Notes | | 5.93 | | 11/23/09 | | 385,000 c | | 385,665 |
| Southern, | | | | | | | | |
| Sr. Unsub. Notes, Ser. A | | 5.30 | | 1/15/12 | | 475,000 | | 478,666 |
| | | | | | | | | 9,711,107 |
| Environmental Control—.9% | | | | | | | | |
| Allied Waste of North America, | | | | | | | | |
| Scd. Notes, Ser. B | | 5.75 | | 2/15/11 | | 300,000 e | | 294,000 |
| Allied Waste, | | | | | | | | |
| Scd. Notes | | 6.38 | | 4/15/11 | | 240,000 e | | 240,600 |
| Republic Services, | | | | | | | | |
| Sr. Notes | | 6.75 | | 8/15/11 | | 610,000 | | 642,431 |
| USA Waste Services, | | | | | | | | |
| Sr. Unscd. Notes | | 7.00 | | 7/15/28 | | 1,000,000 | | 1,067,267 |
| Waste Management, | | | | | | | | |
| Gtd. Notes | | 7.38 | | 5/15/29 | | 350,000 | | 385,847 |
| | | | | | | | | 2,630,145 |
| Food & Beverages—.7% | | | | | | | | |
| H.J. Heinz, | | | | | | | | |
| Notes | | 6.43 | | 12/1/20 | | 425,000 d | | 432,513 |
18
| | | Coupon | | Maturity | | Principal | | |
| Bonds and Notes (continued) | | Rate (%) | | Date | | Amount ($) | | Value ($) |
| |
| |
| |
| |
|
| Food & Beverages (continued) | | | | | | | | |
| Safeway, | | | | | | | | |
| Sr. Unscd. Notes | | 5.63 | | 8/15/14 | | 650,000 | | 641,589 |
| Stater Brothers Holdings, | | | | | | | | |
| Sr. Notes | | 8.13 | | 6/15/12 | | 360,000 | | 372,600 |
| Tyson Foods, | | | | | | | | |
| Sr. Unscd. Notes | | 6.85 | | 4/1/16 | | 520,000 c,e | | 542,002 |
| | | | | | | | | 1,988,704 |
| Foreign/Governmental—2.9% | | | | | | | | |
| Banco Nacional de Desenvolvimento | | | | | | | | |
| Economico e Social, Unsub. | | | | | | | | |
| Notes | | 5.17 | | 6/16/08 | | 1,185,000 c | | 1,174,928 |
| Export-Import Bank of Korea, | | | | | | | | |
| Sr. Notes | | 4.50 | | 8/12/09 | | 1,075,000 | | 1,059,902 |
| Federal Republic of Brazil, | | | | | | | | |
| Unscd. Bonds BRL | | 12.50 | | 1/5/16 | | 3,310,000 e,g | | 1,840,847 |
| Republic of Argentina, | | | | | | | | |
| Bonds | | 5.48 | | 8/3/12 | | 1,205,000 c | | 864,889 |
| Republic of Argentina, | | | | | | | | |
| Bonds, Ser. VII | | 7.00 | | 9/12/13 | | 720,000 | | 694,440 |
| Republic of South Africa, | | | | | | | | |
| Notes | | 9.13 | | 5/19/09 | | 840,000 | | 905,100 |
| Russian Federation, | | | | | | | | |
| Unsub. Bonds | | 8.25 | | 3/31/10 | | 1,135,573 d | | 1,192,352 |
| United Mexican States, | | | | | | | | |
| Notes, Ser. A | | 6.75 | | 9/27/34 | | 745,000 | | 814,285 |
| | | | | | | | | 8,546,743 |
| Health Care—1.2% | | | | | | | | |
| American Home Products, | | | | | | | | |
| Unscd. Notes | | 6.95 | | 3/15/11 | | 580,000 c | | 617,177 |
| Coventry Health Care, | | | | | | | | |
| Sr. Unscd. Notes | | 5.95 | | 3/15/17 | | 400,000 | | 399,851 |
| Medco Health Solutions, | | | | | | | | |
| Sr. Unscd. Notes | | 7.25 | | 8/15/13 | | 275,000 | | 297,798 |
| Quest Diagnostics, | | | | | | | | |
| Gtd. Notes | | 5.13 | | 11/1/10 | | 365,000 | | 362,264 |
| Teva Pharmaceutical Finance, | | | | | | | | |
| Gtd. Notes | | 6.15 | | 2/1/36 | | 565,000 | | 546,747 |
T h e F u n d 19
S TAT E M E N T O F I N V E S T M E N T S (continued)
| | | Coupon | | Maturity | | Principal | | |
| Bonds and Notes (continued) | | Rate (%) | | Date | | Amount ($) | | Value ($) |
| |
| |
| |
| |
|
| Health Care (continued) | | | | | | | | |
| UnitedHealth Group, | | | | | | | | |
| Sr. Unscd. Notes | | 5.38 | | 3/15/16 | | 860,000 | | 855,150 |
| WellPoint, | | | | | | | | |
| Unscd. Notes | | 5.00 | | 1/15/11 | | 455,000 | | 453,095 |
| | | | | | | | | 3,532,082 |
| Lodging & Entertainment—.3% | | | | | | | | |
| MGM Mirage, | | | | | | | | |
| Gtd. Notes | | 8.38 | | 2/1/11 | | 350,000 e | | 370,125 |
| Mohegan Tribal Gaming Authority, | | | | | | | | |
| Sr. Unscd. Notes | | 6.13 | | 2/15/13 | | 620,000 | | 613,800 |
| | | | | | | | | 983,925 |
| Machinery—.3% | | | | | | | | |
| Case New Holland, | | | | | | | | |
| Gtd. Notes | | 7.13 | | 3/1/14 | | 320,000 | | 334,400 |
| Terex, | | | | | | | | |
| Gtd. Notes | | 7.38 | | 1/15/14 | | 405,000 | | 419,175 |
| | | | | | | | | 753,575 |
| Media—1.3% | | | | | | | | |
| AOL Time Warner, | | | | | | | | |
| Gtd. Notes | | 6.75 | | 4/15/11 | | 900,000 | | 949,317 |
| British Sky Broadcasting, | | | | | | | | |
| Gtd. Notes | | 6.88 | | 2/23/09 | | 900,000 | | 925,495 |
| Comcast, | | | | | | | | |
| Gtd. Notes | | 5.50 | | 3/15/11 | | 990,000 e | | 1,001,709 |
| News America Holdings, | | | | | | | | |
| Debs. | | 7.70 | | 10/30/25 | | 775,000 | | 884,824 |
| | | | | | | | | 3,761,345 |
| Oil & Gas—1.3% | | | | | | | | |
| Amerada Hess, | | | | | | | | |
| Unscd. Notes | | 6.65 | | 8/15/11 | | 810,000 | | 853,805 |
| Chesapeake Energy, | | | | | | | | |
| Gtd. Notes | | 7.50 | | 6/15/14 | | 155,000 | | 163,138 |
| Enterprise Products Operating, | | | | | | | | |
| Gtd. Notes, Ser. B | | 5.60 | | 10/15/14 | | 1,395,000 | | 1,393,929 |
| Gazprom, | | | | | | | | |
| Sr. Unscd. Notes | | 6.51 | | 3/7/22 | | 715,000 d | | 727,513 |
| Pemex Project Funding Master | | | | | | | | |
| Trust, Gtd. Notes | | 5.75 | | 12/15/15 | | 650,000 | | 652,113 |
| | | | | | | | | 3,790,498 |
20
| | | Coupon | | Maturity | | Principal | | |
| Bonds and Notes (continued) | | Rate (%) | | Date | | Amount ($) | | Value ($) |
| |
| |
| |
| |
|
| Packaging & Containers—.7% | | | | | | | | |
| Ball, | | | | | | | | |
| Gtd. Notes | | 6.88 | | 12/15/12 | | 205,000 | | 208,075 |
| Crown Americas/Capital, | | | | | | | | |
| Gtd. Notes | | 7.63 | | 11/15/13 | | 575,000 | | 594,406 |
| Crown Americas/Capital, | | | | | | | | |
| Gtd. Notes | | 7.75 | | 11/15/15 | | 325,000 | | 339,625 |
| Sealed Air, | | | | | | | | |
| Notes | | 5.63 | | 7/15/13 | | 830,000 d | | 833,505 |
| | | | | | | | | 1,975,611 |
| Paper & Forest Products—1.0% | | | | | | | | |
| Georgia-Pacific, | | | | | | | | |
| Gtd. Notes | | 7.00 | | 1/15/15 | | 560,000 d | | 565,600 |
| Georgia-Pacific, | | | | | | | | |
| Sr. Notes | | 8.00 | | 1/15/24 | | 780,000 e | | 787,800 |
| Temple-Inland, | | | | | | | | |
| Bonds | | 6.63 | | 1/15/18 | | 700,000 | | 737,303 |
| Westvaco, | | | | | | | | |
| Unscd. Debs. | | 7.95 | | 2/15/31 | | 465,000 | | 506,452 |
| Weyerhaeuser, | | | | | | | | |
| Unscd. Debs. | | 7.13 | | 7/15/23 | | 435,000 | | 446,677 |
| | | | | | | | | 3,043,832 |
| Property & Casualty | | | | | | | | |
| Insurance—3.9% | | | | | | | | |
| Aegon Funding, | | | | | | | | |
| Gtd. Notes | | 5.75 | | 12/15/20 | | 950,000 | | 968,431 |
| American International Group, | | | | | | | | |
| Sr. Notes | | 5.05 | | 10/1/15 | | 470,000 | | 460,624 |
| American International Group, | | | | | | | | |
| Jr. Sub. Bonds | | 6.25 | | 3/15/37 | | 425,000 | | 415,036 |
| Assurant, | | | | | | | | |
| Sr. Notes | | 6.75 | | 2/15/34 | | 725,000 | | 781,260 |
| Chubb, | | | | | | | | |
| Sr. Unscd. Notes | | 5.47 | | 8/16/08 | | 1,600,000 | | 1,606,073 |
| Hartford Financial Services Group, | | | | | | | | |
| Sr. Unscd. Notes | | 5.55 | | 8/16/08 | | 730,000 | | 733,365 |
| ING Groep, | | | | | | | | |
| Bonds | | 5.78 | | 12/29/49 | | 700,000 c | | 697,588 |
| Leucadia National, | | | | | | | | |
| Sr. Notes | | 7.13 | | 3/15/17 | | 905,000 d | | 903,869 |
T h e F u n d 21
S TAT E M E N T O F I N V E S T M E N T S (continued)
| | | Coupon | | Maturity | | Principal | | |
| Bonds and Notes (continued) | | Rate (%) | | Date | | Amount ($) | | Value ($) |
| |
| |
| |
| |
|
| Property & Casualty Insurance (continued) | | | | | | |
| Lincoln National, | | | | | | | | |
| Sr. Unscd. Notes | | 5.42 | | 3/12/10 | | 720,000 c | | 720,663 |
| Lincoln National, | | | | | | | | |
| Jr. Unsub. Cap. Secs. | | 7.00 | | 5/17/66 | | 830,000 c | | 871,226 |
| Metlife, | | | | | | | | |
| Sr. Notes | | 5.50 | | 6/15/14 | | 2,195,000 | | 2,213,888 |
| Nippon Life Insurance, | | | | | | | | |
| Notes | | 4.88 | | 8/9/10 | | 850,000 d | | 837,360 |
| Phoenix Cos., | | | | | | | | |
| Sr. Unscd. Notes | | 6.68 | | 2/16/08 | | 355,000 | | 357,379 |
| | | | | | | | | 11,566,762 |
| Real Estate Investment Trusts—5.3% | | | | | | |
| Archstone-Smith Operating Trust, | | | | | | | | |
| Sr. Unscd. Notes | | 5.25 | | 5/1/15 | | 900,000 | | 889,965 |
| Arden Realty, | | | | | | | | |
| Notes | | 5.25 | | 3/1/15 | | 675,000 | | 671,330 |
| Boston Properties, | | | | | | | | |
| Sr. Notes | | 5.00 | | 6/1/15 | | 810,000 | | 789,193 |
| Commercial Net Lease Realty, | | | | | | | | |
| Sr. Unscd. Notes | | 6.15 | | 12/15/15 | | 375,000 | | 382,603 |
| Duke Realty, | | | | | | | | |
| Notes | | 3.50 | | 11/1/07 | | 890,000 | | 880,110 |
| Duke Realty, | | | | | | | | |
| Sr. Notes | | 5.88 | | 8/15/12 | | 2,210,000 | | 2,257,495 |
| ERP Operating, | | | | | | | | |
| Notes | | 5.13 | | 3/15/16 | | 615,000 | | 600,845 |
| ERP Operating, | | | | | | | | |
| Notes | | 5.25 | | 9/15/14 | | 150,000 | | 148,928 |
| ERP Operating, | | | | | | | | |
| Unscd. Notes | | 5.38 | | 8/1/16 | | 255,000 e | | 253,476 |
| Federal Realty Investment Trust, | | | | | | | | |
| Sr. Unscd. Bonds | | 5.65 | | 6/1/16 | | 550,000 | | 551,435 |
| Federal Realty Investment Trust, | | | | | | | | |
| Notes | | 6.00 | | 7/15/12 | | 155,000 | | 159,375 |
| Healthcare Realty Trust, | | | | | | | | |
| Sr. Unscd. Notes | | 5.13 | | 4/1/14 | | 875,000 | | 842,619 |
| Host Hotels & Resorts, | | | | | | | | |
| Gtd. Notes | | 6.88 | | 11/1/14 | | 135,000 | | 137,700 |
22
| | | Coupon | | Maturity | | Principal | | |
| Bonds and Notes (continued) | | Rate (%) | | Date | | Amount ($) | | Value ($) |
| |
| |
| |
| |
|
| Real Estate Investment Trusts (continued) | | | | | | |
| HRPT Properties Trust, | | | | | | | | |
| Sr. Unscd. Notes | | 5.95 | | 3/16/11 | | 825,000 c | | 825,908 |
| Istar Financial, | | | | | | | | |
| Sr. Unscd. Notes | | 5.69 | | 3/9/10 | | 1,100,000 c | | 1,101,342 |
| Liberty Property, | | | | | | | | |
| Sr. Unscd. Notes | | 5.50 | | 12/15/16 | | 320,000 | | 318,363 |
| Mack-Cali Realty, | | | | | | | | |
| Unscd. Notes | | 5.05 | | 4/15/10 | | 400,000 | | 396,731 |
| Mack-Cali Realty, | | | | | | | | |
| Notes | | 5.25 | | 1/15/12 | | 675,000 | | 669,636 |
| Mack-Cali Realty, | | | | | | | | |
| Bonds | | 5.80 | | 1/15/16 | | 690,000 | | 695,831 |
| Regency Centers, | | | | | | | | |
| Gtd. Notes | | 5.25 | | 8/1/15 | | 220,000 | | 214,506 |
| Simon Property Group, | | | | | | | | |
| Unsub. Notes | | 5.00 | | 3/1/12 | | 1,000,000 | | 991,599 |
| Simon Property Group, | | | | | | | | |
| Unscd. Notes | | 5.75 | | 5/1/12 | | 200,000 | | 204,708 |
| Socgen Real Estate, | | | | | | | | |
| Bonds | | 7.64 | | 12/29/49 | | 1,590,000 c,d | | 1,608,081 |
| | | | | | | | | 15,591,779 |
| Residential Mortgage | | | | | | | | |
| Pass-Through Ctfs.—5.7% | | | | | | | | |
| Bayview Commercial Asset Trust, | | | | | | | | |
| Ser. 2006-1A, Cl. B2 | | 7.02 | | 4/25/36 | | 205,246 c,d | | 207,191 |
| ChaseFlex Trust, | | | | | | | | |
| Ser. 2006-2, Cl. A1A | | 5.59 | | 9/25/36 | | 446,149 c | | 445,864 |
| Citigroup Mortgage Loan Trust, | | | | | | | | |
| Ser. 2005-WF2, Cl. AF2 | | 4.92 | | 8/25/35 | | 577,873 c | | 574,029 |
| Citigroup Mortgage Loan Trust, | | | | | | | | |
| Ser. 2005-WF2, Cl. AF7 | | 5.25 | | 8/25/35 | | 1,650,000 c | | 1,626,653 |
| Citigroup Mortgage Loan Trust, | | | | | | | | |
| Ser. 2006-WF1, Cl. A2A | | 5.70 | | 3/25/36 | | 226,389 c | | 225,776 |
| Countrywide Asset-Backed | | | | | | | | |
| Certificates, Ser. 2007-4, | | | | | | | | |
| Cl. A1A | | 5.44 | | 9/25/37 | | 645,000 c | | 645,000 |
| CSAB Mortgage Backed Trust, | | | | | | | | |
| Ser. 2006-3, Cl. A1A | | 6.00 | | 11/25/36 | | 2,416,078 c | | 2,410,860 |
T h e F u n d 23
S TAT E M E N T O F I N V E S T M E N T S (continued)
| | | Coupon | | Maturity | | Principal | | |
| Bonds and Notes (continued) | | Rate (%) | | Date | | Amount ($) | | Value ($) |
| |
| |
| |
| |
|
| Residential Mortgage | | | | | | | | |
| Pass-Through Ctfs. (continued) | | | | | | | | |
| First Horizon Alternative Mortgage | | | | | | |
| Securities, Ser. 2004-FA1, | | | | | | | | |
| Cl. 1A1 | | 6.25 | | 10/25/34 | | 4,147,898 | | 4,184,594 |
| Impac Secured Assets CMN Owner | | | | | | | | |
| Trust, Ser. 2006-1, Cl. 2A1 | | 5.67 | | 5/25/36 | | 491,893 c | | 493,165 |
| IndyMac Index Mortgage Loan Trust, | | | | | | |
| Ser. 2006-AR9, Cl. B2 | | 6.07 | | 6/25/36 | | 119,904 c | | 119,566 |
| IndyMac Index Mortgage Loan Trust, | | | | | | |
| Ser. 2006-AR25, Cl. 4A2 | | 6.18 | | 9/25/36 | | 1,504,704 c | | 1,523,955 |
| J.P. Morgan Alternative Loan | | | | | | | | |
| Trust, Ser. 2006-S4, Cl. A6 | | 5.71 | | 12/25/36 | | 745,000 c | | 753,520 |
| Nomura Asset Acceptance, | | | | | | | | |
| Ser. 2005-AP2, Cl. A5 | | 4.98 | | 5/25/35 | | 775,000 c | | 759,572 |
| Nomura Asset Acceptance, | | | | | | | | |
| Ser. 2005-WF1, Cl. 2A5 | | 5.16 | | 3/25/35 | | 779,000 c | | 768,117 |
| Residential Funding Mortgage | | | | | | | | |
| Securities I, Ser. 2004-S3, | | | | | | | | |
| Cl. M1 | | 4.75 | | 3/25/19 | | 1,165,211 | | 1,127,273 |
| Washington Mutual, | | | | | | | | |
| Ser. 2005-AR4, Cl. A4B | | 4.67 | | 4/25/35 | | 1,025,000 c | | 1,012,045 |
| | | | | | | | | 16,877,180 |
| Retail—.2% | | | | | | | | |
| CVS, | | | | | | | | |
| Sr. Unscd. Notes | | 5.75 | | 8/15/11 | | 255,000 | | 259,946 |
| Federated Retail Holding, | | | | | | | | |
| Gtd. Bonds | | 5.35 | | 3/15/12 | | 155,000 | | 154,760 |
| Federated Retail Holding, | | | | | | | | |
| Gtd. Notes | | 5.90 | | 12/1/16 | | 265,000 | | 264,493 |
| | | | | | | | | 679,199 |
| State/Government Gen. Oblg.—2.0% | | | | | | |
| Erie Tobacco Asset | | | | | | | | |
| Securitization/NY, Tobacco | | | | | | | | |
| Settlement Asset-Backed Bonds | | 6.00 | | 6/1/28 | | 600,000 | | 603,012 |
| Michigan Tobacco Settlement | | | | | | | | |
| Finance Authority, Tobacco | | | | | | | | |
| Settlement Asset-Backed Bonds | | 7.31 | | 6/1/34 | | 2,410,000 | | 2,525,126 |
| Michigan Tobacco Settlement | | | | | | | | |
| Finance Authority, Tobacco | | | | | | | | |
| Settlement Asset-Backed Bonds | | 7.43 | | 6/1/34 | | 600,000 c | | 599,004 |
24
| | | Coupon | | Maturity | | Principal | | |
| Bonds and Notes (continued) | | Rate (%) | | Date | | Amount ($) | | Value ($) |
| |
| |
| |
| |
|
| State/Government Gen. Oblg. (continued) | | | | | | |
| Tobacco Settlement Authority of | | | | | | | | |
| Iowa, Tobacco Settlement | | | | | | | | |
| Asset-Backed Bonds | | 6.50 | | 6/1/23 | | 2,320,000 | | 2,312,831 |
| | | | | | | | | 6,039,973 |
| Technology—.2% | | | | | | | | |
| Hewlett-Packard, | | | | | | | | |
| Sr. Unscd. Notes | | 5.49 | | 5/22/09 | | 650,000 c | | 650,935 |
| Telecommunications—2.8% | | | | | | | | |
| AT & T Wireless, | | | | | | | | |
| Sr. Notes | | 8.75 | | 3/1/31 | | 440,000 | | 569,207 |
| AT & T, | | | | | | | | |
| Sr. Notes | | 5.45 | | 5/15/08 | | 450,000 c | | 450,446 |
| AT & T, | | | | | | | | |
| Sr. Notes | | 7.30 | | 11/15/11 | | 740,000 c | | 804,100 |
| Deutsche Telekom International | | | | | | | | |
| Finance, Gtd. Bonds | | 8.25 | | 6/15/30 | | 655,000 c | | 813,660 |
| France Telecom, | | | | | | | | |
| Notes | | 8.50 | | 3/1/31 | | 615,000 c | | 801,640 |
| KPN, | | | | | | | | |
| Sr. Unsub. Bonds | | 8.38 | | 10/1/30 | | 1,435,000 | | 1,628,988 |
| Nextel Communications, | | | | | | | | |
| Gtd. Notes, Ser. F | | 5.95 | | 3/15/14 | | 500,000 | | 492,595 |
| Nextel Partners, | | | | | | | | |
| Gtd. Notes | | 8.13 | | 7/1/11 | | 410,000 | | 428,282 |
| Nordic Telephone Holdings, | | | | | | | | |
| Scd. Notes EUR | | 8.25 | | 5/1/16 | | 285,000 d,g | | 415,825 |
| Qwest, | | | | | | | | |
| Notes | | 8.88 | | 3/15/12 | | 50,000 c | | 55,500 |
| Telefonica Emisiones, | | | | | | | | |
| Gtd. Notes | | 5.98 | | 6/20/11 | | 625,000 | | 641,266 |
| Verizon Global Funding, | | | | | | | | |
| Sr. Notes | | 5.85 | | 9/15/35 | | 300,000 | | 284,655 |
| Verizon Global Funding, | | | | | | | | |
| Notes | | 7.75 | | 6/15/32 | | 245,000 | | 285,187 |
| Windstream, | | | | | | | | |
| Gtd. Notes | | 8.13 | | 8/1/13 | | 595,000 | | 647,063 |
| | | | | | | | | 8,318,414 |
| Textiles & Apparel—.2% | | | | | | | | |
| Mohawk Industries, | | | | | | | | |
| Sr. Unscd. Notes | | 5.75 | | 1/15/11 | | 700,000 | | 710,338 |
T h e F u n d 25
S TAT E M E N T O F I N V E S T M E N T S (continued)
| | | Coupon | | Maturity | | Principal | | |
| Bonds and Notes (continued) | | Rate (%) | | Date | | Amount ($) | | Value ($) |
| |
| |
| |
| |
|
| U.S. Government Agencies—.2% | | | | | | | | |
| Small Business Administration | | | | | | | | |
| Participation Ctfs., Gov’t | | | | | | | | |
| Gtd. Ctfs., Ser. 97-J | | 6.55 | | 10/1/17 | | 545,792 | | 563,338 |
| U.S. Government Agencies/ | | | | | | | | |
| Mortgage-Backed—37.9% | | | | | | | | |
| Federal Home Loan Mortgage Corp: | | | | | | | | |
| 3.50%, 9/1/10 | | | | | | 282,668 | | 272,766 |
| 4.50%, 4/1/19 | | | | | | 3,200,000 h | | 3,097,984 |
| 5.00%, 4/15/14 | | | | | | 7,425,000 | | 7,322,906 |
| 5.50%, 4/15/14 | | | | | | 7,210,000 | | 7,225,718 |
| Multiclass Mortgage Participation Ctfs., | | | | | | |
| Ser. 51, Cl. E, 10.00%, 7/15/20 | | | | 338,100 | | 337,167 |
| Multiclass Mortgage Participation Ctfs. | | | | | | |
| (Interest Only) Ser. 2750, | | | | | | | | |
| Cl. IK, 5.00%, 5/15/26 | | | | | | 4,617,400 i | | 589,155 |
| Federal National Mortgage Association: | | | | | | |
| 5.00% | | | | | | 18,355,000 h | | 17,927,519 |
| 5.50% | | | | | | 14,300,000 h | | 14,152,424 |
| 6.00% | | | | | | 21,495,000 h | | 21,764,933 |
| 4.00%, 5/1/10 | | | | | | 1,536,660 | | 1,495,048 |
| 5.50%, 9/1/34 | | | | | | 631,669 | | 626,324 |
| 6.00%, 1/1/19—4/1/33 | | | | | | 1,691,979 | | 1,722,228 |
| 8.00%, 12/1/25 | | | | | | 41,901 | | 44,284 |
| Pass-Through Ctfs., | | | | | | | | |
| Ser. 2004-58, Cl. LJ, 5.00%, 7/25/34 | | | | 2,186,394 | | 2,178,830 |
| Pass-Through Ctfs., | | | | | | | | |
| Ser. 1988-16, Cl. B, 9.50%, 6/25/18 | | | | 166,680 | | 180,040 |
| Government National Mortgage Association I: | | | | | | |
| 5.50%, 4/15/33 | | | | | | 4,849,112 | | 4,830,395 |
| 7.00%, 6/15/08 | | | | | | 1,368 | | 1,373 |
| 6.86%, 4/15/07 | | | | | | 12,672,165 | | 12,382,776 |
| 9.50%, 11/15/17 | | | | | | 363,166 | | 388,726 |
| Ser. 2004-23, Cl. B, 2.95%, 3/16/19 | | | | 2,633,727 | | 2,539,181 |
| Ser. 2005-90, Cl. A, 3.76%, 9/16/28 | | | | 1,366,276 | | 1,327,446 |
| Ser. 2005-29, Cl. A, 4.02%, 7/16/27 | | | | 872,834 | | 852,401 |
| Ser. 2006-6, Cl. A, 4.05%, 10/16/23 | | | | 170,993 | | 167,857 |
| Ser. 2006-66, Cl. A, 4.09%, 1/16/30 | | | | 1,589,604 | | 1,552,523 |
| Ser. 2006-3, Cl. A, 4.21%, 1/16/28 | | | | 1,698,833 | | 1,665,869 |
| Ser. 2006-5, Cl. A, 4.24%, 7/16/29 | | | | 1,214,907 | | 1,191,665 |
| Ser. 2006-55, Cl. A, 4.25%, 7/16/29 | | | | 1,445,023 | | 1,415,284 |
| Ser. 2005-32, Cl. B, 4.39%, 8/16/30 | | | | 1,175,000 | | 1,157,845 |
| Ser. 2005-87, Cl. A, 4.45%, 3/16/25 | | | | 1,011,512 | | 996,994 |
26
| | | Principal | | |
| Bonds and Notes (continued) | | Amount ($) | | Value ($) |
| |
| |
|
| U.S. Government Agencies/ | | | | |
| Mortgage-Backed (continued) | | | | |
| Federal Home Loan Mortgage Corp., | | | | |
| Multiclass Mortgage Participation Ctfs., | | |
| Ser. 2586, Cl. WE, 4.00%, 12/15/32 | | 2,438,051 | | 2,308,790 |
| | | | | 111,716,451 |
| U.S. Government Securities—17.6% | | | | |
| U.S. Treasury Bonds: | | | | |
| 4.50%, 2/15/36 | | 3,800,000 f | | 3,583,878 |
| 4.75%, 2/15/37 | | 9,095,000 f | | 8,955,737 |
| U.S. Treasury Notes: | | | | |
| 4.38%, 12/31/07 | | 750,000 j | | 746,778 |
| 4.50%, 3/31/09 | | 14,335,000 f | | 14,317,096 |
| 4.50%, 9/30/11 | | 3,150,000 e | | 3,145,816 |
| 4.63%, 11/15/09 | | 6,845,000 e | | 6,857,567 |
| 4.63%, 2/15/17 | | 14,260,000 f | | 14,235,501 |
| | | | | 51,842,373 |
| Total Bonds and Notes | | | | |
| (cost $400,095,068) | | | | 397,718,696 |
| |
| |
|
| |
| | | Face Amount | | |
| | | Covered by | | |
| Options—.1% | | Contracts ($) | | Value ($) |
| |
| |
|
| Call Options—.1% | | | | |
| 3-Month Floor USD Libor-BBA | | | | |
| Interest Rate, January 2009 @ 4 | | 15,500,000 | | 13,960 |
| 3-Month USD Libor-BBA, | | | | |
| Swaption | | 9,020,000 | | 398,422 |
| | | | | 412,382 |
| Put Options—.0% | | | | |
| 3-Month Capped USD Libor-BBA | | | | |
| Interest Rate, June 2007 @ 5.75 | | 63,000,000 | | 1 |
| Total Options | | | | |
| (cost $486,165) | | | | 412,383 |
| |
| |
|
| |
| | | Principal | | |
| Short-Term Investments—.9% | | Amount ($) | | Value ($) |
| |
| |
|
| Commercial Paper | | | | |
| Cox Enterprises, | | | | |
| 5.60%, 8/15/07 | | | | |
| (cost $2,600,000) | | 2,600,000 c,d | | 2,600,000 |
T h e F u n d 27
S TAT E M E N T O F I N V E S T M E N T S (continued)
| Other Investment—4.3% | | Shares | | Value ($) |
| |
| |
|
| Registered Investment Company; | | | | |
| Dreyfus Institutional Preferred | | | | |
| Plus Money Market Fund | | | | | | |
| (cost $12,604,000) | | | | 12,604,000 k | | 12,604,000 |
| |
| |
| |
|
| |
| Investment of Cash Collateral | | | | |
| for Securities Loaned—4.3% | | | | |
| |
| |
|
| Registered Investment Company; | | | | |
| Dreyfus Institutional Cash | | | | | | |
| Advantage Fund | | | | | | |
| (cost $12,639,265) | | | | 12,639,265 k | | 12,639,265 |
| |
| |
| |
|
| |
| Total Investments (cost $428,424,498) | | 144.5% | | 425,974,344 |
| |
| Liabilities, Less Cash and Receivables | | (44.5%) | | (131,220,148) |
| |
| Net Assets | | | | 100.0% | | 294,754,196 |
| |
| a | | Non-income producing—security in default. | | | | |
| b | | The value of this security has been determined in good faith under the direction of the Board of Directors. |
| c | | Variable rate security—interest rate subject to periodic change. | | |
| d | | Securities exempt from registration under Rule 144A of the Securities Act of 1933.These securities may be resold |
| | | transactions exempt from registration, normally to qualified institutional buyers. At March 31, 2007, these securities |
| | | amounted to $39,047,055 or 13.2% of net assets. | | | | |
| e | | All or a portion of these securities are on loan. At March 31, 2007, the total market value of the fund’s securities |
| | | loan is $21,873,585 and the total market value of the collateral held by the fund is $22,713,078, consisting of |
| | | cash collateral of $12,639,265, U.S. Government and agency securities valued at $3,287,813, and Letters of |
| | | Credit valued at $6,786,000. | | | | | | |
| f | | Purchased on a delayed delivery basis. | | | | |
| g | | Principal amount stated in U.S. Dollars unless otherwise noted. | | |
| | | BRL—Brazilian Real EUR—Euro. | | | | |
| h | | Purchased on a forward commitment basis. | | | | |
| i | | Notional face amount shown. | | | | | | |
| j | | Held by a broker as collateral for open financial futures positions. | | |
| k | | Investment in affiliated money market mutual fund. | | | | |
| |
| |
| |
|
| |
| |
| Portfolio Summary (Unaudited) † | | | | |
| |
| | | | | Value (%) | | | | Value (%) |
| |
| |
| |
| |
|
| U.S. Government & Agencies | | 55.7 | | Foreign/Governmental | | 2.9 |
| Corporate Bonds | | 45.7 | | State/Government | | |
| Asset/Mortgage-Backed | | 28.6 | | General Obligations | | 2.0 |
| Short-Term/Money | | | | Options | | .1 |
| Market Investments | | 9.5 | | | | 144.5 |
| |
| † | | Based on net assets. | | | | | | |
| See notes to financial statements. | | | | | | |
28
S TAT E M E N T O F F I N A N C I A L F U T U R E S
| M a r c h 3 1 , 2 0 0 7 | | | | | | | | |
| |
| |
| |
| |
|
| |
| |
| |
| | | | | | | | | Unrealized |
| | | | | Market Value | | | | Appreciation |
| | | | | Covered by | | | | (Depreciation) |
| | | Contracts | | Contracts ($) | | Expiration | | at 3/31/2007 ($) |
| |
| |
| |
| |
|
| Financial Futures Long | | | | | | | | |
| U.S. Treasury 2 Year Notes | | 178 | | 36,470,530 | | June 2007 | | 11,499 |
| U.S. Treasury 5 Year Notes | | 64 | | 6,771,000 | | June 2007 | | (5,999) |
| Financial Futures Short | | | | | | | | |
| U.S. Treasury 10 Year Notes | | 249 | | (26,923,124) | | June 2007 | | 80,766 |
| U.S. Treasury 30 Year Bonds | | 174 | | (19,357,500) | | June 2007 | | 233,117 |
| | | | | | | | | 319,383 |
See notes to financial statements.
T h e F u n d 29
S TAT E M E N T O F A S S E T S A N D L I A B I L I T I E S
| M a r c h 3 1 , 2 0 0 7 | | | | |
| |
| |
|
| |
| |
| |
| |
| | | Cost | | Value |
| |
| |
|
| Assets ($): | | | | |
| Investments in securities—See Statement | | | | |
| of Investments (including securities on loan, | | |
| valued at $21,873,585)—Note 1(c): | | | | |
| Unaffiliated issuers | | 403,181,233 | | 400,731,079 |
| Affiliated issuers | | 25,243,265 | | 25,243,265 |
| Cash denominated in foreign currencies | | 22 | | 22 |
| Receivable for investment securities sold | | | | 15,031,880 |
| Dividends and interest receivable | | | | 3,616,707 |
| Unrealized appreciation on swap contracts—Note 4 | | 102,739 |
| Swaps premiums paid | | | | 65,426 |
| Receivable for futures variation margin—Note 4 | | 63,337 |
| Receivable from broker for swap transactions—Note 4 | | 22,711 |
| Receivable for shares of Common Stock subscribed | | 13,989 |
| Prepaid expenses | | | | 29,920 |
| | | | | 444,921,075 |
| |
| |
|
| Liabilities ($): | | | | |
| Due to The Dreyfus Corporation and affiliates—Note 3(b) | | 207,287 |
| Payable for investment securities purchased | | 114,571,734 |
| Cash overdraft due to Custodian | | | | 14,253,792 |
| Liability for securities on loan—Note 1(c) | | | | 12,639,265 |
| Payable for shares of Common Stock redeemed | | 8,144,298 |
| Unrealized depreciation on swap contracts—Note 4 | | 193,317 |
| Unrealized depreciation on forward currency | | |
| exchange contracts—Note 4 | | | | 421 |
| Accrued expenses | | | | 156,765 |
| | | | | 150,166,879 |
| |
| |
|
| Net Assets ($) | | | | 294,754,196 |
| |
| |
|
| Composition of Net Assets ($): | | | | |
| Paid-in capital | | | | 333,371,758 |
| Accumulated undistributed investment income—net | | 4,255,450 |
| Accumulated net realized gain (loss) on investments | | (40,694,537) |
| Accumulated net unrealized appreciation (depreciation) | | |
| on investments, foreign currency transactions, options | | |
| transactions and swap transactions (including $319,383 net | | |
| unrealized appreciation on financial futures) | | (2,178,475) |
| |
|
| Net Assets ($) | | | | 294,754,196 |
| |
| |
|
| Shares Outstanding | | | | |
| (100 million shares of $.001 par value Common Stock authorized) | | 21,709,642 |
| Net Asset Value, offering and redemption price per share ($) | | 13.58 |
See notes to financial statements.
30
| S TAT E M E N T | | O F O P E R AT I O N S | | |
| Ye a r E n d e d M a r c h | | 3 1 , 2 0 0 7 | | |
| |
| |
|
| |
| |
| |
| |
| Investment Income ($): | | |
| Income: | | | | |
| Interest | | | | 16,751,116 |
| Cash dividends; | | | | |
| Affiliated issuers | | | | 294,218 |
| Income from securities lending | | 15,239 |
| Total Income | | | | 17,060,573 |
| Expenses: | | | | |
| Management fee—Note 3(a) | | 2,055,808 |
| Shareholder servicing costs—Note 3(b) | | 723,066 |
| Custodian fees—Note 3(b) | | 64,929 |
| Professional fees | | | | 63,183 |
| Prospectus and shareholders’ reports | | 46,532 |
| Directors’ fees and expenses—Note 3(c) | | 40,391 |
| Registration fees | | | | 29,527 |
| Miscellaneous | | | | 60,902 |
| Total Expenses | | | | 3,084,338 |
| Less—reduction in management fee | | |
| due to undertaking—Note 3(a) | | (198,820) |
| Less—reduction in custody fees due to | | |
| earnings credits—Note 1(c) | | (15,354) |
| Net Expenses | | | | 2,870,164 |
| Investment Income—Net | | 14,190,409 |
| |
|
| Realized and Unrealized Gain (Loss) on Investments—Note 4 ($): |
| Net realized gain (loss) on investments and foreign currency transactions | | (868,455) |
| Net realized gain (loss) on forward currency exchange contracts | | 104,907 |
| Net realized gain (loss) on financial futures | | (489,455) |
| Net realized gain (loss) on options transactions | | (21,295) |
| Net realized gain (loss) on swap transactions | | 277,392 |
| Net Realized Gain (Loss) | | (996,906) |
| Net unrealized appreciation (depreciation) on investments, | | |
| foreign currency transactions, options transactions and | | |
| swap transactions (including $52,289 net unrealized | | |
| appreciation on financial futures) | | 6,785,092 |
| Net Realized and Unrealized Gain (Loss) on Investments | | 5,788,186 |
| Net Increase in Net Assets Resulting from Operations | | 19,978,595 |
| |
| See notes to financial statements. | | |
T h e F u n d 31
S TAT E M E N T O F C H A N G E S I N N E T A S S E T S
| | | | | Year Ended March 31, |
| |
| |
|
| | | 2007 | | 2006 |
| |
| |
|
| Operations ($): | | | | |
| Investment income—net | | 14,190,409 | | 13,569,028 |
| Net realized gain (loss) on investments | | (996,906) | | (1,005,583) |
| Net unrealized appreciation | | | | |
| (depreciation) on investments | | 6,785,092 | | (3,525,476) |
| Net Increase (Decrease) in Net Assets | | | | |
| Resulting from Operations | | 19,978,595 | | 9,037,969 |
| |
| |
|
| Dividends to Shareholders from ($): | | | | |
| Investment income—net | | (14,736,923) | | (17,484,365) |
| |
| |
|
| Capital Stock Transactions ($): | | | | |
| Net proceeds from shares sold | | 16,132,089 | | 24,627,689 |
| Dividends reinvested | | 13,012,053 | | 15,462,472 |
| Cost of shares redeemed | | (77,714,773) | | (79,625,020) |
| Increase (Decrease) in Net Assets from | | | | |
| Capital Stock Transactions | | (48,570,631) | | (39,534,859) |
| Total Increase (Decrease) in Net Assets | | (43,328,959) | | (47,981,255) |
| |
| |
|
| Net Assets ($): | | | | |
| Beginning of Period | | 338,083,155 | | 386,064,410 |
| End of Period | | 294,754,196 | | 338,083,155 |
| Undistributed investment income—net | | 4,255,450 | | 3,864,186 |
| |
| |
|
| Capital Share Transactions (Shares): | | | | |
| Shares sold | | 1,201,558 | | 1,798,349 |
| Shares issued for dividends reinvested | | 973,439 | | 1,132,772 |
| Shares redeemed | | (5,798,835) | | (5,830,650) |
| Net Increase (Decrease) in Shares Outstanding | | (3,623,838) | | (2,899,529) |
See notes to financial statements.
32
F I N A N C I A L H I G H L I G H T S
The following table describes the performance for the fiscal periods indicated. Total return shows how much your investment in the fund would have increased (or decreased) during each period, assuming you had reinvested all dividends and distributions.These figures have been derived from the fund’s financial statements.
| | | | | Year Ended March 31, | | |
| |
| |
| |
|
| | | 2007 | | 2006 | | 2005 | | 2004a | | 2003 |
| |
| |
| |
| |
| |
|
| Per Share Data ($): | | | | | | | | | | |
| Net asset value, beginning of period | | 13.35 | | 13.67 | | 14.14 | | 14.12 | | 13.47 |
| Investment Operations: | | | | | | | | | | |
| Investment income—net b | | .60 | | .50 | | .47 | | .44 | | .63 |
| Net realized and unrealized | | | | | | | | | | |
| gain (loss) on investments | | .25 | | (.17) | | (.35) | | .11 | | .71 |
| Total from Investment Operations | | .85 | | .33 | | .12 | | .55 | | 1.34 |
| Distributions: | | | | | | | | | | |
| Dividends from investment income—net | | (.62) | | (.65) | | (.59) | | (.53) | | (.69) |
| Net asset value, end of period | | 13.58 | | 13.35 | | 13.67 | | 14.14 | | 14.12 |
| |
| |
| |
| |
| |
|
| Total Return (%) | | 6.48 | | 2.39 | | .89 | | 4.01 | | 10.30 |
| |
| |
| |
| |
| |
|
| Ratios/Supplemental Data (%): | | | | | | | | | | |
| Ratio of total expenses | | | | | | | | | | |
| to average net assets | | .98 | | .92 | | .93 | | .93 | | .93 |
| Ratio of net expenses | | | | | | | | | | |
| to average net assets | | .91 | | .82 | | .91 | | .93 | | .93 |
| Ratio of net investment income | | | | | | | | | | |
| to average net assets | | 4.49 | | 3.66 | | 3.42 | | 3.09 | | 4.56 |
| Portfolio Turnover Rate | | 405.17c | | 444.62c | | 648.92c | | 803.93c | | 636.05 |
| |
| |
| |
| |
| |
|
| Net Assets, end of period ($ x 1,000) | | 294,754 | | 338,083 | | 386,064 | | 509,354 | | 606,960 |
| a | | As of April 1, 2003, the fund has adopted the method of accounting for interim payments on swap contracts in |
| | | accordance with Financial Accounting Standards Board Statement No. 133.These interim payments are reflected |
| | | within net realized and unrealized gain (loss) on swap contracts, however, prior to April 1, 2003, these interim |
| | | payments were reflected within interest income/expense in the Statement of Operations.The effect of this change for |
| | | the period ended March 31, 2004, was to increase net investment income per share by $.01, decrease net realized |
| | | and unrealized gain (loss) on investments per share by $.01 and increase the ratio of net investment income to |
| | | average net assets from 3.04% to 3.09%. Per share data and ratios/supplemental data for periods prior to April 1, |
| | | 2003 have not been restated to reflect this change in presentation. |
| b | | Based on average shares outstanding at each month end. |
| c | | The portfolio turnover rates excluding mortgage dollar roll transactions for the periods ended March 31, 2007, |
| | | March 31, 2006, March 31, 2005 and March 31, 2004 were 157.50%, 244.67%, 585.91% and 655.66%, |
| | | respectively. |
| See notes to financial statements. |
T h e F u n d 33
N O T E S T O F I N A N C I A L S TAT E M E N T S
NOTE 1—Significant Accounting Policies:
Dreyfus A Bonds Plus, Inc. (the “fund”) is registered under the Investment Company Act of 1940, as amended (the “Act”), as a diversified open-end management investment company.The fund’s investment objective is to maximize total return, consisting of capital appreciation and current income.The Dreyfus Corporation (the “Manager” or “Dreyfus”) serves as the fund’s investment adviser.The Manager is a wholly-owned subsidiary of Mellon Financial Corporation (“Mellon Financial”). Dreyfus Service Corporation (the “Distributor”), a wholly-owned subsidiary of the Manager, is the distributor of the fund’s shares, which are sold to the public without a sales charge.
On December 4, 2006, Mellon Financial and The Bank of New York Company, Inc. announced that they had entered into a definitive agreement to merge. The new company will be called The Bank of New York Mellon Corporation. As part of this transaction, Dreyfus would become a wholly-owned subsidiary of The Bank of New York Mellon Corporation.The transaction is subject to certain regulatory approvals and the approval of The Bank of New York Company, Inc.’s and Mellon Financial’s shareholders, as well as other customary conditions to closing. Subject to such approvals and the satisfaction of the other conditions, Mellon Financial and The Bank of New York Company, Inc. expect the transaction to be completed in the third quarter of 2007.
The fund’s financial statements are prepared in accordance with U.S. generally accepted accounting principles, which may require the use of management estimates and assumptions. Actual results could differ from those estimates.
The fund enters into contracts that contain a variety of indemnifications. The fund’s maximum exposure under these arrangements is unknown.The fund does not anticipate recognizing any loss related to these arrangements.
34
(a) Portfolio valuation: Investments in securities (excluding short-term investments (other than U.S. Treasury Bills), financial futures, options, swaps and forward currency exchange contracts) are valued each business day by an independent pricing service (the “Service”) approved by the Board of Directors. Investments for which quoted bid prices are readily available and are representative of the bid side of the market in the judgment of the Service are valued at the mean between the quoted bid prices (as obtained by the Service from dealers in such securities) and asked prices (as calculated by the Service based upon its evaluation of the market for such securities). Other investments (which constitute a majority of the portfolio securities) are valued as determined by the Service, based on methods which include consideration of: yields or prices of securities of comparable quality, coupon, maturity and type; indications as to values from dealers; and general market conditions. Restricted securities, as well as securities or other assets for which recent market quotations are not readily available, that are not valued by a pricing service approved by the Board of Directors, or are determined by the fund not to reflect accurately fair value, are valued at fair value as determined in good faith under the direction of the Board of Directors. The factors that may be considered when fair valuing a security include fundamental analytical data, the nature and duration of restrictions on disposition, an evaluation of the forces that influence the market in which the securities are purchased and sold and public trading in similar securities of the issuer or comparable issuers. Short-term investments, excluding U.S. Treasury Bills, are carried at amortized cost, which approximates value. Registered open-end investment companies that are not traded on an exchange are valued at their net asset value. Financial futures and options, which are traded on an exchange, are valued at the last sales price on the securities exchange on which such securities are primarily traded or at the last sales price on the national securities market on each business day. Options traded over-the-counter are priced at
T h e F u n d 35
N O T E S T O F I N A N C I A L S TAT E M E N T S (continued)
the mean between the bid and asked price. Investments in swap transactions are valued each business day by an independent pricing service approved by the Board of Directors. Swaps are valued by the service by using a swap pricing model which incorporates among other factors, default probabilities, recovery rates, credit curves of the underlying issuer and swap spreads on interest rates. Investments denominated in foreign currencies are translated to U.S.dollars at the prevailing rates of exchange. Forward currency exchange contracts are valued at the forward rate.
On September 20, 2006, the Financial Accounting Standards Board (FASB) released Statement of Financial Accounting Standards No. 157 “Fair Value Measurements” (“FAS 157”). FAS 157 establishes an authoritative definition of fair value, sets out a framework for measuring fair value, and requires additional disclosures about fair-value measurements. The application of FAS 157 is required for fiscal years beginning after November 15, 2007 and interim periods within those fiscal years. Management does not believe that the application of this standard will have a material impact on the financial statements of the fund.
(b) Foreign currency transactions: The fund does not isolate that portion of the results of operations resulting from changes in foreign exchange rates on investments from the fluctuations arising from changes in market prices of securities held. Such fluctuations are included with the net realized and unrealized gain or loss from investments.
Net realized foreign exchange gains or losses arise from sales and maturities of short-term securities, sales of foreign currencies, currency gains or losses realized on securities transactions and the difference between the amounts of dividends, interest and foreign withholding taxes recorded on the fund’s books and the U.S. dollar equivalent of the amounts actually received or paid. Net unrealized foreign exchange gains and losses arise from changes in the value of assets and liabilities other than investments in securities, resulting from changes in exchange rates. Such gains and losses are included with net realized and unrealized gain or loss on investments.
36
(c) Securities transactions and investment income: Securities transactions are recorded on a trade date basis. Realized gain and loss from securities transactions are recorded on the identified cost basis. Dividend income is recognized on the ex-dividend date and interest income, including, where applicable, accretion of discount and amortization of premium on investments, is recognized on the accrual basis.
The fund has an arrangement with the custodian bank whereby the fund receives earnings credits from the custodian when positive cash balances are maintained, which are used to offset custody fees. For financial reporting purposes, the fund includes net earnings credits as an expense offset in the Statement of Operations.
Pursuant to a securities lending agreement with Mellon Bank, N.A., an affiliate of the Manager, the fund may lend securities to qualified institutions. It is the fund’s policy, that at origination, all loans are secured by collateral of at least 102% of the value of U.S. securities loaned and 105% of the value of foreign securities loaned. Collateral equivalent to at least 100% of the market value of securities on loan is maintained at all times. Cash collateral is invested in certain money market mutual funds managed by the Manager.The fund is entitled to receive all income on securities loaned, in addition to income earned as a result of the lending transaction.Although each security loaned is fully collateralized, the fund bears the risk of delay in recovery of, or loss of rights in, the securities loaned should a borrower fail to return the securities in a timely manner.
(d) Affiliated issuers: Investments in other investment companies advised by the Manager are defined as “affiliated” in the Act.
(e) Dividends to shareholders: Dividends are recorded on the ex-dividend date. Dividends from investment income-net are declared and paid monthly. Dividends from net realized capital gain, if any, are normally declared and paid annually, but the fund may make distributions on a more frequent basis to comply with the distribution
T h e F u n d 37
N O T E S T O F I N A N C I A L S TAT E M E N T S (continued)
requirements of the Internal Revenue Code of 1986, as amended (the “Code”).To the extent that net realized capital gain, can be offset by capital loss carryovers, it is the policy of the fund not to distribute such gain. Income and capital gain distributions are determined in accordance with income tax regulations, which may differ from U.S. generally accepted accounting principles.
On March 30, 2007, the Board of Directors declared a cash dividend of $.067 per share from undistributed investment income-net, payable on April 2, 2007 (ex-dividend date), to shareholders of record as of the close of business on March 30, 2007.
(f) Federal income taxes: It is the policy of the fund to continue to qualify as a regulated investment company, if such qualification is in the best interests of its shareholders, by complying with the applicable provisions of the Code and to make distributions of taxable income sufficient to relieve it from substantially all federal income and excise taxes.
On July 13, 2006, the FASB released FASB Interpretation No. 48 “Accounting for Uncertainty in Income Taxes” (FIN 48). FIN 48 provides guidance for how uncertain tax positions should be recognized, measured, presented and disclosed in the financial statements. FIN 48 requires the evaluation of tax positions taken or expected to be taken in the course of preparing the fund’s tax returns to determine whether the tax positions are “more-likely-than-not” of being sustained by the applicable tax authority.Tax positions not deemed to meet the more-likely-than-not threshold would be recorded as a tax benefit or expense in the current year. Adoption of FIN 48 is required for fiscal years beginning after December 15, 2006 and is to be applied to all open tax years as of the effective date. Management does not believe that the application of this standard will have a material impact on the financial statements of the fund.
At March 31, 2007, the components of accumulated earnings on a tax basis were as follows: undistributed ordinary income $4,287,072, accumulated capital losses $38,910,290 and unrealized depreciation
38
$3,430,073. In addition, the fund had $564,271 of capital losses realized after October 31, 2006, which were deferred for tax purposes to the first day of the following fiscal year.
The accumulated capital loss carryover is available to be applied against future net securities profits, if any, realized subsequent to March 31, 2007. If not applied, $13,098,116 of the carryover expires in fiscal 2008, $10,726,778 expires in fiscal 2010, $2,321,537 expires in fiscal 2011, $8,440,328 expires in fiscal 2013, $911,584 expires in fiscal 2014 and $3,411,947 expires in fiscal 2015.
The tax character of distributions paid to shareholders during the fiscal periods ended March 31, 2007 and March 31, 2006 was as follows: ordinary income $14,736,923 and $17,484,365, respectively.
During the period ended March 31, 2007, as a result of permanent book to tax differences, primarily due to the tax treatment of amortization of premiums, treasury inflation protected securities, paydown gains and losses on mortgage-backed securities, swap periodic payments, and foreign currency transactions, the fund increased accumulated undistributed investment income-net by $937,778, decreased accumulated net realized gain (loss) on investments by $922,164 and decreased paid-in capital by $15,614. Net assets were not affected by this reclassification.
NOTE 2—Bank Lines of Credit:
The fund may borrow up to $20 million for leveraging purposes under a short-term unsecured line of credit and participates with other Dreyfus-managed funds in a $100 million unsecured line of credit primarily to be utilized for temporary or emergency purposes, including the financing of redemptions. Interest is charged to the fund based on prevailing market rates in effect at the time of borrowing. During the period ended March 31, 2007, the fund did not borrow under either line of credit.
T h e F u n d 39
N O T E S T O F I N A N C I A L S TAT E M E N T S (continued)
NOTE 3—Management Fee and Other Transactions With Affiliates:
(a) Pursuant to a management agreement (“Agreement”) with the Manager, the management fee is computed at the annual rate of .65% of the value of the fund’s average daily net assets and is payable monthly. The Agreement provides that if in any full fiscal year the aggregate expenses of the fund, exclusive of taxes, interest on borrowings, brokerage commissions and extraordinary expenses, exceed 1 1 / 2% of the value of the fund’s average daily net assets, the fund may deduct from the payments to be made to the Manager, or the Manager will bear, the amount of such excess expense.The Manager had undertaken from April 1, 2006 through June 30, 2006 to waive receipt of .10% of the value of the fund’s average daily net assets and has agreed to waive .05% of the value of the fund’s average daily net assets from July 1, 2006 to June 30, 2007.The reduction in management fee, pursuant to the undertaking, amounted to $198,820 during the period ended March 31, 2007.
(b) Under the Shareholder Services Plan, the fund reimburses the Distributor an amount not to exceed an annual rate of .25% of the value of the fund’s average daily net assets for certain allocated expenses of providing personal services and/or maintaining shareholder accounts.The services provided may include personal services relating to shareholder accounts, such as answering shareholder inquiries regarding the fund and providing reports and other information, and services related to the maintenance of shareholder accounts. During the period ended March 31, 2007, the fund was charged $218,844 pursuant to the Shareholder Services Plan.
The fund compensates Dreyfus Transfer, Inc., a wholly-owned subsidiary of the Manager, under a transfer agency agreement for providing personnel and facilities to perform transfer agency services for the fund. During the period ended March 31, 2007, the fund was charged $133,299 pursuant to the transfer agency agreement.
The fund compensates Mellon Bank, N.A., an affiliate of the Manager, under a custody agreement for providing custodial services for the fund. During the period ended March 31, 2007, the fund was charged $64,929 pursuant to the custody agreement.
During the period ended March 31, 2007, the fund was charged $4,089 for services performed by the Chief Compliance Officer.
The components of Due to The Dreyfus Corporation and affiliates in the Statement of Assets and Liabilities consist of: management fees $168,260, shareholder services plan fees $1,000, custodian fees $26,695, chief compliance officer fees $3,067 and transfer agency per account fees $22,400, which are offset against an expense reimbursement currently in effect in the amount of $14,135.
(c) Each Board member also serves as a Board member of other funds within the Dreyfus complex. Annual retainer fees and attendance fees are allocated to each fund based on net assets.
(d) Pursuant to an exemptive order from the SEC, the fund may invest its available cash balances in affiliated money market mutual funds. Management fees of the underlying money market mutual funds have been waived by the Manager.
NOTE 4—Securities Transactions:
The aggregate amount of purchases and sales (including paydowns) of investment securities, excluding short-term securities, financial futures, options transactions, forward currency exchange contracts and swap transactions during the period ended March 31, 2007, amounted to $1,663,442,626 and $1,713,534,605, of which $1,016,801,475 in purchases and $1,017,089,189 in sales were from mortgage dollar roll transactions.
A mortgage dollar roll transaction involves a sale by the fund of mortgage related securities that it holds with an agreement by the fund to
T h e F u n d 41
N O T E S T O F I N A N C I A L S TAT E M E N T S (continued)
repurchase similar securities at an agreed upon price and date. The securities purchased will bear the same interest rate as those sold, but generally will be collateralized by pools of mortgages with different prepayment histories than those securities sold.
The fund may invest in financial futures contracts in order to gain exposure to or protect against changes in the market. The fund is exposed to market risk as a result of changes in the value of the underlying financial instruments. Investments in financial futures require the fund to “mark to market” on a daily basis, which reflects the change in the market value of the contracts at the close of each day’s trading. Typically, variation margin payments are received or made to reflect daily unrealized gains or losses.When the contracts are closed, the fund recognizes a realized gain or loss.These investments require initial margin deposits with a broker, which consist of cash or cash equivalents. The amount of these deposits is determined by the exchange or Board of Trade on which the contract is traded and is subject to change. Contracts open at March 31, 2007, are set forth in the Statement of Financial Futures.
The fund may purchase and write (sell) put and call options in order to gain exposure to or to protect against changes in the market.
As a writer of call options, the fund receives a premium at the outset and then bears the market risk of unfavorable changes in the price of the financial instrument underlying the option. Generally, the fund would incur a gain, to the extent of the premium, if the price of the underlying financial instrument decreases between the date the option is written and the date on which the option is terminated. Generally, the fund would realize a loss, if the price of the financial instrument increases between those dates.
As a writer of put options, the fund receives a premium at the outset and then bears the market risk of unfavorable changes in the price of the financial instrument underlying the option. Generally, the fund would incur a gain, to the extent of the premium, if the price of the
42
underlying financial instrument increases between the date the option is written and the date on which the option is terminated. Generally, the fund would realize a loss, if the price of the financial instrument decreases between those dates.
The following summarizes the fund’s call/put options written for the period ended March 31, 2007:
| | | | | | | Options Terminated |
| | Face Amount | | | |
| |
|
| | | Covered by | | Premiums | | | | Net Realized |
| Options Written: | | Contracts ($) | | Received ($) | | Cost ($) | | Gain (Loss) ($) |
| |
| |
| |
| |
|
| Contracts outstanding | | | | | | | | |
| March 31, 2006 | | 40,650,000 | | 83,270 | | | | |
| Contracts written | | 420,190,000 | | 210,988 | | | | |
| Contracts terminated: | | | | | | | | |
| Contracts closed | | 72,255,000 | | 209,701 | | 484,253 | | (274,552) |
| Contracts expired | | 388,585,000 | | 84,557 | | — | | 84,557 |
| Total contracts | | | | | | | | |
| terminated | | 460,840,000 | | 294,258 | | 484,253 | | (189,995) |
| Contracts outstanding | | | | | | |
| March 31, 2007 | | — | | — | | | | |
The fund enters into forward currency exchange contracts in order to hedge its exposure to changes in foreign currency exchange rates on its foreign portfolio holdings and to settle foreign currency transac-tions.When executing forward currency exchange contracts, the fund is obligated to buy or sell a foreign currency at a specified rate on a certain date in the future. With respect to sales of forward currency exchange contracts, the fund would incur a loss if the value of the contract increases between the date the forward contract is opened and the date the forward contract is closed.The fund realizes a gain if the value of the contract decreases between those dates. With respect to purchases of forward currency exchange contracts, the fund would incur a loss if the value of the contract decreases between the date the forward contract is opened and the date the forward contract is closed. The fund realizes a gain if the value of the contract increases between those dates. The fund is also exposed to credit risk associated with counterparty nonperformance on these forward currency exchange
T h e F u n d 43
N O T E S T O F I N A N C I A L S TAT E M E N T S (continued)
contracts which is typically limited to the unrealized gain on each open contract. The following summarizes open forward currency exchange contracts at March 31, 2007:
| | | Foreign | | | | | | Unrealized |
| Forward Currency | | Currency | | | | | | Appreciation |
| Exchange Contracts | | Amounts | | Proceeds ($) | | Value ($) | | (Depreciation) ($) |
| |
| |
| |
| |
|
| |
| Sales: | | | | | | | | |
| Euro, | | | | | | | | |
| expiring 6/20/2007 | | 290,000 | | 388,034 | | 388,455 | | (421) |
The fund may enter into swap agreements to exchange the interest rate on, or return generated by, one nominal instrument for the return generated by another nominal instrument.
The fund accrues for the interim payments on swap contracts on a daily basis, with the net amount recorded within unrealized appreciation (depreciation) on swap contracts in the Statement of Assets and Liabilities. Once the interim payments are settled in cash, the net amount is recorded as realized gain (loss) on swaps, in addition to realized gain (loss) recorded upon the termination of swap contracts in the Statement of Operations. Fluctuations in the value of swap contracts are recorded as a component of net change in unrealized appreciation (depreciation) on investments.
Credit default swaps involve commitments to pay a fixed interest rate in exchange for payment if a credit event affecting a third party (the referenced company) occurs. Credit events may include a failure to pay interest or principal, bankruptcy, or restructuring. For those credit default swaps in which the fund is receiving a fixed rate, the fund is providing credit protection on the underlying instrument.The maximum payouts for these contracts are limited to the notional amount of each swap.The following summarizes credit default swaps entered into by the fund at March 31, 2007:
| | | | | | | | | | | Unrealized |
| Notional | | Reference | | | | (Pay) Receive | | | | Appreciation |
| Amount ($) | | Entity | | Counterparty | | Fixed Rate (%) | | Expiration | | (Depreciation)($) |
| |
| |
| |
| |
| |
|
| |
| 1,340,000 | | AT&T, 5.875%, | | J.P. Morgan | | | | | | |
| | | 8/15/2012 | | Chase Bank | | (.44) | | 3/20/2017 | | (8,234) |
| 1,660,000 | | AT&T, 5.875%, | | J.P. Morgan | | | | | | |
| | | 8/15/2012 | | Chase Bank | | (.49) | | 3/20/2017 | | (16,688) |
| | | | | | | | | | | Unrealized |
| Notional | | Reference | | | | (Pay) Receive | | | | Appreciation |
| Amount ($) | | Entity | | Counterparty | | Fixed Rate (%) | | Expiration | | (Depreciation)($) |
| |
| |
| |
| |
| |
|
| |
| 930,000 | | Avon Products, | | J.P. Morgan | | | | | | |
| | | 7.15%, 11/15/2009 | | Chase Bank | | (.44) | | 3/20/2017 | | (7,826) |
| 410,000 | | Avon Products, | | J.P. Morgan | | | | | | |
| | | 7.15%, 11/15/2009 | | Chase Bank | | (.45) | | 3/20/2017 | | (3,771) |
| 620,000 | | Avon Products, | | J.P. Morgan | | | | | | |
| | | 7.15%, 11/15/2009 | | Chase Bank | | (.48) | | 3/20/2017 | | (7,158) |
| 240,000 | | Avon Products, | | J.P. Morgan | | | | | | |
| | | 7.15%, 11/15/2009 | | Chase Bank | | (.49) | | 3/20/2017 | | (2,883) |
| 800,000 | | Avon Products, | | Morgan | | | | | | |
| | | 7.15%, 11/15/2009 | | Stanley | | (.48) | | 3/20/2017 | | (9,236) |
| 737,000 | | CenturyTel, | | | | | | | | |
| | | 7.875%, 8/15/2012 | | Citigroup | | (1.16) | | 9/20/2015 | | (8,941) |
| 1,570,000 | | CenturyTel, | | | | | | | | |
| | | 7.875%, 8/15/2012 | | Citigroup | | (1.19) | | 9/20/2015 | | (22,219) |
| 213,000 | | CenturyTel, | | Morgan | | | | | | |
| | | 7.875%, 8/15/2012 | | Stanley | | (1.15) | | 9/20/2015 | | (2,441) |
| 1,350,000 | | Dow Jones | | | | | | | | |
| | | CDX.NA.IG.4 Index | | Citigroup | | (.69) | | 6/20/2010 | | (26,304) |
| 1,340,000 | | Dow Jones | | | | | | | | |
| | | CDX.NA.IG.4 Index | | Morgan Stanley | | (.69) | | 6/20/2010 | | (26,110) |
| 130,000 | | Dow Jones | | J.P. Morgan | | | | | | |
| | | CDX.NA.IG.7 Index | | Chase Bank | | .65 | | 12/20/2016 | | (1,024) |
| 930,000 | | Dow Jones | | J.P. Morgan | | | | | | |
| | | CDX.NA.IG.7 Index | | Chase Bank | | .65 | | 12/20/2016 | | (5,909) |
| 620,000 | | Dow Jones | | J.P. Morgan | | | | | | |
| | | CDX.NA.IG.7 Index | | Chase Bank | | .65 | | 12/20/2016 | | (4,104) |
| 110,000 | | Dow Jones | | J.P. Morgan | | | | | | |
| | | CDX.NA.IG.7 Index | | Chase Bank | | .65 | | 12/20/2016 | | (887) |
| 4,465,000 | | Dow Jones | | J.P. Morgan | | | | | | |
| | | CDX.NA.IG.7 Index | | Chase Bank | | .65 | | 12/20/2016 | | (35,226) |
| 410,000 | | Dow Jones | | J.P. Morgan | | | | | | |
| | | CDX.NA.IG.7 Index | | Chase Bank | | .65 | | 12/20/2016 | | (2,932) |
| 800,000 | | Dow Jones | | Morgan | | | | | | |
| | | CDX.NA.IG.7 Index | | Stanley | | .65 | | 12/20/2016 | | (6,306) |
| 6,200,000 | | Dow Jones | | | | | | | | |
| | | CDX.NA.IG.7 Index | | UBS Warburg | | .53 | | 12/20/2016 | | (59,420) |
| 740,000 | | Dow Jones | | | | | | | | |
| | | CDX.NA.IG.7 Index | | UBS Warburg | | .65 | | 12/20/2016 | | (5,823) |
| 3,100,000 | | Dow Jones | | | | | | | | |
| | | CDX.NA.IG.7 Index | | UBS Warburg | | (1.12) | | 12/20/2016 | | 59,221 |
| 720,000 | | Dow Jones | | Barclays | | | | | | |
| | | CDX.NA.IG.8 Index | | Capital | | .60 | | 6/20/2017 | | (1,102) |
| 780,000 | | Dow Jones | | | | | | | | |
| | | CDX.NA.IG.8 Index | | Goldman Sachs | | .60 | | 6/20/2017 | | (2,436) |
| 1,150,000 | | Home Depot, | | | | | | | | |
| | | 3.75%, 9/15/2009 | | Deutsche Bank | | (.56) | | 3/20/2017 | | (7,250) |
| 1,750,000 | | Kaupthing Bank, | | | | | | | | |
| | | 5.51%, 12/1/2009 | | Deutsche Bank | | .52 | | 9/20/2007 | | 3,474 |
| 425,000 | | Kaupthing Bank, | | | | | | | | |
| | | 5.51%, 12/1/2009 | | Deutsche Bank | | .65 | | 9/20/2007 | | 1,125 |
T h e F u n d 45
N O T E S T O F I N A N C I A L S TAT E M E N T S (continued)
| | | | | | | | | | | Unrealized |
| Notional | | Reference | | | | (Pay) Receive | | | | Appreciation |
| Amount ($) | | Entity | | Counterparty | | Fixed Rate (%) | | Expiration | | (Depreciation)($) |
| |
| |
| |
| |
| |
|
| |
| 322,000 | | Kimberly-Clark, | | J.P. Morgan | | | | | | |
| | | 6.875%, 2/15/2014 | | Chase Bank | | (.19) | | 12/20/2011 | | (1,161) |
| 80,000 | | Kimberly-Clark, | | J.P. Morgan | | | | | | |
| | | 6.875%, 2/15/2014 | | Chase Bank | | (.37) | | 12/20/2016 | | (839) |
| 250,000 | | Kimberly-Clark, | | J.P. Morgan | | | | | | |
| | | 6.875%, 2/15/2014 | | Chase Bank | | (.37) | | 12/20/2016 | | (2,621) |
| 170,000 | | Kimberly-Clark, | | J.P. Morgan | | | | | | |
| | | 6.875%, 2/15/2014 | | Chase Bank | | (.37) | | 12/20/2016 | | (1,782) |
| 740,000 | | Kimberly-Clark, | | | | | | | | |
| | | 6.875%, 2/15/2014 | | UBS Warburg | | (.38) | | 3/20/2017 | | (8,340) |
| 720,000 | | Kraft Foods, | | | | | | | | |
| | | 5.625%, 11/1/2011 Barclays Capital | | (.57) | | 6/20/2017 | | (1,832) |
| 780,000 | | Kraft Foods, | | | | | | | | |
| | | 5.625%, 11/1/2011 | | Goldman Sachs | | (.53) | | 6/20/2017 | | 499 |
| 490,000 | | TuranAlem Finance, | | | | | | | | |
| | | 8%, 3/24/2014 | | UBS Warburg | | 1.15 | | 1/20/2008 | | 875 |
| Total | | | | | | | | | | (225,611) |
The fund may enter into interest rate swaps which involve the exchange of commitments to pay and receive interest based on a notional principal amount. The following summarizes open interest rate swaps entered into by the fund at March 31, 2007:
| | | | | | | | | | | Unrealized |
| Notional | | Reference | | | | (Pay) Receive | | | | Appreciation |
| Amount ($) | | Entity | | Counterparty | | Fixed Rate (%) | | Expiration | | (Depreciation)($) |
| |
| |
| |
| |
| |
|
| 198,380,000 | | CZK-3 Month | | | | | | | | |
| | | PRIBOR | | Merrill Lynch | | 3.02 | | 2/14/2009 | | 15,416 |
| 1,814,800,000 | | JPY-6 Month | | | | | | | | |
| | | YENIBOR | | Deutsche Bank | | 1.29 | | 1/11/2011 | | 71,088 |
| 43,100,000 | | SEK-3 Month | | J.P. Morgan | | | | | | |
| | | STIBOR | | Chase Bank | | 3.75 | | 12/4/2008 | | 34,401 |
| 63,490,000 | | SEK-3 Month | | J.P. Morgan | | | | | | |
| | | STIBOR | | Chase Bank | | 4.06 | | 1/25/2009 | | 14,128 |
| Total | | | | | | | | | | 135,033 |
Risks may arise upon entering into these agreements from the potential inability of the counterparties to meet the terms of the agreement and are generally limited to the amount of net payments to be received, if any, at the date of default.
At March 31, 2007, the cost of investments for federal income tax purposes was $429,240,432; accordingly, accumulated net unrealized depreciation on investments was $3,266,085, consisting of $2,199,606 gross unrealized appreciation and $5,465,691 gross unrealized depreciation.
46
R E P O R T O F I N D E P E N D E N T R E G I S T E R E D P U B L I C A C C O U N T I N G F I R M
Shareholders and Board of Directors Dreyfus A Bonds Plus, Inc.
We have audited the accompanying statement of assets and liabilities of Dreyfus A Bonds Plus, Inc., including the statements of investments, financial futures and options written, as of March 31, 2007, and the related statement of operations for the year then ended, the statement of changes in net assets for each of the two years in the period then ended, and financial highlights for each of the years indicated therein. These financial statements and financial highlights are the responsibility of the Fund’s management. Our responsibility is to express an opinion on these financial statements and financial highlights based on our audits.
We conducted our audits in accordance with the standards of the Public Company Accounting Oversight Board (United States).Those standards require that we plan and perform the audit to obtain reasonable assurance about whether the financial statements and financial highlights are free of material misstatement.We were not engaged to perform an audit of the Fund’s internal control over financial reporting. Our audits included consideration of internal control over financial reporting as a basis for designing audit procedures that are appropriate in the circumstances, but not for the purpose of expressing an opinion on the effectiveness of the Fund’s internal control over financial reporting. Accordingly, we express no such opinion.An audit includes examining, on a test basis, evidence supporting the amounts and disclosures in the financial statements and financial highlights, assessing the accounting principles used and significant estimates made by management, and evaluating the overall financial statement presentation. Our procedures included confirmation of securities owned as of March 31, 2007 by correspondence with the custodian and others or by other appropriate auditing procedures where replies from others were not received. We believe that our audits provide a reasonable basis for our opinion.
In our opinion, the financial statements and financial highlights referred to above present fairly, in all material respects, the financial position of Dreyfus A Bonds Plus, Inc. at March 31, 2007, the results of its operations for the year then ended, the changes in its net assets for each of the two years in the period then ended, and the financial highlights for each of the indicated years, in conformity with U.S. generally accepted accounting principles.
New York, New York May 18, 2007
T h e F u n d 47
I M P O R TA N T TA X I N F O R M AT I O N ( U n a u d i t e d )
For federal tax purposes, the fund hereby designates 90.23% of the ordinary dividends paid during the fiscal year ended March 31, 2007 qualifying “interest related dividends.”
48
INFORMATION ABOUT THE REVIEW AND APPROVAL OF THE FUND’S MANAGEMENT AGREEMENT (Unaudited)
At a meeting of the fund’s Board of Directors held on March 7 and 8, 2007, the Board unanimously approved the continuation of the fund’s Management Agreement with Dreyfus for a one-year term ending March 31, 2008. The Board members, none of whom are “interested persons” (as defined in the Investment Company Act of 1940, as amended) of the fund were assisted in their review by independent legal counsel and met with counsel in executive session separate from representatives of Dreyfus. In approving the continuance of the Management Agreement, the Board considered all factors that they believed to be relevant, including, among other things, the factors discussed below.
Analysis of Nature, Extent and Quality of Services Provided to the Fund. The Board members received a presentation from representatives of Dreyfus regarding services provided to the fund and other funds in the Dreyfus fund complex, and discussed the nature, extent and quality of the services provided to the fund pursuant to its Management Agreement. Dreyfus’s representatives reviewed the fund’s distribution of accounts and the relationships Dreyfus has with various intermediaries and the different needs of each. Dreyfus’s representatives noted the various distribution channels for the fund as well as the diverse methods of distribution among other funds in the Dreyfus fund complex, and Dreyfus’s corresponding need for broad, deep, and diverse resources to be able to provide ongoing shareholder services to each distribution channel, including those of the fund. Dreyfus also provided the number of accounts investing in the fund, as well as the fund’s asset size.
The Board members also considered Dreyfus’s research and portfolio management capabilities and Dreyfus’s oversight of day-to-day fund operations, including fund accounting and administration and assistance in meeting legal and regulatory requirements.The Board members also considered Dreyfus’s extensive administrative, accounting and compliance infrastructure.
Comparative Analysis of the Fund’s Performance and Management Fee and Expense Ratio. The Board members reviewed the fund’s performance, management fee and expense ratio, placing significant
T h e F u n d 49
I N FO R M AT I O N A B O U T T H E R E V I E W A N D A P P R OVA L O F T H E F U N D ’S M A N A G E M E N T A G R E E M E N T ( U n a u d i t e d ) ( c o n t i n u e d )
emphasis on comparative data supplied by Lipper, Inc., an independent provider of mutual fund data, including contractual and actual (net of fee waivers and expense reimbursements) management fees, operating expense components and total return performance.The fund’s performance was compared to that of a Performance Universe, consisting of all funds with the same Lipper classification/objective, and a Performance Group, consisting of comparable funds chosen by Lipper based on guidelines previously approved by the Board. Similarly, the fund’s contractual and actual management fee and operating expenses were compared to those of an Expense Universe, consisting of funds with the same or similar Lipper classification/objective, and an Expense Group, consisting comparable funds chosen by Lipper based on guidelines previously approved by the Board. As part of its review of expenses, the Board also considered other fund expenses, such as transfer agent fees, custody fees, 12b-1 or non-12b-1 service fees (if any), and other non-management fees, as well as any waivers or reimbursements of fees and expenses.
In its review of performance, the Board noted the fund’s average annual total return ranked in the first quintile of its Performance Group, and second quintile of its Performance Universe, for the one-and two-year periods ended December 31, 2006. The board further noted that the fund’s yield ranked in the second quintile of its Performance Group and its Performance Universe for the one-year period ended December 31, 2006.
In its review of the fund’s management fee and operating expenses, the Board examined the range of management fees and expense ratios of the funds in the Expense Group and Expense Universe, noting, among other things, that while the fund’s contractual and actual management fees were higher than the median of the Expense Group and Expense Universe, the fund’s actual total expense ratio was below the median of the Expense Group and Expense Universe.
Representatives of Dreyfus reviewed with the Board members the fees paid to Dreyfus or its affiliates by mutual funds and/or separate accounts managed by Dreyfus with similar investment objectives, policies and
50
strategies as the fund (the “Similar Accounts”), and explained the nature of the Similar Accounts and the differences, from Dreyfus’s perspective, as applicable, in providing services to the Similar Accounts as compared to the fund. Dreyfus’s representatives also reviewed the costs associated with distribution through intermediaries. The Board analyzed differences in fees paid to Dreyfus and discussed the relationship of the advisory fees paid in light of Dreyfus’s performance, and the services provided. The Board members considered the relevance of the fee information provided for the Similar Accounts managed by Dreyfus, to evaluate the appropriateness and reasonableness of the fund’s management fees. The Board acknowledged that differences in fees paid by the Similar Accounts seemed to be consistent with the services provided.
Analysis of Profitability and Economies of Scale. Dreyfus’s representatives reviewed the dollar amount of expenses allocated and profit received by Dreyfus and the method used to determine such expenses and profit. The Board members evaluated the profitability analysis in light of the relevant circumstances for the fund and the extent to which economies of scale would be realized if the fund grows and whether fee levels reflect these economies of scale for the benefit of fund investors. The Board members also considered potential benefits to Dreyfus from acting as investment adviser and noted that there were no soft dollar arrangements with respect to trading the fund’s investments.
It was noted that the Board members should consider Dreyfus’s profitability with respect to the fund as part of their evaluation of whether the fees under the Management Agreement bear a reasonable relationship to the mix of services provided by Dreyfus, including the nature, extent and quality of such services and that a discussion of economies of scale is predicated on increasing assets and that, if a fund’s assets had been decreasing, the possibility that Dreyfus may have realized any economies of scale would be less. It also was noted that the profitability percentage for managing the fund was within ranges determined by appropriate court cases to be reasonable given the services rendered and generally superior service levels provided.The Board also noted the fee
T h e F u n d 51
I N FO R M AT I O N A B O U T T H E R E V I E W A N D A P P R OVA L O F T H E F U N D ’S M A N A G E M E N T A G R E E M E N T ( U n a u d i t e d ) ( c o n t i n u e d )
waiver and expense reimbursement arrangements in place for the fund and its effect on Dreyfus’s profitability.
At the conclusion of these discussions, the Board agreed that it had been furnished with sufficient information to make an informed business decision with respect to continuation of the fund’s Management Agreement. Based on the discussions and considerations as described above, the Board made the following conclusions and determinations.
- The Board concluded that the nature, extent and quality of the ser- vices provided by Dreyfus are adequate and appropriate.
- The Board generally was satisfied with the fund’s total return and yield.
- The Board concluded that the fee paid by the fund to Dreyfus was reasonable in light of the services provided, comparative perfor- mance, expense and advisory fee information, including Dreyfus’s undertaking to waive or reimburse certain fess and expenses, costs of the services provided and profits to be realized and benefits derived or to be derived by Dreyfus from its relationship with the fund.
- The Board determined that the economies of scale which may accrue to Dreyfus and its affiliates in connection with the management of the fund had been adequately considered by Dreyfus in connection with the management fee rate charged to the fund and that, to the extent in the future it were determined that material economies of scale had not been shared with the fund, the Board would seek to have those economies of scale shared with the fund.
The Board members considered these conclusions and determinations, along with information received on a routine and regular basis throughout the year, and, without any one factor being dispositive, the Board determined that re-approval of the fund’s Management Agreement was in the best interests of the fund and its shareholders.
52
B O A R D M E M B E R S I N F O R M AT I O N ( U n a u d i t e d )
Joseph S. DiMartino (63) Chairman of the Board (1995)
| Principal Occupation During Past 5 Years: |
| • Corporate Director and Trustee |
| Other Board Memberships and Affiliations: |
| • The Muscular Dystrophy Association, Director |
| • Century Business Services, Inc., a provider of outsourcing functions for small and medium size |
| companies, Director |
| • The Newark Group, a provider of a national market of paper recovery facilities, paperboard |
| mills and paperboard converting plants, Director |
| • Sunair Services Corporation, a provider of certain outdoor-related services to homes and |
| businesses, Director |
No. of Portfolios for which Board Member Serves: 187
Peggy C. Davis (64) Board Member (2006)
| Principal Occupation During Past 5 Years: |
| • Shad Professor of Law, New York University School of Law (1983-present) |
| • Writer and teacher in the fields of evidence, constitutional theory, family law, social sciences |
| and the law, legal process and professional methodology and training |
No. of Portfolios for which Board Member Serves: 79
David P. Feldman (67) Board Member (1994)
| Principal Occupation During Past 5 Years: |
| • Corporate Director and Trustee |
| Other Board Memberships and Affiliations: |
| • BBH Mutual Funds Group (11 funds), Director |
| • The Jeffrey Company, a private investment company, Director |
No. of Portfolios for which Board Member Serves: 57
T h e F u n d 53
B O A R D M E M B E R S I N F O R M AT I O N ( U n a u d i t e d ) (continued)
James F. Henry (76) Board Member (1976)
| Principal Occupation During Past 5 Years: |
| • President,The International Institute for Conflict Prevention and Resolution, a non-profit |
| organization principally engaged in the development of alternatives to business litigation |
| (Retired 2003) |
| • Advisor to The Elaw Forum, a consultant on managing corporate legal costs |
| • Advisor to John Jay Homestead (the restored home of the first U.S. Chief Justice) |
| • Individual Trustee of several trusts |
| Other Board Memberships and Affiliations: |
| • Director, advisor and mediator involved in several non-profit organizations, primarily engaged |
| in domestic and international dispute resolution, and historic preservation |
No. of Portfolios for which Board Member Serves: 48
Ehud Houminer (66) Board Member (2006)
| Principal Occupation During Past 5 Years: |
| • Executive-in-Residence at the Columbia Business School, Columbia University |
| Other Board Memberships and Affiliations: |
| • Avnet Inc., an electronics distributor, Director |
| • International Advisory Board to the MBA Program School of Management, Ben Gurion |
| University, Chairman |
| • Explore Charter School, Brooklyn, NY, Chairman |
No. of Portfolios for which Board Member Serves: 76
Gloria Messinger (77) Board Member (2006)
| Principal Occupation During Past 5 Years: |
| • Arbitrator for American Arbitration Association and National Association of Securities Dealers, Inc. |
| • Consultant in Intellectual Property |
| Other Board Memberships and Affiliations: |
| • Theater for a New Audience, Inc., Director |
| • Brooklyn Philharmonic, Director |
No. of Portfolios for which Board Member Serves: 48
54
Dr. Martin Peretz (67) Board Member (1976)
| Principal Occupation During Past 5 Years: |
| • Editor-in-Chief of The New Republic Magazine |
| • Lecturer in Social Studies at Harvard University (1965-2002) |
| • Director of TheStreet.com, a financial information service on the web |
| Other Board Memberships and Affiliations: |
| • American Council of Trustees and Alumni, Director |
| • Pershing Square Capital Management, Adviser |
| • Montefiore Ventures, General Partner |
| • Harvard Center for Blood Research,Trustee |
| • Bard College,Trustee |
| • Board of Overseers of YIVO Institute for Jewish Research, Chairman |
No. of Portfolios for which Board Member Serves: 48
Anne Wexler (77) Board Member (2006)
Principal Occupation During Past 5 Years:
• Chairman of the Wexler & Walker Public Policy Associates, consultants specializing in government relations and public affairs
| Other Board Memberships and Affiliations: |
| • Wilshire Mutual Funds (5 funds), Director |
| • Methanex Corporation, a methanol producing company, Director |
| • Member of the Council of Foreign Relations |
| • Member of the National Park Foundation |
No. of Portfolios for which Board Member Serves: 57
Once elected all Board Members serve for an indefinite term, but achieve Emeritus status on December 31st of the calendar year in which the Board Member reaches age 80.The address of the Board Members and Officers is in c/o The Dreyfus Corporation, 200 Park Avenue, New York, New York 10166. Additional information about the Board Members is available in the fund’s Statement of Additional Information which can be obtained from Dreyfus free of charge by calling this toll free number: 1-800-554-4611.
John M. Fraser, Jr., Emeritus Board Member
Rosalind G. Jacobs, Emeritus Board Member
Dr. Paul A. Marks, Emeritus Board Member
T h e F u n d 55
O F F I C E R S O F T H E F U N D ( U n a u d i t e d )
J. DAVID OFFICER, President since December 2006.
Chief Operating Officer,Vice Chairman and director of the Manager, and an officer of 89 investment companies (comprised of 186 portfolios) managed by the Manager. He is 58 years old and has been an employee of the Manager since April 1998.
MARK N. JACOBS, Vice President since March 2000.
Executive Vice President, Secretary and General Counsel of the Manager, and an officer of 90 investment companies (comprised of 202 portfolios) managed by the Manager. He is 60 years old and has been an employee of the Manager since June 1977.
MICHAEL A. ROSENBERG, Vice President and Secretary since August 2005.
Associate General Counsel of the Manager, and an officer of 90 investment companies (comprised of 202 portfolios) managed by the Manager. He is 47 years old and has been an employee of the Manager since October 1991.
JAMES BITETTO, Vice President and Assistant Secretary since August 2005.
Associate General Counsel and Assistant Secretary of the Manager, and an officer of 90 investment companies (comprised of 202 portfolios) managed by the Manager. He is 40 years old and has been an employee of the Manager since December 1996.
JONI LACKS CHARATAN, Vice President and Assistant Secretary since August 2005.
Associate General Counsel of the Manager, and an officer of 90 investment companies (comprised of 202 portfolios) managed by the Manager. She is 51 years old and has been an employee of the Manager since October 1988.
JOSEPH M. CHIOFFI, Vice President and Assistant Secretary since August 2005.
Associate General Counsel of the Manager, and an officer of 90 investment companies (comprised of 202 portfolios) managed by the Manager. He is 45 years old and has been an employee of the Manager since June 2000.
JANETTE E. FARRAGHER, Vice President and Assistant Secretary since August 2005.
Associate General Counsel of the Manager, and an officer of 90 investment companies (comprised of 202 portfolios) managed by the Manager. She is 44 years old and has been an employee of the Manager since February 1984.
JOHN B. HAMMALIAN, Vice President and Assistant Secretary since August 2005.
Associate General Counsel of the Manager, and an officer of 90 investment companies (comprised of 202 portfolios) managed by the Manager. He is 43 years old and has been an employee of the Manager since February 1991.
ROBERT R. MULLERY, Vice President and Assistant Secretary since August 2005.
Associate General Counsel of the Manager, and an officer of 90 investment companies (comprised of 202 portfolios) managed by the Manager. He is 55 years old and has been an employee of the Manager since May 1986.
JEFF PRUSNOFSKY, Vice President and Assistant Secretary since August 2005.
Associate General Counsel of the Manager, and an officer of 90 investment companies (comprised of 202 portfolios) managed by the Manager. He is 41 years old and has been an employee of the Manager since October 1990.
56
JAMES WINDELS, Treasurer since November 2001.
Director – Mutual Fund Accounting of the Manager, and an officer of 90 investment companies (comprised of 202 portfolios) managed by the Manager. He is 48 years old and has been an employee of the Manager since April 1985.
ROBERT ROBOL, Assistant Treasurer since August 2005.
Senior Accounting Manager – Money Market and Municipal Bond Funds of the Manager, and an officer of 90 investment companies (comprised of 202 portfolios) managed by the Manager. He is 43 years old and has been an employee of the Manager since October 1988.
ROBERT SVAGNA, Assistant Treasurer since August 2005.
Senior Accounting Manager – Equity Funds of the Manager, and an officer of 90 investment companies (comprised of 202 portfolios) managed by the Manager. He is 40 years old and has been an employee of the Manager since November 1990.
GAVIN C. REILLY, Assistant Treasurer since December 2005.
Tax Manager of the Investment Accounting and Support Department of the Manager, and an officer of 90 investment companies (comprised of 202 portfolios) managed by the Manager. He is 38 years old and has been an employee of the Manager since April 1991.
JOSEPH W. CONNOLLY, Chief Compliance Officer since October 2004.
Chief Compliance Officer of the Manager and The Dreyfus Family of Funds (90 investment companies, comprised of 202 portfolios). From November 2001 through March 2004, Mr. Connolly was first Vice-President, Mutual Fund Servicing for Mellon Global Securities Services. In that capacity, Mr. Connolly was responsible for managing Mellon’s Custody, Fund Accounting and Fund Administration services to third-party mutual fund clients. He is 49 years old and has served in various capacities with the Manager since 1980, including manager of the firm’s Fund Accounting Department from 1997 through October 2001.
WILLIAM GERMENIS, Anti-Money Laundering Compliance Officer since September 2002.
Vice President and Anti-Money Laundering Compliance Officer of the Distributor, and the Anti-Money Laundering Compliance Officer of 86 investment companies (comprised of 198 portfolios) managed by the Manager. He is 36 years old and has been an employee of the Distributor since October 1998.
T h e F u n d 57
| For More | | Information |
| |
|
| |
| Dreyfus | | Transfer Agent & |
| A Bonds Plus, Inc. | | Dividend Disbursing Agent |
| 200 Park Avenue | | Dreyfus Transfer, Inc. |
| New York, NY 10166 | | 200 Park Avenue |
| Manager | | New York, NY 10166 |
| The Dreyfus Corporation | | Distributor |
| 200 Park Avenue | | Dreyfus Service Corporation |
| New York, NY 10166 | | 200 Park Avenue |
| Custodian | | New York, NY 10166 |
| Mellon Bank, N.A. | | |
| One Mellon Bank Center | | |
| Pittsburgh, PA 15258 | | |
Ticker Symbol: DRBDX
Telephone 1-800-645-6561
Mail The Dreyfus Family of Funds, 144 Glenn Curtiss Boulevard, Uniondale, NY 11556-0144 E-mail Send your request to info@dreyfus.com Internet Information can be viewed online or downloaded at: http://www.dreyfus.com
The fund files its complete schedule of portfolio holdings with the Securities and Exchange Commission (“SEC”) for the first and third quarters of each fiscal year on Form N-Q. The fund’s Forms N-Q are available on the SEC’s website at http://www.sec.gov and may be reviewed and copied at the SEC’s Public Reference Room in Washington, DC. Information on the operation of the Public Reference Room may be obtained by calling 1-202-551-8090.
A description of the policies and procedures that the fund uses to determine how to vote proxies relating to portfolio securities, and information regarding how the fund voted these proxies for the 12-month period ended June 30, 2006, is available at http://www.dreyfus.com and on the SEC’s website at http://www.sec.gov. The description of the policies and procedures is also available without charge, upon request, by calling 1-800-645-6561.

© 2007 Dreyfus Service Corporation
Item 2. Code of Ethics.
The Registrant has adopted a code of ethics that applies to the Registrant's principal executive officer, principal financial officer, principal accounting officer or controller, or persons performing similar functions. There have been no amendments to, or waivers in connection with, the Code of Ethics during the period covered by this Report.
Item 3. Audit Committee Financial Expert.
The Registrant's Board has determined that David P. Feldman, a member of the Audit Committee of the Board, is an audit committee financial expert as defined by the Securities and Exchange Commission (the "SEC"). David P. Feldman is "independent" as defined by the SEC for purposes of audit committee financial expert determinations.
Item 4. Principal Accountant Fees and Services
(a) Audit Fees. The aggregate fees billed for each of the last two fiscal years (the "Reporting Periods") for professional services rendered by the Registrant's principal accountant (the "Auditor") for the audit of the Registrant's annual financial statements, or services that are normally provided by the Auditor in connection with the statutory and regulatory filings or engagements for the Reporting Periods, were $31,597 in 2006 and $31,597 in 2007.
(b) Audit-Related Fees. The aggregate fees billed in the Reporting Periods for assurance and related services by the Auditor that are reasonably related to the performance of the audit of the Registrant's financial statements and are not reported under paragraph (a) of this Item 4 were $5,122 in 2006 and $10,244 in 2007. These services consisted of (i) security counts required by Rule 17f-2 under the Investment Company Act of 1940, as amended.
The aggregate fees billed in the Reporting Periods for non-audit assurance and related services by the Auditor to the Registrant's investment adviser (not including any sub-investment adviser whose role is primarily portfolio management and is subcontracted with or overseen by another investment adviser), and any entity controlling, controlled by or under common control with the investment adviser that provides ongoing services to the Registrant ("Service Affiliates"), that were reasonably related to the performance of the annual audit of the Service Affiliate, which required pre-approval by the Audit Committee were $0 in 2006 and $0 in 2007.
Note: For the second paragraph in each of (b) through (d) of this Item 4, certain of such services were not pre-approved prior to May 6, 2003, when such services were required to be pre-approved. On and after May 6, 2003, 100% of all services provided by the Auditor were pre-approved as required. For comparative purposes, the fees shown assume that all such services were pre-approved, including services that were not pre-approved prior to the compliance date of the pre-approval requirement.
(c) Tax Fees. The aggregate fees billed in the Reporting Periods for professional services rendered by the Auditor for tax compliance, tax advice and tax planning ("Tax Services") were $3,088 in 2006 and $3,533 in 2007. These services consisted of (i) review or preparation of U.S. federal, state, local and excise tax returns; (ii) U.S. federal, state and local tax planning, advice and assistance regarding statutory, regulatory or
administrative developments, (iii) tax advice regarding tax qualification matters and/or treatment of various financial instruments held or proposed to be acquired or held, and (iv) determination of Passive Foreign Investment Companies (as applicable).
The aggregate fees billed in the Reporting Periods for Tax Services by the Auditor to Service Affiliates which required pre-approval by the Audit Committee were $ 0 in 2006 and $ 0 in 2007.
(d) All Other Fees. The aggregate fees billed in the Reporting Periods for products and services provided by the Auditor, other than the services reported in paragraphs (a) through (c) of this Item, were $513 in 2006 and $524 in 2007. These services consisted of a review of the Registrant's anti-money laundering program.
The aggregate fees billed in the Reporting Periods for Non-Audit Services by the Auditor to Service Affiliates, other than the services reported in paragraphs (b) through (c) of this Item, which required pre-approval by the Audit Committee were $ 0 in 2006 and $ 0 in 2007.
Audit Committee Pre-Approval Policies and Procedures. The Registrant's Audit Committee has established policies and procedures (the "Policy") for pre-approval (within specified fee limits) of the Auditor's engagements for non-audit services to the Registrant and Service Affiliates without specific case-by-case consideration. Pre-approval considerations include whether the proposed services are compatible with maintaining the Auditor's independence. Pre-approvals pursuant to the Policy are considered annually.
Non-Audit Fees. The aggregate non-audit fees billed by the Auditor for services rendered to the Registrant, and rendered to Service Affiliates, for the Reporting Periods were $769,395 in 2006 and $722,002 in 2007.
Auditor Independence. The Registrant's Audit Committee has considered whether the provision of non-audit services that were rendered to Service Affiliates which were not pre-approved (not requiring pre-approval) is compatible with maintaining the Auditor's independence.
| Item 5. | | Audit Committee of Listed Registrants. |
| | | Not applicable. [CLOSED-END FUNDS ONLY] |
| Item 6. | | Schedule of Investments. |
| | | Not applicable. |
| Item 7. | | Disclosure of Proxy Voting Policies and Procedures for Closed-End Management |
| | | Investment Companies. |
| | | Not applicable. [CLOSED-END FUNDS ONLY] |
| Item 8. | | Portfolio Managers of Closed-End Management Investment Companies. |
| | | Not applicable. [CLOSED-END FUNDS ONLY, beginning with reports for periods ended |
| | | on and after December 31, 2005] |
| Item 9. | | Purchases of Equity Securities by Closed-End Management Investment Companies and |
| | | Affiliated Purchasers. |
| | | Not applicable. [CLOSED-END FUNDS ONLY] |
| Item 10. | | Submission of Matters to a Vote of Security Holders. |
The Registrant has a Nominating Committee (the "Committee"), which is responsible for selecting and nominating persons for election or appointment by the Registrant's Board as Board members. The Committee has adopted a Nominating Committee Charter (the "Charter"). Pursuant to the Charter, the Committee will consider recommendations for nominees from shareholders submitted to the Secretary of the Registrant, c/o The Dreyfus Corporation Legal Department, 200 Park Avenue, 8th Floor East, New York, New York 10166. A nomination submission must include information regarding the recommended nominee as specified in the Charter. This information includes all information relating to a recommended nominee that is required to be disclosed in solicitations or proxy statements for the election of Board members, as well as information sufficient to evaluate the factors to be considered by the Committee, including character and integrity, business and professional experience, and whether the person has the ability to apply sound and independent business judgment and would act in the interests of the Registrant and its shareholders.
Nomination submissions are required to be accompanied by a written consent of the individual to stand for election if nominated by the Board and to serve if elected by the shareholders, and such additional information must be provided regarding the recommended nominee as reasonably requested by the Committee.
Item 11. Controls and Procedures.
(a) The Registrant's principal executive and principal financial officers have concluded, based on their evaluation of the Registrant's disclosure controls and procedures as of a date within 90 days of the filing date of this report, that the Registrant's disclosure controls and procedures are reasonably designed to ensure that information required to be disclosed by the Registrant on Form N-CSR is recorded, processed, summarized and reported within the required time periods and that information required to be disclosed by the Registrant in the reports that it files or submits on Form N-CSR is accumulated and communicated to the Registrant's management, including its principal executive and principal financial officers, as appropriate to allow timely decisions regarding required disclosure.
(b) There were no changes to the Registrant's internal control over financial reporting that occurred during the second fiscal quarter of the period covered by this report that have materially affected, or are reasonably likely to materially affect, the Registrant's internal control over financial reporting.
Item 12. Exhibits.
(a)(1) Code of ethics referred to in Item 2.
(a)(2) Certifications of principal executive and principal financial officers as required by Rule 30a-2(a) under the Investment Company Act of 1940.
(a)(3) Not applicable.
(b) Certification of principal executive and principal financial officers as required by Rule 30a-2(b) under the Investment Company Act of 1940.
SIGNATURES
| Pursuant to the requirements of the Securities Exchange Act of 1934 and the Investment Company Act of |
| 1940, the Registrant has duly caused this Report to be signed on its behalf by the undersigned, thereunto duly |
| authorized. |
| |
| Dreyfus A Bonds Plus, Inc. |
| |
| By: | | /s/ J. David Officer |
| | | J. David Officer |
| | | President |
| |
| Date: | | May 21, 2007 |
| |
| Pursuant to the requirements of the Securities Exchange Act of 1934 and the Investment Company Act of |
| 1940, this Report has been signed below by the following persons on behalf of the Registrant and in the |
| capacities and on the dates indicated. |
| |
| By: | | /s/ J. David Officer |
| | | J. David Officer |
| | | President |
| |
| Date: | | May 21, 2007 |
| |
| By: | | /s/ James Windels |
| | | James Windels |
| | | Treasurer |
| |
| Date: | | May 21, 2007 |
EXHIBIT INDEX
| (a)(1) | | Code of ethics referred to in Item 2. |
| |
| (a)(2) | | Certifications of principal executive and principal financial officers as required by Rule 30a- |
| 2(a) under the Investment Company Act of 1940. (EX-99.CERT) |
| |
| (b) | | Certification of principal executive and principal financial officers as required by Rule 30a- |
| 2(b) under the Investment Company Act of 1940. (EX-99.906CERT) |