
| Bear Stearns 17th Annual Media Conference March 8, 2004 Note: Custom background for cover only. Do not relink to master |

| Safe Harbor Statement Certain statements contained in this presentation regarding R.H. Donnelley's future operating results or performance or business plans or prospects and any other statements not constituting historical fact are "forward-looking statements" subject to the safe harbor created by the Private Securities Litigation Reform Act of 1995. Where possible, the words "believe," "expect," "will," "anticipate," "should," "planned," "estimated," "projected," "forecasted" (or the symbols "E" "G" or "P"), "potential," "goal," "outlook," and similar expressions, as they relate to R.H. Donnelley or its management, have been used to identify such forward-looking statements. Regardless of any identifying phrases, these statements and all other forward-looking statements reflect only R.H. Donnelley's current beliefs and assumptions with respect to future business plans, prospects, decisions and results, and are based on information currently available to R.H. Donnelley. Accordingly, the statements are subject to significant risks, uncertainties and contingencies which could cause R.H. Donnelley's actual operating results, performance or business plans or prospects to differ from those expressed in, or implied by, these statements. Such risks, uncertainties and contingencies are described in detail in Management's Discussion and Analysis of Financial Condition and Results of Operations in the Company's Annual Report on Form 10-K for the year ended December 31, 2002, as well as the Company's other periodic filings with the Securities and Exchange Commission, and in summary and without limitation include the following: (1) our ability to meet our substantial debt service obligations; (2) restrictive covenants under the terms of our debt and convertible preferred stock agreements; (3) declining usage of print yellow pages directories and changes in technology; (4) competition in the yellow pages industry and other competitive media; (5) difficulties in our efforts to integrate the Sprint Publishing & Advertising operations into our own and our ability to achieve synergies in connection with the acquisition; (6) SBC's or DonTech's actions could adversely impact our results of operations and financial condition; (7) reliance on and extension of credit to small- and medium-sized businesses; (8) dependence on third party providers of printing, distribution and delivery services and the sale of advertising to national accounts; (9) general economic conditions and consumer sentiment in our markets; and (10) fluctuations in the price and availability of paper. During this presentation, we will also refer to certain non-GAAP financial measures. You can find additional information about these measures and a reconciliation between these measures and the comparable GAAP measures in the Appendices to this presentation, as well as pertinent information about these measures in our Current Report on 8-K disclosing 2002 adjusted pro forma results filed with the SEC on July 23, 2003, and our Current Report on 8-K discussing non-GAAP financial measures filed with the SEC on May 2, 2003, each of which is available on our web site under "Investor Information," "SEC Filings." |

| Overview of R.H. Donnelley Established 1886 Sixth largest U.S. directory publisher 18 states 260 Sprint-branded directories with a total circulation of 18 million and 160,000 advertisers 50 year publishing, trademark and non-compete agreements with Sprint or its successor Perpetual partnership with SBC DonTech: exclusive agent for 129 SBC brand directories in Illinois/Indiana with total circulation of 10 million and 100,000 advertisers Approximately 28% of total RHD EBITDA Only U.S. publicly traded stand-alone yellow pages publisher |

| Organizational Structure SBC Branded Products (50/50 Partnership) Sprint Branded Products Publishing & Informational Services for DME & DonTech |

| Management Team David C. Swanson Chairman & Chief Executive Officer 23 years yellow pages, 17 years at RHD Steven M. Blondy SVP & Chief Financial Officer 20 years finance, 2 years at RHD Peter J. McDonald SVP & President, Donnelley Media 29 years yellow pages, 9 years at RHD George F. Bednarz VP, Publishing & IT 28 years (8 years yellow pages), 8 years at RHD Michael R. Boyce VP, Marketing 20 year yellow pages, 20 years at RHD |

| Overview of R.H. Donnelley A: Where people go to find who sells the products and services they seek when they're ready to buy A: Generating high quality prospects with an exceptional conversion rate for those that advertise in our products Q: What's the value proposition? Q: What is Directional Media? A: Directional Media Q: What business are we in? |
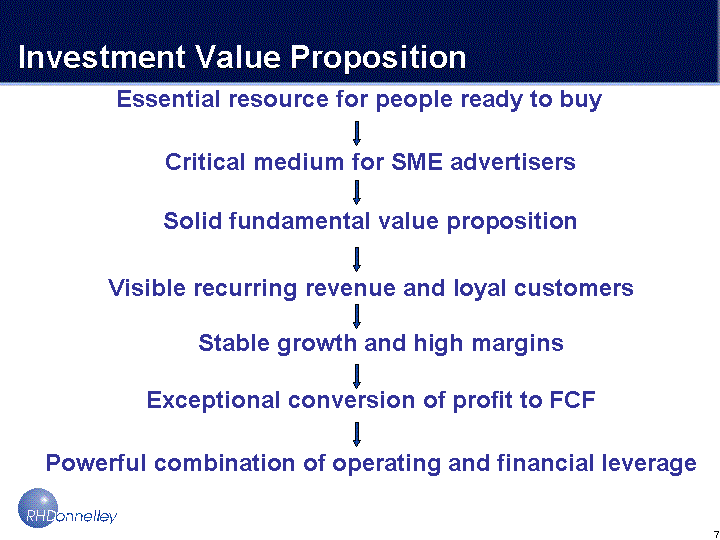
| Investment Value Proposition Essential resource for people ready to buy Critical medium for SME advertisers Solid fundamental value proposition Visible recurring revenue and loyal customers Stable growth and high margins Exceptional conversion of profit to FCF Powerful combination of operating and financial leverage |

| Leveraging Data and Content Across Multiple Platforms PDAs New distribution channels = New opportunities |

| Near Term Strategic Focus Reduce Debt Create financial flexibility Strengthen Current Market Positions Integrate the business model Expand online product offerings Edge outs, start ups, small acquisitions Marketing Services offerings |

| Yellow Pages as an Industry |

| Relative US Market Share 2003E Advertising Pie TV 0.19 Cable 0.06 Radio 0.09 Outdoor 0.02 Newspapers 0.19 Magazines 0.05 Yellow Pages 0.06 Online 0.03 Other 0.31 Source: Deutsche Bank estimate, Universal McCann, Television Advertising Bureau, Paul Kagan Associates Inc., Cable Television Advertising Bureau, Radio Advertising Bureau, Outdoor Advertising Association 2003 Yellow Pages revenue estimated to be $14.5 billion Yellow Pages represents the 5th largest advertising market Market share exceeds magazine, outdoor and online. Tied with cable. 15.1 references for the last three years. |

| Yellow Pages as Directional Media R Relevant - references are initiated by consumer D Decision-Impacting - "point of sale advertising" - 58% are shopping; 69% view ads R Recent - last chance to impact shopping decision R Ready-to-buy - 89% of those who use the YP's make or intend to make a purchase A Way to Reach Your Best Customers - YP users spend 25% more G Good for Your Business - The typical business makes over 340 sales per year per D display ad. 54% are new customers $ Competitive with Other Media -- cost per buyer influenced less than other media M -- migrates well to digital environment Source: CRM Associates Yellow Pages Trends and Opportunities 2002 December 2002 |

| Investment Characteristics vs. Other Media RHD Outdoor Radio TV News Direct Internet Strong Brand Value ? ? ? ? ? Stable/Predictable ? ? Visible Renewals ? Strong Market Share ? Reference Conversion ? ? Annual Contracts ? ? 50%+ Margin ? Low Cap Ex ? ? High Cash Conversion ? No Regulatory Constraints ? ? ? |
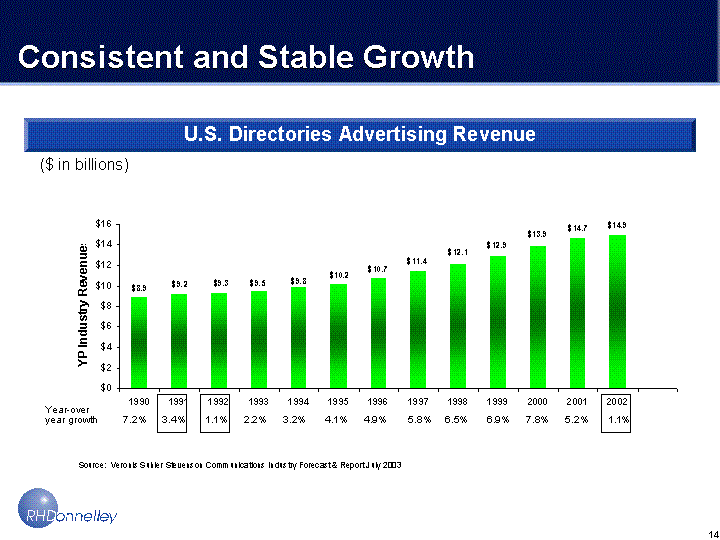
| Consistent and Stable Growth Revenues 1990 8.9 1991 9.2 1992 9.3 1993 9.5 1994 9.8 1995 10.2 1996 10.7 1997 11.4 1998 12.1 1999 12.9 2000 13.9 2001 14.7 2002 14.9 Year-over year growth 7.2% 3.4% 1.1% 2.2% 3.2% 4.1% 4.9% 5.8% 6.5% 6.9% 7.8% 5.2% 1.1% ($ in billions) Source: Veronis Suhler Stevenson Communications Industry Forecast & Report July 2003 U.S. Directories Advertising Revenue |
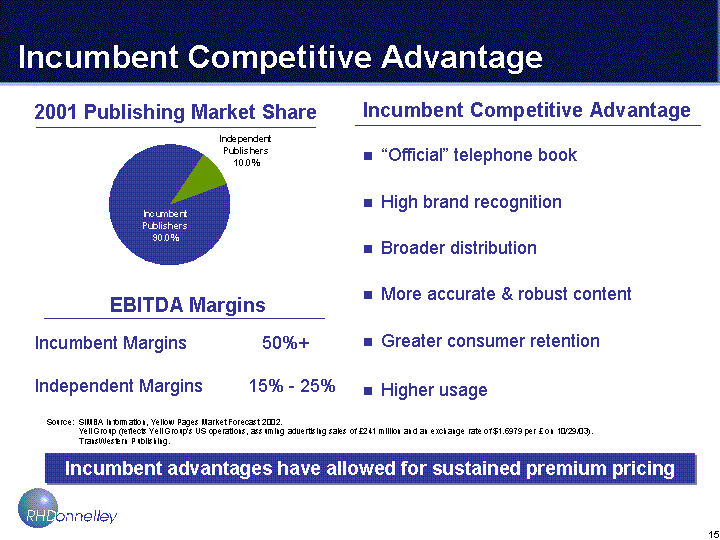
| Incumbent Competitive Advantage Incumbent advantages have allowed for sustained premium pricing Incumbent Competitive Advantage "Official" telephone book High brand recognition Broader distribution More accurate & robust content Greater consumer retention Higher usage Source: SIMBA Information, Yellow Pages Market Forecast 2002. Yell Group (reflects Yell Group's US operations, assuming advertising sales of £241 million and an exchange rate of $1.6979 per £ on 10/29/03). TransWestern Publishing. 2001 Publishing Market Share Incumbent Publishers 0.9 Independent Publishers 0.1 EBITDA Margins Incumbent Margins 50%+ Independent Margins 15% - 25% |
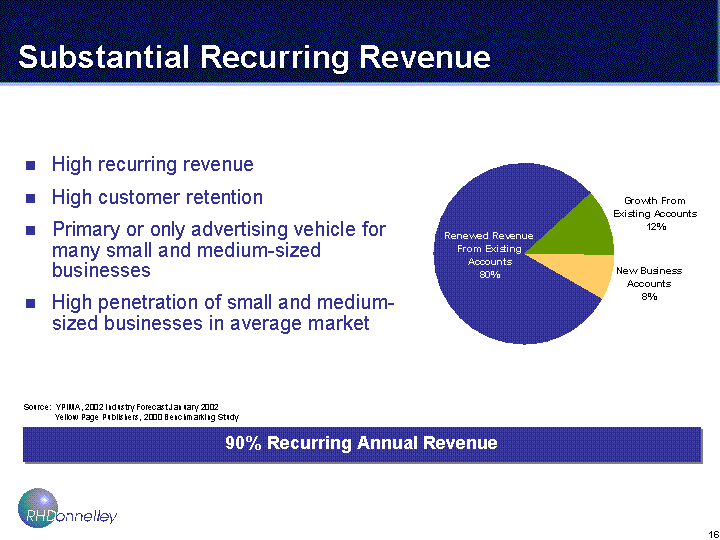
| Source: YPIMA, 2002 Industry Forecast January 2002 Yellow Page Publishers, 2000 Benchmarking Study Substantial Recurring Revenue High recurring revenue High customer retention Primary or only advertising vehicle for many small and medium-sized businesses High penetration of small and medium- sized businesses in average market 90% Recurring Annual Revenue Renewed Revenue From Existing Accounts 0.8 Growth From Existing Accounts 0.12 New Business Accounts 0.08 |

| Strong Advertiser Base Dominated by SME's Local Establishments <20% revenues originate from national Service Industries Attorneys/Physicians/Plumbers/Movers/Contractors Limited Marketing Resources As an industry, we are the Marketing and Advertising Resources for many of our customers |

| Strong/Measurable Results Yellow Pages 51 Internet 37 Newspapers 33 Radio 19 Magazines 16 Television 9 Yellow Pages 9.1 Newspapers 19 Magazines 29 Radio 57 Television 66 Internet 5 Avg. Sales Return On Investment Per Dollar Invested Cost Per Buyer Influenced Median Values By Media For Top Headings 14 Source: CRM Associates Yellow Pages Trends and Opportunities 2002 December 2002 |

| Company Overview |

| 2003 Operating Highlights Acquired Sprint Publishing and Advertising, publisher of 260 yellow pages directories in 18 states Launched online city guide and internet version of directories in Las Vegas, Orlando and six other markets Successfully completed systems integration six months ahead of schedule, converting 20 million records Re-engineered sales recruiting, training, deployment and compensation programs Reduced headcount from 1,600 to 1,300 Achieved targeted synergies and efficiencies run rate six months early Positioned RHD for future growth and as a leader in directional media |

| 2003 Financial Highlights Delivered 1.2% top-line sales growth after two consecutive years of sales declines in our markets Successfully integrated all SPA billing and collection activities, allowing us to achieve bad debt targets well ahead of schedule Generated EBITDA of $411 million and free cash flow of $236 million Repaid more than $242 million of acquisition debt Increased shareholder value as stock rose 36% during 2003 |
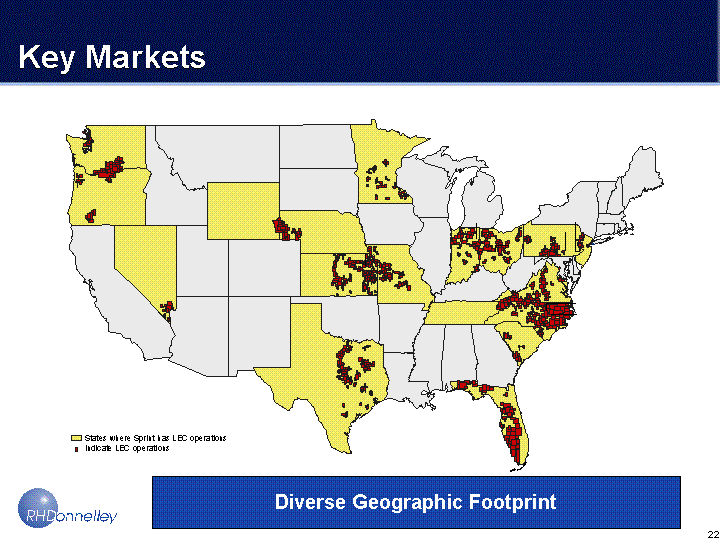
| Key Markets States where Sprint has LEC operations Indicate LEC operations Diverse Geographic Footprint |
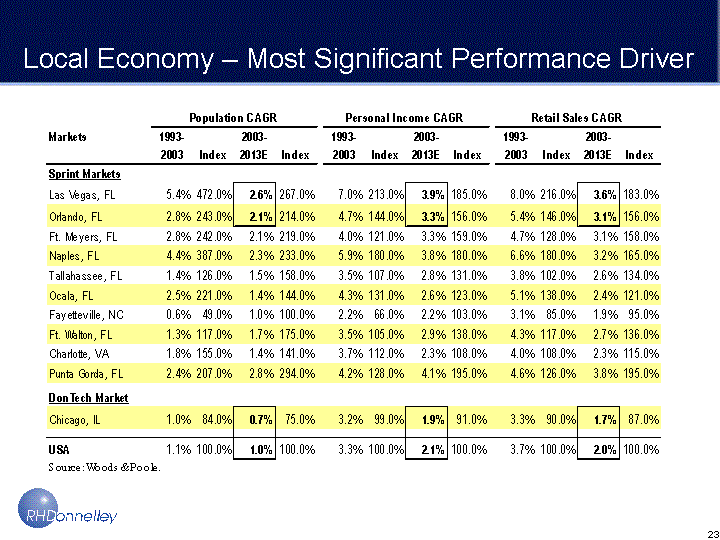
| Local Economy - Most Significant Performance Driver |

| Sales Recruiting - Hiring - Training Former Now Newspaper Ads Agencies/Referral Limited Sales Experience Trainers from top 20% of Sales Force No Program Management Development Program Concept Learning 17 Page Script 3 Weeks 8 Week Training Program Limited Accountability Total Accountability Limited Pay Pay For Performance |

| Sales Process Changes/Execution Assignments Earned Objectives Increased Increased Variable Compensation Geo-coded Assignments Sales Reports Sales Recognition |

| Market Coverage 500,000 Potential Advertisers!! Assign accounts by Geo-code Call on potential customers Have a great value story Pay for results |

| Investment Value Proposition Essential resource for people ready to buy Critical medium for SME advertisers Solid fundamental value proposition Visible recurring revenue and loyal customers Stable growth and high margins Exceptional conversion of profit to FCF Powerful combination of operating and financial leverage |

| Financial Overview and Investment Thesis |

| Financial Overview ($ in millions) * Excluding D&A, interest & taxes DME Pub Sales $542 $548 $562 Revenue 571 572 577 Expenses* 281 275 274 Donnelley EBITDA 290 297 303 DonTech 117 114 112 Total EBITDA 407 411 415 Net Normalizing Adjustments (15) 2 13 Normalized EBITDA $392 $413 $428 Adjusted Adjusted Forecast PF 2002 2003 2004 |
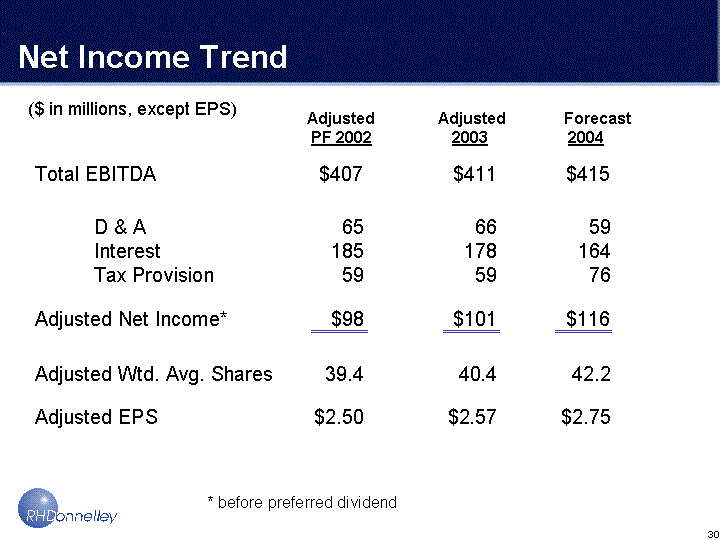
| Net Income Trend ($ in millions, except EPS) Adjusted Adjusted Forecast PF 2002 2003 2004 D & A 65 66 59 Interest 185 178 164 Tax Provision 59 59 76 Adjusted Net Income* $98 $101 $116 * before preferred dividend Total EBITDA $407 $411 $415 Adjusted Wtd. Avg. Shares 39.4 40.4 42.2 Adjusted EPS $2.50 $2.57 $2.75 |
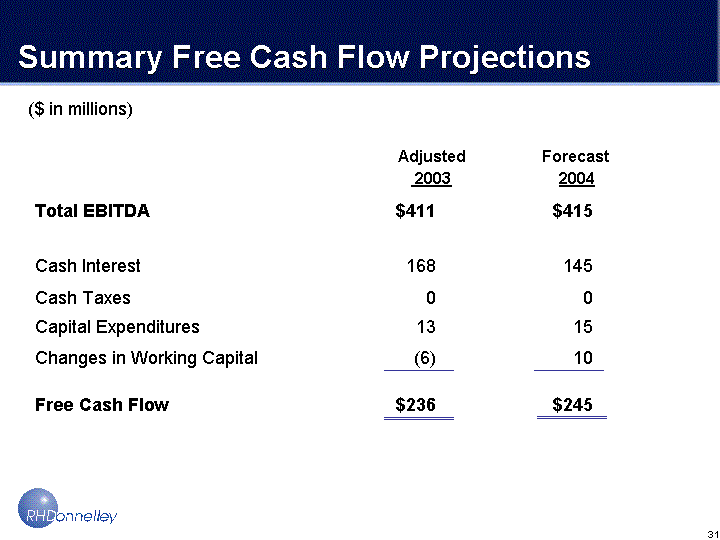
| Summary Free Cash Flow Projections Total EBITDA $411 $415 ($ in millions) Cash Interest 168 145 Changes in Working Capital (6) 10 Cash Taxes 0 0 Capital Expenditures 13 15 Free Cash Flow $236 $245 Adjusted Forecast 2003 2004 |
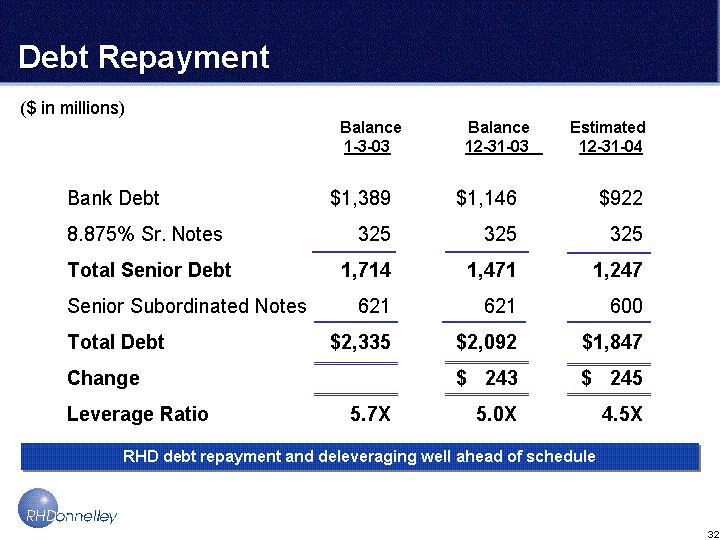
| Bank Debt $1,389 $1,146 $922 8.875% Sr. Notes 325 325 325 Total Senior Debt 1,714 1,471 1,247 Senior Subordinated Notes 621 621 600 Total Debt $2,335 $2,092 $1,847 Change $ 243 $ 245 Leverage Ratio 5.7X 5.0X 4.5X Debt Repayment ($ in millions) Balance Balance Estimated 1-3-03 12-31-03 12-31-04 RHD debt repayment and deleveraging well ahead of schedule |

| EBITDA Valuation: Favorable to Other Media 2004 Radio 17.9 Outdoor 16.7 Diverse Media 12.9 TV 11.5 Publishing 11.3 R.H. Donnelley 9.3 Source: Deutsche Bank Securities Inc. |

| Cash Conversion: Favorable to Other Media Estimated Margin: EBITDA minus CapEx 2002E revenue RBOC Directories 0.534 Radio 0.376 Outdoor 0.347 Broadcast TV 0.344 Newspapers 0.217 Source: Deutsche Bank Securities Inc. |
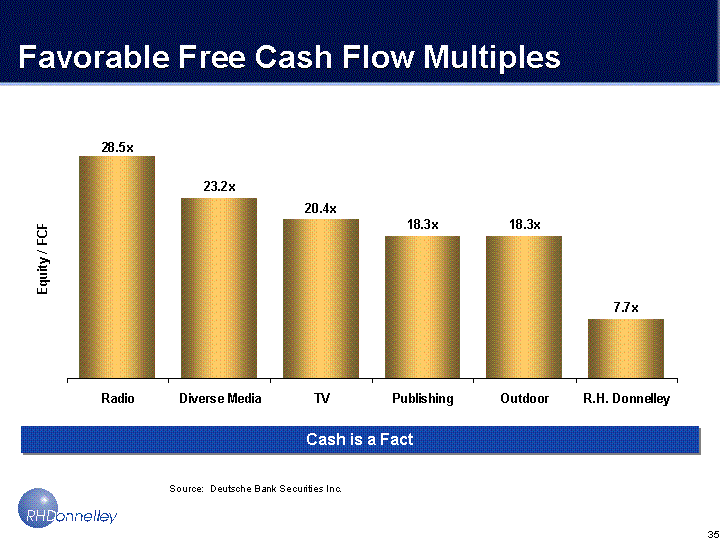
| Favorable Free Cash Flow Multiples Cash is a Fact 2004 Radio 28.5 Diverse Media 23.2 TV 20.4 Publishing 18.3 Outdoor 18.3 R.H. Donnelley 7.7 Source: Deutsche Bank Securities Inc. |

R.H. DONNELLEY CORPORATION | Schedule 1 | |
INDEX OF SCHEDULES |
| Schedule 1: | Index of Schedules | |
| Schedule 2: | Reconciliation of Reported to As Adjusted and Adjusted Pro Forma Unaudited Consolidated Statements of Income for the three months ended December 31, 2003 and 2002, respectively | |
| Schedule 3: | Reconciliation of Reported to As Adjusted and Adjusted Pro Forma Unaudited Consolidated Statements of Income for the year ended December 31, 2003 and 2002, respectively | |
| Schedule 4: | Reconciliation of Non-GAAP Measures | |
| Schedule 5: | Notes to Consolidated Statements of Income and Non-GAAP Measures |
R.H. DONNELLEY CORPORATION | Schedule 2 | |
CONSOLIDATED STATEMENTS OF INCOME | ||
Reconciliation of Reported to As Adjusted and Adjusted Pro Forma Amounts | ||
(unaudited) |
Amounts in millions, except earnings per share
| Three Months Ended December 31, 2003 | Three Months Ended December 31, 2002 | |||||||||||||||||||||||
| As | Adjusted | |||||||||||||||||||||||
| Reported | Adjustments | Adjusted (1) | Reported | Adjustments | Pro Forma (1) | |||||||||||||||||||
| Net revenue | $ | 116.1 | $ | 26.6 | (2) | $ | 142.7 | $ | 15.3 | $ | 126.6 | (7) | $ | 141.9 | ||||||||||
| Expenses | 68.7 | 4.5 | (2) | 73.2 | 9.9 | 54.3 | (7) | 64.2 | ||||||||||||||||
| Depreciation and amortization | 16.7 | — | 16.7 | 1.5 | 14.6 | (8) | 16.1 | |||||||||||||||||
| Partnership income | 22.5 | — | 22.5 | 28.1 | (3.9 | )(9) | 24.2 | |||||||||||||||||
Total operating income | 53.2 | 22.1 | 75.3 | 32.0 | 53.8 | 85.8 | ||||||||||||||||||
| Interest expense, net | 42.6 | — | 42.6 | 16.1 | 30.6 | (10) | 46.7 | |||||||||||||||||
| Other expense | — | — | 0.5 | (0.5) | (12) | — | ||||||||||||||||||
Pre-tax income | 10.6 | 22.1 | 32.7 | 15.4 | 23.7 | 39.1 | ||||||||||||||||||
| Tax provision | 4.3 | 8.3 | (3) | 12.6 | 7.6 | 7.0 | (3) | 14.6 | ||||||||||||||||
Net income | 6.3 | 13.8 | 20.1 | 7.8 | 16.7 | 24.5 | ||||||||||||||||||
| Preferred dividend | 5.2 | (0.9 | )(4) | 4.3 | 24.7 | (20.4 | )(4) | 4.3 | ||||||||||||||||
Net income (loss) available to common | $ | 1.1 | $ | 14.7 | $ | 15.8 | $ | (16.9 | ) | $ | 37.1 | $ | 20.2 | |||||||||||
Earnings (loss) per share (EPS):(5) | ||||||||||||||||||||||||
| Basic | $ | 0.03 | $ | 0.47 | $ | 0.50 | $ | (0.57 | ) | $ | 1.20 | $ | 0.63 | |||||||||||
| Diluted | $ | 0.03 | $ | 0.46 | $ | 0.49 | $ | (0.57 | ) | $ | 1.19 | $ | 0.62 | |||||||||||
Shares used in computing EPS: | ||||||||||||||||||||||||
| Basic | 31.0 | 9.0 | (6) | 40.0 | 29.7 | 9.0 | (6) | 38.7 | ||||||||||||||||
| Diluted | 32.2 | 9.0 | (6) | 41.2 | 29.7 | 9.8 | (6) | 39.5 | ||||||||||||||||
See accompanying Notes to Consolidated Statements of Income and Non-GAAP Measures — Schedule 10.
R.H. DONNELLEY CORPORATION | Schedule 3 | |
CONSOLIDATED STATEMENTS OF INCOME | ||
Reconciliation of Reported to As Adjusted and Adjusted Pro Forma Amounts | ||
(unaudited) |
Amounts in millions, except earnings per share
| Year Ended December 31, 2003 | Year Ended December 31, 2002 | |||||||||||||||||||||||
| As | Adjusted | |||||||||||||||||||||||
| Reported | Adjustments | Adjusted (1) | Reported | Adjustments | Pro Forma (1) | |||||||||||||||||||
| Net revenue | $ | 256.4 | $ | 315.9 | (2) | $ | 572.3 | $ | 75.4 | $ | 495.9 | (7) | $ | 571.3 | ||||||||||
| Expenses | 212.2 | 63.3 | (2) | 275.5 | 60.1 | 221.3 | (7) | 281.4 | ||||||||||||||||
| Depreciation and amortization | 65.8 | — | 65.8 | 6.2 | 58.5 | (8) | 64.7 | |||||||||||||||||
| Partnership income | 114.1 | — | 114.1 | 136.9 | (19.8 | )(9) | 117.1 | |||||||||||||||||
Total operating income | 92.5 | 252.6 | 345.1 | 146.0 | 196.3 | 342.3 | ||||||||||||||||||
| Interest expense, net | 180.0 | (2.4 | )(11) | 177.6 | 33.5 | 151.7 | (10) | 185.2 | ||||||||||||||||
| Other (income) expense | (1.5 | ) | 1.5 | (12) | — | 0.5 | (0.5 | )(12) | — | |||||||||||||||
Pre-tax (loss) income | (86.0 | ) | 253.5 | 167.5 | 112.0 | 45.1 | 157.1 | |||||||||||||||||
| Tax (benefit) provision | (36.1 | ) | 99.8 | (3) | 63.7 | 44.8 | 14.0 | (3) | 58.8 | |||||||||||||||
Net (loss) income | (49.9 | ) | 153.7 | 103.8 | 67.2 | 31.1 | 98.3 | |||||||||||||||||
| Preferred dividend | 58.4 | (41.9 | )(4) | 16.5 | 24.7 | (8.2 | )(4) | 16.5 | ||||||||||||||||
Net (loss) income available to common | $ | (108.3 | ) | $ | 195.6 | $ | 87.3 | $ | 42.5 | $ | 39.3 | $ | 81.8 | |||||||||||
(Loss) earnings per share (EPS):(5) | ||||||||||||||||||||||||
| Basic | $ | (3.53 | ) | $ | 6.16 | $ | 2.63 | $ | 1.42 | $ | 1.13 | $ | 2.55 | |||||||||||
| Diluted | $ | (3.53 | ) | $ | 6.10 | $ | 2.57 | $ | 1.40 | $ | 1.10 | $ | 2.50 | |||||||||||
Shares used in computing EPS: | ||||||||||||||||||||||||
| Basic | 30.7 | 8.7 | (6) | 39.4 | 29.6 | 9.0 | (6) | 38.6 | ||||||||||||||||
| Diluted | 30.7 | 9.7 | (6) | 40.4 | 30.3 | 9.1 | (6) | 39.4 | ||||||||||||||||
See accompanying Notes to Consolidated Statements of Income and Non-GAAP Measures — Schedule 10.
R.H. DONNELLEY CORPORATION | Schedule 4 | |
RECONCILIATION OF NON-GAAP MEASURES | ||
(unaudited) |
| Three Months Ended | Year Ended | |||||||||||||||
| Amounts in millions | December 31, | December 31, | ||||||||||||||
| 2003 | 2002 | 2003 | 2002 | |||||||||||||
Reconciliation of publication sales for Sprint-branded directories to net revenue | ||||||||||||||||
| Publication sales in the period | $ | 109.9 | $ | 109.3 | $ | 548.2 | $ | 541.7 | ||||||||
| Less publication sales for January 2003 directories that were not recognized as revenue due to purchase accounting | (102.4 | ) | ||||||||||||||
| Less publication sales not recognized as revenue in current period | (93.6 | ) | (214.3 | ) | ||||||||||||
| Less publication sales for SPA directories not sold by RHD | (50.0 | ) | (357.0 | ) | ||||||||||||
| Plus revenue recognized from prior period publication sales | 94.5 | |||||||||||||||
| Publication sales reported by RHD in 2002 | 59.3 | 184.7 | ||||||||||||||
| Less sales contracts executed in prior periods and reported as calendar sales in prior periods | (58.4 | ) | (70.0 | ) | ||||||||||||
| Plus sales sold during the period to be reported as publication sales in future periods | 33.6 | 72.1 | ||||||||||||||
| Calendar sales reported by RHD in 2002 | $ | 34.5 | $ | 186.8 | ||||||||||||
| Net directory advertising revenue | 110.8 | 231.5 | ||||||||||||||
| Net commission revenue on 2002 calendar sales | $ | 7.8 | $ | 42.7 | ||||||||||||
| Pre-press publishing revenue | 4.2 | 7.2 | 20.6 | 31.1 | ||||||||||||
| Other revenue | 1.1 | 0.3 | 4.3 | 1.6 | ||||||||||||
Net revenue — GAAP | $ | 116.1 | $ | 15.3 | $ | 256.4 | $ | 75.4 | ||||||||
| Three Months Ended | Year Ended | ||||||||||||||||
| Amounts in millions | December 31, | December 31, | |||||||||||||||
| 2003 | 2002 | 2003 | 2002 | ||||||||||||||
Reconciliation of publication sales for SBC directories for which DonTech sells advertising to partnership income | |||||||||||||||||
| Publication sales in the period | $ | 158.8 | $ | 166.7 | $ | 402.4 | $ | 418.2 | |||||||||
| Less the value of contracts executed and reported as calendar sales in prior periods | (150.8 | ) | (158.3 | ) | (142.2 | ) | (157.5 | ) | |||||||||
| Plus the value of contracts executed during the period to be reported as publication sales in future periods | 71.4 | 72.3 | 134.7 | 142.2 | |||||||||||||
| Calendar sales | $ | 79.4 | $ | 80.7 | $ | 394.9 | $ | 402.9 | |||||||||
| Commission revenue from above calendar sales | $ | 20.0 | $ | 20.4 | $ | 99.7 | $ | 101.8 | |||||||||
| Partnership net expenses | (17.4 | ) | (15.2 | ) | (65.0 | ) | (64.8 | ) | |||||||||
| Partnership profit | $ | 2.6 | $ | 5.2 | $ | 34.7 | $ | 37.0 | |||||||||
| Company’s 50% share of partnership profits | $ | 1.3 | $ | 2.6 | $ | 17.4 | $ | 18.5 | |||||||||
| Revenue participation income from above calendar sales | 21.2 | 21.6 | 96.7 | 98.6 | |||||||||||||
| Total income from DonTech | 22.5 | 24.2 | 114.1 | 117.1 | |||||||||||||
| CenDon LLC joint venture income | — | 3.9 | (9) | — | 19.8 | (9) | |||||||||||
Partnership income — GAAP | $ | 22.5 | $ | 28.1 | $ | 114.1 | $ | 136.9 | |||||||||
See accompanying Notes to Consolidated Statements of Income and Non-GAAP Measures — Schedule 10.
R.H. DONNELLEY CORPORATION | Schedule 4 | |
RECONCILIATION OF NON-GAAP MEASURES (con’t) | ||
(unaudited) |
| Three Months Ended | Year Ended | |||||||||||||||
| December 31, | December 31, | |||||||||||||||
| Amounts in millions | 2003 | 2002 | 2003 | 2002 | ||||||||||||
Reconciliation of net income to EBITDA and reconciliation of EBITDA to Adjusted/Adjusted Pro Forma EBITDA | ||||||||||||||||
Net income — GAAP | $ | 6.3 | $ | 7.8 | $ | (49.9 | ) | $ | 67.2 | |||||||
| Plus tax provision | 4.3 | 7.6 | (36.1 | ) | 44.8 | |||||||||||
| Plus interest expense, net | 42.6 | 16.1 | 180.0 | 33.5 | ||||||||||||
| Plus depreciation and amortization | 16.7 | 1.5 | 65.8 | 6.2 | ||||||||||||
EBITDA (13) | 69.9 | 33.0 | 159.8 | 151.7 | ||||||||||||
| Plus (less) other expense (income) | — | 0.5 | (1.5 | ) | 0.5 | |||||||||||
| Plus net revenue that would have been reported for directories published prior to the acquisition absent purchase accounting | 26.6 | (2) | 315.9 | (2) | ||||||||||||
| Less expenses that would have been reported for directories published prior to the acquisition absent purchase accounting | (4.5 | )(2) | (63.3 | )(2) | ||||||||||||
| Plus revenue recognized by SPA less RHD commission revenue and pre-press publishing services revenue from SPA that would have been eliminated as intercompany transactions | 126.6 | (7) | 495.9 | (7) | ||||||||||||
| Less expenses recognized by SPA, net of expenses for sales agency and pre-press publishing services provided by RHD that would have been eliminated as intercompany transactions and adjustments for differences in current and historical accounting policies | (54.3 | )(7) | (221.3 | )(7) | ||||||||||||
| Less income recognized by RHD from CenDon LLC that as a result of the acquisition would have been eliminated as intercompany income | (3.9 | )(9) | (19.8 | )(9) | ||||||||||||
Adjusted/Adjusted Pro Forma EBITDA (13) | $ | 92.0 | $ | 101.9 | $ | 410.9 | $ | 407.0 | ||||||||
Amounts in millions
| Three | ||||||||||||||||
| Months | ||||||||||||||||
| Ended | Year Ended | |||||||||||||||
| December 31, | December 31, | |||||||||||||||
| 2003 | 2003 | |||||||||||||||
Reconciliation of cash flow from operations to Free Cash Flow | ||||||||||||||||
Cash flow from operations — GAAP | $ | 22.5 | $ | 248.6 | ||||||||||||
| Less fixed asset and computer software additions | (4.7 | ) | (12.6 | ) | ||||||||||||
| Free cash flow | $ | 17.8 | $ | 236.0 | ||||||||||||
See accompanying Notes to Consolidated Statements of Income and Non-GAAP Measures — Schedule 10.
R.H. DONNELLEY CORPORATION RECONCILIATION OF NON-GAAP MEASURES (con’t) | Schedule 4 | |
(unaudited) |
Amounts in millions
| Full Year 2004 | ||||
| Outlook | ||||
Reconciliation of publication sales outlook for Sprint-branded directories to net revenue outlook | ||||
| Publication sales outlook | $ | 566 | ||
| Plus revenue expected to be recognized from 2003 publication sales | 217 | |||
| Less publication sales that are expected to not be recognized as revenue in 2004 | (225 | ) | ||
| Net directory advertising revenue | 558 | |||
| Plus pre-press publishing revenue outlook | 17 | |||
| Plus other revenue outlook | 2 | |||
Net revenue outlook — GAAP | $ | 577 | ||
Reconciliation of net income outlook to EBITDA outlook | ||||
Net income outlook — GAAP | $ | 116 | ||
| Plus expected tax provision | 76 | |||
| Plus expected interest expense, net | 164 | |||
| Operating income outlook | 356 | |||
| Plus expected depreciation and amortization | 59 | |||
| EBITDA outlook (13) | $ | 415 | ||
Reconciliation of cash flow from operations outlook to free cash flow outlook | ||||
Cash flow from operations outlook — GAAP | $ | 260 | ||
| Less expected fixed asset and computer software additions | 15 | |||
| Free cash flow outlook | $ | 245 | ||
See accompanying Notes to Consolidated Statements of Income and Non-GAAP Measures — Schedule 10.
R.H. DONNELLEY CORPORATION RECONCILIATION OF NON-GAAP MEASURES (con’t) | Schedule 4 | |
(unaudited) |
Amounts in millions
| Full Year 2004 | ||||||||
| Outlook | ||||||||
Reconciliation of full year diluted GAAP EPS outlook to adjusted diluted EPS outlook and calculation of adjusted diluted EPS | ||||||||
Net income available to common shareholders (before application of two-class method) outlook — GAAP | $ | 94 | ||||||
| % of earnings allocated to common shareholders | 77 | % | ||||||
| Earnings available to common shareholders | 73 | |||||||
Shares used to calculate diluted EPS outlook — GAAP | 31.4 | |||||||
Diluted EPS outlook — GAAP (Two-class method) | $ | 2.31 | ||||||
| Per share effect of allocating earnings | 0.69 | |||||||
| Dilutive effect of assuming conversion of Preferred Stock at the beginning of year | (0.25 | ) | ||||||
| Adjusted EPS outlook | $ | 2.75 | ||||||
Calculation of Adjusted diluted EPS | ||||||||
Net income available to common shareholders (before application of two-class method) outlook — GAAP | $ | 94 | ||||||
| Add back Preferred Stock dividend | 22 | |||||||
| Net income outlook — GAAP | (A | ) | $ | 116 | ||||
Shares used to calculate diluted EPS outlook — GAAP | 31.4 | |||||||
| Additional diluted shares from common stock equivalents (14) | 1.3 | |||||||
| Additional diluted shares assuming Preferred Stock is converted to common shares at the beginning of the period | 9.5 | |||||||
| (B | ) | 42.2 | ||||||
| Adjusted EPS outlook | (A) / | (B) | $ | 2.75 | ||||
Reconciliation of interest expense outlook to cash interest expense outlook | ||||||||
| Interest expense outlook — GAAP | $ | 164 | ||||||
| Less non-cash amortization of deferred financing costs outlook | (19 | ) | ||||||
| Cash interest expense | $ | 145 | ||||||
See accompanying Notes to Consolidated Statements of Income and Non-GAAP Measures — Schedule 10.
| R.H. DONNELLEY CORPORATION | Schedule 5 | |
NOTES TO CONSOLIDATED STATEMENTS OF INCOME | ||
AND NON-GAAP MEASURES |
(1) As adjusted results for 2003 assume that the revenue and direct costs from directories published prior to the acquisition were recognized during the period and adjusts for the difference in SPA’s historical accounting policy with respect to expense recognition and RHD’s current policy. Adjusted pro forma results for 2002 assume that the acquisition occurred on January 1, 2002.
(2) Represents the revenue and direct costs from directories published prior to the acquisition that would have been recognized during the period had it not been for purchase accounting adjustments required under GAAP and includes an adjustment for the difference in SPA’s historical accounting policy with respect to expense recognition and RHD’s current policy.
(3) Represents the tax effect of adjustments.
(4) The adjustment for the 2003 and 2002 periods represents the amount of the reported preferred dividend related to a beneficial conversion feature. The periods are adjusted to report only the stated 8% preferred dividend for the period assuming the Preferred Stock was issued at the beginning of each period.
(5) On a reported basis, EPS are calculated under the “two-class” method. The two-class method is an earnings allocation formula that computes EPS for common stockholders and preferred stockholders on an as-converted basis assuming that the common stockholders and preferred stockholders have equal rights in the undistributed earnings of the Company on a per-share basis. On an as adjusted and adjusted pro forma basis, EPS are calculated as net income before preferred dividends divided by the weighted average shares outstanding for the period assuming the preferred stock was converted to common stock at the beginning of the period.
(6) Shares used in computing as adjusted and adjusted pro forma EPS include additional shares assuming the preferred stock was converted at the beginning of the period. Because there was a net loss for the year ended December 31, 2003, basic shares were used to calculate dilutive GAAP EPS because the effect of diluted shares would be anti-dilutive to EPS. Accordingly, the adjustment to diluted shares for the year ended December 31, 2003 and for the three months ended December 31, 2002 include 1.0 million and 0.7 million shares, respectively, representing the dilutive impact of common stock equivalents for that period. The 2002 adjusted pro forma diluted shares also include the pro forma dilutive effect of warrants issued with the preferred stock, which is already reflected in reported 2003 amounts.
(7) Represents amounts recognized by SPA during the period and the elimination of transactions between RHD and SPA that would have been eliminated had the acquisition occurred on January 1, 2002. Reported expenses for the three months and year ended December 31, 2002 include a benefit of $6.6 million and $6.4 million, respectively, for a restructuring reserve reversal and an investment impairment charge of $2.0 million. These amounts have been excluded from the adjusted pro forma results.
(8) Represents depreciation and amortization expense recognized by SPA during the period plus amortization expense for acquired intangible assets assuming the acquisition occurred on January 1, 2002.
(9) Represents income from CenDon LLC recognized by RHD, which would have been eliminated as intercompany income had the acquisition occurred on January 1, 2002.
(10) Represents additional interest expense that would have been incurred assuming the financing obtained to acquire SPA was outstanding as of January 1, 2002.
(11) Represents the write-off of deferred financing costs on pre-acquisition debt that was refinanced at the closing of the acquisition.
(12) Other income in 2003 reflects a gain on hedging activities. Other expense in 2002 reflects a loss from hedging activities partially offset by a gain from the reversal of a restructuring reserve. These items are considered non-operational and are excluded from the as adjusted and adjusted pro forma results.
(13) EBITDA represents earnings before interest, taxes, depreciation and amortization. Adjusted EBITDA represents adjusted earnings before interest, taxes, depreciation and amortization. EBITDA and Adjusted EBITDA are not measures of operating performance computed in accordance with GAAP and should not be considered as a substitute for operating income or net income prepared in conformity with GAAP. In addition, EBITDA and Adjusted EBITDA may not be comparable to similarly titled measures of other companies.
(14) In the calculation of GAAP EPS, diluted EPS is greater than basic EPS because of the use of the two-class method to calculate basic EPS. However, diluted EPS can never be greater than basic EPS, therefore the dilutive effect of common stock equivalents (options and warrants) is not included in the share amount. In the adjusted EPS calculation, the dilutive effect of common stock equivalents is included in the share amount.