| D U P O N T A N N U A L R E V I E WScience Delivering Shareholder Value |
Chairman’s Message
To DuPont Shareholders:
DuPont delivered strong results in 2007, overcoming the challenges of lower U.S. housing and auto demand and higher cost ingredients. Our strength came from rapid revenue growth in emerging markets, our Agriculture & Nutrition segment, higher returns on innovation, and continued cost and capital productivity gains. There are powerful reasons why our shareholders should view their investment in DuPont with confidence for 2008 and beyond.
We recognize that these are challenging times, as the macroeconomic and global political environment creates concerns among investors about the outlook for business profitability and growth for companies across the industrial, consumer and service sectors.
While such concerns are real, the multi-year transformation of DuPont and our improved performance have put us in a better position to meet these challenges.
Our Recent Performance
Aligned with our acceleration plan announced in November 2005, DuPont has:
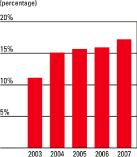
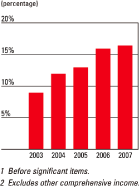
| • | | Improved our overall segment pre-tax operating income margin from 11 percent in 2003 to 17 percent in 2007. Return on invested capital increased from 8 to 16 percent over the same period. |
| |
| • | | Repurchased 12 percent of our outstanding stock for $5 billion. |
| |
| • | | Raised the dividend by 11 percent. We currently pay you $1.4 billion a year in dividends—twice the average of the S&P 500 on a per share basis and about 35 percent of our cash flow from operations. |
In addition, our metrics for new product launches, patents filed and granted, and sales from new products have all moved significantly upward in the past three years.
Our entire team is intensely focused on meeting our near-term financial targets in sales, earnings and cash. We are confident we can deliver attractive growth in earnings in 2008, and see even stronger growth in the years to follow—continuing our improvement of the last three years.
Our Market-Based Science Is Delivering Growth
DuPont is a science company. The core of our capability and competitive advantage is market-driven scientific discovery and new product innovation. Our strengthened science capability has been the driving force behind the transformation of DuPont over the past decade, and has reshaped our businesses. In particular, DuPont is leading the rapid convergence of biology and chemistry to create additional competitive advantage and open new global markets for superior-performing products.
Today over 5,000 DuPont scientists worldwide are delivering high margin, high value-added products that are aimed directly at unmet market needs. Sales of these products, which I will outline in the next section, have been instrumental in helping us overcome higher energy and ingredient costs, including record high oil prices.
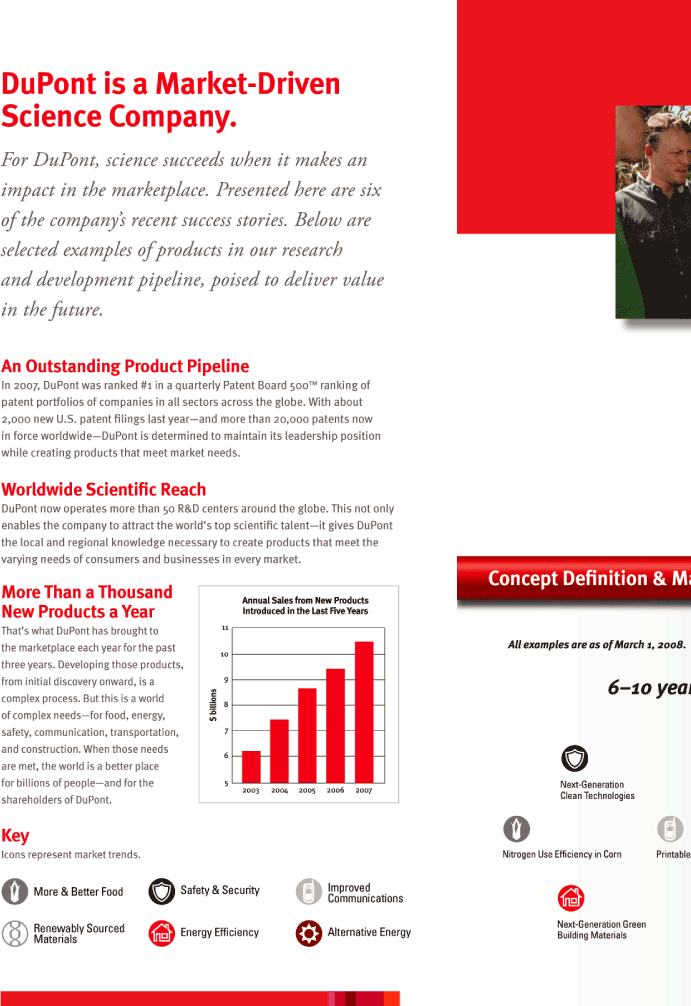
Based on important measures such as new product introductions, U.S. patent applications filed and U.S. patents granted, DuPont is demonstrating superior R&D performance, which helped boost average selling prices about 3 to 5 percent annually for the past three years. In 2007, 36 percent of our revenues—or about $10.5 billion—were generated by products introduced in the last five years—up from 24 percent in 2001. In the face of a near tripling of oil prices, this has been critical.
DuPont has a rich pipeline of new products, particularly in Agriculture, Safety & Protection, Electronics, and applied biosciences, with more projects underway than ever before. Our applied biosciences businesses promise significant future growth, particularly in biofuels and biomaterials where we have a clear technology leadership position and strong partnerships that will facilitate market access. These strengths are backed by a world-class intellectual property portfolio in biotechnology.
Fundamentals for Growth Continue in 2008 and Beyond
In 2008, our global market presence and change in business mix since the 2001 U.S. recession will make us much more resilient to the impacts of a recession in any one country. This also gives us confidence we can deliver attractive earnings growth in 2008. Let me explain why:
| • | | In 2007, more than 60 percent of our sales were from outside the U.S. These sales are growing rapidly. From 2001 through 2007, our compound annual growth rates |
OUR VISION
To be the world’s most dynamic science company, creating sustainable solutions essential to a better, safer, healthier life for people everywhere.
DUPONT CORE VALUES
| • | | Safety & Health |
| |
| • | | Environmental Stewardship |
| |
| • | | Highest Ethical Behavior |
| |
| • | | Respect for People |
GROWTH STRATEGIES
| • | | Put Our Science to Work |
| |
| • | | Go Where the Growth Is |
| |
| • | | Leverage the Power of One DuPont |
| | | in emerging markets were 13 percent in emerging Europe, 18 percent in emerging Asia and 11 percent in Latin America. |
| |
| • | | U.S. housing markets have declined for almost two years, but DuPont has more than offset the impact with growth outside the U.S. |
| |
| • | | Our balance sheet is strong with a prudent level of debt. We are able to weather an economic downturn and have plenty of borrowing power to fund growth investments and opportunities as they develop. |
Looking beyond 2008...through 2010 we see clear potential for average double-digit earnings growth driven by advances in several strategic areas:
| • | | New science for growing agriculture markets. DuPont is vital to the world’s food supply. With demand for protein rising rapidly, global food production will have to double between now and 2025 on virtually the same amount of land currently in production. As one of the world’s largest producers of corn and soy seed and crop protection products, DuPont is bringing to market more efficient and cost-effective control systems for weeds, insects and fungus to boost farm productivity, quality and yield. Our rate of innovation is the fastest ever, as evidenced by new products such as Optimum® GAT® traits and Rynaxypyr® insecticide, and we will capitalize on this strength. |
| |
| • | | Growing demand for Safety & Protection. People want to feel safer and more secure at home, on the job, in their cars—everywhere. DuPont’s long experience and $6 billion base business in advanced materials such as Kevlar®, Nomex®, and Tyvek® have resulted in a broad offering of products and services that address this growing global need. In 2007, we announced a new $500 million Kevlar® brand fiber production facility in South Carolina, which came on the heels of capacity expansions for Nomex® flame-resistant fibers. In 2008, we will continue to use our science and growth investments to take advantage of the opportunity we see for attractive growth in our Safety & Protection segment. |
| |
| • | | Springboard position in emerging markets. Our rapid topline growth in emerging markets is a key factor in counterbalancing softness in the North America automotive and residential housing markets. Business unit leaders in our Performance Materials, Coatings & Color Technologies and Electronic & Communication Technologies segments are succeeding in generating strong growth in the emerging markets of Asia, Central and Eastern Europe, and Latin America. |
| |
| • | | Extend cost productivity gains. From 2003 through 2007, DuPont reduced fixed costs as a percent of sales by 7 points. Our cost savings projects have offset inflation in personnel costs and have provided funding for a large number of growth investments. Productivity is the result of the way we work at DuPont. You can expect us to continue to generate cost productivity gains as a mechanism for funding growth. |
We Are Committed to Delivering Increased Shareholder Value
Behind DuPont’s improved results—from market analysis to scientific discovery to disciplined sourcing, production and go-to-market decision-making—are the highly skilled 60,000 dedicated employees of DuPont around the world.
Further energized by our improved results, DuPont’s leadership team is the strongest it has ever been and is eager to exceed new and higher goals.
The entire DuPont organization is determined to make your investment in DuPont a lucrative and lasting one. We appreciate your ownership of our company and remain committed to delivering superior results compared to your other investment alternatives.
| | | |
| | |  |
| | | Chad Holliday |
| | | Chairman & CEO |
| | | March 1, 2008 |
Net Sales
Pretax Operating Income Margin1
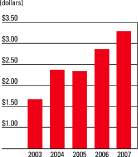
Earnings Per Share1
Return on Invested Capital1, 2
DuPont is a Market-Driven Science Company.
For DuPont, science succeeds when it makes an impact in the marketplace. Presented here are six of the company’s recent success stories. Below are selected examples of products in our research and development pipeline, poised to deliver value in the future. |
| An Outstanding Product Pipeline In 2007, DuPont was ranked #1 in a quarterly Patent Board 500™ ranking of patent portfolios of companies in all sectors across the globe. With about 2,000 new U.S. patent fi lings last year—and more than 20,000 patents now in force worldwide—DuPont is determined to maintain its leadership position while creating products that meet market needs.Worldwide Scientifi c Reach DuPont now operates more than 50 R&D centers around the globe. This not only enables the company to attract the world’s top scientifi c talent—it gives DuPont the local and regional knowledge necessary to create products that meet the varying needs of consumers and businesses in every market. |
| Annual Sales from New Products New Products a Year Introduced in the Last Five Years |
| That’s what DuPont has brought to 11 the marketplace each year for the pastAll examples are as of March 1, 2008. |
| three years. Developing those products, from initial discovery onward, is a 96–10complex process. But this is a worldbillions8 of complex needs—for food, energy,$safety, communication, transportation, 7 and construction. When those needs 6 |
| are met, the world is a better place for billions of people—and for the 5 Next-Generation |
| shareholders of DuPont. Clean Technologies |
| Icons represent market trends. Nitrogen Use Effi ciency in Corn Printable |
| More & Better Food Safety & Security Improved Communications |
| Renewably Sourced Next-Generation Green |
| Energy Effi ciency Alternative Energy Building Materials MaterialsScience |
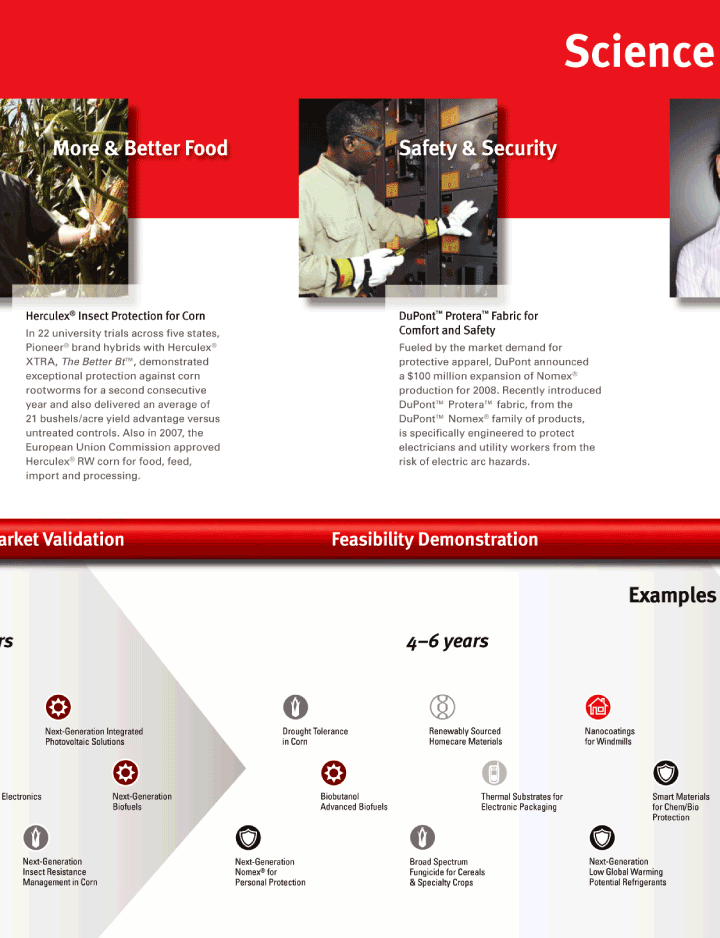
| More & Better Food Safety & Security |
| Herculex® Insect Protection for Corn DuPont™ Protera™ Fabric for In 22 university trials across fi ve states, Comfort and Safety Pioneer® brand hybrids with Herculex® Fueled by the market demand for XTRA,The Better Bt™, demonstrated protective apparel, DuPont announced exceptional protection against corn a $100 million expansion of Nomex® rootworms for a second consecutive production for 2008. Recently introduced year and also delivered an average of DuPont™ Protera™ fabric, from the 21 bushels/acre yield advantage versus DuPont™ Nomex® family of products, untreated controls. Also in 2007, the is specifi cally engineered to protect European Union Commission approved electricians and utility workers from the Herculex® RW corn for food, feed, risk of electric arc hazards. import and processing. |
| Validation Feasibility Demonstration |
| 4–6 years Next-Generation Integrated Drought Tolerance Renewably Sourced Nanocoatings Photovoltaic Solutions in CornHomecare Materialsfor Windmills Electronics Next-Generation Biobutanol Thermal Substrates for |
| Smart Materials BiofuelsAdvanced BiofuelsElectronic Packagingfor Chem/Bio Protection Next-Generation Next-Generation Broad Spectrum Next-Generation Insect Resistance Nomex® for Fungicide for Cereals Low Global Warming Management in Corn Personal Protection & Specialty Crops Potential Refrigerants |
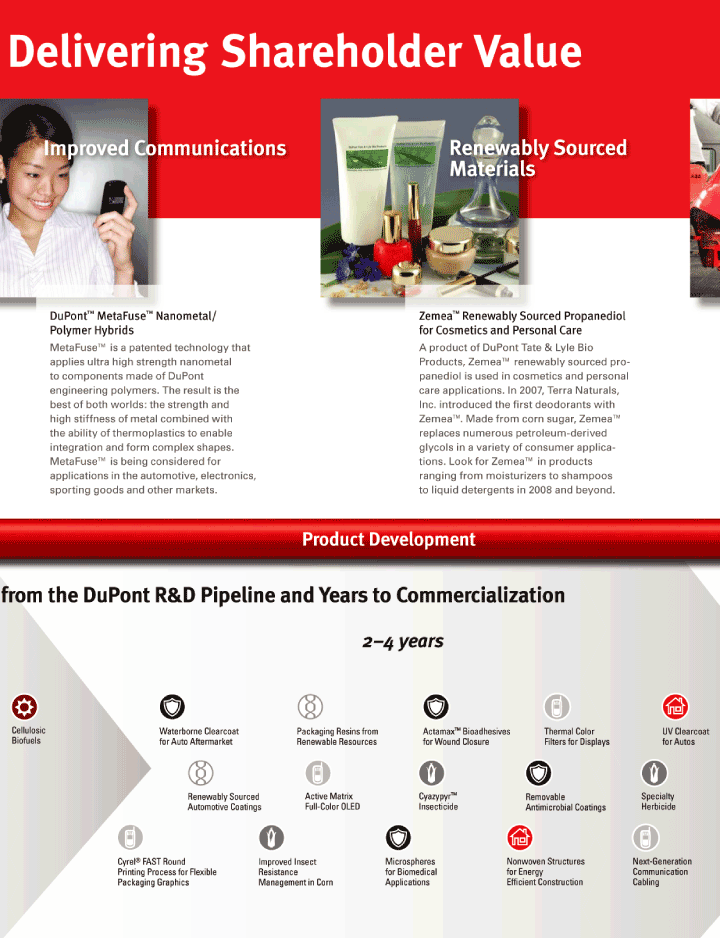
| Delivering Shareholder Value |
| Improved Communications Renewably Sourced Materials |
DuPont™ MetaFuse™ Nanometal/ Zemea™ Renewably Sourced Propanediol Polymer Hybrids for Cosmetics and Personal Care
MetaFuse™ is a patented technology that A product of DuPont Tate & Lyle Bio applies ultra high strength nanometal Products, Zemea™ renewably sourced pro-to components made of DuPont panediol is used in cosmetics and personal engineering polymers. The result is the care applications. In 2007, Terra Naturals, best of both worlds: the strength and Inc. introduced the fi rst deodorants with high stiffness of metal combined with Zemea™. Made from corn sugar, Zemea™ the ability of thermoplastics to enable replaces numerous petroleum-derived integration and form complex shapes. glycols in a variety of consumer applica-MetaFuse™ is being considered for tions. Look for Zemea™ in products applications in the automotive, electronics, ranging from moisturizers to shampoos sporting goods and other markets. to liquid detergents in 2008 and beyond. |
| from the DuPont R&D Pipeline and Years to Commercialization |
| Cellulosic Waterborne Clearcoat Packaging Resins from Actamax™ Bioadhesives Thermal Color UV Clearcoat Biofuelsfor Auto Aftermarket Renewable Resourcesfor Wound Closure Filters for Displays for Autos Renewably Sourced Active Matrix Cyazypyr™ Removable Specialty Automotive CoatingsFull-Color OLED InsecticideAntimicrobial CoatingsHerbicide Cyrel® FAST Round Improved Insect Microspheres Nonwoven Structures Next-Generation Printing Process for Flexible Resistance for Biomedical for Energy Communication Packaging Graphics Management in Corn A pplications Effi cient Construction Cabling |
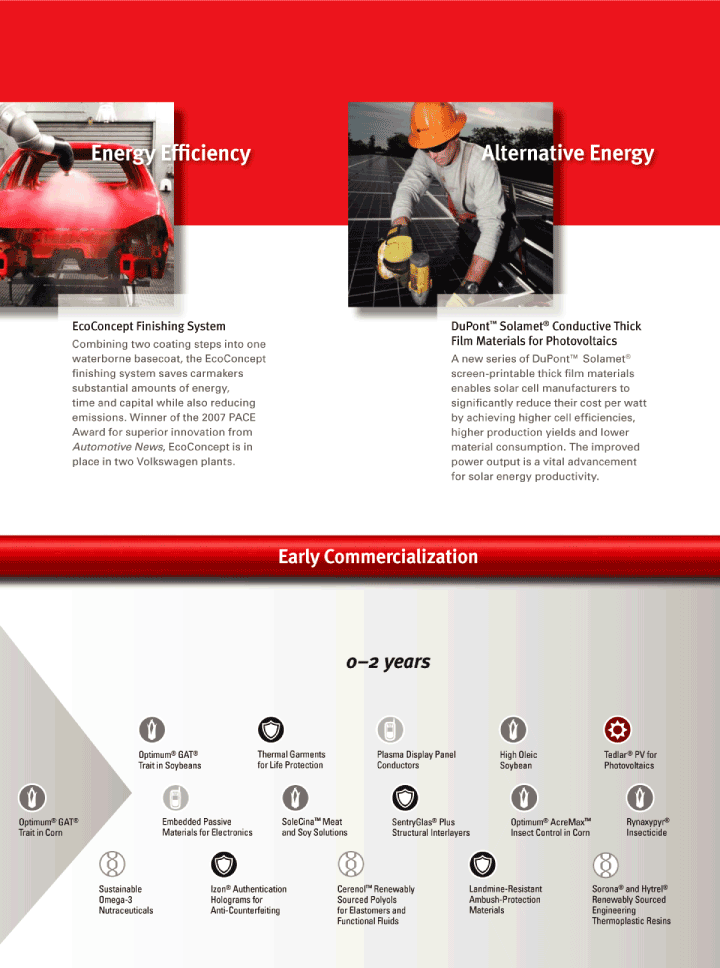
| Energy Effi ciency Alternative Energy |
| EcoConcept Finishing System DuPont™ Solamet® Conductive Thick |
| Combining two coating steps into one Film Materials for Photovoltaics waterborne basecoat, the EcoConcept A new series of DuPont™ Solamet®fi nishing system saves carmakers screen-printable thick fi lm materials substantial amounts of energy, enables solar cell manufacturers to time and capital while also reducing signifi cantly reduce their cost per watt emissions. Winner of the 2007 PACE by achieving higher cell effi ciencies, Award for superior innovation from higher production yields and lowerAutomotive News, EcoConcept is in material consumption. The improved place in two Volkswagen plants. power output is a vital advancement for solar energy productivity. |
| Optimum® GAT® Thermal Garments Plasma Display Panel High Oleic Tedlar® PV for Trait in Soybeans for Life Protection ConductorsSoybean Photovoltaics Optimum® GAT® Embedded Passive SoleCina™ Meat SentryGlas® Plus Optimum® AcreMax™Rynaxypyr® Trait in Corn Materials for Electronicsand Soy Solutions Str uctural InterlayersInsect Control in CornInsecticide Sustainable Izon® Authentication Cerenol™ Renewably Landmine-Resistant Sorona® and Hytrel® Omega-3 Holograms for Sourced Polyols Ambush-Protection Renewably Sourced Nutraceuticals Anti-Counterfeiting for Elastomers and Materials Engineering Functional Fluids Thermoplastic Resins |
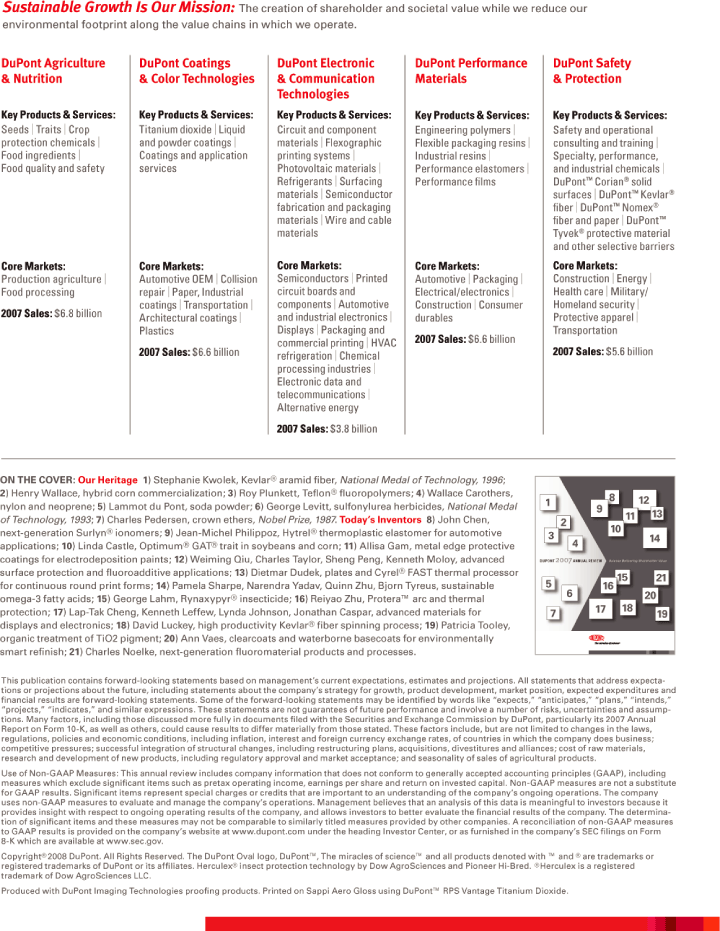
| Sustainable Growth Is Our Mission:The creation of shareholder and societal value while we reduce our environmental footprint along the value chains in which we operate. |
| DuPont Agriculture DuPont Coatings DuPont Electronic DuPont Performance DuPont Safety & Nutrition & Color Technologies & Communication Materials & Protection Technologies |
| Key Products & Services: Key Products & Services: Key Products & Services: Key Products & Services: Key Products & Services: |
| Seeds | Traits | Crop Titanium dioxide | Liquid Circuit and component Engineering polymers | Safety and operational protection chemicals | and powder coatings | materials | Flexographic Flexible packaging resins | consulting and training | Food ingredients | Coatings and application printing systems | Industrial resins | Specialty, performance, Food quality and safety services Photovoltaic materials | Performance elastomers | and industrial chemicals | Refrigerants | Surfacing Performance fi lms DuPont™ Corian® solid materials | Semiconductor surfaces | DuPont™ Kevlar® fabrication and packaging fi ber | DuPont™ Nomex® materials | Wire and cable fi ber and paper | DuPont™ materials Tyvek® protective material and other selective barriers |
| Core Markets: Core Markets: Core Markets: Core Markets: Core Markets: |
| Production agriculture | Automotive OEM | Collision Semiconductors | Printed Automotive | Packaging | Construction | Energy | Food processing repair | Paper, Industrial circuit boards and Electrical/electronics | Health care | Military/ coatings | Transportation | components | Automotive Construction | Consumer Homeland security |2007 Sales:$6.8 billion | and industrial electronics | Protective apparel | Architectural coatings durables Plastics Displays | Packaging and Transportation commercial printing | HVAC2007 Sales:$6.6 billion2007 Sales:$6.6 billion |2007 Sales:$5.6 billion refrigeration Chemical processing industries | Electronic data and telecommunications | Alternative energy |
| 2007 Sales:$3.8 billionON THE COVER: Our Heritage 1) Stephanie Kwolek, Kevlar® aramid fi ber,National Medal of Technology, 1996;2) Henry Wallace, hybrid corn commercialization;3) Roy Plunkett, Tefl on® fl uoropolymers;4) Wallace Carothers, |
| 8 12 1nylon and neoprene;5) Lammot du Pont, soda powder;6) George Levitt, sulfonylurea herbicides,National Medal9 |
| 11 13of Technology, 1993;7) Charles Pedersen, crown ethers,Nobel Prize, 1987.Today’s Inventors 8) John Chen,2 10next-generation Surlyn® ionomers;9) Jean-Michel Philippoz, Hytrel® thermoplastic elastomer for automotive3 14applications;10) Linda Castle, Optimum® GAT® trait in soybeans and corn;11) Allisa Gam, metal edge protective4coatings for electrodeposition paints;12) Weiming Qiu, Charles Taylor, Sheng Peng, Kenneth Moloy, advanced DUPONT 2007 ANNUAL RE VIE WScience Delivering Shareholder Valuesurface protection and fl uoroadditive applications;13) Dietmar Dudek, plates and Cyrel® FAST thermal processor |
| 15 21for continuous round print forms;14) Pamela Sharpe, Narendra Yadav, Quinn Zhu, Bjorn Tyreus, sustainable5 16 6 20omega-3 fatty acids;15) George Lahm, Rynaxypyr® insecticide;16) Reiyao Zhu, Protera™ arc and thermal |
| 17 18protection;17) Lap-Tak Cheng, Kenneth Leffew, Lynda Johnson, Jonathan Caspar, advanced materials for7 19displays and electronics;18) David Luckey, high productivity Kevlar® fi ber spinning process;19) Patricia Tooley, organic treatment of TiO2 pigment;20) Ann Vaes, clearcoats and waterborne basecoats for environmentally smart refi nish;21) Charles Noelke, next-generation fl uoromaterial products and processes. |
| This publication contains forward-looking statements based on management’s current expectations, estimates and projections. All statements that address expectations or projections about the future, including statements about the company’s strategy for growth, product development, market position, expected expenditures and fi nancial results are forward-looking statements. Some of the forward-looking statements may be identifi ed by words like “expects,” “anticipates,” “plans,” “intends,” “projects,” “indicates,” and similar expressions. These statements are not guarantees of future performance and involve a number of risks, uncertainties and assumptions. Many factors, including those discussed more fully in documents fi led with the Securities and Exchange Commission by DuPont, particularly its 2007 Annual Report on Form 10-K, as well as others, could cause results to differ materially from those stated. These factors include, but are not limited to changes in the laws, regulations, policies and economic conditions, including infl ation, interest and foreign currency exchange rates, of countries in which the company does business; competitive pressures; successful integration of structural changes, including restructuring plans, acquisitions, divestitures and alliances; cost of raw materials, research and development of new products, including regulatory approval and market acceptance; and seasonality of sales of agricultural products. Use of Non-GAAP Measures: This annual review includes company information that does not conform to generally accepted accounting principles (GAAP), including measures which exclude signifi cant items such as pretax operating income, earnings per share and return on invested capital. Non-GAAP measures are not a substitute for GAAP results. Signifi cant items represent special charges or credits that are important to an understanding of the company’s ongoing operations. The company uses non-GAAP measures to evaluate and manage the company’s operations. Management believes that an analysis of this data is meaningful to investors because it provides insight with respect to ongoing operating results of the company, and allows investors to better evaluate the fi nancial results of the company. The determination of signifi cant items and these measures may not be comparable to similarly titled measures provided by other companies. A reconciliation of non-GAAP measures to GAAP results is provided on the company’s website at www.dupont.com under the heading Investor Center, or as furnished in the company’s SEC fi lings on Form 8-K which are available at www.sec.gov. Copyright® 2008 DuPont. All Rights Reserved. The DuPont Oval logo, DuPont™, The miracles of science™ and all products denoted with ™ and® are trademarks or registered trademarks of DuPont or its affi liates. Herculex® insect protection technology by Dow AgroSciences and Pioneer Hi-Bred.®Herculex is a registered trademark of Dow AgroSciences LLC. Produced with DuPont Imaging Technologies proofi ng products. Printed on Sappi Aero Gloss using DuPont™ RPS Vantage Titanium Dioxide. |
Appendix
E. I. du Pont de Nemours and Company
Reconciliation of Non-GAAP Measures
(Dollars in million, except per share amounts)
Management believes that measures of income excluding significant items (“non-GAAP” information) are meaningful to investors because they provide insight with respect to ongoing operating results of the company. Such measurements are not recognized in accordance with generally accepted accounting principles (GAAP) and should not be viewed as an alternative to GAAP measures of performance.
Reconciliations of Segment Pre-Tax Operating Income (PTOI) as a Percent of Segment Sales
| | | | | | | | | | | | | | | | | | | | | |
| | | Twelve Months Ended December 31, | |
| | | 2007 | | | 2006 | | | 2005 | | | 2004(1) | | | 2003(1) | |
| Segment PTOI | | $ | 4,878 | | | $ | 4,283 | | | $ | 4,139 | | | $ | 2,735 | | | $ | 1,263 | |
Significant Items charge (2) | | | 225 | | | | 230 | | | | 56 | | | | 1,470 | | | | 1,875 | |
| | | | | | | | | | | | | | | | |
| Segment PTOI — excluding significant items | | $ | 5,103 | | | $ | 4,513 | | | $ | 4,195 | | | $ | 4,205 | | | $ | 3,138 | |
| | | | | | | | | | | | | | | | |
| | | | | | | | | | | | | | | | | | | | | |
| Total segment sales | | $ | 29,697 | | | $ | 27,726 | | | $ | 26,933 | | | $ | 27,893 | | | $ | 27,936 | |
| | | | | | | | | | | | | | | | |
| | | | | | | | | | | | | | | | | | | | | |
| Segment PTOI as a percent of segment sales — excluding significant items | | | 17 | % | | | 16 | % | | | 16 | % | | | 15 | % | | | 11 | % |
| | |
| (1) | | Includes Textiles & Interiors, which was divested in 2004. |
| |
| (2) | | Details of significant items are provided in the company’s quarterly earnings news releases which are located at www.dupont.com under the heading Investor Center, or as furnished in the company’s SEC filings on Form 8-K which are available at www.sec.gov. |
Reconciliations of Earnings Per Share (EPS)
| | | | | | | | | | | | | | | | | | | | | |
| | | Twelve Months Ended December 31, | |
| | | 2007 | | | 2006 | | | 2005 | | | 2004(1) | | | 2003(1) | |
| Earnings Per Share (EPS), excluding significant items | | $ | 3.28 | | | $ | 2.88 | | | $ | 2.34 | | | $ | 2.38 | | | $ | 1.66 | |
| | | | | | | | | | | | | | | | | | | | | |
Significant Items — (charge)/benefits (2) | | | (0.06 | ) | | | 0.50 | | | | (0.27 | ) | | | (0.61 | ) | | | (0.67 | ) |
| | | | | | | | | | | | | | | | |
| EPS before cumulative effect of changes in accounting principles | | | 3.22 | | | | 3.38 | | | | 2.07 | | | | 1.77 | | | | 0.99 | |
| Cumulative effect of changes in accounting principles | | | — | | | | — | | | | — | | | | — | | | | (0.03 | ) |
| | | | | | | | | | | | | | | | |
| Reported EPS | | $ | 3.22 | | | $ | 3.38 | | | $ | 2.07 | | | $ | 1.77 | | | $ | 0.96 | |
| | | | | | | | | | | | | | | | |
| | |
| (1) | | Includes Textiles & Interiors, which was divested in 2004. |
| |
| (2) | | Details of significant items are provided in the company’s quarterly earnings news releases which are located at www.dupont.com under the heading Investor Center, or as furnished in the company’s SEC filings on Form 8-K which are available at www.sec.gov. |
Appendix
E. I. du Pont de Nemours and Company
Reconciliation of Non-GAAP Measures
(Dollars in million, except per share amounts)
Reconciliations of Return on Average Invested Capital (ROIC)(1)
| | | | | | | | | | | | | | | | | | | | | |
| | | Twelve Months Ended December 31, | |
| | | 2007 | | | 2006 | | | 2005 | | | 2004(2) | | | 2003(2) | |
| Net Income | | $ | 2,988 | | | $ | 3,148 | | | $ | 2,056 | | | $ | 1,780 | | | $ | 973 | |
| | | | | | | | | | | | | | | | | | | | | |
| Adjustments for ROIC: | | | | | | | | | | | | | | | | | | | | |
Significant items — charge/(benefits)(3) | | | 55 | | | | (443 | ) | | | 276 | | | | 631 | | | | 650 | |
| Cumulative effect of a change in accounting principle — net of income taxes | | | — | | | | — | | | | — | | | | — | | | | 29 | |
| Minority interests in earnings/(losses) of consolidated subsidiaries | | | 7 | | | | (15 | ) | | | 37 | | | | (9 | ) | | | 71 | |
| Interests expense — after tax | | | 219 | | | | 262 | | | | 280 | | | | 190 | | | | 116 | |
| | | | | | | | | | | | | | | | |
| Net income — excluding significant items and after adjustments for ROIC | | $ | 3,269 | | | $ | 2,952 | | | $ | 2,649 | | | $ | 2,592 | | | $ | 1,839 | |
| | | | | | | | | | | | | | | | |
| | | | | | | | | | | | | | | | | | | | | |
| Sum average of: | | | | | | | | | | | | | | | | | | | | |
| | | | | | | | | | | | | | | | | | | | | |
| Short-term/long-term borrowings and capital lease obligations | | $ | 7,896 | | | $ | 8,397 | | | $ | 8,755 | | | $ | 9,843 | | | $ | 9,816 | |
| Minority interests | | | 441 | | | | 475 | | | | 756 | | | | 871 | | | | 1,325 | |
| Stockholders’ equity — excluding other comprehensive income | | | 11,892 | | | | 10,437 | | | | 11,872 | | | | 11,844 | | | | 11,821 | |
| | | | | | | | | | | | | | | | |
| Average invested capital, excluding other comprehensive income | | $ | 20,229 | | | $ | 19,309 | | | $ | 21,383 | | | $ | 22,558 | | | $ | 22,962 | |
| | | | | | | | | | | | | | | | |
| | | | | | | | | | | | | | | | | | | | | |
| ROIC — excluding significant items | | | 16 | % | | | 15 | % | | | 12 | % | | | 11 | % | | | 8 | % |
| | |
| (1) | | ROIC adjusted to reflect the exclusion of Other Comprehensive Income. ROIC Calculation = 12 month net income before after tax interest expense and minority interest / average invested capital. |
| |
| (2) | | Includes Textiles & Interiors, which was divested in 2004. |
| |
| (3) | | Details of significant items are provided in the company’s quarterly earnings news releases which are located at www.dupont.com under the heading Investor Center, or as furnished in the company’s SEC filings on Form 8-K which are available at www.sec.gov. |
