Second Quarter 2012 Earnings Conference Call August 9, 2012 ©2012 Oldemark LLC 1 Exhibit 99.1 |
JOHN BARKER CHIEF COMMUNICATIONS OFFICER 2 |
The Wendy’s Company Today’s Agenda The Wendy’s Company Opening Comments Emil Brolick Financial Update Steve Hare CEO Overview Emil Brolick Q&A 3 |
The Wendy’s Company Forward-Looking Statements and Non-GAAP Financial Measures 4 The Wendy’s Company This presentation, and certain information that management may discuss in connection with this presentation, contains certain statements that are not historical facts, including information concerning possible or assumed future results of our operations. Those statements constitute “forward-looking statements” within the meaning of the Private Securities Litigation Reform Act of 1995 (The “Reform Act”). For all forward-looking statements, we claim the protection of the safe harbor for forward-looking statements contained in the Reform Act. Many important factors could affect our future results and could cause those results to differ materially from those expressed in or implied by our forward-looking statements. Such factors, all of which are difficult or impossible to predict accurately, and many of which are beyond our control, include but are not limited to those identified under the caption “Forward-Looking Statements” in our news release issued on August 9, 2012 and in the “Special Note Regarding Forward-Looking Statements and Projections” and “Risk Factors” sections of our most recent Form 10-K / Form 10-Qs. In addition, this presentation and certain information management may discuss in connection with this presentation reference non-GAAP financial measures, such as adjusted earnings before interest, taxes, depreciation and amortization, or adjusted EBITDA, and adjusted earnings per share. Adjusted EBITDA and adjusted earnings per share exclude certain expenses, net of certain benefits. Reconciliations of non-GAAP financial measures to the most directly comparable GAAP financial measures are provided in the Appendix to this presentation, and are included in our news release issued on August 9, 2012 and posted on www.aboutwendys.com. |
EMIL BROLICK PRESIDENT & CHIEF EXECUTIVE OFFICER 5 |
The Wendy’s Company Quality is our recipe. The Wendy’s Company 6 |
Q2 2012 Highlights Fifth consecutive quarter of positive systemwide SSS … +3.2%* Company restaurant margin improved 20 bps to 14.1% Reaffirming 2012 Adjusted EBITDA outlook of $320 to $335 million Image Activation restaurants continue to generate strong sales; expansion accelerating * North America restaurants 7 |
The Wendy’s Company System Optimization Financial Management Restaurant Utilization & Daypart Expansion Global Growth New Restaurant Development Image / Experience Activation North America Same-Store Sales Growth 8 |
The Wendy’s Company RECIPE TO WIN PEOPLE PEOPLE 5-Star Athletes 5-Star Athletes PRICE PRICE New QSR Quality at QSR Price New QSR Quality at QSR Price PRODUCT PRODUCT Play a different game. Superior Play a different game. Superior perceived quality, competitive price. perceived quality, competitive price. PROMOTION PROMOTION Strategically driven, tactically brilliant Strategically driven, tactically brilliant PLACE PLACE The complete brand experience The complete brand experience PERFORMANCE PERFORMANCE Reliable & predictable every time Reliable & predictable every time The Wendy’s Company 9 |
STEVE HARE CHIEF FINANCIAL OFFICER 10 |
Q2 2012 Financial Highlights North America Same-Store Sales Company-Operated +3.2% Franchise +3.2% Systemwide +3.2% Company Restaurant Margin Q2 2012 14.1% Q2 2011 13.9% +20 bps Key Negative Margin Variances Restaurant Labor (115) bps Commodities 11 April May June (70) bps |
The Wendy’s Company Investing in Restaurant Labor to Build the Brand 12 |
The Wendy’s Company Beef: Expect Moderating Costs in Q3 and Q4 Short-Term Impact Demand: ground beef retail demand remains sluggish – impact of “pink slime” on demand Drought: Midwest drought will send cattle to market sooner than normal: helps short-term pricing Expect Q3 and Q4 beef costs to be lower than originally anticipated, but higher than 2011 Long-Term Impact Drought: long-term supply reduced by herd liquidation Herd-size: USDA reports U.S. beef cow herd at all-time low. Herd re-building unlikely until 2016-17 Expect 2013 beef costs to be higher than 2012 Source: Wendy’s Quality Supply Chain Co-op 13 |
Wendy’s Commodities as a % of Total Food and Paper Cost Potential Savings Opportunities Identified to Offset Commodity Increases Potential food and paper cost savings identified; working with suppliers and supply chain Co-Op (Wendy’s QSCC) 14 19% 18% 63% Beef Chicken Other |
Strategic Pricing Model Expected to Benefit Restaurant Margin 15 Pricing Transactions |
Q2 2012 Financial Summary ($ in Millions) Q2 2012 Q2 2011 Better/ (Worse) Sales 566.1 $ 544.2 $ 21.9 $ Franchise revenues 79.8 78.2 1.6 Total revenues 645.9 $ 622.5 $ 23.4 $ Adjusted EBITDA from continuing operations* 89.1 $ 89.4 $ (0.3) $ 16 *See reconciliation of Adjusted EBITDA from continuing operations, adjusted income from continuing operations and adjusted earnings per share from continuing operations in the appendix. |
Income from Continuing Operations and Special Items 17 ($ in Thousands, except per share amounts) After tax Per share After tax Per share Adjusted income and adjusted earnings per share from continuing operations 19,221 $ 0.05 $ 19,016 $ 0.05 $ (Less) plus: Loss on early extinguishment of debt (15,621) (0.04) - - Impairment of long-lived assets (2,018) (0.01) (224) (0.00) Costs associated with closed restaurants in other operating expense, net (a) (911) (0.00) - - Facilities relocation and other transition costs (5,817) (0.01) - - Arby's indirect corporate overhead in general and administrative (G&A) - - (4,243) (0.01) Transaction related costs (347) (0.00) (3,175) (0.01) Total adjustments (24,714) (0.06) (7,642) (0.02) (Loss) income from continuing operations and earnings per share (5,493) $ (0.01) $ 11,374 $ 0.03 $ 2012 2011 Second Quarter (a) See reconciliation of Adjusted EBITDA from continuing operations, adjusted income from continuing operations and adjusted earnings per share from continuing operations in the Appendix. |
Cash Flow 2012 YTD ($ in Millions) 2012 Net income 9.2 $ Adjustments 59.3 Net cash flow from operations 68.5 Capital expenditures (84.1) Restaurant acquisitions (21.8) Proceeds from sale of investment 24.4 Other investing activities (0.6) Net cash decrease after investing activities (13.6) Proceeds from long-term debt 619.4 Repayments of long-term debt (602.8) Premium payment on Senior Notes redemption (10.1) Deferred financing costs (15.6) Dividends paid (15.6) Other financing / investing activities (1.8) Net decrease in cash after financing activities (40.1) Beginning cash balance 475.2 Ending cash balance 435.1 $ 18 |
Restaurant Portfolio Update Conducted review of Company-operated restaurant portfolio, resulting in closure of 15 underperforming restaurants Company acquired 30 franchised restaurants in the Austin, Texas market 19 Key strategic actions in Q2 Q2 2012 Company Operated Franchise Operated Total System Open at beginning of Q2 1,414 5,167 6,581 Opened - 13 13 Closed (19) (28) (47) Acquisitions within the system 30 - 30 Dispositions within the system - (30) (30) Open at end of Q2 1,425 5,122 6,547 |
Q2 2012 Consolidated Debt ($ in Millions) Senior Debt 1,361.8 $ Capital Leases and Other Debt 32.5 Total Debt 1,394.3 Less: Cash and Cash Equivalents 435.1 Net Debt 959.2 $ TTM Adjusted EBITDA* 320.9 $ Total Debt / TTM Adjusted EBITDA* 4.3x Net Debt / TTM Adjusted EBITDA* 3.0x July 1, 2012 20 *See reconciliation of Adjusted EBITDA from continuing operations in the appendix of this presentation. |
Refinancing to Generate Ongoing Interest Savings New bank debt borrowing rate of 4.75% today Redeemed $565 million of Wendy’s Restaurants, LLC 10% Senior Notes due 2016 Annual interest savings of approximately $25 million Improves covenant flexibility, extends maturity and increases liquidity 21 Wendy’s International, Inc. raised $1.125 billion of new secured term loans and established $200 million of a new revolving credit facility |
Reaffirming 2012 and Long-Term Outlook 2012 Long-Term, beginning 2013 22 2012 Adjusted EBITDA from continuing operations in a range of $320 to $335 million Average annual Adjusted EBITDA growth rate in high-single-digit to low-double-digit range |
EMIL BROLICK PRESIDENT & CHIEF EXECUTIVE OFFICER 23 |
Confident in Our Strategies “A Cut Above” brand positioning Growth platforms to build sales and profits Wendy’s Recipe to Win 24 |
25 The Wendy’s Company System Optimization System Optimization Financial Management Financial Management Restaurant Utilization & Daypart Expansion Global Growth Global Growth New Restaurant Development Image / Experience Activation Image / Experience Activation North America Same-Store Sales Growth North America Same-Store Sales Growth |
Continuing to generate strong sales growth The Wendy’s Company 26 10 Reimages Operations ratings higher than system average |
The Wendy’s Company 27 Philadelphia, PA Philadelphia, PA July 30 July 30 |
Orem, UT Orem, UT July 16 July 16 The Wendy’s Company 28 On track for 50 Company Reimages and 17 New Image Activation Restaurants |
The Wendy’s Company 29 First Franchise Image Activation Restaurant Hershey, PA July 5 |
2013: Tiered Design Strategy to Optimize Returns The Wendy’s Company Targeted Investment* $650 to $700K $500K $300K Sales Lift +25% +15% +5% *Estimates based on Company’s current outlook; excludes maintenance cap ex and other costs 30 TIER I TIER II TIER III |
The Wendy’s Company 31 Company 100 Reimages 20 New Restaurants Majority Tier I ($650 to $700K) Franchise Expect 100 Reimages Majority Tier I Introduce Tier II and Tier III Designs Estimates based on Company’s current outlook |
The Wendy’s Company 32 Image Activation Expansion Estimates based on Company’s current outlook Cumulative Image Activation Cap Ex: $440 to 500M (2013 to 2015) Cumulative Image Activation Cap Ex: $440 to 500M (2013 to 2015) |
The Wendy’s Company System Optimization Financial Management Restaurant Utilization & Daypart Expansion Global Growth New Restaurant Development Image / Experience Activation North America Same-Store Sales Growth 33 |
The Wendy’s Company 2012 New Restaurant Development Company North America Company North America Franchised North America Franchised North America International International At least 20 new restaurants 50 reimages (Image Activation) 40 new restaurants 50 franchised and JV restaurants 34 The Wendy’s Company |
The Wendy’s Company System Optimization Financial Management Restaurant Utilization & Daypart Expansion Global Growth New Restaurant Development Image / Experience Activation North America Same-Store Sales Growth 35 |
The Wendy’s Company 36 System Optimization to Yield Multiple Benefits; Strengthen Overall System Strong Franchise Base Long-Term System Needs Optimal System In-market concentration Restaurant performance Optimal franchise mix to maximize value High-quality operators Strong, more concentrated franchise platforms Ability to image activate Existing Company- Owned Footprint The Wendy’s Company |
The Wendy’s Company System Optimization Financial Management Restaurant Utilization & Daypart Expansion Global Growth New Restaurant Development Image / Experience Activation North America Same-Store Sales Growth 37 |
The Wendy’s Company A reliable and predictable experience every time! 38 The Wendy’s Company |
The Wendy’s Company TM 39 The Wendy’s Company |
My Wendy’s: A Culture of Service 40 Months implemented North America Company-operated restaurants The Wendy’s Company 18+ 12-17 7-11 4-6 1-3 Not Implemented 70% 69% 64% 58% 48% 49% Pays off in Customer Loyalty Complaints, Problems and Revisit Intent Scores |
41 North America Company-operated restaurants Customer Service Scores Improving in 2012 The Wendy’s Company |
Heightened Restaurant-Level Execution Drives Sales 42 Every additional 10 points of CPR correlates to $46,000 in additional sales. Complaint, Problem and Revisit Intent Score Improvement Correlates to Sales Growth North America Company-operated restaurants The Wendy’s Company |
Play a Different Game HIGH PERCEIVED QUALITY … CORE DESTINATION … ONLY AT WENDY’S LTO … SPECIAL TASTE 43 |
44 |
The Wendy’s Company CREATIVE MESSAGE MEDIA 45 |
Building Equity and Relevance with a Two-Tiered Advertising Campaign Brand Offering Brand Promise Family values Quality / Fresh Better choices New products 46 The Wendy’s Company |
Encouraging Consumer Response to Advertising Campaign Overall Best QSR 154 Fresh Ingredients 168 High Quality 164 80 to 120 average range 80 to 120 average range 80 to 120 average range 120 124 112 Source: Ameritest 47 |
Mobile App is Increasing Consumer Engagement 48 My Wendy’s App 26,000 users since July 16 launch Time spent on app 3x longer than website |
Wendy’s Recognized for Progress in Digital 49 Ranked #2 in QSR Social Media by Nation’s Restaurant News – July 10, 2012 More than 100,000 twitter followers |
Wendy’s Share is Underdeveloped in Hispanic Market 50 Non-Hispanic Hispanic Hamburger Hamburger Category Category Source: NPD Group / CREST Hispanic Study, 2011 = 21% = 13% Of Traffic Of Traffic |
The Wendy’s Company System Optimization Financial Management Restaurant Utilization & Daypart Expansion Global Growth New Restaurant Development Image / Experience Activation North America Same-Store Sales Growth 51 |
LATE NIGHT MARKETING SUPPORT 52 |
LATE NIGHT BUSINESS IS GROWING Data based on Late Night launch 5/28/12 through 8/5/12 compared to same weeks in 2011 +7% NATIONALLY 53 53 |
54 Refining A.M. Access Wendy’s remains committed to a long-term solution |
Redhead Roasters™ Campaign Launched in NYC Redhead Roasters launched in 185 NYC restaurants during July Marketing support across non-traditional channels: 55 |
The Wendy’s Company RECIPE TO WIN PEOPLE PEOPLE 5-Star Athletes 5-Star Athletes PRICE PRICE New QSR Quality at QSR Price New QSR Quality at QSR Price PRODUCT PRODUCT Play a different game. Superior Play a different game. Superior perceived quality, competitive price. perceived quality, competitive price. PROMOTION PROMOTION Strategically driven, tactically brilliant Strategically driven, tactically brilliant PLACE PLACE The complete brand experience The complete brand experience PERFORMANCE PERFORMANCE Reliable & predictable every time Reliable & predictable every time The Wendy’s Company 56 |
JOHN BARKER CHIEF COMMUNICATIONS OFFICER 57 |
Q&A |
The Wendy’s Company ©2012 Oldemark LLC A CUT ABOVE A CUT ABOVE 59 |
Appendix 60 |
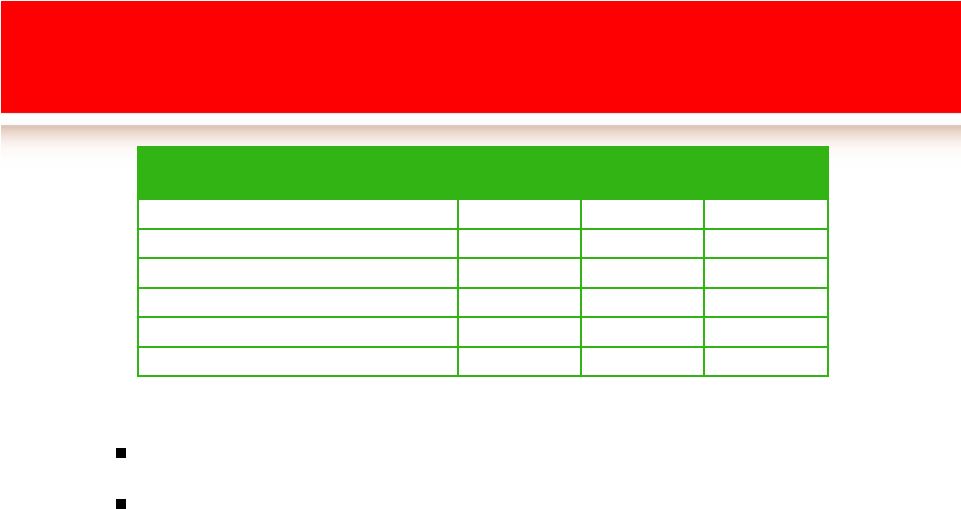
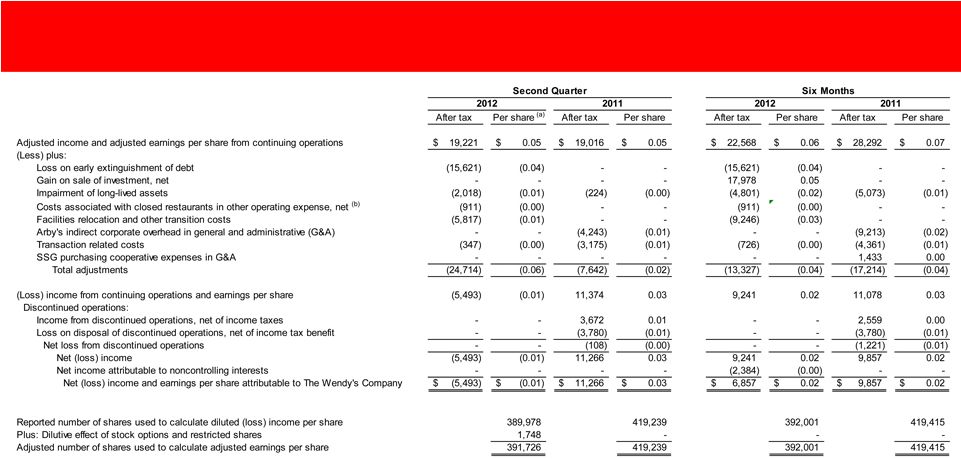
(In Thousands) (Unaudited) 2012 2011 2012 2011 Adjusted EBITDA from continuing operations 89,073 $ 89,415 $ 152,954 $ 163,140 $ (Less) plus: Depreciation and amortization (35,947) (29,842) (68,258) (60,156) Impairment of long-lived assets (3,270) (365) (7,781) (8,262) (1,477) - (1,477) - Facilities relocation and other transition costs (9,426) - (14,957) - Transaction related costs (562) (5,039) (1,174) (6,923) - (6,735) - (14,623) SSG purchasing cooperative expense reversal in G&A - - - 2,275 Operating profit 38,391 47,434 59,307 75,451 Interest expense (28,002) (28,089) (56,237) (57,531) Loss on early extinguishment of debt (25,195) - (25,195) - Gain on sale of investment, net - - 27,407 - Other income, net 640 337 2,164 590 (14,166) 19,682 7,446 18,510 Benefit from (provision for) income taxes 8,673 (8,308) 1,795 (7,432) (Loss) income from continuing operations (5,493) 11,374 9,241 11,078 Discontinued operations: Income from discontinued operations, net of income taxes - 3,672 - 2,559 Loss on disposal of discontinued operations, net of income tax benefit - (3,780) - (3,780) Net loss from discontinued operations - (108) - (1,221) Net (loss) income (5,493) 11,266 9,241 9,857 Net income attributable to noncontrolling interests - - (2,384) - (5,493) $ 11,266 $ 6,857 $ 9,857 $ Net (loss) income attributable to The Wendy's Company Arby's indirect corporate overhead in general and administrative (G&A) Costs associated with closed restaurants in other operating expense, net (a) (Loss) income from continuing operations before income taxes and noncontrolling interests Second Quarter Six Months Reconciliation of Adjusted EBITDA from Continuing Operations to Net (Loss) Income Attributable to The Wendy’s Company (a) Excludes non-cash items included in impairment of long-lived assets 61 |
Reconciliation of Adjusted Income and Adjusted Earnings per Share from Continuing Operations to Net (Loss) Income and Earnings per Share Attributable to The Wendy’s Company 62 (a) (b) Adjusted earnings per share amounts, for the second quarter of 2012, include the dilutive effect of stock options and restricted shares, which were excluded from the reported number of shares used to calculate basic and diluted loss per share, as the impact would have been anti-dilutive. Included in the appendix is a reconciliation of the number of shares used to calculate adjusted earnings per share amounts. Excludes non-cash items included in impairment of long-lived assets |