 © 2013 Oldemark LLC Investor Day 2015 February 3, 2015 Exhibit 99.2 |
 © 2013 Oldemark LLC 2 David Poplar Vice President Investor Relations |
 This presentation, and certain information that management may discuss in connection with this presentation, contains certain statements that are not historical facts, including information concerning possible or assumed future results of our operations. Those statements constitute “forward-looking statements” within the meaning of the Private Securities Litigation Reform Act of 1995 (The “Reform Act”). For all forward-looking statements, we claim the protection of the safe harbor for forward-looking statements contained in the Reform Act. Many important factors could affect our future results and could cause those results to differ materially from those expressed in or implied by our forward-looking statements. Such factors, all of which are difficult or impossible to predict accurately, and many of which are beyond our control, include but are not limited to those identified under the caption “Forward-Looking Statements” in our news release issued on February 3, 2015 and in the “Special Note Regarding Forward-Looking Statements and Projections” and “Risk Factors” sections of our most recent Form 10-K / Form 10-Qs. In addition, this presentation and certain information management may discuss in connection with this presentation reference non-GAAP financial measures, such as adjusted earnings before interest, taxes, depreciation and amortization, or adjusted EBITDA, and adjusted earnings per share. Adjusted EBITDA and adjusted earnings per share exclude certain expenses, net of certain benefits. Reconciliations of non-GAAP financial measures to the most directly comparable GAAP financial measures are provided in the Appendix to this presentation, and are included in our news release issued on February 3, 2015 and posted on www.aboutwendys.com. 3 Forward-Looking Statements and Non-GAAP Financial Measures |
 February 3 Investor Day Agenda Time Topic Speaker 8:35 a.m. CEO Overview Emil Brolick 9:00 a.m. 2014 Results, 2015 Guidance and Long-Term Outlook Todd Penegor 9:40 a.m. Growth Acceleration Through Development Abigail Pringle 10:00 a.m. Break 10:15 a.m. Restaurant Experience Bob Wright 10:40 a.m. Technology Brandon Rhoten 11:00 a.m. Product Demonstration Lori Estrada 11:15 a.m. Lunch Noon Marketing Emil Brolick 12:30 p.m. International Darrell van Ligten 12:55 p.m. CEO Summary Emil Brolick 1:00 p.m. Q&A 1:30 p.m. Departure |
 © 2013 Oldemark LLC 2015 Investor Relations Calendar |
 2015 Investor Relations Calendar: First Half (Tentative) March 2: San Diego and Los Angeles (Wedbush) March 3: San Francisco (Key) March 4: Denver and Chicago (Stephens) March 5: Boston (RBC) March 6: New York (Citi) March 19: Wells Fargo conference (Chicago) March 25: Telsey conference (New York) May 20: Morgan Stanley conference (Boston) June 22: Stifel conference (Baltusrol, NJ) June 23: New York (Stifel) |
 © 2013 Oldemark LLC A GROWTH STORY THE WENDY’S BRAND THE WENDY’S COMPANY EMIL BROLICK PRESIDENT AND CEO |
 2014 SIGNIFICANT STRATEGIC PROGRESS, SOLID SALES, CHALLENGING COST FACTORS 8 |
 9 Strategic Decision Continuity 2012 • Created Clear Vision - Cut above Brand Position - Recipe to Win - Growth Pyramid • Contemporize Brand - New Logo - New Packaging - New Ad Campaign • IA Accelerates - Incentive - Franchise • Discontinue Breakfast 2013 • System Optimization #1 418 Restaurants • Franchise System Strengthened • IA: Broaden Franchise Engagement • Common POS decision Aloha • RPRS Launch 2014 • System Optimization #2 131 Canadian Restaurants • Mobile Pay Roll Out, Mobile Order, Loyalty Test • 60% Image Activation Requirement by 2020 • Refresh Option ~ $250K • International Strategy Consulting Engagement 2015 • System Optimization #3 • Market Planning, Joint Capital Planning, Produce Strong IA, New Restaurant Pipeline • Mobile Order and Loyalty to Expand • Tech Lab to Open Q1 • Recapitalization, Substantial Cash Returned to Shareholders Wendy’s Brand Transformation Journey 2012 -2014 & Beyond |
 2012 2013 2014 2015 SRS - C 1.6% 1.9% 2.3% ~ 3.0% -2 YR 3.6% 3.5% 4.2% 5.3% IA – (Includes New) 64 234 486 530 - CUM 74 308 794 1,324 NA NEW 61 61 72 80 10 Wendy’s Brand Transformation Journey 2012 -2014 & Beyond Enhance Growth |
 11 Wendy’s Brand Transformation Journey 2012 -2014 & Beyond Enhance Economics 2012 2013 2014 2015 Adjusted EBITDA* $333.3 $367.1 $392.7 $390-$400 % 0.7% 10.1% 7.0% 5%-8%* Adjusted EPS* $0.17 $0.30 $0.34 $0.33-$0.35 % 13% 76% 13% 10%-17%* NA Restaurant Margin 14.0% 15.4% 15.8% 16.4% -16.8% *See reconciliation of non-GAAP measures in appendix. Comparison of 2015 to 2014 Adjusted EBITDA and Adjusted EPS excludes gains from restaurant sales and other asset sales. |
 2012 2013 2014 2015 Quarterly DIVIDEND 0.04 0.05 0.055 .055 or > % 100% 25% 10% Flat or > SH Repo -- $69M $299M TBD 12 Wendy’s Brand Transformation Journey 2012 -2014 & Beyond Shareholder Returns |
 2020 SYSTEM GOALS $2MM 20% 30% 1.3x+ 1,000 AUVs Restaurant Margins System Restaurant Cash Flow Increase Sales to Investment Ratio New NA Restaurants 60% Total Reimaged High Expectations to Brand Wendy’s |
 TWO KEY GROWTH DRIVERS BRAND RELEVANCE ECONOMIC MODEL RELEVANCE |
 Growth Drivers Continue Economic Model Relevance 15 Investment Same Restaurant Sales / Traffic Margins Cash on Cash ROI RESTAURANT ROIC Earnings Growth Free Cash Flow TSR WENDY’S COMPANY |
 16 GROWING THE WENDY’S BRAND |
 HOW WE GROW BRAND RELEVANCE + ECONOMIC RELEVANCE = GROWTH Financial Management Global Growth Restaurant Utilization & Brand Access System Optimization New Restaurant Growth Image / Experience Activation North America Same-Restaurant Sales Growth Shareholder Value-Enhancing Initiatives Core Organic Growth Strategies |
 Food Service, Huge Market Always Growth for Relevant Brands $435 Billion 61+ Billion Visits Source: NPD Crest 2014 Restaurant Industry Sales QSR 79% Casual Dining 10% Mid Scale 10% |
 QSR Growing Share – Likely to Continue 2014 5yr Pt. Change 78.9% 9.5% 10.2% +2.2 (1.5) (0.8) Restaurant Traffic Share Change 19 Source: The NPD Group / CREST ®; Y/E November ‘14 QSR Casual Midscale |
 20 New QSR & Retail Leading QSR Growth Source: The NPD Group / CREST ; year ending November 2014 851,551 320,729 45,200 +41% +4% 0% PC5YA New QSR Retail All Other QSR Incremental Traffic (000s): YE Nov ‘14 v. ‘09 |
 New QSRs Deliver Higher Consumer Food Ratings % New QSR Consumers Rating Attribute as “Excellent” Source: The NPD Group’s National Eating Trends ® and CREST® services; year ending May 2013 Taste/Flavor 49% Fresh Food 49% Prepared My Way 48% Quality Food 47% Healthy Options 36% Kid Friendly 36% Atmosphere 35% Affordable 29% Food Variety 35% TOP ATTRIBUTES BOTTOM ATTRIBUTES |
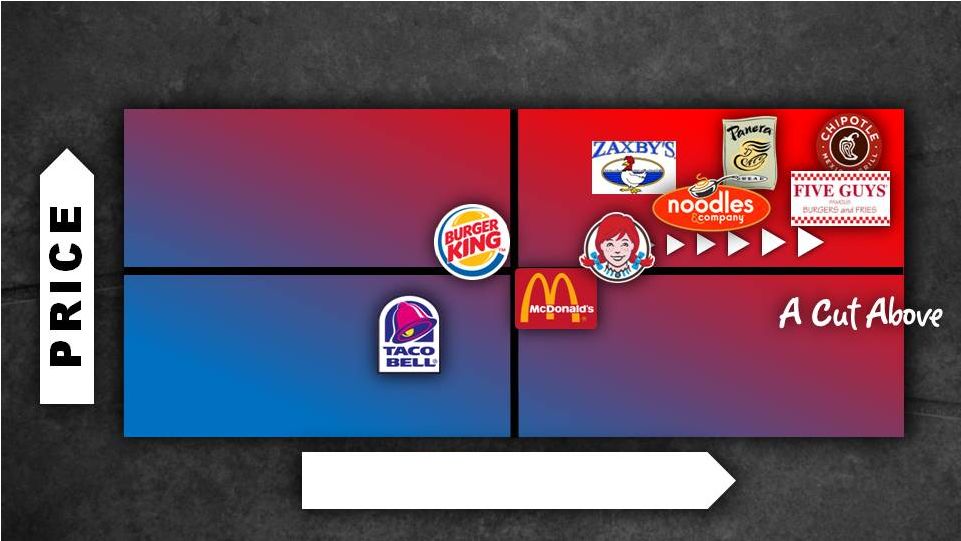 22 EXPERIENCE HIGH LOW FUNCTIONAL EMOTIONAL BRAND VISION 2016 |
 23 Wendy’s: New QSR Quality, QSR Price % Wendy’s Customer Rating Attribute as “Excellent” * * “Total Food was Fresh” was added to the CREST survey in Jan’11 24% 26% 28% 30% 32% 34% 36% 38% 2006 2007 2008 2009 2010 2011 2012 2013 2014 Fresh Food Taste/Flavor Prepared My Way Quality Food Source: The NPD Group / CREST ® ; year ending February 2014 |
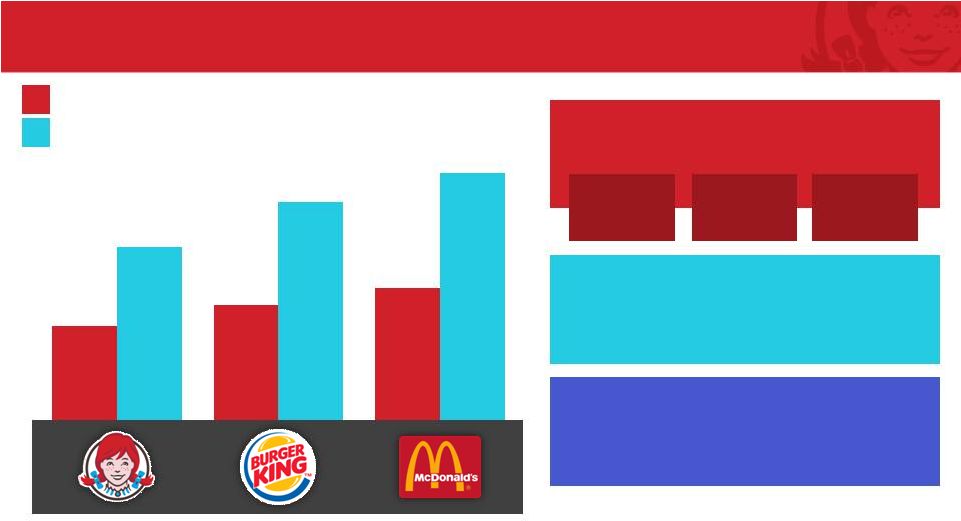
 NEW NEW QSR QSR Wendy’s: New QSR Quality, QSR Price Average Eater Check Source: The NPD Group / CREST ® ; Y/E November ‘14 $5.34 $7.84 LUNCH LUNCH NEW NEW QSR QSR $5.73 $8.08 DINNER DINNER +47% +47% +41% +41% |
 New QSR Continuing to Grow Share New QSR Share of QSR Meals Source: The NPD Group / CREST ® ; Y/E November ‘14 3.4% 2009 2009 4.8% 2014 2014 |
 TRADITIONAL QSR QSR RETAIL “C STORES” QUICK CASUAL “NEW QSR” + Grocery |
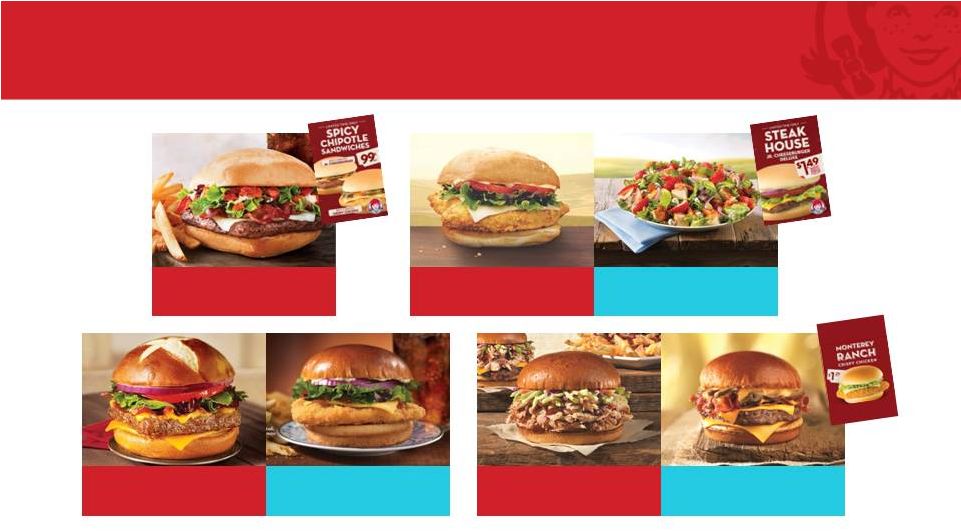
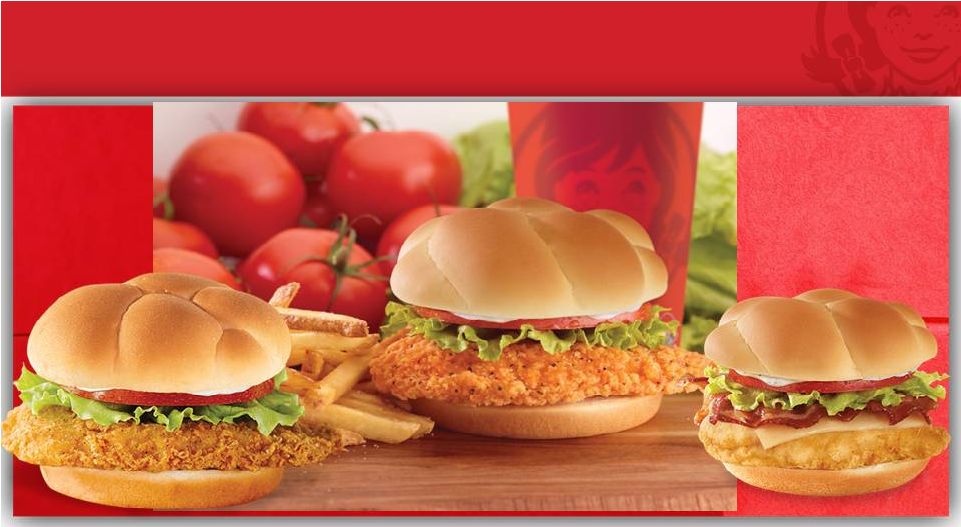 It’s about the Food… Category-Leading Chicken Sandwiches Homestyle Chicken Sandwich Spicy Chicken Sandwich Asiago Ranch Chicken Club 27 |
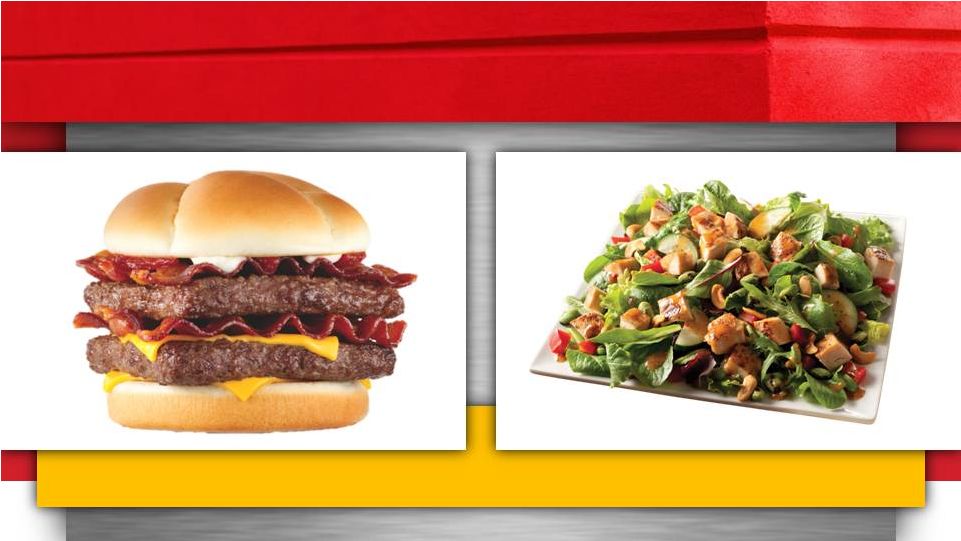
 28 It’s about the Food Dave’s Hot and Juicy Burgers BACONATOR ® Single Double Triple |
 29 It’s about the Food The Best QSR Salads in The Business Barbeque Ranch Chicken Salad Apple Pecan Chicken Salad Berry Almond Chicken Salad Asian Cashew Chicken Salad |
 30 Yes, The Food Service Business |
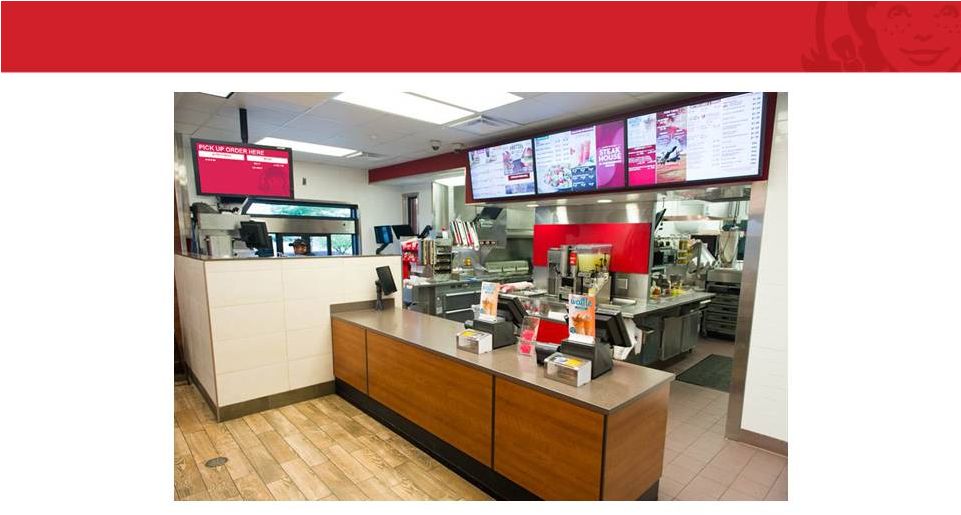
 31 The Total Experience Perfectly Packaged |
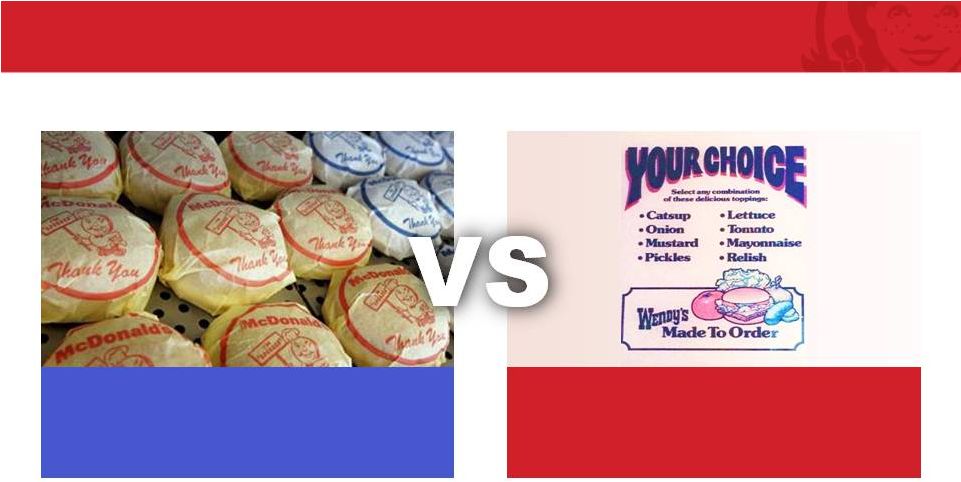
 DAVE STARTED THIS IN 1969 – NOT TESTING IT TODAY MADE TO YOUR TASTE WITH YOUR TOPPING CHOICES SERVED HOT OFF THE GRILL, NOT HELD FRESH…NEVER FROZEN NORTH AMERICAN BEEF TASTES BEST STRIVING TO BE THE BEST WE CAN BE VS. SOMETHING WE ARE NOT “CUT ABOVE” WENDY’S NATURAL BRAND POSITION 32 Brand Credentials |
 HOW WE GROW BRAND RELEVANCE + ECONOMIC RELEVANCE = GROWTH Shareholder Value-Enhancing Initiatives Core Organic Growth Strategies System Optimization Financial Management Global Growth Restaurant Utilization & Brand Access New Restaurant Growth Image / Experience Activation North America Same-Restaurant Sales Growth |
 A Facilitator of Our Brand Transformation and a Catalyst for Growth for the Wendy’s Brand 34 System Optimization Is… |
 35 Announcing System Optimization #3 Today ~ 500 5% of System 2014 G&A Initiative Created Opportunity to Right Size G&A Company Restaurants to Sell Ongoing Transition to Own Dispositions Commence in Q3 2015 with Completion by Mid - 2016 |
 36 Important Brand Stewardship Facilitator of Key Tests that Require Our Leadership Facilitate Strengthening of Franchise System Facilitate System Growth & Brand Renewal Image Activation New Restaurants Technology Enhance Consistency of Performance and Long Term Growth Demonstrate “Skin in the Game” & System Leadership |
 37 2014 2012 Difference US Franchisees Total Restaurants Avg. Ownership Per Franchisee 331 4,895 15 362 4,528 13 ( 31 ) +367 +2 Largest 20 % of System Average Size 2,282 48 114 1993 44 100 +289 +4 +14 Next 21 - 50 % of System Average Size 1,056 21 35 872 19 29 +184 +2 +6 All Other % of System Average Size 1,557 31 6 1,663 37 5 ( 106 ) ( 6 ) +1 Franchise Partners Who Want Growth! |
 38 Shareholders Win …Growth and Income Achievable Unique and Credible Brand Position Improving Restaurant and Wendy’s Company Economic Model Dividends Expected to Grow with Income Strong Leadership Team Strong Wendy’s Brand With Rich Food Heritage Exceptional Base of Growth Oriented Franchisees |
 © 2013 Oldemark LLC Todd Penegor Chief Financial Officer © 2013 Oldemark LLC |
 Financial Update 40 2014 Preliminary Results Image Activation Progress System Optimization Update System Optimization Evolution 2015 Guidance Long-Term Outlook Financial Update |
 2014 Preliminary Results 41 |
 42 Fourth Quarter Financial Highlights N.A. Company SRS 1.9% 3.1% 2-Year 5.0% N.A. Restaurant Margin 16.8% 16.3% +50 bps G&A $60.1 $77.2 $17.1 Adjusted EBITDA* $107.1 $89.0 20.3% Adjusted EPS* 10¢ 11¢ (9.1)% 2014 2013 B/(W) *See Reconciliation of Adjusted EBITDA and Adjusted EPS in the Appendix $Mils |
 $Mils 43 Full Year Financial Highlights N.A. Company SRS 2.3% 1.9% 2-Year 4.2% N.A. Restaurant Margin 15.8% 15.4% +40 bps G&A $263.3 $293.8 $30.5 Adjusted EBITDA* $392.7 $367.1 7.0% Adjusted EPS* 34¢ 30¢ 13.3% 2014 2013 B/(W) *See Reconciliation of Adjusted EBITDA and Adjusted EPS in the Appendix |
 44 Solid Two Year SRS Trend 4.3% 5.2% 5.0% 2.3% Q1 Q2 Q3 Q4 |
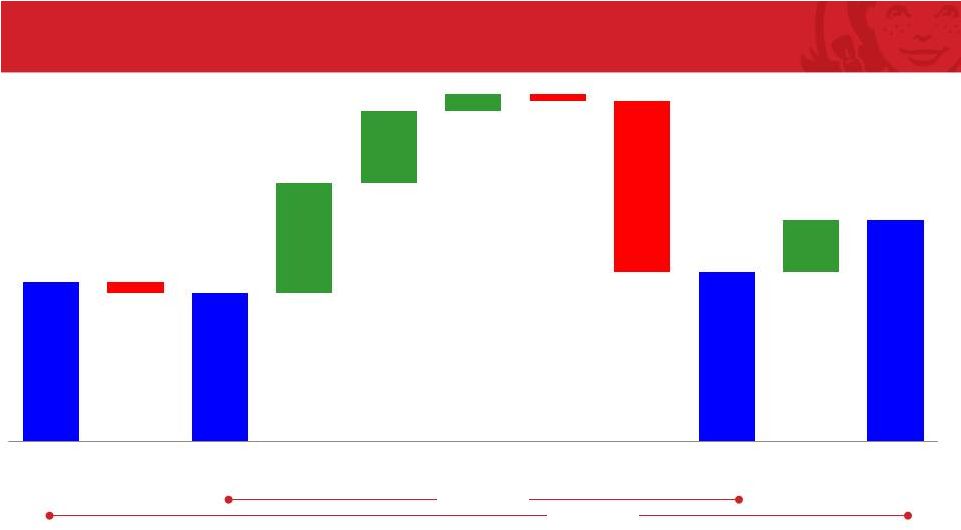 45 Improved Quality of Earnings $Mils 2.3% Growth 7.0% Growth *See reconciliation of non-GAAP measures in appendix $367* $362 $371 $393* $22 ($5) $46 $31 $7 ($3) ($72) 2013 Reported Adj. EBITDA Gains on Surplus Properties & Other Assets 2013 Adj. EBITDA Excld. Gains Net Franchise Revenue G&A Savings Core Restaurant IA Impact Sold Restaurant EBITDA (S.O. I & II) 2014 Adj. EBITDA Excld. Gains Gains on Rest. Sales & Other Assets 2014 Reported Adj. EBITDA |
 Image Activation Exceeds Expectations 46 Total System Annual Reimages & New Builds Total System Cumulative Reimages & New Builds 57% Franchise 43% Company 211 Company Reimages 216 Franchise Reimages 16 Company New 43 Franchise New 2011A 2012A 2013A 2014A 10 74 308 794 2011A 2012A 2013A 2014A 10 64 234 486 |
 47 Image Activation Financial Returns Continue to be Solid Investment $450-650K $1.5 -1.9M Construction Closure 5 weeks 13 weeks Sustainable Sales Lift 10-15% 25-35% Profit Flow Through** 40%+ 40%+ Reimages* Scrape & Rebuilds* *Estimates based on Company’s current outlook; Excludes Maintenance; Median Cost for U.S. System **Based on Company Performance |
 Facilitating Franchisee Commitments for Reimages and New Builds Market & Joint Capital Planning Multi-Year Investment Plan Construction Support Multi-Year Incentives 60% Image Activation Requirement by 2020 Turnkey Services Canadian Build-to-Suit program |
 49 Building a Stronger Wendy’s – System Optimization Status System Optimization I System Optimization II Building a Stronger System • Sold 418 restaurants west of the Mississippi • Delivered EBITDA Neutral • Completed Q1 2014 • Plan to sell all 131 restaurants • Sold 29 in 2014; Remainder to be sold by end of Q2 • EBITDA dilutive near – term; Accretive long-term with build- to-suit new development • Sold 34 restaurants • Purchased 27 restaurants • Bought & flipped 18 restaurants • Facilitated sale of 11 restaurants from one franchisee to another • Executed 30 transfers between franchisees, totaling nearly 200 restaurants U.S. System Optimization Canada System Optimization Ongoing Restaurant Optimization |
 $Mils 50 N.A. Company Restaurant Ownership Evolution Franchise 77% 81% 84% Company 23% 19% 16% Franchise Entities 475 473 407 Restaurants/Franchisee 10 11 13 N.A. Company AUV $1.484 (+2.0%) $1.514 (+2.0%) $1.593 (+5.2%) 2012 2013 2014 |
 51 $Mils Significant Progress on G&A $294 $263 ($10) $2 $5 $11 $23 2013 Actual Stock Comp Salaries Franchise Incentives Incentive Comp S.O. I Savings & 2014 G&A Initiatives 2014 Actual |
 52 Growth and Income - 2014 Invested for Growth (Cap Ex) $18M Technology $35M New Restaurants $190M Image Activation Year - End 3.0x Net Debt / TTM Adj. EBITDA $1,448M Debt $267M Cash Returned Cash to Shareholders 10% Q4 Increase $75M Dividends $299M Share Repurchases |
 2014 Recap Highlights 53 Solid Two-Year Sales Growth Improved Quality of Earnings through Ongoing System Optimization Image Activation Adoption Exceeding Expectations Continued Proactive G&A Management Returned Cash to Shareholders ($374 Million) |
 2014 Recap Challenges 54 Commodity Pressure – Primarily Beef Image Activation Closure Time Q1 Weather Price / Value Customer |
 System Optimization Evolution 55 |
 • Selective Buying and Selling of Restaurants • Targeting approximately 5% Company Ownership by mid-2016 • Focused on Building a Stronger Wendy’s • Commitment to Growth • Image Activation and New Restaurant Development Commitments • Reinvestment in Canada – Build-to-Suit Program • Improved Economic Models for Company and Franchisees • Strengthening of The Franchise System 56 System Optimization III Financial Management Global Growth Restaurant Utilization & Brand Access System Optimization New Restaurant Growth Image / Experience Activation North America Same-Restaurant Sales Growth |
 • Approximately 5% Company Restaurant Ownership • Maintain role as one of the largest operators • Dispositions Commence in Q3 2015 with Completion by Mid-2016 • Diversified Geographic Company Ownership Footprint • Facilitate growth through efficient testing and initiatives • Support ongoing system optimization to strengthen the system • Scale up in markets we retain • Buy and flip restaurants • Facilitate franchise-to-franchise transactions • Focus on Getting Restaurants in the Hands of the Best Operators with the Willingness and Ability to Grow 57 Company Footprint Destination |
 58 Ongoing System Optimization Criteria for Franchise Buyers Financial Aligned and Up-to-Date with Vision and Brand Initiatives -- Reimaging schedule, New Restaurant Development, Common POS, Relationship Agreement Demonstrated History of Growth and Reinvestment Demonstrated Operational Leadership and Commitment to People Activation Geographic Proximity to Optimize Operational Support Brand Growth Leadership Geography Well Capitalized, Access to Capital System Optimization is a facilitator of our brand transformation and is a catalyst for growth of the Wendy’s brand |
 System Optimization – Quality of Earnings Evolution 2012 23% Co. Ownership 2017 ~5% Co. Ownership Total G&A Savings of $82 Million Generating Strong Rental Income from Retained Real Estate Sites Rent & Royalties Company Restaurants Other 59 50% 50% 70% 29% 1% |
 60 2015 Guidance The Company’s 2015 and long-term outlook do not include any potential impact of the Company’s anticipated refinancing or potential shareholder return initiatives. |
 2015 Guidance N.A. Company Operated Restaurants 61 SRS Growth Restaurant Margins +40 bps 16.4-16.8% +40 bps +70 bps +60-100 bps 1.9% 2.3% ~3.0% 15.4% 15.8% 2013A 2014A 2015E 2013A 2014A 2015E |
 2015 Guidance Excludes Gains from Restaurant Sales & Other Asset Sales 62 Adjusted EBITDA Adjusted EPS +3% +2% +5-8% +10-17% $362M $371M $390-400M 33-35¢ 29¢ 30¢ 2013A 2014A 2015E 2013A 2014A 2015E |
 63 2015 Quality of Earnings Evolution $Mils *See reconciliation of non-GAAP measures in appendix 5% to 8% Growth $393* $371 $390 -$400 $0-$5 ~ $15 ~ ($55) ($22) ~ $40 $20-$25 2014 Reported Adj. EBITDA LY Gains on Rest. Sales & Other Assets 2014 Adj. EBITDA Excld. Gains Royalties & Net Rental Income Core EBITDA Growth (Incl IA & NRD) G&A Savings All Other S.O. I & Other - US Disposed Rest. EBITDA S.O. II - WROC Disposed Rest. EBITDA S.O. III - US Disposed Rest. EBITDA 2015 Adj. EBITDA |
 2015 – More Progress on G&A 64 $263 ~ $250 ($8) ($7) ($5) $2 $4 $7 $22 2014 G&A Incentive Comp Merit, 53rd wk & Other Investment Initiatives (Primarily IT & Development) S.O. III - US Savings Franchise Incentives S.O. II - WROC Savings 2014 G&A Cost Reduction Initiative 2015 G&A Target $Mils |
 2015 Guidance – P&L / Cap Ex 65 Capital Expenditures of ~$265-275M 2015 Includes a 53 rd Week Interest Expense Increase of $4-5M Reported Effective Tax Rate of 42-43% Includes ~$180M for Reimages & New Builds Includes ~$40M for Technology Initiatives Largely Offset by Affordable Healthcare Act Result of Non-Deductible Goodwill on Restaurant Sales Depreciation: ~$20M Accelerated, ~$145M Ongoing |
 66 2015 Guidance: Development Company Image Activation 20 New Restaurants 150 Reimaged Restaurants Franchise Image Activation 60 New Restaurants 300 Reimaged Restaurants ~$8-10M in Incentives Royalty Relief & Construction Support |
 67 Long-Term Outlook The Company’s 2015 and long-term outlook do not include any potential impact of the Company’s anticipated refinancing or potential shareholder return initiatives. |
 68 2020 System Goals $2MM 20% 30% 1.3x+ 1,000 AUVs Restaurant Margins System Restaurant Cash Flow Increase Sales to Investment Ratio New NA Restaurants (Gross) 60% Total Reimaged |
 Confidence in Long-Term System Goals • Restaurant Leverage • Image Activation Flow -Throughs • System Optimization • Labor Evolution • Operations Simplification /Cost Savings Initiatives • Premium LTO’s • Combo Meals & Attachment Rates 20% Restaurant Margins $2M AUV 69 • Image Activation & New Builds • Brand Initiatives • People Activation • Daypart Expansion • Throughput Improvements • Closures of Underperforming Restaurants |
 70 Image Activation Journey – N.A. Cumulative 2014 2017 2020 Reimages 685 >1,800 >3,000 New Builds 109 465 1,109 Total 794 >2,265 >4,109 Percentage of System IA (Net of Closures) 12% >35% >60% |
 71 Long-Term Guidance SRS ~3% Company 2.25-3% System 2.25-3% System 2.25-3% System Adj. EBITDA 5-8% Flat Low-Single Digit High-Single Digit Adj. EBITDA Margin 20-22% 28-30% 32-34% ~35% Adj. EPS 10-17% High-Single Digit High-Single Digit Mid-to-High Teens 2015 2016 2017 2018 High-Single Digit “Organic” Growth Upon completion of its refinancing, the Company plans to update its forecast and expects its long-term earnings per share growth to improve to approximately 20%. |
 72 Continue to ensure Company, system and shareholders are getting an attractive return on investment G & A: Long Term Perspective $Mils $294 $263 ~$250 ~$230 2013 2014 2015 ~5% Ownership |
 73 Capital Spending - Long Term Perspective* $Mils *Excludes redeployment of proceeds from SO outside of current business $198 $224 $298 $265-275 $135-145 $80-90 ~$75 2012 2013 2014 2015 2016 2017 2018 |
 74 Strong Free Cash Flow Post-System Op III $Mils Free Cash Flow = Cash From Operations Less Capital Expenditures (Prior to any potential reinvestment) $625-700M Available Free Cash Flow $400-475M Pre-Tax Cash Proceeds from Rest. Sales $125-$150 $275-$325 $250-$275 ~$75 $100-$125 $200-$225 2015 2016 2017 2018 2015 2016 2017 |
 Income and Growth Focus 75 Utilize “Excess” Cash to Repurchase Shares 1 Dividend Growth in Line with Earnings 2 Invest in the Business 4 Leveraging Our Balance Sheet Improved Free Cash Flow Return Cash to Shareholders 3 5 Improvement in ROIC Over Time |
 76 76 Opportunities to Consistently Return Cash to Shareholders Share Repurchases Utilize “Excess” Cash to Repurchase Shares History of Share Repurchases $69M $299M 2013 Opportunity to Leverage Available Cash for Highest Total Shareholder Return Dividends Continue to Grow in Line with Earnings History of Predictable Dividends Increases +10% 2014 +25% 2013 +100% 2012 2014 |
 77 Utilizing Balance Sheet to Return Cash to Shareholders Recapitalization to Target Five to Six Times Net Debt to 2014 Adjusted EBITDA Capital Structure Consistent with Strong Free Cash Flow Post System Optimization Intend to Return Substantial Cash to Shareholders |
 Image Activation New Development Build-to-Suit Program Incentives Buying Restaurants to Strengthen the System (Operate or Buy / Flip) International Acceleration or Expansion Other Accretive Growth Opportunities Opportunities to Invest for Accelerated Growth 78 Invest in our Business |
 Transformation of Wendy’s Company Economic Model 79 Generates Higher EBITDA Margins Enhances Quality of Earnings Less Capital Intensive Leveraging Our Balance Sheet Supports Long-Term Income and Growth Commitment System Optimization Provides a Stronger Platform to Return Cash to Shareholders More Predictable and Sustainable Earnings Growth |
 Building a Stronger Wendy’s 80 Continue to Execute Against our Strategic Growth Priorities Improving the Company & Franchisees Economic Models Growth Pyramid “A Cut Above” Brand Positioning Recipe to Win Strengthening the Franchise System through Concentrated Ownership Transforming the System by Facilitating Growth through Image Activation & New Restaurant Development Enhancing Our Quality of Earnings & EBITDA Margins Creating Flexibility for Sustainable, Predictable Long-Term Income & Growth Adjusting our Capital Structure & Accelerating Long-Term EPS Growth |
 Growth Acceleration Through Development Abigail E. Pringle Chief Development Officer © 2013 Oldemark LLC |
 Profitable, sustainable, restaurant growth |
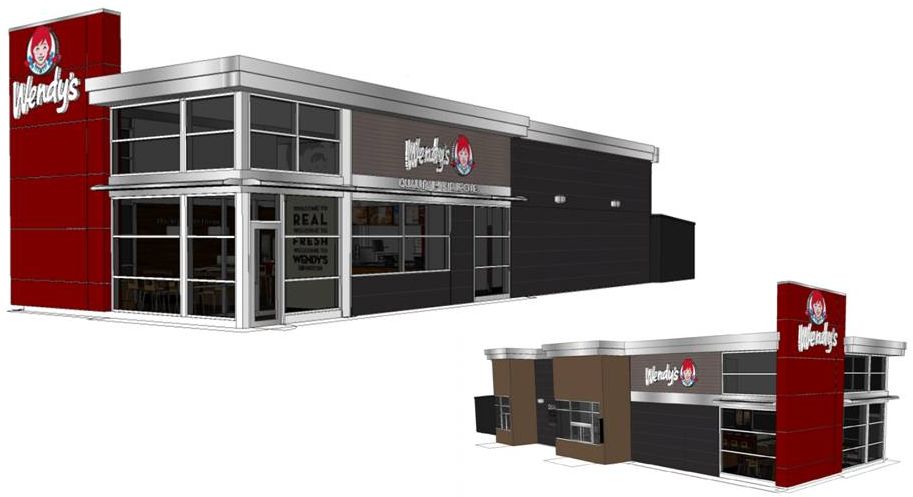
 IMPROVE CORE BRAND HEALTH 60% of system reimaged by 2020 Partner to Improve Health of Portfolio UNIQUE RESTAURANT EXPERIENCE RELEVANT BRAND CHANGE AS THEY CHANGE |
 DRIVE NEW RESTAURANT GROWTH Grow 1,000 new restaurants by 2020 Net Positive Growth by 2016 |
 ECONOMIC MODEL RELEVANCE BRAND RELEVANCE KEY GROWTH DRIVERS |
 86 Total System Annual Reimages & New Builds Total System Cumulative Reimages & New Builds 57% 43% 211 Company Reimages 216 16 Company New 43 Franchise New Franchise Reimages Franchise Company 10 64 234 486 2011A 2012A 2013A 2014A 10 74 308 794 2011A 2012A 2013A 2014A Image Activation Exceeds Expectations |
 36% of Franchisees in 2 Years US and Canada Long Term & New to the Brand Smallest to Largest FRANCHISE EARLY ADOPTERS Testament to Commitment |
 88 “It shows they care about the restaurants, they care about the food… and that means they CARE ABOUT ME, THE CUSTOMER.” |
 Image Activation vs. Existing Wendy’s Source: Image Activation Buyer Reaction Studies, UM Standard Design 27pts 40pts Attractive Modern/Up-to-Date 2014 IA Standard IA ELEVATES CUSTOMER EXPERIENCE |
 A New QSR Experience 91 |
 Scrape & Rebuilds Standard Remodels System IA Sales Lift, 2014 Class CUSTOMERS VOTING WITH THEIR WALLETS 30+% ~10% |
 More Customers, More Often ~70% Of Sales Lift Through The Dining Room ~80% Of Sales Lift From Transaction Growth Results observed in 2013 & 2014 US Company Remodels |
 2014 Non-IA 2014 IA Image Activation Driving Customer Count Growth |
 Design is not just what it looks like and feels like. Design is how it works. - Steve Jobs |
 PERFORMANCE PLACE PROMOTION PRODUCT PRICE PEOPLE |
 96 Confident In Our Ability to Execute Strategy |
 COMMITMENT TO ECONOMIC MODEL RELEVANCE TIERS DESIGN STANDARD WITH CUSTOMIZABLE UPGRADES 98 2013 2014 |
 NOT ALL RESTAURANTS ARE CREATED EQUAL REMODEL W/ UPGRADES SCRAPE/GUT & REBUILD SUNSET/CLOSURE STANDARD REMODEL REFRESH $250K or less $450K to $650K+* ~$1.5M to $1.9M All costs are median US. *Remodel Cost does not include def. maintenance AUV |
 Meet the Needs of Our Diverse System: Alternative Design - Economically Viable Solution ~$250K |
 REIMAGING REQUIREMENT Franchisees reimage a minimum of 60% of existing restaurants by end of 2020 10% per year |
 MARKET PLANNING WHAT Should We Invest in Our Restaurants Comprehensive Approach Customer Perspective Competitive Insight Detailed Review of Real Estate Potential New Growth Foundation for Joint Capital Plan Nearly 250 Franchise Entities: 3500+ Restaurants Franchise Collaboration and Support |
 High and Low Sales Volumes Leased and Fee Properties Growing and Mature Trade Areas Competitive Intensity Customer Demographics Scrape/Gut, Remodel, Refresh, Sunset/Close Relocations and Untapped Opportunities TOTAL MARKET VIEW WHAT INVESTMENT IS NEEDED TO GROW? |
 MARKET PLANNING WHAT Should We Invest in Our Restaurants JOINT CAPITAL PLANNING HOW Should We Execute Our Investment Plan Prioritization Pacing and Sequencing Financial Implications Expandability Review Franchise Agreements Franchise Collaboration and Support |
 MARKET PLANNING WHAT Should We Invest in Our Restaurants JOINT CAPITAL PLANNING HOW Should We Execute Our Investment Plan MULTI-YEAR REINVESTMENT PLAN Comprehensive Plan for Growth Franchise Collaboration and Support Grow Their Business Build Our Brand |
 REINVESTMENT PLANNING TURNKEY SERVICES FINANCIAL INCENTIVES CONSTRUCTION SUPPORT 105 FRANCHISE PARTNERSHIP |
 DRIVE NEW RESTAURANT GROWTH Grow 1,000 new restaurants by 2020 Net Positive Growth by 2016 |
 +12 +64 -28 -40 -20 North American System 61 72 80 110 112 2013 2014 2015 2016 2017 New Restaurants NET POSITIVE GROWTH BY 2016 |
 108 Image Activation Seeing 10-15% Higher Sales vs. Previous Design $1.6M $1.9M 2011 2014 IA NEW BUILDS OUTPERFORMING PREVIOUS DESIGN |
 COST EFFECTIVE INVESTMENT DESIGN THAT SETS US APART Value Engineering Alternative Footprints Structure & Design Solutions Improved Margins Listen to Customer Differentiate Experience Maximize Sales Potential Drive Customer Counts Compelling New Restaurant Economics Sales to Investment Ratio 1.3x |
 111 Enhanced Customer Experience Advanced Technology Reduced Investment Evolved Image Activation Design Rethinking the Box NEW RESTAURANT DESIGNS |
 TRADITIONAL AND NON TRADITIONAL 111 GROWTH THROUGH MULTIPLE PLATFORMS |
 Grow Canadian Business BUILD TO SUIT: CANADIAN GROWTH 362 486 2014 2020 |
 113 2015: CONTINUE GROWING … Company Image Activation 20 New Restaurants 150 Reimaged Restaurants Franchise Image Activation 60 New Restaurants 300 Reimaged Restaurants ~$8-10M in Incentives Royalty Relief & Construction Support |
 COMPELLING RESTAURANT ECONOMICS – FUEL GROWTH INCREASING BRAND RELEVANCE - A CUT ABOVE EXPERIENCE FRANCHISEES COMMITED TO GROWTH AND WENDY’S BRAND INVESTING IN COLLABORATIVE FRANCHISE PARTNERSHIP INCREASING BRAND ACCESS WITH 1000 NEW PROFITABLE STORES COMMITED TO REIMAGING SYSTEM – IMPROVE BRAND HEALTH 114 Confident in Ability to Execute our Strategy |
 115 |
 BREAK Presentation will resume at 10:15 a.m. 116 |
 Bob Wright EVP, Chief Operations Officer © 2013 Oldemark LLC |
 118 |
 119 |
 120 PEOPLE CAPABILITY FIRST |
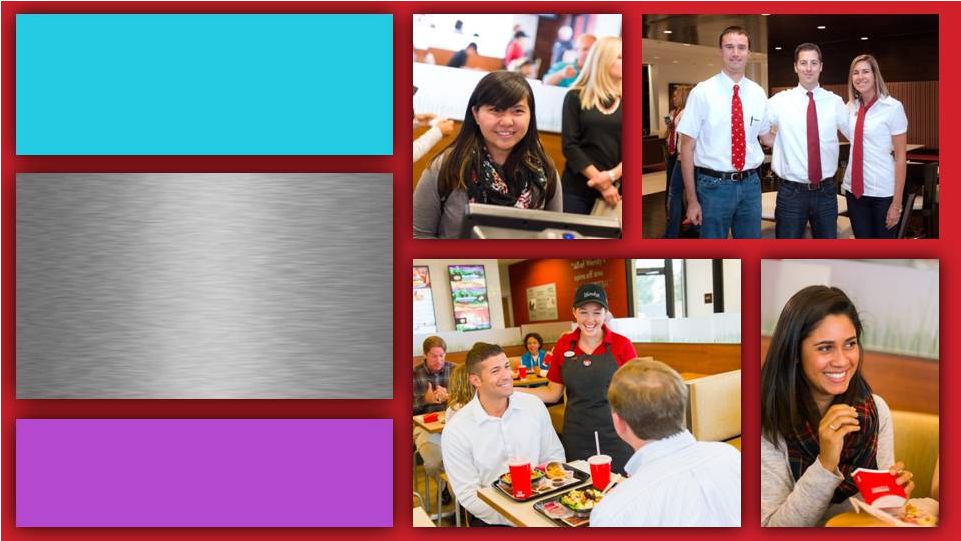 PEOPLE Source of Differentiation OUR GREATEST ASSET 121 121 |
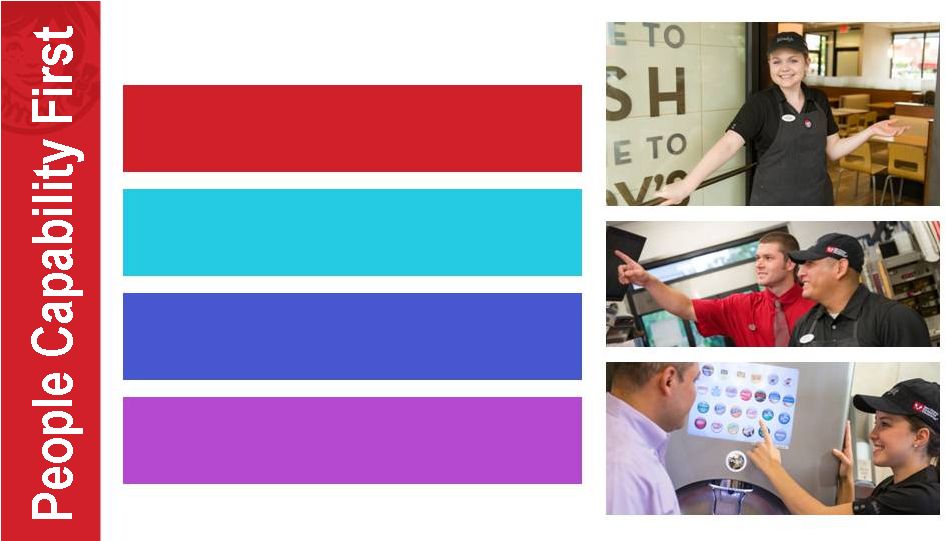 Find Joy in Making the Lives of Others Better Have a Heart for Serving Others Deliver the Brand Promise to EACH Customer Reflect One System, One Brand Our People… |
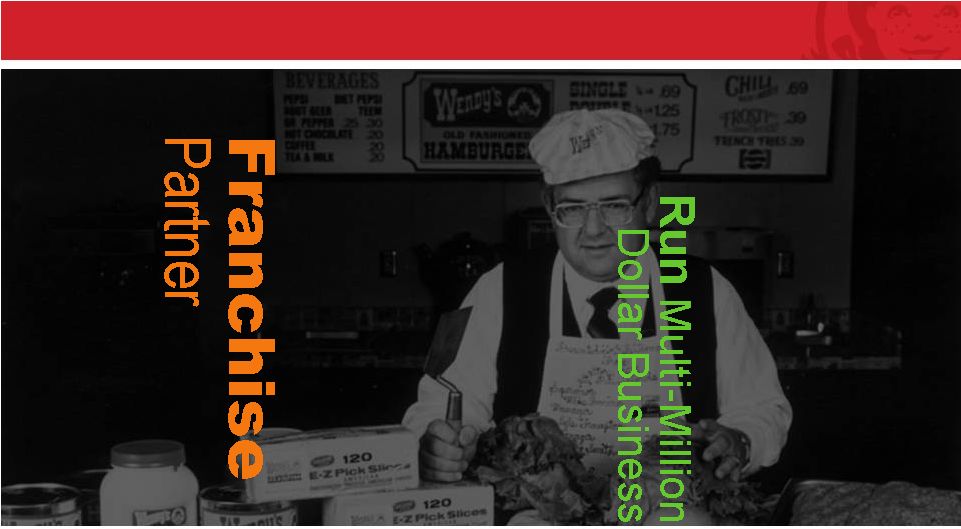
 Dave Thomas… 123 The Pursuit of Happiness My vocation has to do with restaurants. I wanted to study about their qualities in their every way. The work that I am planning to do isn’t the best paid work, but it isn’t the worst paid by a long shot. I believe what counts most in regard to work is whether you like to do it or not. |
 Our Franchisees Dedicated to Dave’s Values 124 US Franchisee Breakdown 1-19 20-39 40+ 28.4% 17.4% 54.1% 273 28 Over 80% Started in a Restaurant Position 331 4,856 Restaurants US Franchisees 76 Canadian Franchisees 258 Restaurants 30 |
 Multi-Unit Operators’ Responsibilities 125 Development & Staffing of Management Teams Day to Day Restaurant Operations Restaurant Business Reviews Local Marketing Facilities Reinvestment New Restaurant Development |
 • Critical leader in each restaurant • Responsible for • Hiring, training, development & support of their restaurant teams • Experience of Each Customer • Quality, Service & Cleanliness Standards • Financial Success Restaurant General Managers 126 |
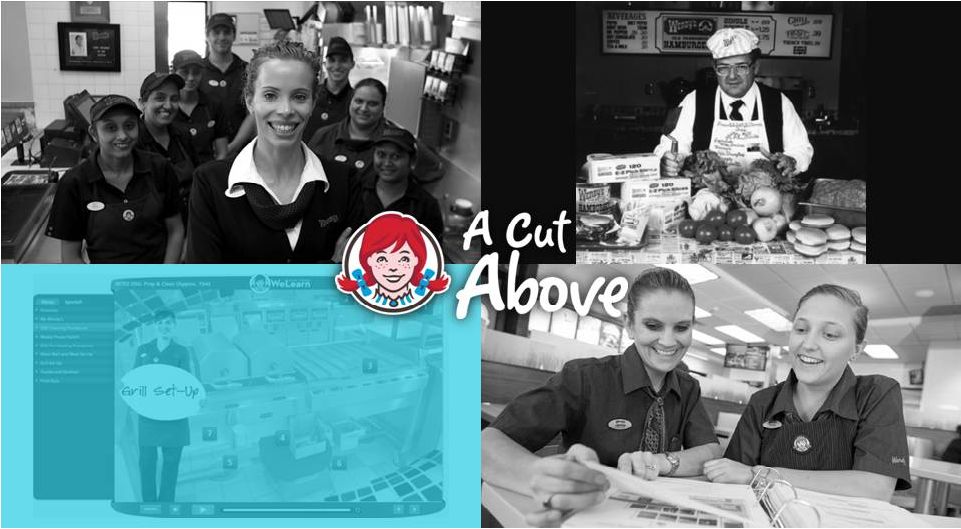
 Training & Development is Core 127 Self-Paced Learning Leader-led Support Restaurant Application Support Broad & Diverse Employee Base Target Wide-ranging Focus Areas Use Proven Adult-learning Methodologies |
 Leading-Edge Training Solutions 128 Over 100 Custom Over 100 Custom E-Learnings E-Learnings Operations Standards Operations Standards Library Library Multi-Unit Operator Multi-Unit Operator Academy Programs Academy Programs |
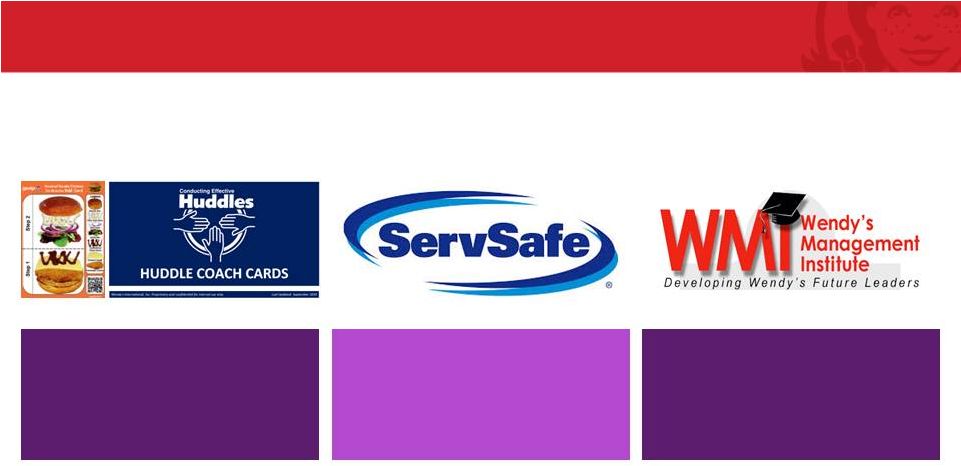 Legacy Training Systems 129 Performance Support Tools Food Safety & 3-Phase Training Leader-Led Development Classes |
 Wendy’s Careers |
 Hire The Smile - Train The Rest 131 |
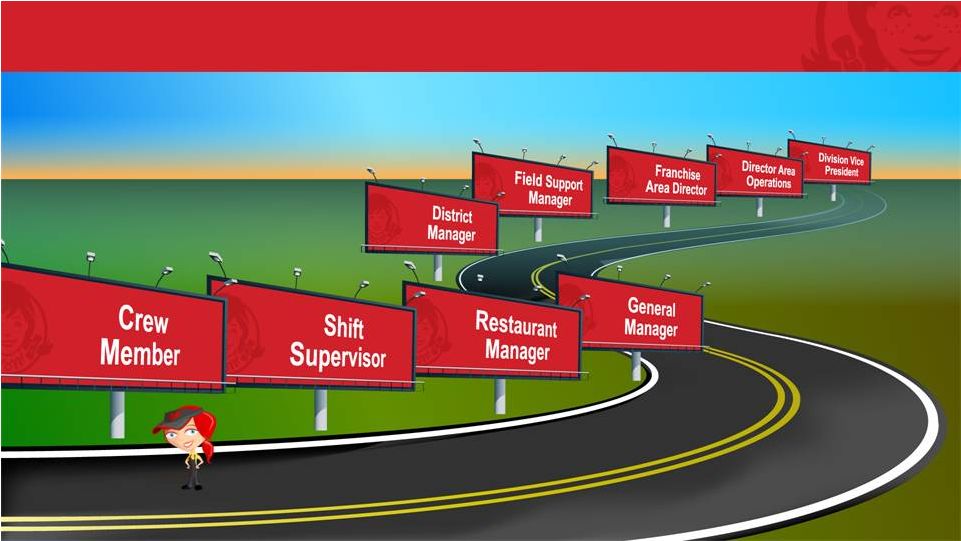
 At Wendy’s… Recognition GROW Personally areer Ladder Advancement Engaged Employees Influence OPPORTUNITIES Training Flexibility Development 132 C |
 Anyone with a balanced education, a strong work ethic & passion for serving others can be incredibly successful at Wendy’s. 133 The Bottom Line… |
 Elimination of Regional Structure 134 North Region Philadelphia Canada Region Oakville West Region Phoenix Philadelphia Chicago Boston Oakville Vancouver Salt Lake City Phoenix Dallas South Region Atlanta Atlanta Columbus New Orleans Orlando |
 Flatter North American Structure 135 US Columbus Canada Oakville Philadelphia Chicago Boston Columbus Denver New Orleans Orlando Atlanta |
 136 PEOPLE CAPABILITY FIRST |
 137 IT’S IN OUR DNA |
 Born with a Brand Purpose… 138 |
 Wendy’s has Always Been A Cut Above 139 Attendant in Dining Room Fresh Beef Tastes Best Made-to-Order Table & Chairs Like at Home Drive-Thru Custom Built for You |
 Dave CONNECTED in 1969 Very Limited Menu (Experts) NO Heat Lamps Made to Order Movable Tables & Chairs We Cleared Tables Custom Preparation BRAND RELEVANCE A CONTINUOUS QUEST 140 |
 Dave CONNECTED in 1969 Very Limited Menu (Experts) NO Heat Lamps Made to Order Movable Tables & Chairs We Cleared Tables Custom Preparation BRAND RELEVANCE A CONTINUOUS QUEST 141 2015 |
 Factors Rated Most Important at QSR Source: Consumer Brand Metrics, Technomic, Inc. 90% 91% 92% 94% 95% 96% Affordable Quality Friendly Service Quick, Quality Service Clean Interior Quality Food Taste/Flavor |
 Brand Relevance in 2015 Everyday Value Friendly Service Quick Convenient Service Fresh Customization Image Activation 143 |
 144 IT’S IN OUR DNA |
 145 OPERATING SYSTEMS |
 Operating Systems are a Strength Operating systems are a strength of Wendy's for: • Consistent daily operations • Implementation of new products & initiatives • Food safety • Service Standards |
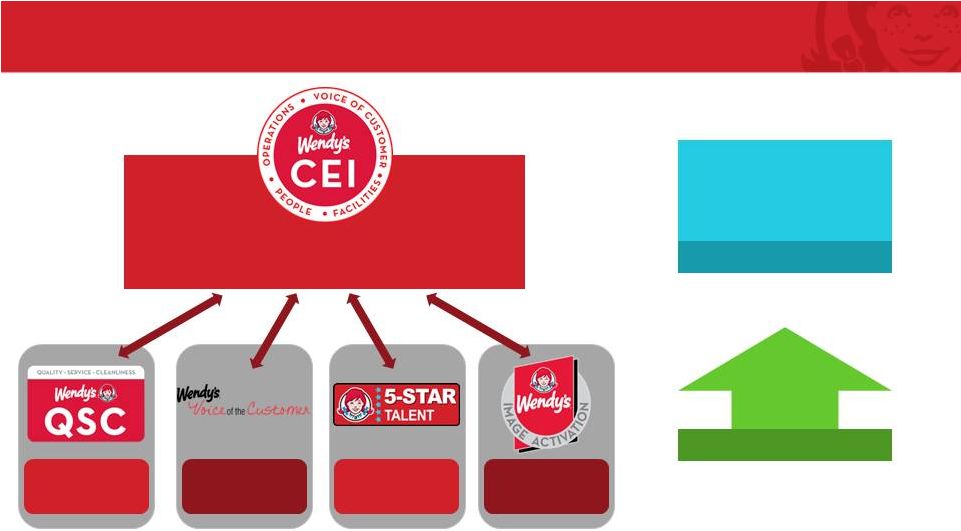 147 Annual Balanced Objective Measurement 86% 2014 CEI Average +11% A & B Restaurants Operations Standards Customer Feedback People Systems Facility Evaluation Customer Experience Index |
 The Cut Above Customer Experience 148 Feedback Surveys 60.8% 68.2% 72.3% 74.4% 2011 2012 2013 2014 Upward VOC Trend Customer Call Center |
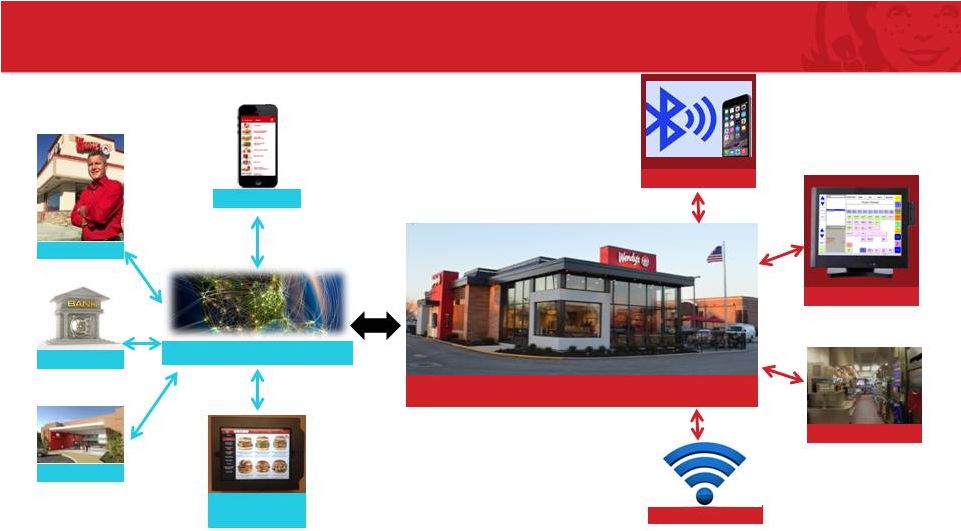 Common Restaurant Network Design 149 Wendy’s RSC Mobile Order Bank Restaurant Customer WiFi POS Kitchen Equipment Franchisee Customer Self Order Kiosk Bluetooth Beacons Internet |
 Common POS Foundation 150 Wendy’s Confidential 100% by 2016 In Process Live Scheduling 2651 44% 1605 26% 1844 30% |
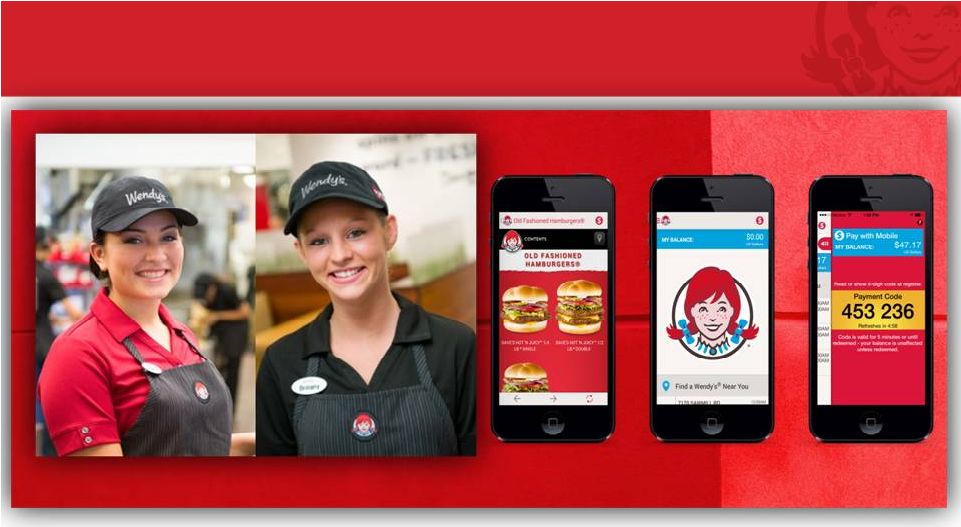
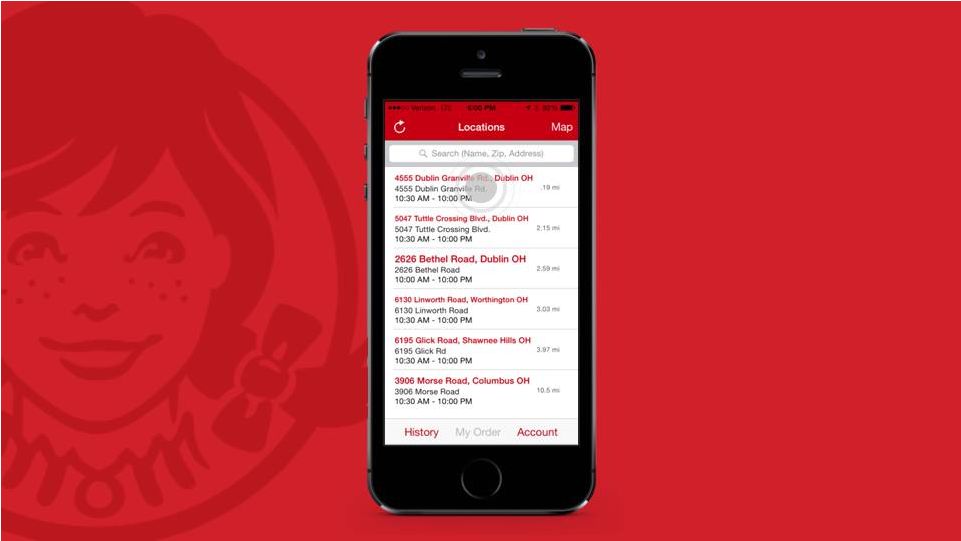
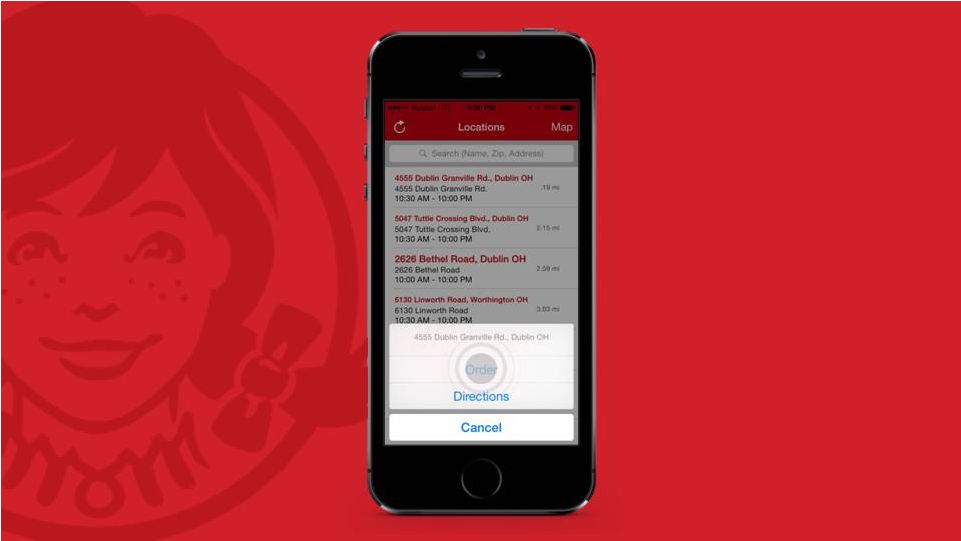
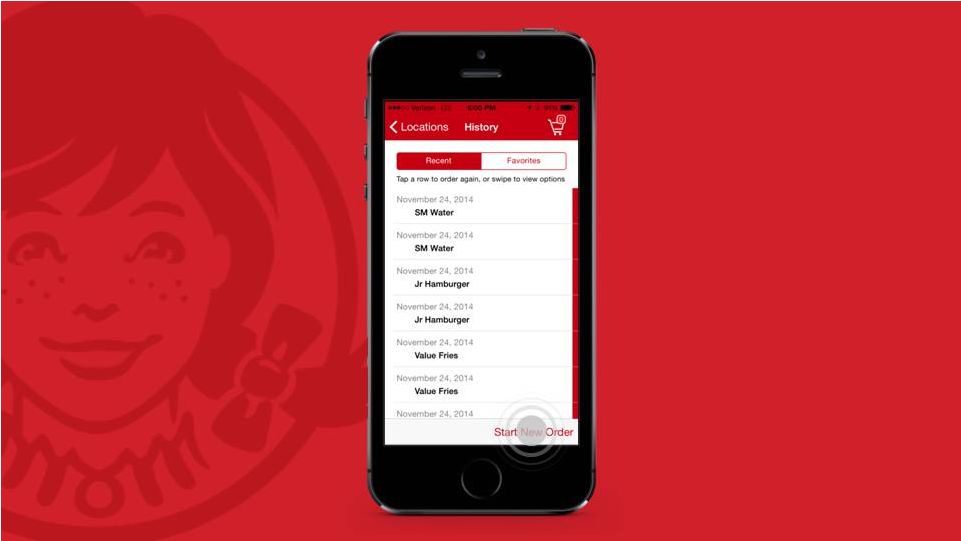
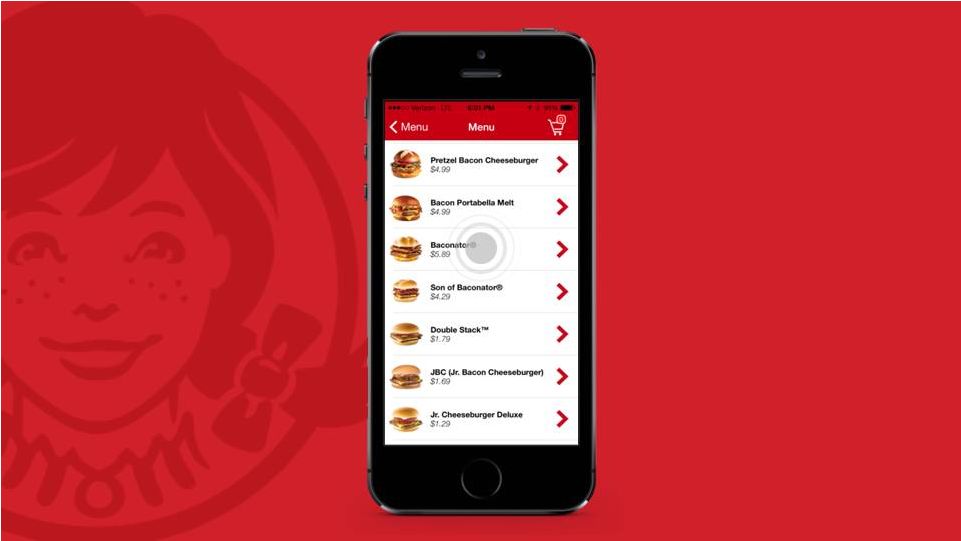
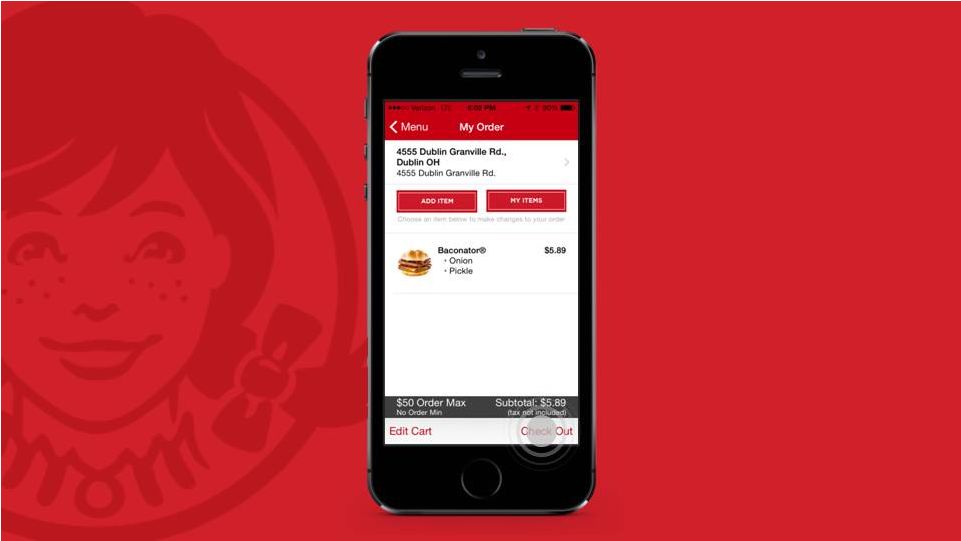
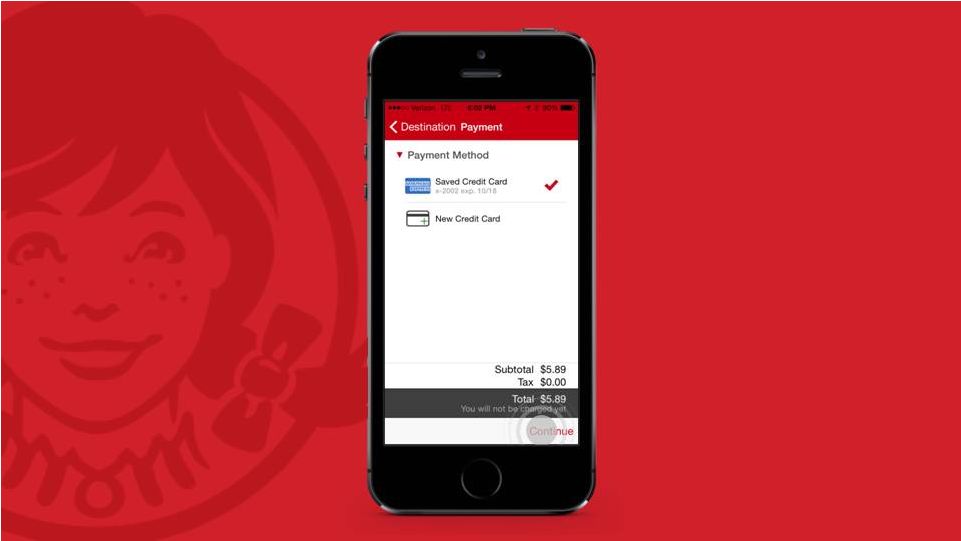
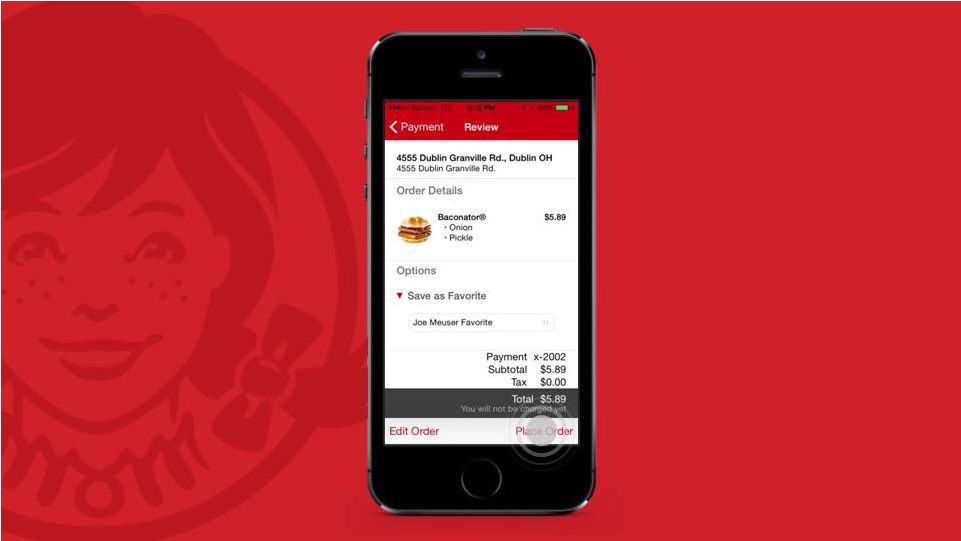
 Mobile Fits Customers’ Self Serve Desires Mobile Order Mobile Pay Customer Self Order Kiosk 151 |
 |
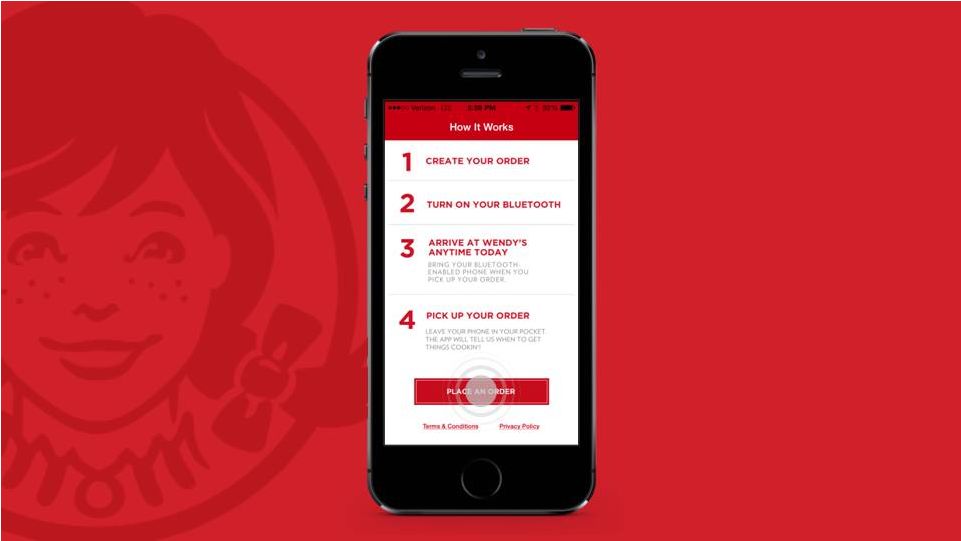 |
 |
 |
 |
 |
 |
 |
 |
 |
  |
  |
  |
  |
 |
 Separating Order & Pay From Pick Up 167 |
 Separating Order & Pay From Pick Up Pick Up Order / Pay 168 |
 SINGLE MENU 1 WINDOW SINGLE MENU 2 WINDOWS Y-LANE 2 WINDOWS +6% +28% Pick-Up Window Speed & Capacity Base Based upon car arrival rate of 137 cars/hour |
 Y-Lane Installed in 35 Restaurants 170 + 100 Cars Per Week 2.6% Sales vs. Control |
 Restaurant Margin Improvement Continues North American Company Restaurants Sales Traffic 2012 2013 2014 2015E 2020E 14.0% 15.4% 15.8% 16.4 - 16.8% 20.0% 171 |
 Wage Pressure Increases State Minimum Wage Increases 4 Increased Through 2014 Ballots 9 Increase on January 1 9 Introduced Bills in 2014 34 Considered Increases 10 Enacted Increases in 2014 (+DC) |
 Labor Analysis Underway-Complete Q2 ‘15 82% 5% Service Admin Tasks Non-Service 6% Opening 5% Closing 2% Cleaning 13% |
 Labor Study Objectives Reduced Labor Hours Unlock Speed & Capacity Efficient Opens & Closes Adjusted Positioning Guides Customer Focused Service |
 175 175 Operations Simplicity Relative Advantage 163 144 114 87 76 62 Total Menu Items - Includes Flavors & Sizes Actual Menu Items - Excludes Size Options Shakes/ Parfaits Cones Floats Menu Item Management Menu Item Management Streamlined Cup Set & Packaging Streamlined Cup Set & Packaging Reduction of Over 20 SKUs Reduction of Over 20 SKUs *Internally Sourced – Non-Breakfast Menu Items |
 Growth Drivers Continue Economic Model Relevance Brand Relevance People Make the Difference 176 176 |
 177 OPERATING SYSTEMS |
 PERFORMANCE DRIVEN |
 Functional Execution AND Emotional Connection GROWING Brand Relevance |
 Love to Win Hate to Lose |
 181 Disciplined Management Annual Business Plans Qtrly Business Reviews Weekly/Monthly Balanced Scorecards Ongoing Rewards & Recognition |
 Success = Customer Count Growth OWNING our trade area is how we beat the competition OWNER Management Team & DM FOCUS Customer Experience RESTAURANT |
 Success = Customer Count Growth OWNING our trade area is how we beat the competition OWNER DVP, Franchisee, Multi-Unit Operators FOCUS Customer Experience, Facilities & Development MARKET |
 184 |
 © 2013 Oldemark LLC Technology Brandon Rhoten VP, Digital 185 © 2013 Oldemark LLC |
 Increase profitable transactions utilizing enabling technologies. 1. Enhance brand relevance 2. Operational improvements 3. 1:1 marketing 186 |
 1:1 MARKETING |
 Cheeseburger Person ONLY Salad Person ONLY Spicy Chicken gets some love too! |
 31 MILLION UNIQUE REACH |
 The tech 190 |
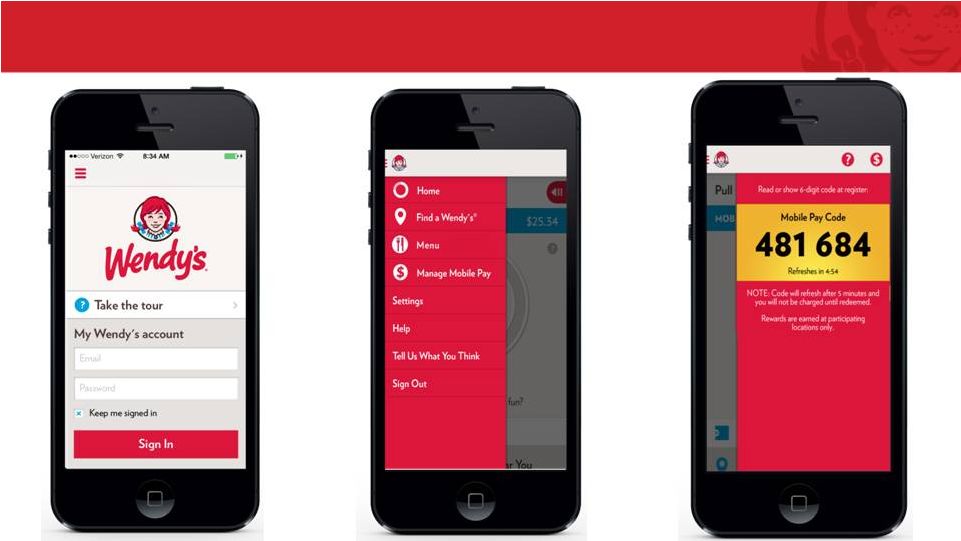 191 Pay 1.0: active |
 |
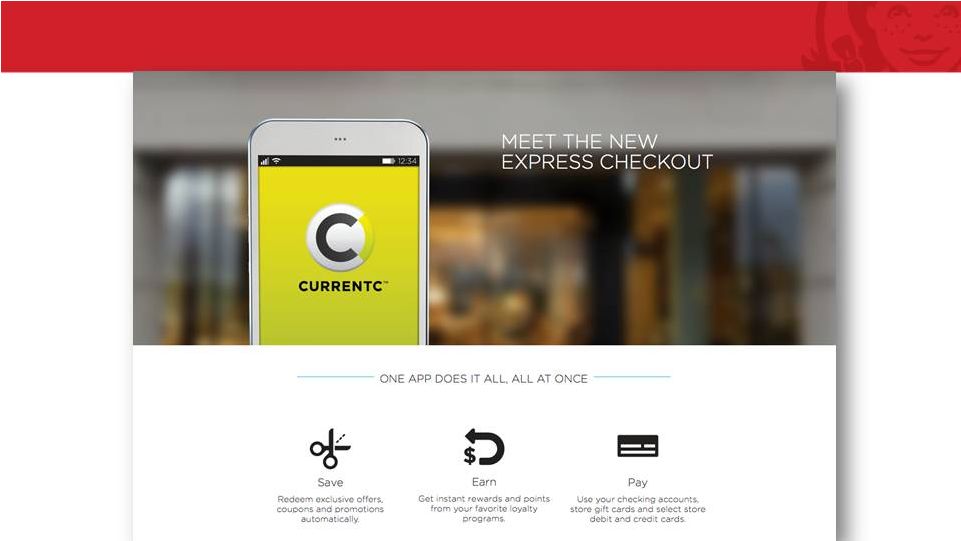 193 Pay 2.0: CurrentC tests in process |
 194 |
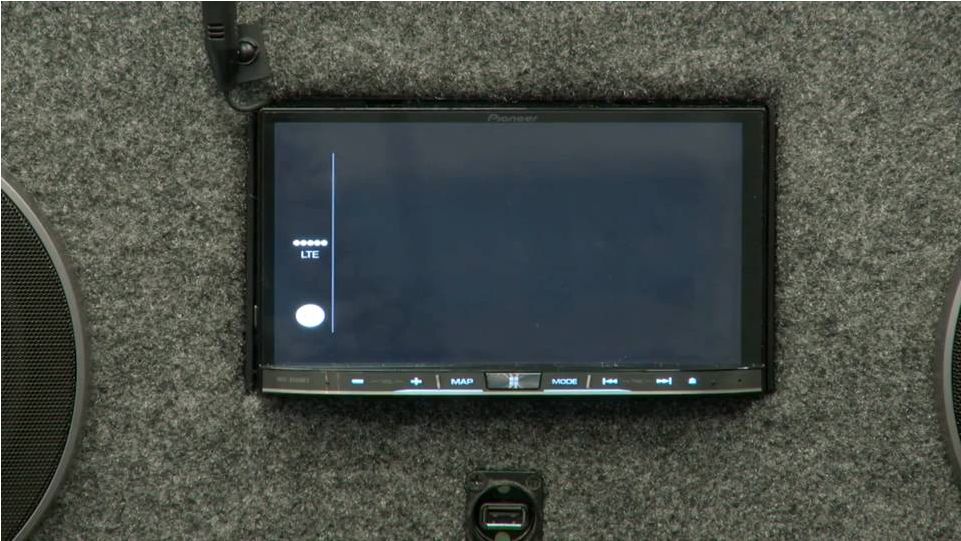
 195 Self Ordering 1.0: in test |
 |
 197 Offers: wrapping market test |
 |
 199 Ordering 1.0: local test |
 |
 201 App 2.0: Ordering + Pay + Offers + more |
 Historically, we made cheeseburgers… not apps. 202 |
 203 Waterfall Maintenance Test Development Requirement |
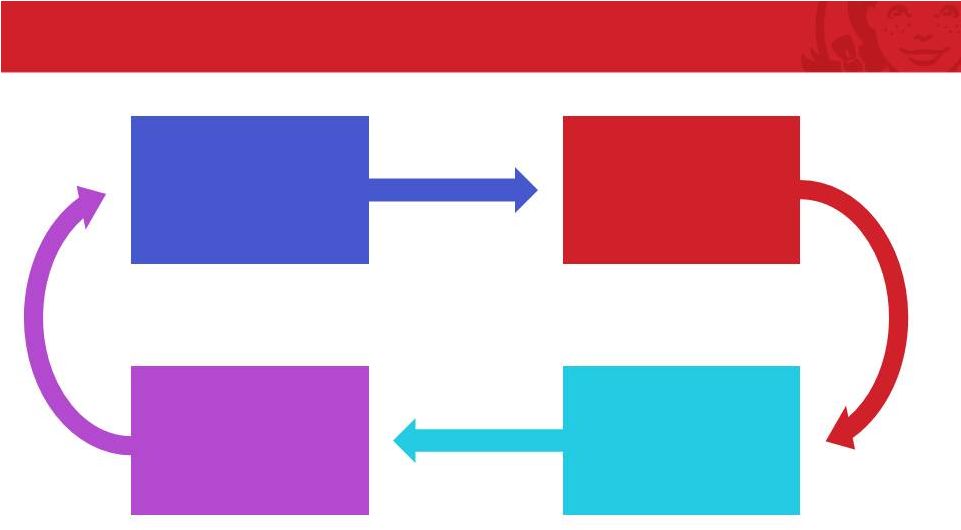
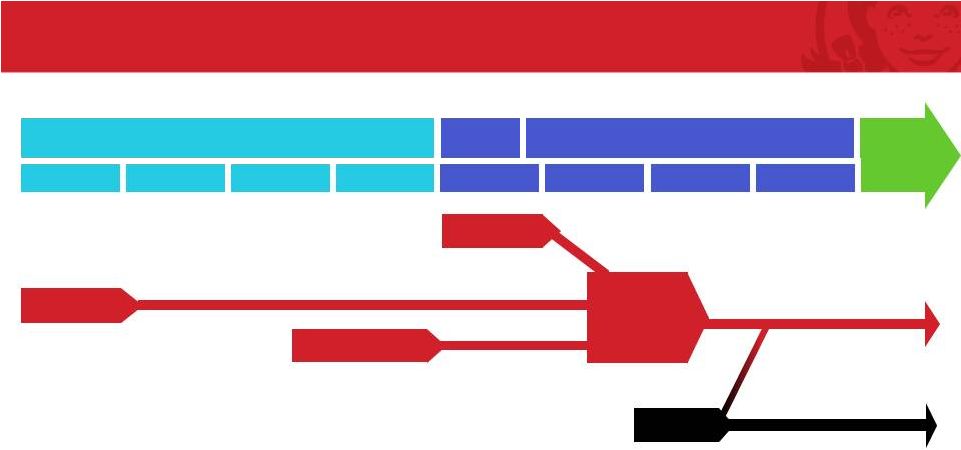
 204 Waterfall Agile Plan Develop Learn Iterate Maintenance Test Development Requirement |
 |
 |
 Mobile Rollout Timeline 2014 2015 Pay 1.0 COLUMBUS SITES… PHOENIX Ordering 1.0 Offers Market Test App 2.0 + Pay + Offers + Ordering 2.0 DMA-by-DMA Pay 2.0 (CurrentC) PILOT 2016 Q3 Q3 Q4 Q4 Q2 Q2 Q1 Q1 Q3 Q3 Q4 Q4 Q2 Q2 Q1 Q1 |
 208 |
 Product Demonstration Lori Estrada Vice President Culinary Development |
 210 ½ lb. Fresh, Never Frozen N.A. Beef American Cheese House-Sliced Tomato & Red Onion Pickles Hand-leafed Lettuce |
 211 Spicy Chicken Fillet House-cooked Bacon Natural Asiago Cheese Ranch House-sliced Tomato and hand-leafed Lettuce |
 212 South American Grain Blend • Quinoa and Brown Rice Grilled Chicken Fire Roasted Pineapple Spinach Poblano Peppers Black Beans Feta Agave Cumin Vinaigrette |
 213 |
 LUNCH Presentation will resume at noon 214 |
 © 2013 Oldemark LLC Building the Brand Emil Brolick President and CEO Sales and Profit © 2013 Oldemark LLC |
 © 2013 Oldemark LLC Brandon Solano Chief Marketing Officer © 2013 Oldemark LLC |
 “I never wanted Wendy’s to be the biggest. I want Wendy’s to be the best.” Dave, Brand Builder Extraordinaire! - Dave |
 Always has been. Always will be. 218 |
 Foundation of “Cut Above” Brand Vision 1969 |
 Dave CONNECTED in 1969 Frozen Fresh Tastes Best 220 |
 Dave CONNECTED in 1969 Heat Lamps Made-to-Order 221 |
 Dave CONNECTED in 1969 Our Way Custom Built for You 222 |
 223 Dave CONNECTED in 1969 Very Limited Menu (Experts) NO Heat Lamps Made to Order Movable Tables & Chairs We Cleared Tables Custom Preparation |
 Playing a Different Game - Dave “When they zig, we’ll zag, when they zag, we’ll zig.” It’s Our Brand DNA |
 225 More Complicated, More Competition CONNECTING with Consumers… |
 Connecting… Evolution, then Revolution Source: Pew Research, June 2014 77M 1946-1964 65M 1965-1980 83M 1980-2002 226 |
 Millennials always on! The First Connected Generation 227 |
 228 Millennials Food Quality Priorities Different Food Descriptor Indices - Total Restaurants Source: The NPD Group / CREST®, YE Sep 2012; Lunch and Supper; 18-34 indexed to 50+ and vice versa, *Or other Diet Program What’s Out What’s In What’s In What’s Out Boomers Millennials Organic Vegetarian or Vegan High Protein Gluten or Wheat-Free Whole Grain Locally Sourced or Grown Natural Low Fat or Fat-Free Weight Watchers* Healthy Low Calorie Low Sodium Heart Healthy Low or No Cholesterol Diabetic Sugar-Free |
 Boomers 229 Millennials and Boomers Key to Growth % Total QSR Traffic Share Millennials 26% 34% Period ending November 2014 / Source: The NPD Group / CREST 20% 11% 15% 20% 21% 13% <18 18-24 25-34 35-49 50-64 65+ |
 PEOPLE 5-Star Talent PRICE New QSR Quality PRODUCT Playing a Different Game PROMOTION Tactically Brilliant PLACE Brand Transformation PERFORMANCE Keeping Brand Promise Recipe to Win 230 |
 231 #marketingbuzz145 Video - |
 Promotion 232 Message Media Creative |
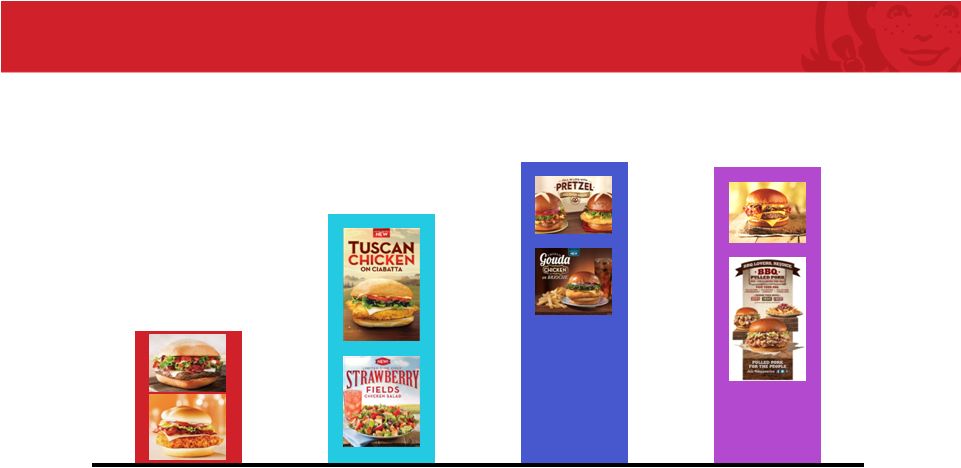
 233 2014 Marketing Calendar Driven By LTO’s 7 of 9 Events LTOs Q3 Pretzel Bacon Cheeseburger Smoked Gouda Chicken on Brioche BBQ Pulled Pork Trio Bacon Portabella Melt Tuscan Chicken on Ciabatta Strawberry Fields Salad Ciabatta Bacon Cheeseburger Q4 Q1 Q1 Q2 Q2 |
 Price - Balance is Key Media Weight 234 |
 2015 Balanced Across Core, LTO & Price/Value 235 Core Price/Value LTO |
 Applying 2014 Insights to 2015 236 Drive Passion for Our Core Menu LTO's That Appeal To Boomers & Millennials Build Beverages To Drive Traffic & Margins |
 237 Leadership Products In Core Categories Asiago Ranch Chicken Club Baconator BBQ Ranch Chicken Salad |
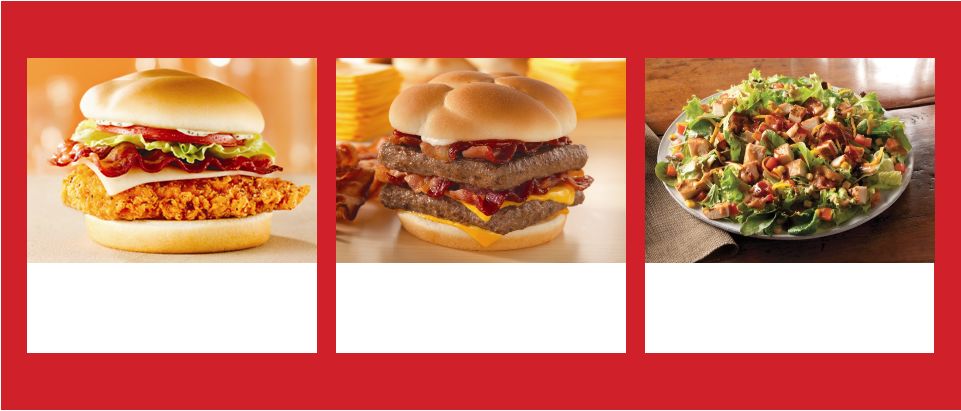
 Wendy’s - Strong Core Product Credentials Other Other Other Great Tasting Hamburgers Great Tasting Chicken Sandwiches Great Tasting Salads Source: Wendy’s Brand Health Tracking - % Consumers Endorsing, Q3 ’14 (Top 4 Brands by Segment Share) 238 |
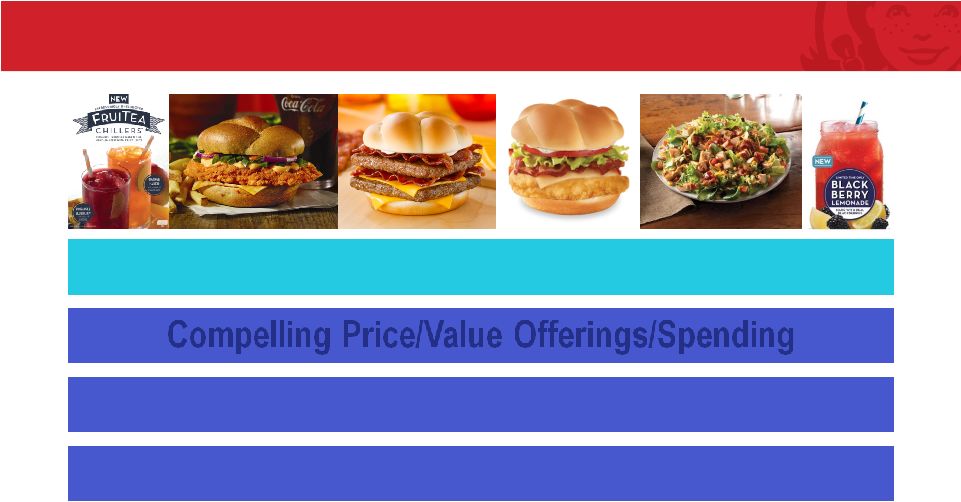
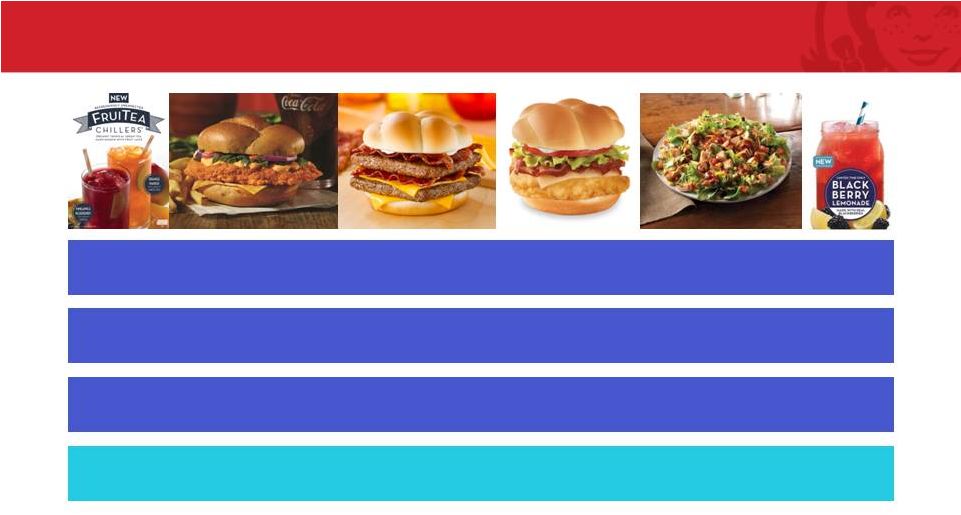
 Applying 2014 Insights to 2015 239 Drive Passion for Our Core Menu Compelling Price/Value Offerings/Spending LTO's That Appeal To Boomers & Millennials Build Beverages To Drive Traffic & Margins |
 240 1 In 4 QSR Visits Are Driven By A “Deal” 74% Non-Deal 26% Deal Past 8 Qs Dealing Driving Growth Source: The NPD Group / CREST®, Total QSR: Deal Traffic & Share, Excl. MM - Quarter Ending Sep’14 |
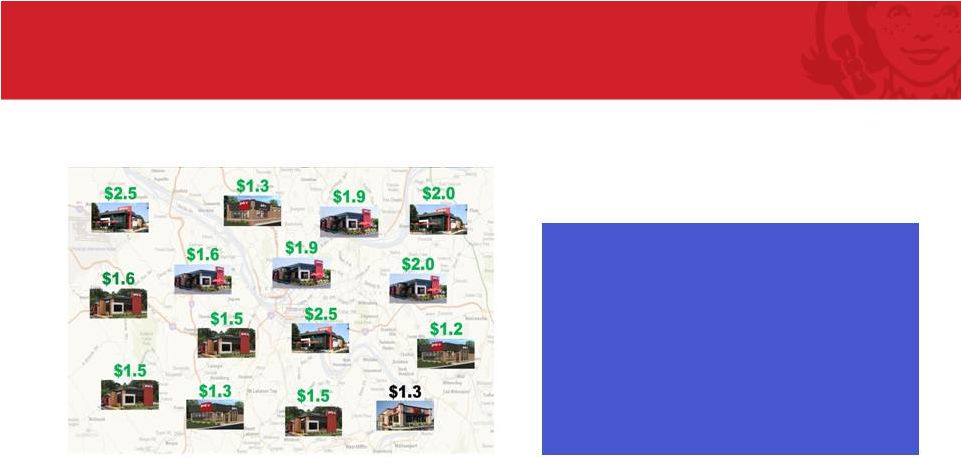
 241 Consumers Choose “Deals” That Are Right For Them Source: The NPD Group / CREST®, Total Hamburger Category: Deal Traffic, Excl. MM- YE Sept’14- Incidence (%), *Total chart adds up to 107% due to ability to multi-select All Other Discounted/ BOGO Value Menu Coupons Combo/ Specials 16% 29% 25% 19% 18% |
 A Portfolio of Price / Value Messages 1:1 Targeted Drive Off-Peak Pillar or Layer “Always On” 242 |
 At Wendy’s, It’s Not What You Pay… …It’s About What You GET |
 Applying 2014 Insights to 2015 244 Drive Passion for Our Core Menu Compelling Price/Value Offerings/Spending LTO's That Appeal To Boomers & Millennials Build Beverages To Drive Traffic & Margins |
 245 LTO's That Appeal To Boomers & Millennials Chef-Inspired Healthy & Wholesome Simple, Honest Ingredients |
 Applying 2014 Insights to 2015 246 Drive Passion for Our Core Menu Compelling Price/Value Offerings/Spending LTO's That Appeal To Boomers & Millennials Build Beverages To Drive Traffic & Margins |
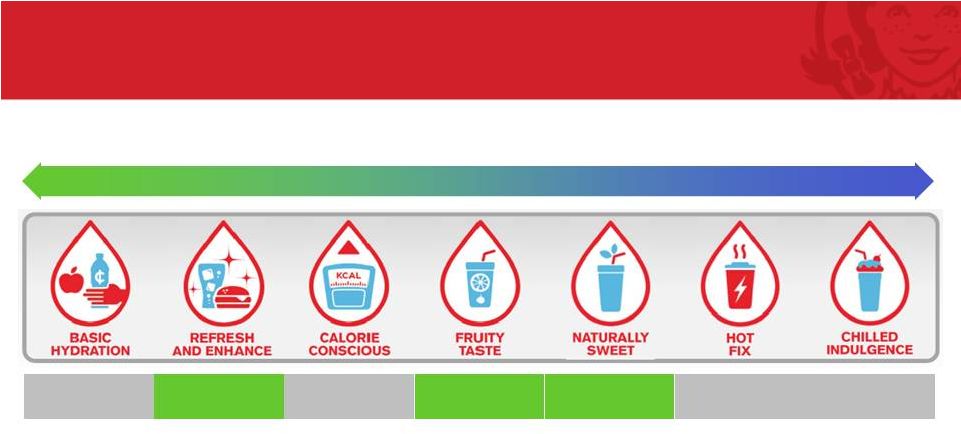 247 Beverage Program Addresses Nearly 75% Of Millennial Beverage Need States Less Typical with Food More Typical with Food 6% 17% 5% 43% 13% 6% 10% Source: Coca-Cola DINE Study - 2013 |
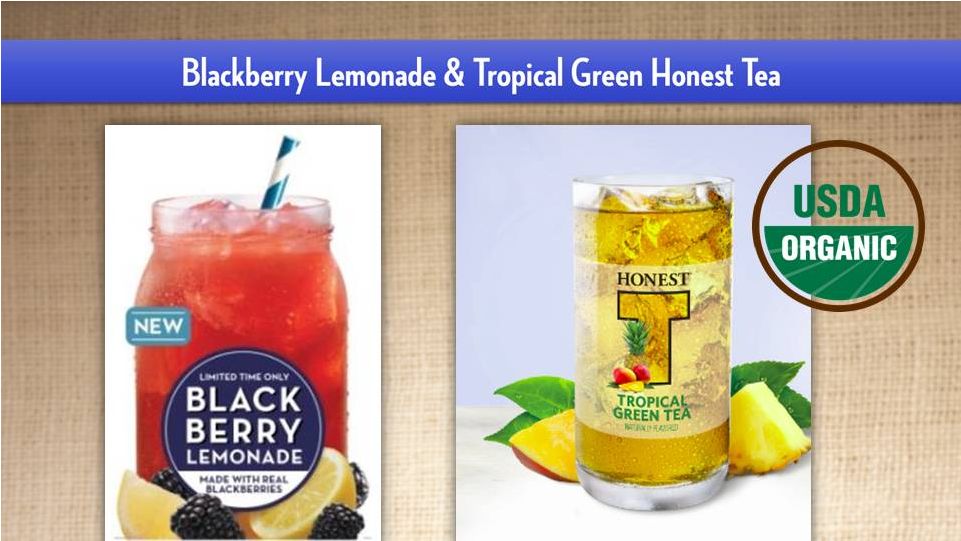
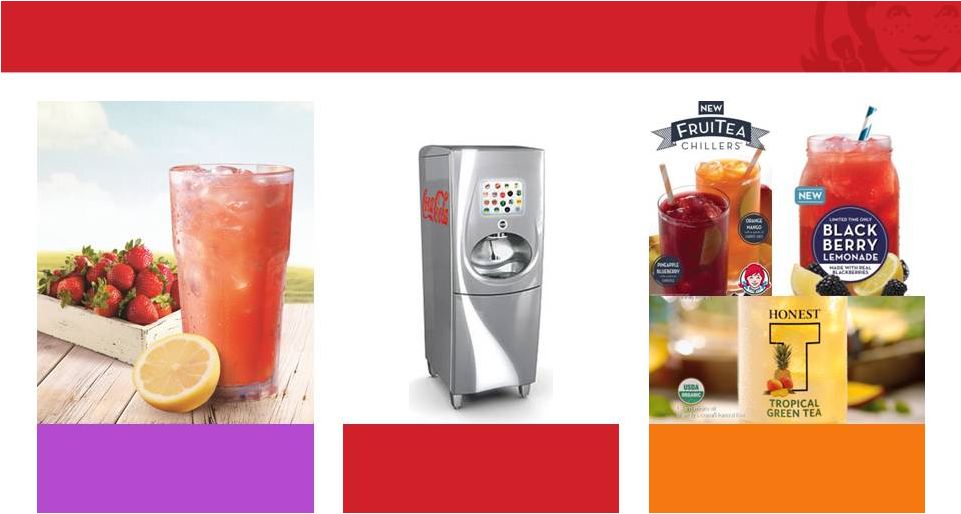 248 Great Progress In 2014 Extended Leadership Expanded Penetration Tested For Growth Strawberry Lemonade |
 Promotion 249 Message Media Creative |
 Engage Consumers When, Where & How They Want to Engage 250 |
 251 |
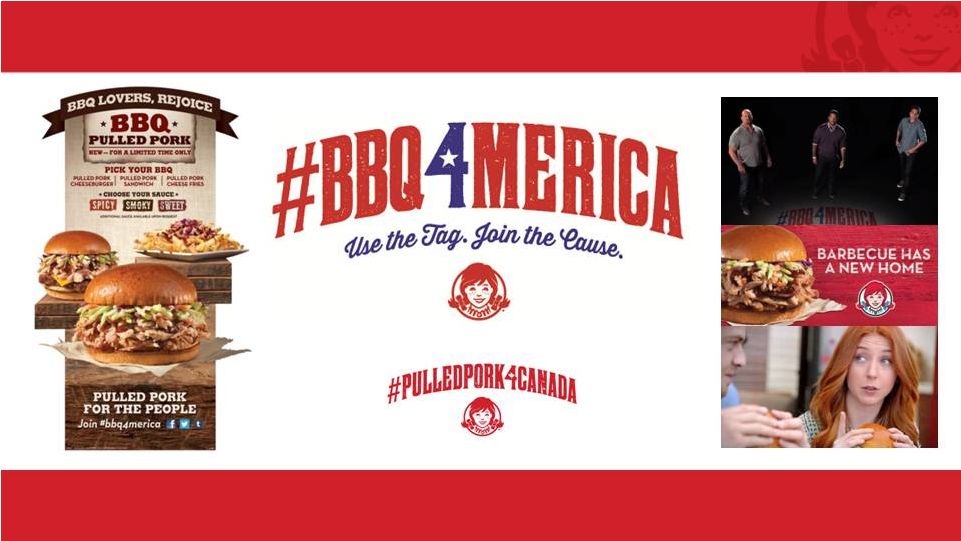
 252 Video - #barbecue4merica |
 Integrated Marketing Maximizes Reach 253 23% TV Only 50% TV & Digital 19% Digital Only = 92% Reach Recent Successful LTO XCR – A18-34 Unique Reach, |
 Integrated Marketing Maximizes Recall & Purchase Intent TV only TV only TV + Digital TV + Engaged on Digital 254 Ad Recall +9% +29% |
 Total Communication Awareness at Multi-Year High +9 pts vs 2011 Wendy’s Brand Tracking - YTD 9/14 255 40 44 49 49 2011 2012 2013 2014 |
 Promotion 256 Message Media Creative |
 257 |
 258 Video – red sizzle reel |
 259 Video – Bacon & Blue GM :30 |
 Advertising Awareness – Q3 2014 Other Outsmarting vs Outspending Wendy’s Brand Tracking 260 31 40 48 49 44 |
 261 Being the Best Wendy’s We Can Be Engage Consumers with proven 360 o marketing More balanced messaging & spending Leverage Digital, Social, Loyalty…One-on-One Relevance Continue leading QSR food and beverage innovation Raise our game in Price / Value Building on our legacy of “Cut Above” Quality Continue to evolve our successful advertising |
 © 2013 Oldemark LLC Darrell van Ligten President, International |
 263 International Today 403 Restaurants 27 Countries* $1.4MM AUVs *Includes US Territories |
 264 Brand Resonates in Markets Similar to US $1.9MM AUVs 36% Restaurants 68% Revenue |
 Caribbean 265 However, Growth Opportunities Limited NON-TRADITIONAL ASSETS NON-TRADITIONAL SITES |
 266 Consumer Model Evolution • US Designs • US Menu/LTOs • US Portion Sizes • US Value Menu • International Designs • Unique Asset Types • Localized Menu/LTOs • Localized Portion Sizes • Localized Value Offerings 2009 Future |
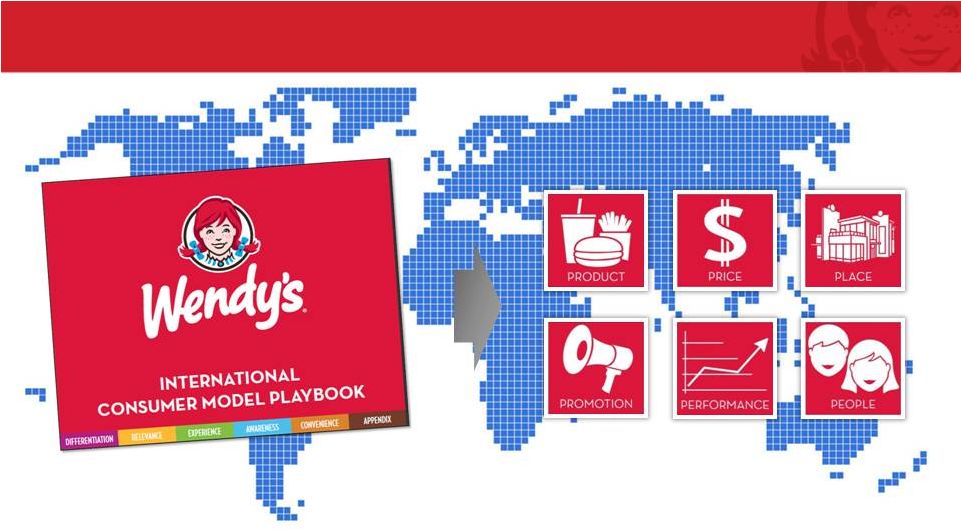 267 Our Roadmap |
 268 |
 269 |
 270 |
 271 |
 272 |
 273 |
 274 Adding Proof Points Around World |
 275 Wendy’s Users Understand Our Brand SOURCE: Wendy’s User Perception Study Image Association: Wendy’s vs. Key Competitors - Philippines Attributes where… Leading US HQSR Brand Leading Local QSR Brand Wendy’s rates higher than competitor 13 OF 16 14 OF 16 Wendy’s has largest gap vs. competitor • They offer a variety of healthy choices. • The food is real, not processed. • They offer something different to other fast food restaurants. • They offer a variety of healthy choices. • The food is real, not processed. • They freshly prepare the food when you order it. Wendy’s lags competitor • They have a range of affordable prices. • They cost more than other fast food places. • They have a range of affordable prices. • They cost more than other fast food places. |
 276 Wendy’s Users Understand Our Brand SOURCE: Wendy’s User Perception Study Image Association: Wendy’s vs. Key Competitors - Georgia Attributes where… Leading US HQSR Brand Leading US HQSR Brand Wendy’s rates higher than competitor 15 OF 16 15 OF 16 Wendy’s has largest gap vs. competitor • • They offer something different to other fast food restaurants. • They have wholesome food you feel good about eating. • • It is a place my friends like to go to. • They freshly prepare the food when you order it. Wendy’s lags competitor • They cost more than other fast food places. • They cost more than other fast food places. It is a place I’d recommend to others. It is a place I’d recommend to others. |
 277 5-Year Progress +7 Countries +38% Restaurants +51% System Sales |
 278 Key Insights from Study • Concentrate resources on fewer, key markets rather than “plant the flag” in many, scattered markets. • Customize to meet local preferences, but maintain core offering. • Commit resources to chosen markets, balancing risk and capital. |
 279 Go Forward Strategy Segment franchise markets and restructure field teams to most efficiently focus G&A and time investment on the highest revenue opportunities. 1 Create separate, dedicated team to go “narrow and deep” in a small number of high potential markets. 2 Further differentiate Wendy’s from competitive reference points via a QSR Plus+ experience that brings our “A Cut Above” brand positioning to life. 3 |
 280 Go Forward Strategy Segment franchise markets and restructure field teams to most efficiently focus G&A and time investment on the highest revenue opportunities. 1 Create separate, dedicated team to go “narrow and deep” in a small number of high potential markets. 2 Further differentiate Wendy’s from competitive reference points via a QSR Plus+ experience that brings our “A Cut Above” brand positioning to life. 3 |
 281 Market Segmentation High potential market(s) meeting key criteria Current source of revenue Future source of revenue Modest source of revenue EXISTING ADJACENT NEW SUSTAINING ACCELERATING MINOR JOINT VENTURE |
 • South America • Eastern Europe • Middle East 282 Accelerating Markets Example • Growing source of revenue • Higher AUVs • Higher royalty rate • Higher development potential Menu adaptation/optimization Café program Locally relevant value programs Leverage US marketing calendar Regional/Local LTOs Premium/Value pillar mix Growth accelerators, e.g. build-to-flip Financial incentives QSR Plus+ International Service Initiative VOC, User Perception Study WEN resources in region Franchisee growth capabilities |
 283 Go Forward Strategy 1 Create separate, dedicated team to go “narrow and deep” in a small number of high potential markets. 2 3 Further differentiate Wendy’s from competitive reference points via a QSR Plus+ experience that brings our “A Cut Above” brand positioning to life. Segment franchise markets and restructure field teams to most efficiently focus G&A and time investment on the highest revenue opportunities. |
 284 Dedicated Key Market Team Vice President, Key Markets Vice President, MD AP/EMEA Vice President, MD LAC Caribbean South America Central America India Middle East Brazil Japan Asia Pacific EMEA |
 285 Go Forward Strategy Segment franchise markets and restructure field teams to most efficiently focus G&A and time investment on the highest revenue opportunities. 1 Create separate, dedicated team to go “narrow and deep” in a small number of high potential markets. 2 Further differentiate Wendy’s from competitive reference points via a QSR Plus+ experience that brings our “A Cut Above” brand positioning to life. 3 |
 OUR GOAL Become the preferred QSR brand by creating QSR Plus+; a category disrupting experience that yields a “customer epiphany.” 286 |
 287 Our Research Indicates White Space Reference Points e.g. Better Burger Places QSR |
 288 Brazil Example |
 289 Creating The QSR Plus+ Experience QUEUE TO ORDER ENTER RESTAURANT EXPLORE MENU ORDER MEAL WAIT FOR MEAL RECEIVE MEAL EAT MEAL EXIT RESTAURANT GO BEYOND! Hospitality International IA Layout/flow Separate Café area Hostess Uniforms No serpentine No counter Order point away from kitchen Register “Pods” Plan for self-order No traditional menuboard Kiosk used to merchandise Laminated menus POP lite Hostess as guide Register Pod Kiosk Table No combos Menu tiers Build your own “Make it a double/triple” Mobile ordering Self-serve drinks Take-out zone Wait at table Table locator technology Served on plates Server tray Beverages served to table Beverages in glasses Take-out packaging Brought to table Portion sizes Sandwich builds Local flavors Local items Premium cut option Differentiated standard bun Local salad ingredients Premium mayo, sauces served in bowls, bottled Heinz ketchup Table condiments Frosty toppings Adult beverages Targeted pricing Table cleared Hostess thank you |
 290 Positive Consumer Response • Quite different from what we’re used to seeing in MD or BK. • This is a great place with good price, I’m concerned with the line. • Feels like a hamburgueria but more accessible. • It’s too good to be true…it’s probably going to have huge lines. |
 291 Recap • Recipe to Win is our roadmap. • Strict segmentation and prioritization of franchisee markets. • Brand proof points around world. • Dedicated team to pursue a small number of key markets. • Global brand proposition – QSR Plus+. |
 292 |
 Q&A e-mail questions to: David.Poplar@wendys.com |
 Appendix |
 2014 2013 2014 2013 Adjusted EBITDA from continuing operations 107,055 $ 89,011 $ 392,746 $ 367,133 $ (Less) plus: Pension withdrawal expense in cost of sales - (13,500) - (13,500) Depreciation and amortization (41,563) (47,518) (159,353) (182,359) Facilities action charges (income), net (6,530) 20,834 29,100 (10,856) Impairment of long-lived assets (7,245) (10,552) (10,985) (15,879) Impairment of goodwill - (9,397) - (9,397) Operating profit 51,717 28,878 251,508 135,142 Interest expense (12,864) (13,464) (52,192) (69,012) Loss on early extinguishment of debt - (7,544) - (28,563) Investment income, net 23 21,202 1,199 23,565 Other income (expense), net 177 233 754 (2,080) Income from continuing operations before income taxes and noncontrolling interests 39,053 29,305 201,269 59,052 (Provision for) benefit from income taxes (15,759) 3,620 (79,835) (14,154) Income from continuing operations 23,294 32,925 121,434 44,898 Net loss from discontinued operations - (266) - (266) Net income 23,294 32,659 121,434 44,632 Net loss attributable to noncontrolling interests - 410 - 855 Net income attributable to The Wendy's Company 23,294 $ 33,069 $ 121,434 $ 45,487 $ Three Months Twelve Months Reconciliation of Adjusted EBITDA from Continuing Operations to Net Income Attributable to The Wendy's Company (In Thousands) (Unaudited) |
 Per share Per share Adjusted income and adjusted earnings per share from continuing operations 36,952 $ 0.10 $ �� 44,082 $ 0.11 $ (Less) plus: Facilities action charges (income), net (7,242) (0.02) 11,555 0.03 Impairment of long-lived assets (4,470) (0.01) (6,567) (0.02) Depreciation of assets that will be replaced as part of the Image Activation initiative (1,946) (0.01) (8,510) (0.02) Impairment of goodwill - - (9,207) (0.02) Pension withdrawal expense in cost of sales - - (8,286) (0.02) Loss on early extinguishment of debt - - (4,692) (0.01) Dividend from Arby's - - 14,550 0.03 Total adjustments (13,658) (0.04) (11,157) (0.03) Income from continuing operations 23,294 0.06 32,925 0.08 Net loss from discontinued operations - - (266) (0.00) Net income 23,294 0.06 32,659 0.08 Net loss attributable to noncontrolling interests - - 410 0.00 Net income and diluted earnings per share attributable to The Wendy's Company 23,294 $ 0.06 $ 33,069 $ 0.08 $ Per share Per share Adjusted income and adjusted earnings per share from continuing operations 127,035 $ 0.34 $ 119,215 $ 0.30 $ (Less) plus: Depreciation of assets that will be replaced as part of the Image Activation initiative (11,940) (0.03) (23,822) (0.06) Impairment of long-lived assets (6,778) (0.02) (9,899) (0.02) Facilities action (income) charges, net 12,996 0.03 (19,321) (0.05) Gain (loss) on sale of investment, net 121 0.00 (503) (0.00) Loss on early extinguishment of debt - - (17,829) (0.05) Impairment of goodwill - - (9,207) (0.02) Pension withdrawal expense in cost of sales - - (8,286) (0.02) Dividend from Arby's - - 14,550 0.03 Total adjustments (5,601) (0.02) (74,317) (0.19) Income from continuing operations 121,434 0.32 44,898 0.11 Net loss from discontinued operations - - (266) (0.00) Net income 121,434 0.32 44,632 0.11 Net loss attributable to noncontrolling interests - - 855 0.00 Net income and diluted earnings per share attributable to The Wendy's Company 121,434 $ 0.32 $ 45,487 $ 0.11 $ Twelve Months 2014 2013 2014 2013 Reconciliation of Adjusted Income and Adjusted Earnings Per Share from Continuing Operations to Net Income and Diluted Earnings Per Share Attributable to The Wendy's Company (In Thousands Except Per Share Amounts) (Unaudited) Three Months |