 © 2015 Quality Is Our Recipe, LLC Second-Quarter 2015 Conference Call August 5, 2015 Exhibit 99.1 |
 © 2015 Quality Is Our Recipe, LLC DAVID POPLAR Vice President Investor Relations 2 |
 Today’s Agenda CEO Overview Emil Brolick Financial Update Todd Penegor Q&A 3 |
 This presentation, and certain information that management may discuss in connection with this presentation, contains certain statements that are not historical facts, including information concerning possible or assumed future results of our operations. Those statements constitute “forward-looking statements” within the meaning of the Private Securities Litigation Reform Act of 1995 (The “Reform Act”). For all forward-looking statements, we claim the protection of the safe harbor for forward-looking statements contained in the Reform Act. Many important factors could affect our future results and could cause those results to differ materially from those expressed in or implied by our forward-looking statements. Such factors, all of which are difficult or impossible to predict accurately, and many of which are beyond our control, include but are not limited to those identified under the caption “Forward-Looking Statements” in our news release issued on August 5, 2015 and in the “Special Note Regarding Forward-Looking Statements and Projections” and “Risk Factors” sections of our most recent Form 10-K / Form 10-Qs. In addition, this presentation and certain information management may discuss in connection with this presentation reference non-GAAP financial measures, such as adjusted earnings before interest, taxes, depreciation and amortization (or adjusted EBITDA), adjusted EBITDA margin and adjusted earnings per share. Adjusted EBITDA, adjusted EBITDA margin and adjusted earnings per share exclude certain expenses, net of certain benefits. Reconciliations of non-GAAP financial measures to the most directly comparable GAAP financial measures are provided in the Appendix to this presentation, and are included in our news release issued on August 5, 2015 and posted on www.aboutwendys.com. 4 Forward-Looking Statements and Non-GAAP Financial Measures |
 © 2015 Quality Is Our Recipe, LLC EMIL BROLICK President & CEO 5 |
 © 2015 Quality Is Our Recipe, LLC NA COMPANY-OPERATED RESTAURANT MARGIN INCREASES 40 BPS TO 18.2% IMPROVEMENT OF 170 BPS IN ADJ. EBITDA MARGIN* TO 21.3% 6 ADJ. EBITDA* UP 5.2% DESPITE SALE OF 141 COMPANY RESTAURANTS COMPANY INTENDS TO ENTER INTO ~$165 MILLION ASR TRANSACTION NA SYSTEMWIDE SRS INCREASE 2.2%; 5.4% ON A TWO-YEAR BASIS *See Reconciliation of Adjusted EBITDA, Adjusted EBITDA Margin and Adjusted EPS in Appendix |
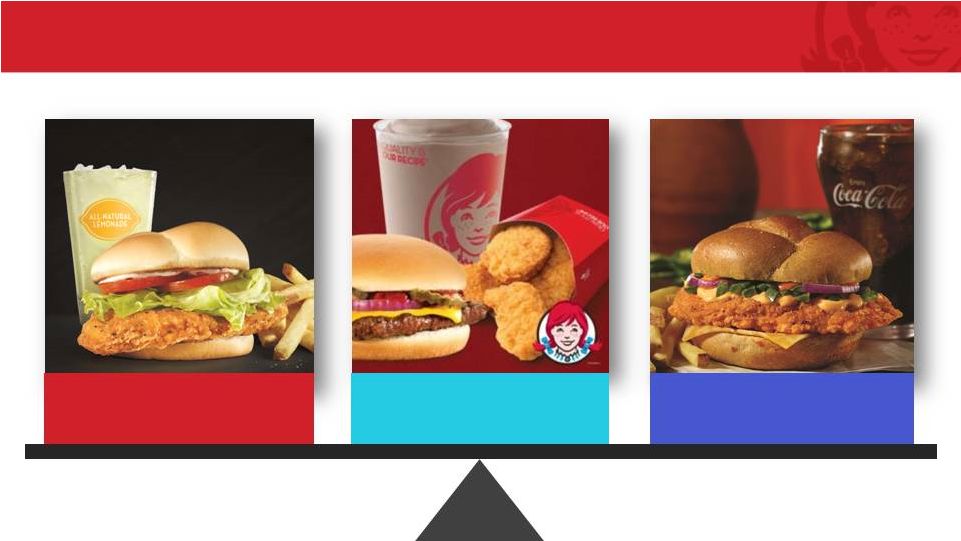 2015 Balanced Across Core, LTO & Price/Value LTO Price/Value Core 7 |
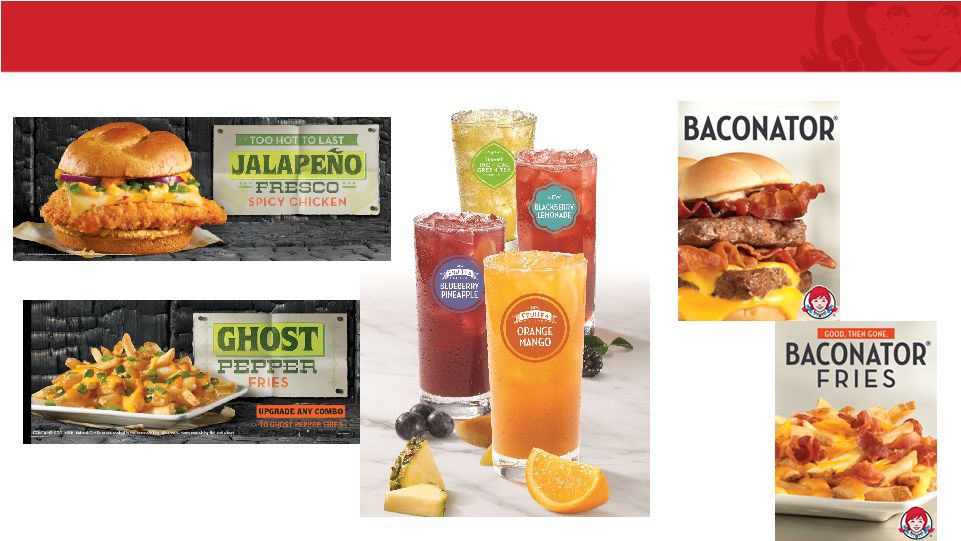 2015 Product Successes to Date 8 |
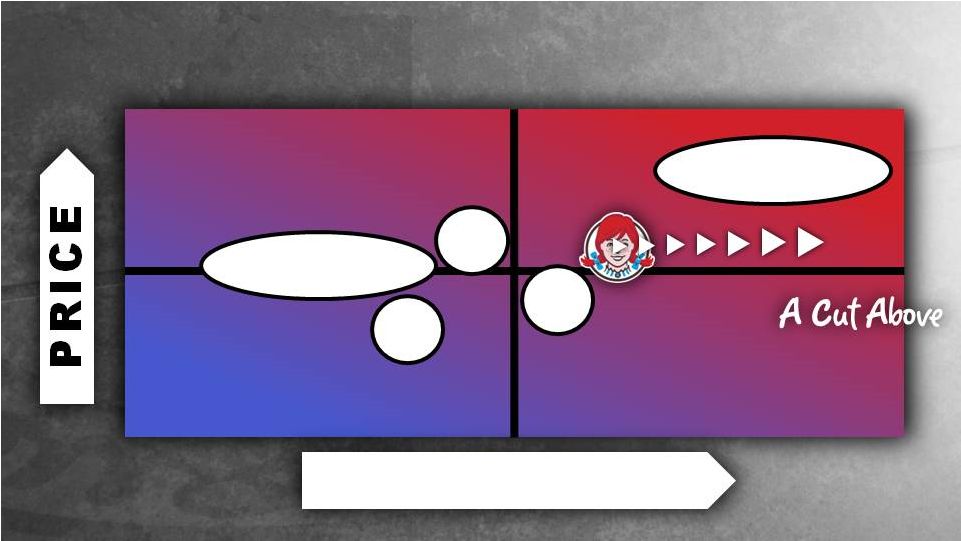 EXPERIENCE HIGH LOW FUNCTIONAL EMOTIONAL Wendy’s: New QSR Quality, QSR Price A B C New QSR Traditional QSR 9 |
 HOW WE GROW BRAND RELEVANCE + ECONOMIC RELEVANCE = GROWTH Financial Management Global Growth Restaurant Utilization & Brand Access System Optimization New Restaurant Growth Image / Experience Activation North America Same-Restaurant Sales Growth Shareholder Value-Enhancing Initiatives Core Organic Growth Strategies |
 11 System Optimization – Quality of Earnings Evolution 50% 50% 80% 20% 2012 (A) ~23% Co. Ownership 2017 (E) ~5% Co. Ownership Rent & Royalties Company Restaurants |
 Confident in Long-Term Outlook Cut Above Brand Positioning Recipe to Win Energized Franchisees Committed to Growth Strong Company & Restaurant Economic Models 12 |
 © 2015 Quality Is Our Recipe, LLC TODD PENEGOR Chief Financial Officer 13 |
 $ Mils (except per-share amounts) Second Quarter Financial Highlights N.A. Systemwide SRS 2.2% 3.2% 2-Year 5.4% N.A. Company SRS 2.4% 3.9% 2-Year 6.3% N.A. Co. Rest. Margin 18.2% 17.8% +40 bps G&A $60.8 $66.4 8.4% Adjusted EBITDA* $104.3 $99.1 5.2% Adjusted EBITDA Margin* 21.3% 19.6% +170 bps Adjusted EPS* $0.08 $0.09 -11.1% 2015** 2014** B/(W) * See Reconciliation of Adjusted EBITDA, Adjusted EBITDA Margin and Adjusted EPS in the Appendix. ** Due to the recent sale of its bakery business, the Company is reporting its bakery results as Discontinued Operations in its financial statements. The Company has provided quarterly reclassified 2014 statements of operations on its website to conform to its current-year presentation. 14 |
 Q2 2015 vs. Q2 2014: Adjusted EBITDA 15 * The Company has provided quarterly reclassified 2014 statements of operations on its website to conform to its current-year presentation. ** Due to the recent sale of its bakery business, the Company is reporting its bakery results as Discontinued Operations in its financial statements. (Unaudited) $ in millions Improved Quality of Earnings: Adjusted EBITDA Margin Growth of 170 BPS $104.2 $99.1 $104.3 ($6.6) ($1.0) ($4.2) $5.7 $2.7 $2.5 $1.5 ($0.5) 2014 Q2 Reported Adj. EBITDA LY Gains on Rest. Sales & Surplus Property* LY Bakery EBITDA** 2014 Q2 Revised Adj. EBITDA G&A Savings Franchise Fees (Canadian TAFs) IA Impact Core Restaurant EBITDA Other Disposed Rest. EBITDA (SO II) 2015 Q2 Adj. EBITDA |
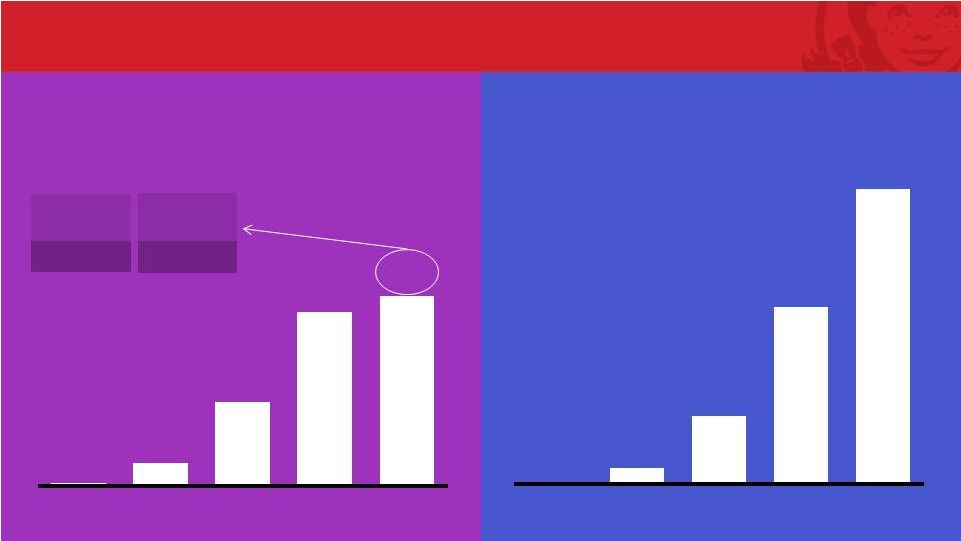 2015 Image Activation On Track Total System Annual Reimages & New Builds Total System Cumulative Reimages & New Builds 450 Reimages 80 New 16 10 64 234 486 530 2011A 2012A 2013A 2014A 2015E 10 74 308 794 1,324 2011A 2012A 2013A 2014A 2015E |
 System Optimization Update Canada System Optimization • Sold remaining restaurants during 2Q • Commitment to build more than 60 new restaurants in Canada • Reinvestment of proceeds in Canadian Build-to-Suit program U.S. System Optimization • Plan to sell an additional 540 restaurants: 280 in 2015 and 260 in 2016 • Strong interest in all markets • Expect pre-tax proceeds of $400-$475M System Optimization II System Optimization III 17 ONGOING SYSTEM OPTIMIZATION |
 18 Rental Revenue Evolution – Expect $100M Growth Total = $68M 2014* (A) 2017 (E) Owned Properties Leased Properties Total = $170M By 2017 expect to monetize ~70% of our owned real estate properties * 2014 actuals exclude ~$1M of rental revenue related to the Bakery business $ millions $21 $47 $100 $70 |
 • Successfully completed $850 million share repurchase • Announced today plans to enter in to an Accelerated Share Repurchase Transaction for approximately $165 million • Expect to utilize remaining $400 million authorization by end of 2016 Share Repurchase Update 19 Company previously announced $1.4 billion share repurchase program on June 3 |
 2015 Outlook 20 • Reaffirming • G&A expense of approximately $250 million • Capital expenditures of approximately $240 to $250 million • Depreciation and amortization to be approximately flat to prior year • Revising • Company-operated SRS growth of 2.0-2.5 percent • Company-operated restaurant margin outlook of 17.0 to 17.5 percent • Reported effective tax rate of 38 to 40% Increasing Adjusted EBITDA to $385 to $390 million Reaffirming Adjusted EPS of $0.31 to $0.33 20 |
 21 2020 Goals $2MM 20% 1.3x+ 1,000 AUVs Restaurant Margins Sales to Investment Ratio New NA Restaurants 60% Total Reimaged NA Restaurants BRAND RELEVANCE ECONOMIC MODEL RELEVANCE Achievement requires two growth drivers: |
 © 2015 Quality Is Our Recipe, LLC DAVID POPLAR Vice President Investor Relations (614) 764-3311 david.poplar@wendys.com 22 |
 23 2015 Investor Relations Calendar: Key Dates September 10 CL King (NYC) Conference October 15 Image Activation Market Visit with Goldman Sachs (Dublin) November 4 3Q Earnings Release November 18 Morgan Stanley Conference December 9 Wedbush Conference |
 Q&A 24 |
 Appendix 25 |
 Reconciliation of Adjusted EBITDA from Continuing Operations to Net Income 26 2015 2014 1 2015 2014 1 Adjusted EBITDA from continuing operations 104,286 $ 99,102 $ 185,097 $ 171,219 $ (Less) plus: Depreciation and amortization (39,335) (37,998) (74,880) (78,578) System optimization gains, net 15,654 1,418 14,849 74,395 Reorganization and realignment costs (6,279) (1,276) (10,892) (15,987) Impairment of long-lived assets (10,018) (77) (11,955) (2,606) Operating profit 64,308 61,169 102,219 148,443 Interest expense (17,201) (13,083) (29,944) (26,025) Loss on early extinguishment of debt (7,295) - (7,295) - Other income, net 272 856 511 1,377 Income from continuing operations before income taxes 40,084 48,942 65,491 123,795 Provision for income taxes (15,259) (21,615) (22,516) (51,459) Income from continuing operations 24,825 27,327 42,975 72,336 Discontinued operations: Income from discontinued operations, net of income taxes 231 1,680 9,588 2,974 Gain on disposal of discontinued operations, net of income taxes 15,139 - 15,139 - Net income from discontinued operations 15,370 1,680 24,727 2,974 Net income 40,195 $ 29,007 $ 67,702 $ 75,310 $ Adjusted EBITDA margin 21.3% 19.6% 19.7% 16.9% Previously reported Adjusted EBITDA 1 104,232 $ 191,566 $ Updated to exclude net gain on disposal of assets (970) (13,021) Updated to exclude Adjusted EBITDA from our bakery's discontinued operations (4,160) (7,326) Six Months Three Months Adjusted EBITDA from continuing operations 99,102 $ 171,219 $ 1 2014 Adjusted EBITDA updated to conform to the current year presentation. |
 27 Reconciliation of Adjusted Income and Adjusted Earnings Per Share from Continuing Operations to Net Income and Diluted Earnings Per Share Per share Per share Adjusted income and adjusted earnings per share from continuing operations 28,701 $ 0.08 $ 31,952 $ 0.09 $ (Less) plus: Impairment of long-lived assets (6,145) (0.02) 24 0.00 Loss on early extinguishment of debt (4,479) (0.01) - - Reorganization and realignment costs (3,842) (0.01) (271) (0.00) Depreciation of assets that will be replaced as part of the Image Activation initiative (2,629) (0.01) (3,369) (0.01) System optimization gains (losses), net 13,219 0.04 (1,009) (0.01) Total adjustments (3,876) (0.01) (4,625) (0.02) Income from continuing operations 24,825 0.07 27,327 0.07 Net income from discontinued operations 15,370 0.04 1,680 - Net income 40,195 $ 0.11 $ 29,007 $ 0.08 $ Previously reported adjusted income and adjusted earning per share 1 34,217 $ 0.09 $ Updated to exclude net gain on disposal of assets (598) - Updated to exclude adjusted income from our bakery's discontinued operations (1,667) - Adjusted income and adjusted earning per share from continuing operations 31,952 $ 0.09 $ Per share Per share Adjusted income and adjusted earnings per share from continuing operations 51,069 $ 0.14 $ 49,481 $ 0.13 $ (Less) plus: Impairment of long-lived assets (7,340) (0.02) (1,486) (0.00) Reorganization and realignment costs (6,688) (0.02) (9,009) (0.02) Loss on early extinguishment of debt (4,479) (0.01) - - Depreciation of assets that will be replaced as part of the Image Activation initiative (2,520) (0.01) (9,266) (0.03) System optimization gains, net 12,933 0.04 42,616 0.11 Total adjustments (8,094) (0.02) 22,855 0.06 Income from continuing operations 42,975 0.12 72,336 0.19 Net income from discontinued operations 24,727 0.07 2,974 0.01 Net income 67,702 $ 0.18 $ 75,310 $ 0.20 $ Previously reported adjusted income and adjusted earning per share 1 60,466 $ 0.16 $ Updated to exclude net gain on disposal of assets (8,033) (0.02) Updated to exclude adjusted income from our bakery's discontinued operations (2,952) (0.01) Adjusted income and adjusted earning per share from continuing operations 49,481 $ 0.13 $ 1 2014 Adjusted income and adjusted earnings per share updated to conform to the current year presentation. 2015 2014 Six Months Three Months 2015 2014 1 1 |
 28 |