EXHIBIT 13.1


SENSIENT TECHNOLOGIES CORPORATION 2013
Management’s Discussion & Analysis of Operations & Financial Condition
OVERVIEW
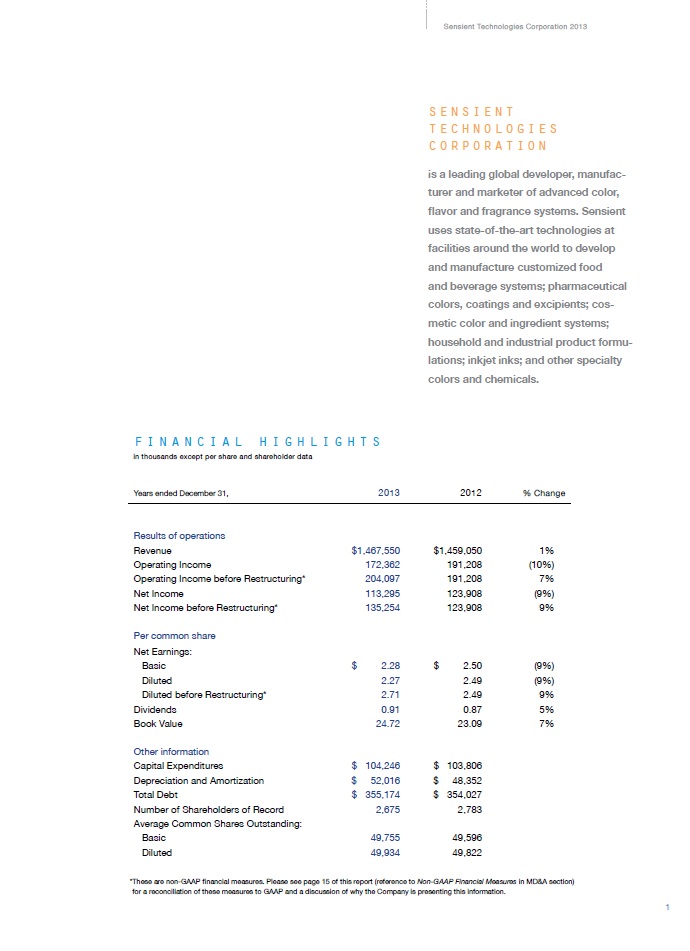
In 2013, Sensient Technologies Corporation (the “Company”) reported revenue of approximately $1.5 billion, reaching a new high for the fourth consecutive year. The Company successfully completed restructuring activities during the year, which included relocating the Flavors & Fragrances Group headquarters to Chicago as well as consolidating facilities and positions throughout the Company. Before the impact of restructuring costs, 2013 earnings per share, operating income, and cash flows from operating activities were also all-time highs. The Company’s increased gross profit margins and operating margins, before the impact of the restructuring costs, were driven by both the continued focus on higher margin business and cost reduction.

Diluted earnings per share were $2.27 in 2013 and $2.49 in 2012. The 2013 result includes 44 cents per share of restructuring costs. Earnings per share for 2013 before restructuring costs were $2.71, a 9% increase. Revenue was $1.47 billion in 2013 and $1.46 billion in 2012. Lower sales of non-strategic products, including OEM inkjet ink products, were replaced by higher margin products. Operating income was $172.4 million in 2013, and included $31.7 million of restructuring costs.
Operating income before restructuring costs was $204.1 million, an increase of 7% over 2012 operating income of $191.2 million. Operating margin in 2013 was 11.7%, which includes a 220 basis point impact from restructuring. Operating margin before restructuring costs in 2013 was 13.9%, an increase of 80 basis points from 13.1% in 2012.
Cash flows from operating activities were $153.6 million in 2013 and $139.4 million in 2012. Before the impact of restructuring costs, 2013 cash flows from operating activities were $166.4 million, an increase of 19.4% from 2012. The Company issued more than $125 million of long-term debt to refinance maturing notes and bank debt at the end of 2013. The new debt will reduce Sensient’s borrowing costs, and reflects the confidence investors have in Sensient’s strong balance sheet and future earnings. Sensient’s total debt to capital ratio was 22.2% at December 31, 2013, compared to 23.5% at December 31, 2012. Debt to EBITDA was 1.58 at December 31, 2013. Before restructuring costs, debt to EBITDA at December 31, 2013, was 1.39, an improvement from 1.48 at December 31, 2012.
Additional information on the results is included below.
NON-GAAP FINANCIAL MEASURES
The table below reconciles the reported 2013 results to those results before the impact of restructuring costs, which are non-GAAP financial measures. The company has included non-GAAP financial measures to remove the costs related to the restructuring plan and provide investors with a view of operating performance excluding the restructuring costs.
Reported | Restructuring | Adjusted | Reported | |||||||||||||
($’s in thousands) | 2013 | Impact | 2013 | 2012 | ||||||||||||
| Revenue | $ | 1,467,550 | $ | — | $ | 1,467,550 | $ | 1,459,050 | ||||||||
| Cost of products sold | 991,648 | 1,840 | 989,808 | 995,907 | ||||||||||||
| Selling and administrative expenses | 303,540 | 29,895 | 273,645 | 271,935 | ||||||||||||
| Operating income | 172,362 | (31,735 | ) | 204,097 | 191,208 | |||||||||||
| Interest expense | 16,147 | 16,147 | 16,901 | |||||||||||||
| Earnings before income taxes | 156,215 | (31,735 | ) | 187,950 | 174,307 | |||||||||||
| Income taxes | 42,920 | (9,776 | ) | 52,696 | 50,399 | |||||||||||
| Net earnings | $ | 113,295 | $ | (21,959 | ) | $ | 135,254 | $ | 123,908 | |||||||
| Diluted earnings per share | $ | 2.27 | $ | (0.44 | ) | $ | 2.71 | $ | 2.49 | |||||||
| Gross margin | 32.4 | % | 32.6 | % | 31.7 | % | ||||||||||
| Selling and administrative expenses | 20.7 | % | 18.6 | % | 18.6 | % | ||||||||||
| Operating margin | 11.7 | % | 13.9 | % | 13.1 | % | ||||||||||
15
RESULTS OF OPERATIONS
2013 vs. 2012
Sensient’s revenue was approximately $1.5 billion in both 2013 and 2012. Revenue in the Flavors & Fragrances Group was $881.3 million in 2013 and $875.3 million in 2012. Color Group revenue was $494.0 million in 2013 and $499.2 million in 2012. Corporate & Other revenue, which includes the Company’s operations in the Asia Pacific region, China and certain flavor operations in Central and South America, was $150.4 million in 2013 and $145.6 million in 2012. Foreign currency translation increased consolidated revenue in 2013 by approximately 0.1%. Additional information on group results can be found in the Segment Information section.

The Company’s gross margin was 32.4% in 2013, an increase of 70 basis points from 31.7% in 2012. The 2013 gross margin before the impact of restructuring costs was 32.6%. The impact of increased selling prices and favorable product mix more than offset higher manufacturing costs in 2013.
Selling and administrative expense as a percent of revenue was 20.7% in 2013 compared to 18.6% in 2012. The increase in selling and administrative expenses during 2013 was attributable to the Company’s restructuring costs recorded in 2013. Selling and administrative expense as a percent of revenue before the impact of restructuring costs in 2013 was 18.6%.
Operating income was $172.4 million in 2013 compared to $191.2 million in 2012. Before the $31.7 million of total restructuring costs, operating income for 2013 was $204.1 million, an increase of 6.7% from the prior year. Additional information on group results can be found in the Segment Information section.
Interest expense decreased 4.5% to $16.1 million in 2013 from $16.9 million in 2012. The decrease was due to lower average interest rates partially offset by higher average outstanding debt balances.
The effective income tax rate was 27.5% in 2013 and 28.9% in 2012. The effective tax rates for both 2013 and 2012 were reduced by discrete items, including the favorable resolution of prior years’ tax matters. In addition, the 2013 rate was impacted by restructuring costs. In total, these discrete items and the impact of restructuring costs reduced the effective tax rate for 2013 and 2012 by 2.0% and 2.2%, respectively.
| 2013 | 2012 | |||||||
| Rate before restructuring and discrete items | 29.5 | % | 31.1 | % | ||||
| Restructuring impact | (0.3 | %) | — | |||||
| Discrete items | (1.7 | %) | (2.2 | %) | ||||
| Reported effective tax rate | 27.5 | % | 28.9 | % | ||||
The effective tax rate for 2014 is expected to be between 31.0% and 32.0% prior to the recording of any discrete items.
SEGMENT INFORMATION
The Company determines its operating segments based on information utilized by the chief operating decision maker to allocate resources and assess performance. The Company’s reportable segments consist of the Flavors & Fragrances Group and the Color Group. The results of three additional operating segments, the Asia Pacific Group, the China Group and Flavors Central & South America, are reported in the Corporate & Other segment. Beginning in 2013, the Company moved certain of its cosmetic and pharmaceutical operations in Asia Pacific and China into the Color Group to consolidate management of those operations. The prior year results have been restated as a result of this change.
Flavors & Fragrances Revenue for the Flavors & Fragrances Group was $881.3 million in 2013 and $875.3 million in 2012. The Group reported higher selling prices ($15.4 million) and the favorable impact of foreign currency translation ($4.2 million), partially reduced by lower volumes ($13.6 million). Higher selling prices were reported in both natural ingredients and traditional flavors. The lower volumes were driven by natural ingredients in North America partially offset by higher volumes in traditional flavors.
Gross margins were 25.6% of revenue in both 2013 and 2012. The impact of higher selling prices offset an increase in manufacturing costs.
The Flavors & Fragrances Group operating income was $122.4 million in 2013 and $123.0 million in 2012. The decrease in operating income was primarily related to operations in Europe ($4.8 million), partially offset by higher operating income in North America ($4.2 million). The lower profit in Europe was driven by higher employee costs related to selling and technical personnel and other costs, partially offset by the impact of higher volume. The higher profit in North America was primarily due to higher selling prices partially offset by the impact of lower volumes and higher raw material costs. Operating income as a percent of revenue was 13.9% in 2013 and 14.1% in 2012 primarily for the reasons discussed above.
16
Color The Color Group revenue was $494.0 million in 2013 and $499.2 million in 2012. The decrease in revenue was primarily driven by lower sales of non-food colors ($9.4 million), partially offset by higher sales of food and beverage colors ($3.7 million). The lower sales of non-food colors were driven by lower volumes of OEM inkjet products as a result of the termination of a supply agreement by a major customer in early 2013. The Group has been replacing non-strategic products such as these with higher margin, value-added products.
Gross margin for the Color Group increased 230 basis points to 40.4% in 2013 from 38.1% in 2012. Higher selling prices, favorable product mix and favorable raw material costs were the primary reasons for the improved margins. The 2013 results reflect the Group’s strategy to focus on higher margin products and eliminate non-strategic business.
Color Group operating income in 2013 increased 7.5% to $103.6 million from $96.4 million in 2012. The increase in operating income was primarily attributable to food and beverage colors ($3.8 million) and non-food colors ($2.9 million). The higher operating income from food and beverage colors was primarily due to the impact of favorable volumes and raw material costs. The increase in operating income for non-food colors was primarily due to favorable product mix and raw material costs. Operating income as a percent of revenue increased 170 basis points to 21.0% in 2013 from 19.3% in 2012 primarily due to the reasons described above.
Corporate & Other The Corporate & Other segment includes the Asia Pacific region, China and certain of the Company’s flavor businesses in Central and South America, combined with the corporate office expenses.
Revenue for the Corporate & Other segment was $150.4 million and $145.6 million in 2013 and 2012, respectively. The increase was primarily related to higher volumes in Asia Pacific.
The Corporate & Other segment reported operating losses of $53.6 million and $28.2 million in 2013 and 2012, respectively. Before the impact of restructuring costs, the Corporate & Other segment reported operating losses of $21.9 million in 2013. The improvement in results before the impact of restructuring costs was primarily due to profit on higher volumes and favorable product mix in Asia Pacific and China and lower corporate expenses. Group performance is evaluated on operating income of the respective business units before restructuring charges which are reported in the Corporate & Other segment.
2012 vs. 2011
Sensient’s revenue was $1.46 billion in 2012 and $1.43 billion in 2011. Revenue in the Flavors & Fragrances Group was $875.3 million in 2012, an increase of 2.1% from $857.5 million in 2011. Color Group revenue was $499.2 million in 2012 and $496.8 million in 2011. Corporate & Other revenue, which includes the Company’s operations in the Asia Pacific region, China and certain flavor operations in Central and South America, increased 8.9% in 2012. Foreign currency translation decreased consolidated revenue in 2012 by approximately 2.6%. Additional information on group results can be found in the Segment Information section.
The Company’s gross margin was 31.7% in 2012, an increase of 30 basis points from 31.4% in 2011. The impact of increased selling prices and favorable product mix more than offset higher raw material costs in 2012.
Selling and administrative expense as a percent of revenue was 18.6% in 2012 compared to 18.1% in 2011. The increase in selling and administrative expenses during 2012 was primarily attributable to the Company’s continued expansion of its sales force to penetrate new and existing markets.
Operating income was $191.2 million in 2012 compared to $190.8 million in 2011. The increase was due to the increased revenue and gross margin discussed above. Additional information on group results can be found in the Segment Information section.
Interest expense decreased 13.1% to $16.9 million in 2012 from $19.4 million in 2011. The decrease is due to lower average interest rates partially offset by higher average outstanding debt balances.
The income tax rate was 28.9% in 2012 and 29.7% in 2011. The effective tax rates for both 2012 and 2011 were reduced by discrete items, including the favorable resolution of prior years’ tax matters. In total, these discrete items reduced the effective tax rate for 2012 and 2011 by 2.2% and 2.5%, respectively.
17
| 2012 | 2011 | |||||||
| Rate before discrete items | 31.1 | % | 32.2 | % | ||||
| Discrete items | (2.2 | %) | (2.5 | %) | ||||
| Reported effective tax rate | 28.9 | % | 29.7 | % | ||||
SEGMENT INFORMATION
Flavors & Fragrances Revenue for the Flavors & Fragrances Group was $875.3 million in 2012 and $857.5 million in 2011. The Group reported an increase in volumes ($27.2 million) and higher selling prices ($12.0 million), partially reduced by the unfavorable impact of foreign currency translation ($21.5 million). Higher selling prices were reported primarily in traditional flavors. The higher volumes were driven by both traditional flavors and natural ingredients in North America.
Gross margins were 25.6% of revenue in 2012 and 26.7% in 2011. The decrease was primarily due to higher raw material costs in natural ingredients.
The Flavors & Fragrances Group operating income was $123.0 million in 2012 and $129.4 million in 2011. The decrease in operating income was related to operations in North America ($4.8 million), Europe ($1.4 million) and the unfavorable impact of foreign currency translation ($1.7 million), partially offset by higher operating income in Mexico ($1.4 million). The lower profit in North America was driven by the higher raw material costs in natural ingredients. The lower profit in Europe was primarily due to higher costs. The higher profit in Mexico was due to favorable product mix combined with higher volumes and selling prices. Operating income as a percent of revenue was 14.1% in 2012 and 15.1% in 2011 primarily for the reasons discussed above.
Color The Color Group revenue was $499.2 million in 2012 and $496.8 million in 2011. The increase in revenue was driven by higher sales of non-food colors ($15.3 million) and higher sales of food and beverage colors ($4.9 million), partially offset by the unfavorable impact of foreign currency translation ($17.8 million). The higher sales of both food and beverage colors and non-food colors were driven by higher volumes and higher selling prices.
Gross margin for the Color Group increased 260 basis points to 38.1% in 2012 compared to 35.5% in 2011. Higher selling prices and favorable product mix more than offset increased raw material and manufacturing costs. The 2012 results reflect the Group’s strategy to focus on higher margin products and eliminate lower margin business.
Color Group operating income increased 4.2% to $96.4 million from $92.5 million in 2011. The increase in operating income was primarily attributable to higher sales of food and beverage colors ($6.7 million) and non-food colors ($0.6 million), partially reduced by the unfavorable impact of foreign exchange rates ($3.4 million). The higher operating income from food and beverage colors was primarily due to the impact of higher selling prices and favorable product mix. The increase in operating income for non-food colors was primarily due to the higher volumes, higher selling prices and favorable product mix, partially reduced by unfavorable raw material and manufacturing costs. Operating income as a percent of revenue increased 70 basis points to 19.3% from 18.6% in 2011 primarily due to the reasons described above.
Corporate & Other Revenue for the Corporate & Other segment was $145.6 million and $133.6 million in 2012 and 2011, respectively. The increase was primarily related to higher volumes in Asia Pacific.
The Corporate & Other segment reported operating losses of $28.2 million and $31.1 million in 2012 and 2011, respectively. The improvement in results was primarily due to the profit on higher volumes in Asia Pacific and lower expenses.
LIQUIDITY AND FINANCIAL POSITION
The Company’s financial position remains strong, enabling it to meet cash requirements for operations, acquisitions, capital expansion programs, share repurchases and dividend payments to shareholders. The Company intends to fund working capital requirements, principal and interest payments, acquisitions and other liabilities with cash provided by operations, to the extent available, and short-term and long-term borrowings under new and existing credit facilities.
The Company’s ratio of debt to total capital improved to 22.2% at December 31, 2013, compared to 23.5% and 24.2% at December 31, 2012 and 2011, respectively. The improvement in 2013 resulted primarily from an increase in equity driven by 2013 net income.
18

Net cash provided by operating activities was $153.6 million in 2013, $139.4 million in 2012 and $142.9 million in 2011. Operating cash flow provided the primary source of funds for operating needs, acquisitions, capital expenditures, shareholder dividends, share repurchases and net debt repayments. The increase in net cash provided by operating activities in 2013 was primarily due to a lower use of working capital partially offset by lower earnings due to the restructuring program. The decrease in cash from operating activities in 2012 was primarily due to a higher use of working capital partially offset by the impact of higher earnings.
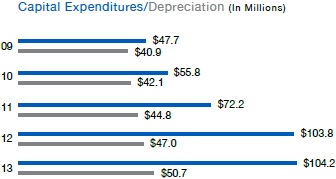
Net cash used in investing activities was $98.2 million in 2013, $102.7 million in 2012 and $74.0 million in 2011. Capital expenditures were $104.2 million in 2013, $103.8 million in 2012 and $72.2 million in 2011.
Net cash used in financing activities was $48.2 million in 2013, $48.8 million in 2012 and $52.9 million in 2011. The Company had a net reduction in debt of $3.7 million in 2013, a net increase in debt of $15.9 million in 2012 and a net reduction in debt of $14.2 million in 2011. In 2012, Sensient purchased $23.2 million of Company stock.
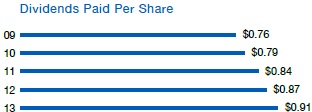
The Company has paid uninterrupted quarterly cash dividends since commencing public trading in its stock in 1962. The Company’s quarterly dividend was 23 cents per share beginning in the second quarter of 2013 when it was increased from 22 cents per share. Dividends paid per share were 91 cents in 2013, 87 cents in 2012 and 84 cents in 2011. Total dividends paid were $45.5 million, $43.4 million and $42.0 million in 2013, 2012 and 2011, respectively.
In 2013 and 2011, the Company was able to finance capital expenditures and dividend payments and still reduce debt levels. In 2012, the Company used cash provided by operating activities to fund most of its capital expenditures, dividend payments and purchases of Company stock. The Company maintains debt levels it considers prudent based on its cash flows, interest coverage and percentage of total debt to total capital.
The impact of inflation on both the Company’s financial position and its results of operations has been minimal and is not expected to significantly affect 2014 results.
ISSUER PURCHASES OF EQUITY SECURITIES
There were no purchases of Company stock in 2013 or 2011. Sensient purchased 0.6 million shares of Company stock in 2012 for a total cost of $23.2 million. On April 27, 2001, the Board approved a share repurchase program under which the Company is authorized to repurchase up to 5.0 million shares of Company stock in addition to amounts remaining from prior Board authorizations. As of December 31, 2013, 2.4 million shares were available to be repurchased under existing authorizations. The Company’s share repurchase program has no expiration date.
CRITICAL ACCOUNTING POLICIES
In preparing the financial statements in accordance with accounting principles generally accepted in the U.S., management is required to make estimates and assumptions that have an impact on the asset, liability, revenue and expense amounts reported. These estimates can also affect supplemental information disclosures of the Company, including information about contingencies, risk and financial condition. The Company believes, given current facts and circumstances, that its estimates and assumptions are reasonable, adhere to accounting principles generally accepted in the U.S. and are consistently applied. Inherent in the nature of an estimate or assumption is the fact that actual results may differ from estimates and estimates may vary as new facts and circumstances arise. The Company makes routine estimates and judgments in determining the net realizable value of accounts receivable, inventories, property, plant and equipment, and prepaid expenses. Management believes the Company’s most critical accounting estimates and assumptions are in the following areas:
19
Revenue Recognition The Company recognizes revenue (net of estimated discounts, allowances and returns) when title passes, the customer is obligated to pay the Company and the Company has no remaining obligations. Such recognition typically corresponds with the shipment of goods.
Goodwill Valuation The Company reviews the carrying value of goodwill annually utilizing several valuation methodologies, including a discounted cash flow model. The Company completed its annual goodwill impairment test under Accounting Standards Codification (“ASC”) 350, Intangibles – Goodwill and Other, in the third quarter of 2013. In conducting its annual test for impairment, the Company estimates the fair value for each of its reporting units and compares each of these values to the net book value of each reporting unit. Fair value is estimated using both a discounted cash flow analysis and an analysis of comparable company market values. If the fair value of a reporting unit exceeds its net book value, no impairment exists. The Company has three reporting units that had goodwill recorded and were tested for impairment. The Flavors & Fragrances reporting unit and the Asia Pacific reporting unit had fair values that were over 100% above their respective net book values. The fair value of the Color reporting unit had a fair value that was over 80% above its net book value. Changes in estimates of future cash flows caused by items such as unforeseen events or changes in market conditions could negatively affect the reporting units’ fair value and result in an impairment charge.
Income Taxes The Company estimates its income tax expense in each of the taxing jurisdictions in which it operates. The Company is subject to a tax audit in each of these jurisdictions, which could result in changes to the estimated tax expense. The amount of these changes would vary by jurisdiction and would be recorded when probable and estimable. These changes could impact the Company’s financial statements. Management has recorded valuation allowances to reduce the Company’s deferred tax assets to the amount that is more likely than not to be realized. Examples of deferred tax assets include deductions, net operating losses and tax credits that the Company believes will reduce its future tax payments. In assessing the future realization of these assets, management has considered future taxable income and ongoing tax planning strategies. An adjustment to the recorded valuation allowance as a result of changes in facts or circumstances could result in a significant change in the Company’s tax expense. The Company does not provide for deferred taxes on unremitted earnings of foreign subsidiaries which are considered to be invested indefinitely.
Commitments and Contingencies The Company is subject to litigation and other legal proceedings arising in the ordinary course of its businesses or arising under provisions related to the protection of the environment. Estimating liabilities and costs associated with these matters requires the judgment of management, who rely in part on information from Company legal counsel. When it is probable that the Company has incurred a liability associated with claims or pending or threatened litigation matters and the Company’s exposure is reasonably estimable, the Company records a charge against earnings. The Company recognizes related insurance reimbursement when receipt is deemed probable. The Company’s estimate of liabilities and related insurance recoveries may change as further facts and circumstances become known.
MARKET RISK FACTORS
The Company is exposed to market risks, including changes in interest rates, currency exchange rates and commodity prices. To manage the volatility relating to these exposures on a consolidated basis, the Company nets the exposures to take advantage of natural offsets. The Company also enters into various derivative transactions for some of the remaining exposures pursuant to the Company’s policies covering hedging practices. The financial impacts of these hedging instruments are offset by corresponding changes in the underlying exposures being hedged.
The Company does not hold or issue derivative financial instruments for trading purposes. Note 1 and Note 5 to the Consolidated Financial Statements include a discussion of the Company’s accounting policies for financial instruments.
20
A key part of the Company’s strategy is to expand into new geographic markets. Because the Company manufactures and sells its products throughout the world, it is exposed to movements in foreign currency exchange rates. The major foreign currency exposures involve the markets in Western Europe, Mexico and Canada. The primary purpose of the Company’s foreign currency hedging activities is to protect against the volatility associated with foreign currency sales, purchases of materials, and other assets and liabilities created during the normal course of business. The Company generally utilizes foreign exchange contracts with durations of less than 12 months that may or may not be designated as cash flow hedges under ASC 815, Derivatives and Hedging. The net fair value of these instruments, based on dealer quotes, was an asset of $0.2 million at December 31, 2013, and was negligible at December 31, 2012. At December 31, 2013, the potential gain or loss in the fair value of the Company’s outstanding foreign exchange contracts, assuming a hypothetical 10% fluctuation in the currencies of such contracts, would be approximately $3.0 million. However, any change in the value of the contracts, real or hypothetical, would be significantly offset by a corresponding change in the value of the underlying hedged items. In addition, this hypothetical calculation assumes that each exchange rate would change in the same direction relative to the U.S. dollar.
The Company has certain debt denominated in Swiss Francs and Euros. These non-derivative debt instruments act as partial hedges of the Company’s Swiss Franc and Euro net asset positions. The potential increase or decrease in the annual U.S. dollar interest expense of the Company’s outstanding foreign currency-denominated debt, assuming a hypothetical 10% fluctuation in the currencies of such debt, would be approximately $0.2 million at December 31, 2013. However, any change in interest expense from fluctuations in currency, real or hypothetical, would be significantly offset by a corresponding change in the value of the foreign income before interest. In addition, this hypothetical calculation assumes that each exchange rate would change in the same direction relative to the U.S. dollar.
The Company manages its debt structure and interest rate risk through the use of fixed rate and floating rate debt and through the use of derivatives. The Company’s primary exposure is to interest rates in the U.S. and Western Europe. At December 31, 2013, the potential increase or decrease in annual interest expense, assuming a hypothetical 10% fluctuation in interest rates of floating rate debt, would be approximately $0.1 million.
The Company is the purchaser of certain commodities, such as corn, sugar, soybean meal and fruits. The Company generally purchases these commodities based upon market prices that are established with the vendor as part of the purchase process. In general, the Company does not use commodity financial instruments to hedge commodity prices due to a high correlation between the commodity cost and the ultimate selling price of the Company’s products. On occasion, the Company may enter into non-cancelable forward purchase contracts, as deemed appropriate, to reduce the effect of price fluctuations on future manufacturing requirements.
CONTRACTUAL OBLIGATIONS
The Company is subject to certain contractual obligations, including long-term debt, operating leases, manufacturing purchases and pension benefit obligations. The Company has unrecognized tax benefits of $5.3 million as of December 31, 2013. However, the Company cannot make a reasonably reliable estimate of the period of potential cash settlement of the liabilities and, therefore, has not included unrecognized tax benefits in the following table of significant contractual obligations as of December 31, 2013.
PAYMENTS DUE BY PERIOD
| (in thousands) | Total | 1 year | 2-3 years | 4-5 years | > 5 years | |||||||||||||||
| Long-term debt | $ | 348,124 | $ | 12,408 | $ | 92,151 | $ | 116,000 | $ | 127,565 | ||||||||||
| Interest payments on long-term debt | 53,436 | 12,762 | 23,446 | 12,874 | 4,354 | |||||||||||||||
| Operating lease obligations | 17,624 | 7,473 | 8,196 | 1,758 | 197 | |||||||||||||||
| Manufacturing purchase commitments | 128,724 | 98,580 | 28,933 | 1,211 | — | |||||||||||||||
| Pension funding obligations | 61,631 | 22,906 | 15,885 | 4,555 | 18,285 | |||||||||||||||
| Total contractual obligations | $ | 609,539 | $ | 154,129 | $ | 168,611 | $ | 136,398 | $ | 150,401 | ||||||||||
21
NEW PRONOUNCEMENTS
On January 1, 2013, the Company adopted ASU No. 2013-02, Comprehensive Income (Topic 220): Reporting of Amounts Reclassified Out of Accumulated Other Comprehensive Income, which requires companies to report the effect on the line items for significant items reclassified out of other comprehensive income to net income, prospectively. The Company has included this disclosure in Note 8 of these Consolidated Financial Statements. The adoption of this ASU had no impact on the Company’s financial condition or results of operations.
On January 1, 2013, the Company adopted ASU No. 2012-02, Intangibles – Goodwill and Other (Topic 350): Testing Indefinite-Lived Intangible Assets for Impairment. This ASU gives companies the option to perform a qualitative assessment to determine whether further indefinite-lived intangible asset impairment testing is necessary. If, as result of the qualitative assessment, it is determined that it is more likely than not that an indefinite-lived intangible asset is impaired, the quantitative impairment test is required. Otherwise no further testing is required. The adoption of this ASU had no impact on the Company’s financial condition or results of operations.
OFF-BALANCE SHEET ARRANGEMENTS
The Company had no off-balance sheet arrangements as of December 31, 2013.
FORWARD-LOOKING STATEMENTS
This document contains forward-looking statements that reflect management’s current assumptions and estimates of future economic circumstances, industry conditions, Company performance and financial results. Forward-looking statements include statements in the future tense, statements referring to any period after December 31, 2013, and statements including the terms “expect,” “believe,” “anticipate” and other similar terms that express expectations as to future events or conditions. The Private Securities Litigation Reform Act of 1995 provides a safe harbor for such forward-looking statements. Such forward-looking statements are not guarantees of future performance and involve known and unknown risks, uncertainties and other factors that could cause actual events to differ materially from those expressed in those statements. A variety of factors could cause the Company’s actual results and experience to differ materially from the anticipated results. These factors and assumptions include the pace and nature of new product introductions by the Company’s customers; the Company’s ability to successfully implement its growth strategies; the outcome of the Company’s various productivity-improvement and cost-reduction efforts or other restructuring or relocation activities; changes in costs of raw materials and energy; industry and economic factors related to the Company’s domestic and international business; competition from other suppliers of colors, flavors and fragrances; growth or contraction in markets for products in which the Company competes; terminations and other changes in customer relationships; industry acceptance of price increases; currency exchange rate fluctuations; cost and availability of credit; and the matters discussed above including the critical accounting policies described therein. The Company does not undertake to publicly update or revise its forward-looking statements even if experience or future changes make it clear that any projected results expressed or implied therein will not be realized.
22
Consolidated Statements of Earnings
| (in thousands except per share amounts) Years ended December 31, | 2013 | 2012 | 2011 | |||||||||
| Revenue | $ | 1,467,550 | $ | 1,459,050 | $ | 1,430,789 | ||||||
| Cost of products sold | 991,648 | 995,907 | 981,137 | |||||||||
| Selling and administrative expenses | 303,540 | 271,935 | 258,829 | |||||||||
| Operating Income | 172,362 | 191,208 | 190,823 | |||||||||
| Interest expense | 16,147 | 16,901 | 19,439 | |||||||||
| Earnings Before Income Taxes | 156,215 | 174,307 | 171,384 | |||||||||
| Income taxes | 42,920 | 50,399 | 50,900 | |||||||||
| Net Earnings | $ | 113,295 | $ | 123,908 | $ | 120,484 | ||||||
| Earnings per share: | ||||||||||||
| Basic | $ | 2.28 | $ | 2.50 | $ | 2.42 | ||||||
| Diluted | $ | 2.27 | $ | 2.49 | $ | 2.41 | ||||||
| Average common shares outstanding: | ||||||||||||
| Basic | 49,755 | 49,596 | 49,746 | |||||||||
| Diluted | 49,934 | 49,822 | 49,937 | |||||||||
See notes to consolidated financial statements.
23
Consolidated Statements of Comprehensive Income
| (in thousands) Years ended December 31, | 2013 | 2012 | 2011 | |||||||||
| Net earnings | $ | 113,295 | $ | 123,908 | $ | 120,484 | ||||||
| Unrealized (loss) gain on cash flow hedges, arising during the period net of tax of $71, $471 and $356, respectively | (212 | ) | (1,212 | ) | 914 | |||||||
| Reclassification adjustment for cash flow hedges included in net income, net of tax of $21, $335 and $272, respectively | 78 | 862 | (699 | ) | ||||||||
| Pension adjustment, net of tax of $3,675, $1,040 and $2,536, respectively | 5,294 | (2,216 | ) | 3,652 | ||||||||
| Tax effect on losses previously recorded in other comprehensive income | — | 16,836 | — | |||||||||
| Foreign currency translation on net investment hedges | (4,020 | ) | (1,251 | ) | 2,532 | |||||||
| Tax effect of current year activity on net investment hedges | 1,810 | — | — | |||||||||
| Foreign currency translation on long term intercompany loans | 5,781 | (1,540 | ) | 752 | ||||||||
| Other foreign currency translation | 1,856 | 22,984 | (31,569 | ) | ||||||||
| Total Comprehensive Income | $ | 123,882 | $ | 158,371 | $ | 96,066 | ||||||
See notes to consolidated financial statements.
24
Consolidated Balance Sheets
| (in thousands except share and per share amounts) December 31, | 2013 | 2012 | ||||||
| Assets | ||||||||
| Current Assets: | ||||||||
| Cash and cash equivalents | $ | 19,836 | $ | 15,062 | ||||
| Trade accounts receivable, less allowance for losses of $4,327 and $3,045, respectively | 233,751 | 237,626 | ||||||
| Inventories | 474,452 | 442,714 | ||||||
| Prepaid expenses and other current assets | 38,079 | 41,799 | ||||||
| Deferred income taxes | 23,707 | 14,153 | ||||||
| Total current assets | 789,825 | 751,354 | ||||||
| Other assets | 47,786 | 47,685 | ||||||
| Intangible assets – at cost, less accumulated amortization of $15,634 and $14,353, respectively | 10,546 | 11,578 | ||||||
| Goodwill | 457,269 | 451,318 | ||||||
| Property, Plant and Equipment: | ||||||||
| Land | 56,343 | 53,387 | ||||||
| Buildings | 374,388 | 339,732 | ||||||
| Machinery and equipment | 751,267 | 735,237 | ||||||
| Construction in progress | 55,236 | 41,999 | ||||||
| 1,237,234 | 1,170,355 | |||||||
| Less accumulated depreciation | (671,926 | ) | (655,647 | ) | ||||
| 565,308 | 514,708 | |||||||
| Total assets | $ | 1,870,734 | $ | 1,776,643 | ||||
| Liabilities and Shareholders’ Equity | ||||||||
| Current Liabilities: | ||||||||
| Trade accounts payable | $ | 99,117 | $ | 96,283 | ||||
| Accrued salaries, wages and withholdings from employees | 32,669 | 27,162 | ||||||
| Other accrued expenses | 78,579 | 56,946 | ||||||
| Income taxes | 5,478 | 3,797 | ||||||
| Short-term borrowings | 7,050 | 20,048 | ||||||
| Total current liabilities | 222,893 | 204,236 | ||||||
| Deferred income taxes | 19,956 | 13,032 | ||||||
| Other liabilities | 8,539 | 10,971 | ||||||
| Accrued employee and retiree benefits | 28,538 | 60,527 | ||||||
| Long-term debt | 348,124 | 333,979 | ||||||
| Shareholders’ Equity: | ||||||||
| Common stock, par value $0.10 a share, authorized 100,000,000 shares; issued 53,954,874 shares | 5,396 | 5,396 | ||||||
| Additional paid-in capital | 105,119 | 98,253 | ||||||
| Earnings reinvested in the business | 1,217,874 | 1,150,092 | ||||||
| Treasury stock, 4,105,827 and 4,264,821 shares, respectively, at cost | (91,707 | ) | (95,258 | ) | ||||
| Accumulated other comprehensive income (loss) | 6,002 | (4,585 | ) | |||||
| 1,242,684 | 1,153,898 | |||||||
| Total liabilities and shareholders’ equity | $ | 1,870,734 | $ | 1,776,643 | ||||
See notes to consolidated financial statements.
25
Consolidated Statements of Cash Flows
| (in thousands) Years ended December 31, | 2013 | 2012 | 2011 | |||||||||
| Cash Flows from Operating Activities | ||||||||||||
| Net earnings | $ | 113,295 | $ | 123,908 | $ | 120,484 | ||||||
| Adjustments to arrive at net cash provided by operating activities: | ||||||||||||
| Depreciation and amortization | 52,016 | 48,352 | 46,099 | |||||||||
| Share-based compensation | 8,430 | 10,086 | 7,819 | |||||||||
| Loss (gain) on assets | 695 | (869 | ) | (4,323 | ) | |||||||
| Deferred income taxes | (6,178 | ) | 2,916 | (3,138 | ) | |||||||
| Changes in operating assets and liabilities: | ||||||||||||
| Trade accounts receivable | 3,466 | (15,158 | ) | (5,095 | ) | |||||||
| Inventories | (30,217 | ) | (23,125 | ) | (28,391 | ) | ||||||
| Prepaid expenses and other assets | 616 | (9,405 | ) | (1,825 | ) | |||||||
| Accounts payable and other accrued expenses | 3,606 | 225 | 6,299 | |||||||||
| Accrued salaries, wages and withholdings from employees | 5,384 | (1,209 | ) | 3,075 | ||||||||
| Income taxes | (100 | ) | (1,689 | ) | (3,148 | ) | ||||||
| Other liabilities | 2,540 | 5,334 | 5,021 | |||||||||
| Net cash provided by operating activities | 153,553 | 139,366 | 142,877 | |||||||||
| Cash Flows from Investing Activities | ||||||||||||
| Acquisition of property, plant and equipment | (104,246 | ) | (103,806 | ) | (72,200 | ) | ||||||
| Proceeds from sale of assets | 6,225 | 1,364 | 2,076 | |||||||||
| Acquisition of new businesses, net of cash acquired | — | — | (3,706 | ) | ||||||||
| Other investing activities | (208 | ) | (242 | ) | (207 | ) | ||||||
| Net cash used in investing activities | (98,229 | ) | (102,684 | ) | (74,037 | ) | ||||||
| Cash Flows from Financing Activities | ||||||||||||
| Proceeds from additional borrowings | 194,973 | 73,903 | 184,074 | |||||||||
| Debt payments | (198,686 | ) | (58,052 | ) | (198,259 | ) | ||||||
| Purchase of treasury stock | — | (23,154 | ) | — | ||||||||
| Dividends paid | (45,513 | ) | (43,426 | ) | (41,968 | ) | ||||||
| Proceeds from options exercised and other equity transactions | 1,007 | 1,957 | 3,205 | |||||||||
| Net cash used in financing activities | (48,219 | ) | (48,772 | ) | (52,948 | ) | ||||||
| Effect of exchange rate changes on cash and cash equivalents | (2,331 | ) | 4,297 | (7,292 | ) | |||||||
| Net increase (decrease) in cash and cash equivalents | 4,774 | (7,793 | ) | 8,600 | ||||||||
| Cash and cash equivalents at beginning of year | 15,062 | 22,855 | 14,255 | |||||||||
| Cash and cash equivalents at end of year | $ | 19,836 | $ | 15,062 | $ | 22,855 | ||||||
| Cash paid during the year for: | ||||||||||||
| Interest | $ | 16,168 | $ | 16,897 | $ | 19,642 | ||||||
| Income taxes | 47,436 | 53,492 | 55,570 | |||||||||
| Capitalized interest | 1,875 | 1,601 | 1,240 | |||||||||
See notes to consolidated financial statements.
26
Consolidated Statements of Shareholders’ Equity
| Common | Additional Paid-in | Earnings Reinvested in the | Treasury Stock | Accumulated Other Comprehensive | |||||||||||||||||||||
| (in thousands except share and per share amounts) | Stock | Capital | Business | Shares | Amount | Income (Loss) | |||||||||||||||||||
| Balances at December 31, 2010 | $ | 5,396 | $ | 89,027 | $ | 991,094 | 4,345,712 | $ | (87,102 | ) | $ | (14,630 | ) | ||||||||||||
| Net earnings | 120,484 | ||||||||||||||||||||||||
| Other comprehensive income | (24,418 | ) | |||||||||||||||||||||||
| Cash dividends paid – $0.84 per share | (41,968 | ) | |||||||||||||||||||||||
| Share-based compensation | 7,819 | ||||||||||||||||||||||||
| Stock options exercised | 242 | (120,368 | ) | 2,412 | |||||||||||||||||||||
| Nonvested stock issued upon vesting | (3,526 | ) | (175,972 | ) | 3,526 | ||||||||||||||||||||
| Benefit plans | 148 | (11,361 | ) | 229 | |||||||||||||||||||||
| Other | 477 | ||||||||||||||||||||||||
| Balances at December 31, 2011 | 5,396 | 94,187 | 1,069,610 | 4,038,011 | (80,935 | ) | (39,048 | ) | |||||||||||||||||
| Net earnings | 123,908 | ||||||||||||||||||||||||
| Other comprehensive income | 34,463 | ||||||||||||||||||||||||
| Cash dividends paid – $0.87 per share | (43,426 | ) | |||||||||||||||||||||||
| Share-based compensation | 10,086 | ||||||||||||||||||||||||
| Stock options exercised | 52 | (66,579 | ) | 1,438 | |||||||||||||||||||||
| Nonvested stock issued upon vesting | (6,999 | ) | (313,812 | ) | 6,999 | ||||||||||||||||||||
| Benefit plans | 388 | (22,925 | ) | 480 | |||||||||||||||||||||
| Purchase of treasury stock | 626,251 | (23,154 | ) | ||||||||||||||||||||||
| Other | 539 | 3,875 | (86 | ) | |||||||||||||||||||||
| Balances at December 31, 2012 | 5,396 | 98,253 | 1,150, 092 | 4,264,821 | (95,258 | ) | (4,585 | ) | |||||||||||||||||
| Net earnings | 113,295 | ||||||||||||||||||||||||
| Other comprehensive income | 10,587 | ||||||||||||||||||||||||
| Cash dividends paid – $0.91 per share | (45,513 | ) | |||||||||||||||||||||||
| Share-based compensation | 8,430 | ||||||||||||||||||||||||
| Stock options exercised | (63 | ) | (47,584 | ) | 1,063 | ||||||||||||||||||||
| Nonvested stock issued upon vesting | (2,113 | ) | (94,600 | ) | 2,113 | ||||||||||||||||||||
| Benefit plans | 385 | (26,635 | ) | 595 | |||||||||||||||||||||
| Other | 227 | 9,825 | (220 | ) | |||||||||||||||||||||
| Balances at December 31, 2013 | $ | 5,396 | $ | 105,119 | $ | 1,217,874 | 4,105,827 | $ | (91,707 | ) | $ | 6,002 | |||||||||||||
See notes to consolidated financial statements.
27
Notes to Consolidated Financial Statements
Years ended December 31, 2013, 2012 and 2011
1. SUMMARY OF SIGNIFICANT ACCOUNTING POLICIES
Principles of Consolidation and Basis of Presentation The consolidated financial statements include the accounts of Sensient Technologies Corporation and its subsidiaries (the “Company”). All significant intercompany accounts and transactions are eliminated.
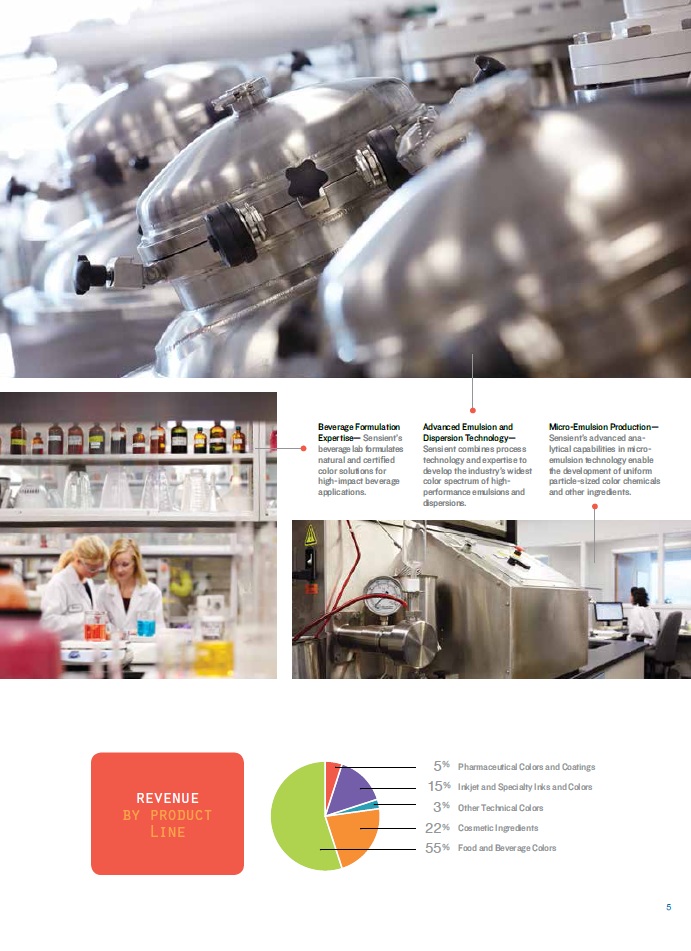
The Company is a leading global manufacturer and marketer of colors, flavors and fragrances. The Company uses advanced technologies at facilities around the world to develop specialty food and beverage systems, cosmetic and pharmaceutical systems, inkjet and specialty inks and colors, and other specialty and fine chemicals. The Company’s reportable segments consist of the Flavors & Fragrances and Color Groups, which are managed on a products and services basis. The Asia Pacific Group, China Group and certain of the Company’s flavor businesses in Central and South America (Flavors Central & South America), which are managed on a geographic basis, are included in Corporate & Other.
Use of Estimates The preparation of the consolidated financial statements in conformity with accounting principles generally accepted in the United States requires management to make estimates and assumptions that affect reported amounts of assets, liabilities, revenue and expenses during the reporting period and the disclosure of contingent assets and liabilities at the date of the financial statements. Actual results could differ from those estimates.
Revenue Recognition The Company recognizes revenue (net of estimated discounts, allowances and returns) when title to goods passes, the customer is obligated to pay the Company and the Company has no remaining obligations. Such recognition typically corresponds with the shipment of goods.
Cost of Products Sold Cost of products sold includes materials, labor and overhead expenses incurred in the manufacture of our products. Cost of products sold also includes charges for obsolete and slow moving inventories, as well as costs for quality control, purchasing and receiving costs, inspection costs, warehousing costs, internal transfer costs, other costs of our internal distribution network and costs incurred for shipping and handling. The Company records fees billed to customers for shipping and handling as revenue.
Selling and Administrative Expenses Selling and administrative expenses primarily include the salaries and related costs for executive, finance, accounting, human resources, information technology, research and development and legal personnel as well as salaries and related costs of salespersons and commissions paid to external sales agents.
Cash Equivalents The Company considers all highly liquid investments with maturities of three months or less at the date of acquisition as cash equivalents.
Accounts Receivable Receivables are recorded at their face amount, less an allowance for doubtful accounts. The allowance for doubtful accounts is based on customer-specific analysis and general matters such as current assessments of past due balances and economic conditions. Specific accounts are written off against the allowance for doubtful accounts when it is deemed that the receivable is no longer collectible.
Inventories Inventories are stated at the lower of cost or market. Market is determined on the basis of estimated realizable values. Cost is determined using the first-in, first-out (“FIFO”) method with the exception of certain locations of the Flavors & Fragrances Group where cost is determined using a weighted average method. Inventories include finished and in-process products totaling $317.1 million and $301.6 million at December 31, 2013 and 2012, respectively, and raw materials and supplies of $157.4 million and $141.1 million at December 31, 2013 and 2012, respectively.
Property, Plant and Equipment Property, plant and equipment are recorded at cost reduced by accumulated depreciation. Depreciation is provided over the estimated useful life of the related asset using the straight-line method for financial reporting. The estimated useful lives for buildings and leasehold improvements range from 5 to 40 years. Machinery and equipment have estimated useful lives ranging from 3 to 20 years. Interest costs on significant projects constructed or developed for the Company’s own use are capitalized as part of the asset.
Goodwill and Other Intangible Assets The carrying value of goodwill is evaluated for impairment on an annual basis or when an indicator of impairment occurs. The impairment assessment includes comparing the carrying amount of net assets, including goodwill, of each reporting unit to its respective fair value as of the date of the assessment. Fair value was estimated based upon an evaluation of the reporting unit’s estimated future discounted cash flow as well as the public trading and private transaction valuation multiples for comparable companies. Such determination of fair value yielded no impairment in 2013, 2012 or 2011.
The cost of intangible assets with determinable useful lives is amortized on a straight-line basis to reflect the pattern of economic benefits consumed, ranging from 5 to 20 years. These assets include technological know-how, customer relationships, patents, trademarks and non-compete agreements, among others.
28
Impairment of Long-lived Assets The Company reviews long-lived assets for impairment whenever events or changes in business circumstances indicate that the carrying amount of the assets may not be fully recoverable. The Company performs undiscounted cash flow analyses to determine if potential impairment exists. If impairment is determined to exist, any related impairment loss is calculated based on the difference between fair value and carrying value. Impairment losses were recorded as a result of the Company’s 2013 restructuring program. See Note 12, Restructuring Charges, for additional information.
Financial Instruments The Company may use derivative financial instruments for the purpose of hedging currency and interest rate exposures which exist as part of ongoing business operations. As a policy, the Company does not engage in speculative or leveraged transactions, nor does the Company hold or issue financial instruments for trading purposes.
Hedge effectiveness is determined by how closely the changes in the fair value of the hedging instrument offset the changes in the fair value or cash flows of the hedged item. Hedge accounting is permitted only if the hedging relationship is expected to be highly effective at the inception of the transaction and on an ongoing basis. Any ineffective portions are recognized in earnings immediately.
Interest Rate Hedging The Company is exposed to interest rate risk through its corporate borrowing activities. The objective of the Company’s interest rate risk management activities is to manage the levels of the Company’s fixed and floating interest rate exposure to be consistent with the Company’s preferred mix. The interest rate risk management program may include entering into interest rate swaps, which qualify as fair value hedges, when there is a desire to modify the Company’s exposure to interest rates. Gains or losses on fair value hedges are recognized in earnings, net of gains and losses on the fair value of the hedged instruments.
Cash Flow Hedges The primary objectives of the foreign exchange risk management activities are to understand and mitigate the impact of potential foreign exchange fluctuations on the Company’s financial results and its economic well-being. Generally, these risk management transactions involve the use of foreign currency derivatives to protect against exposure resulting from recorded accounts receivable and payable. The Company may utilize forward exchange contracts, generally with maturities of less than 12 months, which qualify as cash flow hedges. These foreign exchange contracts are intended to offset the effect of exchange rate fluctuations on recorded intercompany receivables and payables. Gains and losses on these instruments are deferred in accumulated other comprehensive income (loss) (“OCI”) until the underlying transaction is recognized in earnings.
The Company’s existing cash flow hedges are highly effective. As a result, any current impact on earnings due to cash flow hedge ineffectiveness is immaterial.
Net Investments Hedging The Company may enter into foreign-denominated debt to be used as a non-derivative instrument to hedge the Company’s net investment in foreign subsidiaries. The change in the carrying amount of the foreign-denominated debt on the Company’s books, attributable to changes in the spot foreign exchange rate, is a hedge of the net investment in its foreign subsidiaries. Changes in the fair value of debt designated as a net investment hedge are recorded in foreign currency translation in OCI.
Commodity Purchases The Company purchases certain commodities in the normal course of business that result in physical delivery of the goods and, hence, are excluded from Accounting Standards Codification (“ASC”) 815, Derivatives and Hedging.
Translation of Foreign Currencies For all significant foreign operations, the functional currency is the local currency. Assets and liabilities of foreign operations are translated into U.S. dollars at current exchange rates. Revenue and expense accounts are translated into U.S. dollars at average exchange rates prevailing during the year. Adjustments resulting from the translation of foreign accounts into U.S. dollars are recorded in foreign currency translation in OCI. Transaction gains and losses that occur as a result of transactions denominated in non-functional currencies are included in earnings and were not significant during the three-year period ended December 31, 2013.
Share-Based Compensation Share-based compensation expense is recognized during the vesting period of each award as summarized in Note 6, Share-Based Compensation.
Income Taxes The Company recognizes a current tax liability or asset for the estimated taxes payable or refundable on tax returns for the current year and a deferred tax liability or asset for the estimated future tax effects attributable to temporary differences and carryforwards. The measurement of current and deferred tax liabilities and assets is based on provisions of enacted tax law. Deferred tax assets are reduced, if necessary, by the amount of any tax benefits for which the utilization of the asset is not considered likely.
Earnings Per Share The difference between basic and diluted earnings per share (“EPS“) is the dilutive effect of stock options and nonvested stock. Diluted EPS assumes that nonvested stock has vested and all dilutive stock options, for which the average market price exceeds the exercise price (in-the-money), are exercised. Stock options for which the exercise price exceeds the average market price (out-of-the-money) have an anti-dilutive effect on EPS, and accordingly, are excluded from the calculation. Weighted-average common shares for the computation of EPS were:
29
| (in thousands) | 2013 | 2012 | 2011 | |||||||||
| Basic weighted-average shares outstanding | 49,755 | 49,596 | 49,746 | |||||||||
| Diluted weighted-average shares outstanding | 49,934 | 49,822 | 49,937 | |||||||||
In 2013, 2012 and 2011 there were no anti-dilutive stock options. All earnings per share amounts are presented on a diluted basis unless otherwise noted.
Accumulated Other Comprehensive Income (Loss) Accumulated OCI is composed primarily of foreign currency translation, pension liability and unrealized gains or losses on cash flow hedges. See Note 8, Accumulated Other Comprehensive Income, for additional information.
Research and Development Research and development costs are recorded in selling and administrative expenses in the year they are incurred. Research and development costs were $34.5 million, $34.7 million and $33.2 million during the years ended December 31, 2013, 2012 and 2011, respectively.
Advertising Advertising costs are recorded in selling and administrative expenses as they are incurred. Advertising costs were $1.6 million, $2.2 million and $2.4 million during the years ended December 31, 2013, 2012 and 2011, respectively.
Environmental Liabilities The Company records liabilities related to environmental remediation obligations when estimated future expenditures are probable and reasonably estimable. Such accruals are adjusted as further information becomes available or as circumstances change. Estimated future expenditures are discounted to their present value when the timing and amount of future cash flows are fixed and readily determinable. Recoveries of remediation costs from other parties, if any, are recognized as assets when their receipt is assured.
Subsequent Events The Company performed an evaluation of subsequent events through the date these financial statements were issued and no such events were identified.
New Pronouncements On January 1, 2013, the Company adopted ASU No. 2013-02, Comprehensive Income (Topic 220): Reporting of Amounts Reclassified Out of Accumulated Other Comprehensive Income, which requires companies to report the effect on the line items for significant items reclassified out of other comprehensive income to net income, prospectively. The Company has included this disclosure in Note 8 of these Consolidated Financial Statements. The adoption of this ASU had no impact on the Company’s financial condition or results of operations.
On January 1, 2013, the Company adopted ASU No. 2012-02, Intangibles – Goodwill and Other (Topic 350): Testing Indefinite-Lived Intangible Assets for Impairment. This ASU gives companies the option to perform a qualitative assessment to determine whether further indefinite-lived intangible asset impairment testing is necessary. If, as a result of the qualitative assessment, it is determined that it is more likely than not that an indefinite-lived intangible asset is impaired, the quantitative impairment test is required. Otherwise no further testing is required. The adoption of this ASU had no impact on the Company’s financial condition or results of operations.
2. ACQUISITIONS
There were no acquisitions during 2013 and 2012.
In 2011, the Company acquired the remaining outstanding stock of Les Colorants Wackherr do Brasil (“Les Colorants”), a distributor of cosmetic ingredients in Brazil, for $4.6 million, which is net of the cash acquired.
Prior to the acquisition, the Company owned 50% of Les Colorants, a non-controlling interest. ASC 805, Business Combinations, requires that upon acquiring a controlling interest, the acquirer remeasure its previously held interest in the acquiree at its acquisition date fair value and recognize the gain or loss in earnings. The Company revalued its previously held interest in Les Colorants using a market approach and recognized a pre-tax gain of $3.6 million in earnings in the fourth quarter of 2011, included in selling and administrative expense in the Corporate & Other segment in the Consolidated Statement of Earnings. There is no tax impact of the gain. The final allocation of the purchase price for Les Colorants combined with the revaluation of the previously held interest resulted in goodwill and intangibles of $8.7 million. This acquisition has been accounted for as a purchase and the results of the entity’s full operations have been included in the consolidated financial statements in the Color segment since the date of acquisition.
Also in 2011, the Company completed the acquisition of the remaining outstanding stock of LCW Polska, a cosmetic color and ingredients company located in Poznań, Poland. Prior to the acquisition, the Company owned 75% of LCW Polska. The acquisition is not material to the Company’s consolidated financial statements.
30
3. GOODWILL AND INTANGIBLE ASSETS
At December 31, 2013 and 2012, goodwill is the only intangible asset that is not subject to amortization. The following table summarizes intangible assets with determinable useful lives by major category as of December 31, 2013 and 2012:
| Weighted Average | 2013 | 2012 | ||||||||||||||||||
(in thousands except weighted average amortization years) | Amortization Years | Cost | Accumulated Amortization | Cost | Accumulated Amortization | |||||||||||||||
| Technological know-how | 20 | $ | 8,606 | $ | (5,328 | ) | $ | 8,443 | $ | (4,842 | ) | |||||||||
| Customer relationships | 20 | 7,944 | (4,359 | ) | 7,871 | (3,866 | ) | |||||||||||||
| Patents, trademarks, non-compete agreements and other | 18.8 | 9,630 | (5,947 | ) | 9,617 | (5,645 | ) | |||||||||||||
| Total finite-lived intangibles | 19.6 | $ | 26,180 | $ | (15,634 | ) | $ | 25,931 | $ | (14,353 | ) | |||||||||
Amortization of intangible assets was $1.3 million in 2013, $1.4 million in 2012 and $1.3 million in 2011. Estimated amortization expense each year for the five years subsequent to December 31, 2013, is $1.3 million in 2014 and $1.2 million in each year from 2015 through 2018.
The changes in goodwill for the years ended December 31, 2013 and 2012, by reportable business segment, were as follows:
| (in thousands) | Flavors & Fragrances | Color | Corporate & Other | Consolidated | ||||||||||||
| Balance as of December 31, 2011 | $ | 132,692 | $ | 307,379 | $ | 4,294 | $ | 444,365 | ||||||||
| Currency translation impact | 3,092 | 4,271 | (410 | ) | 6,953 | |||||||||||
| Balance as of December 31, 2012 | 135,784 | 311,650 | 3,884 | 451,318 | ||||||||||||
| Currency translation impact | 853 | 5,673 | (575 | ) | 5,951 | |||||||||||
| Balance as of December 31, 2013 | $ | 136,637 | $ | 317,323 | $ | 3,309 | $ | 457,269 | ||||||||
4. DEBT
Long-term Debt Long-term debt consisted of the following unsecured obligations at December 31:
| (in thousands) | 2013 | 2012 | ||||||
| 3.66% senior notes due November 2023 | $ | 75,000 | $ | — | ||||
| 3.06% Euro-denominated senior notes due November 2023 | 52,566 | — | ||||||
| 4.47% senior notes due November 2018 | 25,000 | 25,000 | ||||||
| 4.14% senior notes due November 2017 | 25,000 | 25,000 | ||||||
| 4.91% senior notes due through May 2017 | 99,000 | 110,000 | ||||||
| 3.77% senior notes due November 2016 | 25,000 | 25,000 | ||||||
| 7.31% senior notes due November 2013 | — | 25,000 | ||||||
| 5.85% Euro-denominated senior notes due November 2013 | — | 25,508 | ||||||
| Long-term revolving loan agreement | 43,982 | 95,419 | ||||||
| Various other notes | 2,576 | 3,052 | ||||||
| 348,124 | 333,979 | |||||||
| Less current maturities | — | — | ||||||
| Total long-term debt | $ | 348,124 | $ | 333,979 | ||||
In April 2013, the Company entered into an agreement to issue $75 million and €38 million in ten-year, fixed-rate, senior notes at fixed coupon rates of 3.66% and 3.06%, respectively. These notes were issued in November 2013 and proceeds have been used to repay maturing notes and bank debt.
The Company has a $350 million revolving loan facility that will mature in April 2016. Interest rates on borrowings under the credit facility are at LIBOR plus a margin based on the Company’s leverage ratio. The credit facility is used for liquidity needs.
The borrowings under the long-term revolving loan agreement had an average interest rate of 1.54% and 1.67% for the years ended December 31, 2013 and 2012, respectively.
The aggregate amounts of contractual maturities on long-term debt each year for the five years subsequent to December 31, 2013, are as follows: 2014, $12.4 million; 2015, $11.9 million; 2016, $80.3 million; 2017, $91.0 million; and 2018, $25.0 million.
The Company has approximately $12.4 million of long-term debt that matures in 2014. It is the Company’s intention to refinance these maturities under the long-term revolving loan agreement and accordingly, that maturing debt has been classified as long-term debt in the Consolidated Balance Sheet.
The Company has $299.7 million available under the revolving loan agreement and $41.4 million available under other lines of credit from several banks at December 31, 2013.
31
Substantially all of the senior loan agreements contain restrictions concerning interest coverage, borrowings, investments and tangible net worth amounts. The Company is in compliance with all of these restrictions at December 31, 2013. The following table summarizes the Company’s most restrictive loan covenants calculated in accordance with the applicable agreements as of December 31, 2013:
| (dollars in thousands) | Actual | Required | ||||||
| Debt to EBITDA (Maximum) | 1.40 | 3.50 | ||||||
| Net Worth (Minimum) | $ | 1,242,684 | $ | 625,000 | ||||
| Interest Coverage (Minimum) | 8.01 | 2.00 | ||||||
The Company has stand-by and trade letters of credit outstanding of $6.3 million and $7.5 million as of December 31, 2013 and 2012, respectively.
Short-term Borrowings The Company’s short-term borrowings consisted of the following items at December 31:
| (in thousands) | 2013 | 2012 | ||||||
| Uncommitted loans | $ | 4,600 | $ | 16,950 | ||||
| Loans of foreign subsidiaries | 2,450 | 3,098 | ||||||
| Total | $ | 7,050 | $ | 20,048 | ||||
The weighted-average interest rates on short-term borrowings were 2.16% and 1.98% at December 31, 2013 and 2012, respectively.
5. DERIVATIVE INSTRUMENTS AND HEDGING ACTIVITY
The Company may use derivative instruments for the purpose of hedging currency, commodity and interest rate exposures, which exist as part of ongoing business operations. As a policy, the Company does not engage in speculative or leveraged transactions, nor does the Company hold or issue financial instruments for trading purposes. Hedge effectiveness is determined by how closely the changes in the fair value of the hedging instrument offset the changes in the fair value or cash flows of the hedged transaction. Hedge accounting, which generally results in the deferral of derivative gains and losses until such time as the underlying transaction is recognized in net earnings, is permitted only if the hedging relationship is expected to be highly effective at the inception of the transaction and on an ongoing basis. Any ineffective portions are recognized in earnings immediately.
The Company manages its exposure to foreign exchange risk by the use of forward exchange contracts to reduce the effect of fluctuating foreign currencies on short-term foreign currency denominated intercompany transactions, nonfunctional currency raw material purchases, non-functional currency sales and other known foreign currency exposures. These forward exchange contracts generally have maturities of less than twelve months. The Company also uses certain debt denominated in foreign currencies to manage the Company’s net asset positions of its foreign subsidiaries. The Company’s primary hedging activities and their accounting treatment are summarized below:
Forward Exchange Contracts The forward exchange contracts that have been designated as hedges are accounted for as cash flow hedges. The Company had $29.6 million and $18.9 million of forward exchange contracts, designated as hedges, outstanding as of December 31, 2013 and 2012, respectively. Due to the short-term nature of these contracts, the results of these transactions are not material to the financial statements. In addition, the Company utilizes forward exchange contracts that are not designated as cash flow hedges and the results of these transactions are also not material to the financial statements.
Net Investment Hedges The Company has certain debt denominated in Euros and Swiss Francs. These debt instruments have been designated as partial hedges of the Company’s Euro and Swiss Franc net asset positions. Changes in the fair value of this debt attributable to changes in the spot foreign exchange rate are recorded in foreign currency translation in OCI. As of December 31, 2013 and 2012, the total value of the Company’s Euro and Swiss Franc debt designated as net investment hedges was $96.5 million and $55.0 million, respectively. For the years ended December 31, 2013 and 2012, the impact of foreign exchange rates on these debt instruments has increased debt by $4.0 million and $1.3 million, respectively, and these amounts have been recorded as foreign currency translation in OCI.
Concentrations of Credit Risk Counterparties to forward exchange contracts consist of large international financial institutions. While these counterparties may expose the Company to potential losses due to the credit risk of nonperformance, losses are not anticipated. Concentrations of credit risk with respect to trade accounts receivable are limited by the large number of customers, generally short payment terms and their dispersion across geographic areas.
6. SHARE-BASED COMPENSATION
The Company has various stock plans under which employees and directors may be granted nonvested stock which vests over a time period, except as noted below to those employees who have reached age 65 and vest immediately. The 2007 Stock Plan also allows for the granting of non-qualified stock options or incentive stock options. Upon vesting, the stock options allow the participant to purchase common stock at 100% of the market price on the day the options were granted. No options were granted in 2013, 2012 or 2011. As of December 31, 2013, there were 1.2 million shares available to be granted as nonvested stock under existing stock plans.
Stock options became exercisable over a three-year vesting period, or earlier upon retirement, and expire 10 years from the date of grant. Expense for stock options was recognized on a straight-line basis over three years from the date of grant or over the period from the date of grant until the participant was retirement-eligible, whichever was less. Treasury shares are issued for nonvested stock awards and for the exercise of stock options.
32
The following table summarizes the transactions involving the stock option plans:
| Weighted- | Weighted- | |||||||||||||||
| Average | Average | Aggregate | ||||||||||||||
| Exercise | Remaining | Intrinsic | ||||||||||||||
| (in thousands except exercise price and life) | Options | Price | Life (Years) | Value | ||||||||||||
| Outstanding at December 31, 2010 | 328 | $ | 22.06 | 3.9 | $ | 4,807 | ||||||||||
| Exercised | (121 | ) | 21.55 | |||||||||||||
| Outstanding at December 31, 2011 | 207 | 22.36 | 3.1 | 3,222 | ||||||||||||
| Exercised | (66 | ) | 22.38 | |||||||||||||
| Outstanding at December 31, 2012 | 141 | 22.35 | 2.7 | 1,859 | ||||||||||||
| Exercised | (48 | ) | 21.00 | |||||||||||||
| Outstanding at December 31, 2013 | 93 | $ | 23.04 | 2.2 | $ | 2,374 | ||||||||||
| Exercisable at December 31, 2013 | 93 | $ | 23.04 | 2.2 | $ | 2,374 | ||||||||||
The aggregate intrinsic values of stock options exercised during 2013, 2012 and 2011, were $1.1 million, $0.9 million and $1.7 million, respectively.
As of December 31, 2013, all stock options outstanding were vested.
The following table summarizes information concerning outstanding and exercisable stock options at December 31, 2013:
| Range of Exercise Price | ||||||||||||
| (in thousands except life and exercise price) | $ | 18.57-22.99 | $ | 23.00-26.11 | $ | 26.12-30.07 | ||||||
| Options outstanding | 36 | 37 | 20 | |||||||||
| Weighted-average remaining contractual life, in years | 1.6 | 1.7 | 3.8 | |||||||||
| Weighted-average exercise price | $ | 19.62 | $ | 23.50 | $ | 28.16 | ||||||
| Options exercisable | 36 | 37 | 20 | |||||||||
| Weighted-average exercise price | $ | 19.62 | $ | 23.50 | $ | 28.16 | ||||||
The Company’s stock plans also provide for the awarding of nonvested stock. Expense for shares of nonvested stock is recognized over the vesting period or during the period from the date of grant until the participant attains age 65, whichever is less. The vesting period is five years for awards granted prior to December 2013 and three years beginning with awards in December 2013. During the period of restriction, the holder of nonvested stock has voting rights and is entitled to receive all dividends and other distributions paid with respect to the stock
Starting with the December 2013 grant, 50% of the grant consisted of performance stock unit awards. The number of shares issued under these awards will be based on certain performance metrics measured over a two-year period. During the vesting period, the holder of the performance stock units will not be entitled to vote or receive dividends and other distributions paid with respect to the stock, until the units have vested and the shares of stock are issued.
The Company expenses awards for nonvested stock based on the fair value of the Company’s common stock at the date of the grant.
The following table summarizes the nonvested stock and performance stock units activity:
| Grant Date | ||||||||||||
| Weighted- | Aggregate | |||||||||||
| Average | Intrinsic | |||||||||||
| (in thousands except fair value) | Shares | Fair Value | Value | |||||||||
| Outstanding at December 31, 2010 | 363 | $ | 29.20 | $ | 13,340 | |||||||
| Granted | 270 | 35.48 | ||||||||||
| Vested | (175 | ) | 34.04 | |||||||||
| Cancelled | (58 | ) | 28.45 | |||||||||
| Outstanding at December 31, 2011 | 400 | 31.42 | 15,142 | |||||||||
| Granted | 293 | 36.09 | ||||||||||
| Vested | (314 | ) | 33.59 | |||||||||
| Cancelled | (40 | ) | 33.41 | |||||||||
| Outstanding at December 31, 2012 | 339 | 33.22 | 12,046 | |||||||||
| Granted | 262 | 46.14 | ||||||||||
| Vested | (94 | ) | 40.57 | |||||||||
| Cancelled | (10 | ) | 42.22 | |||||||||
| Outstanding at December 31, 2013 | 497 | $ | 38.46 | $ | 24,095 | |||||||
The total intrinsic values of shares vested during 2013, 2012 and 2011, was $4.4 million, $11.2 million and $6.2 million, respectively.
As of December 31, 2013, total remaining unearned compensation, net of expected forfeitures, related to nonvested stock and performance stock units was $11.6 million, which will be amortized over the weighted-average remaining service period of 2.4 years.
Total pre-tax share-based compensation recognized in the Consolidated Statements of Earnings was $8.4 million, $10.1 million and $7.8 million in 2013, 2012 and 2011, respectively. Tax related benefits of $2.6 million, $2.4 million and $1.2 million were also recognized in 2013, 2012 and 2011, respectively. Cash received from the exercise of stock options was $1.0 million, $1.5 million and $2.6 million for 2013, 2012 and 2011, respectively, and is reflected in cash flows from financing activities in the Consolidated Statements of Cash Flows.
7. RETIREMENT PLANS
The Company provides benefits under defined contribution plans including a savings plan and an employee stock ownership plan (“ESOP”). The savings plan covers substantially all domestic salaried and certain non-union hourly employees and provides for matching contributions up to 4% of each employee’s salary. The ESOP covers substantially all domestic employees and provides for contributions based on a percentage of each employee’s compensation as determined by the Board of Directors. Total expense for the Company’s defined contribution plans was $4.7 million in 2013 and 2012 and $4.3 million in 2011.
33
Although the Company intends for these defined contribution plans to be the primary retirement benefit for most employees, the Company also has several defined benefit plans. The funded status of the defined benefit plans was as follows at December 31:
| (in thousands) | 2013 | 2012 | ||||||
| Benefit obligation at beginning of year | $ | 76,957 | $ | 67,211 | ||||
| Service cost | 3,260 | 2,583 | ||||||
| Interest cost | 2,557 | 2,659 | ||||||
| Foreign currency exchange rate changes | (703 | ) | 799 | |||||
| Benefits paid | (5,194 | ) | (3,045 | ) | ||||
| Actuarial (gain) loss | (4,295 | ) | 6,750 | |||||
| Benefit obligation at end of year | 72,582 | 76,957 | ||||||
| Plan assets at beginning of year | 35,141 | 30,969 | ||||||
| Company contributions | 5,701 | 4,075 | ||||||
| Foreign currency exchange rate changes | (539 | ) | 973 | |||||
| Benefits paid | (5,258 | ) | (3,045 | ) | ||||
| Actual gain on plan assets | 2,077 | 2,169 | ||||||
| Plan assets at end of year | 37,122 | 35,141 | ||||||
| Funded status | $ | (35,460 | ) | $ | (41,816 | ) | ||
| Accumulated benefit obligation | $ | 68,391 | $ | 70,230 | ||||
Amounts recognized in the Consolidated Balance Sheets at December 31:
| (in thousands) | 2013 | 2012 | ||||||
| Accrued employee and retiree benefits | $ | (40,350 | ) | $ | (52,825 | ) | ||
| Prepaid expenses and other current assets | 4,890 | 11,009 | ||||||
| Net liability | $ | (35,460 | ) | $ | (41,816 | ) | ||
Components of annual benefit cost:
| (in thousands) | 2013 | 2012 | 2011 | |||||||||
| Service cost | $ | 3,260 | $ | 2,583 | $ | 2,419 | ||||||
| Interest cost | 2,557 | 2,659 | 2,778 | |||||||||
| Expected return on plan assets | (1,689 | ) | (1,428 | ) | (1,520 | ) | ||||||
| Amortization of prior service cost | 172 | 1,971 | 3,112 | |||||||||
| Recognized actuarial loss | 3,203 | 799 | 1,388 | |||||||||
| Settlement expense | 1,177 | – | – | |||||||||
| Defined benefit expense | $ | 8,680 | $ | 6,584 | $ | 8,177 | ||||||
Weighted-average liability assumptions as of December 31:
| 2013 | 2012 | |||||||
| Discount rate | 3.91 | % | 3.27 | % | ||||
| Expected return on plan assets | 5.12 | % | 4.76 | % | ||||
| Rate of compensation increase | 4.59 | % | 4.01 | % | ||||
Weighted-average cost assumptions for the year ended December 31:
| 2013 | 2012 | |||||||
| Discount rate | 3.27 | % | 4.27 | % | ||||
| Expected return on plan assets | 4.76 | % | 5.00 | % | ||||
| Rate of compensation increase | 4.01 | % | 4.11 | % | ||||
The aggregate amounts of benefits expected to be paid from defined benefit plans in each of the next five years subsequent to December 31, 2013, which include employees’ expected future service, are as follows: 2014, $21.7 million; 2015, $13.0 million; 2016, $2.9 million; 2017, $2.4 million; 2018, $2.2 million; and $18.3 million in total for the years 2019 through 2023.
The Company expects to contribute $22.9 million to defined benefit plans in 2014.
Amounts at December 31 in accumulated other comprehensive income were as follows:
| (in thousands) | 2013 | 2012 | ||||||
| Prior service cost | $ | 1,182 | $ | 1,362 | ||||
| Unrecognized net actuarial loss | 7,944 | 17,031 | ||||||
The pension adjustments, net of tax, recognized in OCI, were as follows:
| (in thousands) | 2013 | 2012 | 2011 | |||||||||
| Net actuarial gain (loss) arising during the period | $ | 3,180 | $ | (3,947 | ) | $ | 885 | |||||
| Amortization of actuarial loss, included in defined benefit expense | 2,006 | 526 | 866 | |||||||||
| Amortization of prior service cost, included in defined benefit expense | 108 | 1,205 | 1,901 | |||||||||
| Pension adjustment, net of tax | $ | 5,294 | $ | (2,216 | ) | $ | 3,652 | |||||
The estimated prior service cost and actuarial gain for the defined benefit plans that will be amortized from accumulated other comprehensive loss into periodic benefit cost during 2014 are $0.2 million and $0.6 million, respectively.
The investment objectives and target allocations for the Company’s pension plans related to the assets of the plans are reviewed on a regular basis. The investment objectives for the pension assets are to maximize the return on assets while maintaining an overall level of risk appropriate for a retirement fund and ensuring the availability of funds for the payment of retirement benefits. The levels of risk assumed by the pension plans are determined by market conditions, the rate of return expectations and the liquidity requirements of each pension plan. The actual asset allocations of each pension plan are reviewed on a regular basis to ensure that they are in line with the target allocations.
The Company is required to categorize pension plan assets based on the following fair value hierarchy:
Level 1: Observable inputs that reflect quoted prices (unadjusted) for identical assets or liabilities in active markets.
Level 2: Inputs other than quoted prices included in Level 1 that are observable for the asset or liability through corroboration with observable market data.
Level 3: Unobservable inputs that reflect the reporting entity’s own assumptions.
34
The following table presents the Company’s pension plan assets by asset category as of December 31, 2013 and 2012:
Fair Value as of December 31, | Fair Value Measurements at December 31, 2013 Using Fair Value Hierarchy | Fair Value as of December 31, | Fair Value Measurements at December 31, 2012 Using Fair Value Hierarchy | |||||||||||||||||||||||||||||
| (in thousands) | 2013 | Level 1 | Level 2 | Level 3 | 2012 | Level 1 | Level 2 | Level 3 | ||||||||||||||||||||||||
| Equity Funds | ||||||||||||||||||||||||||||||||
| Domestic | $ | 6,143 | $ | 6,143 | $ | — | $ | — | $ | 5,253 | $ | 5,253 | $ | — | $ | — | ||||||||||||||||
| International | 7,294 | — | 7,294 | — | 5,412 | — | 5,412 | — | ||||||||||||||||||||||||
| International Fixed Income Funds | 23,162 | 1,186 | 21,976 | — | 24,369 | 1,364 | 23,005 | — | ||||||||||||||||||||||||
| Other investments | 523 | 40 | 483 | — | 107 | 34 | 73 | — | ||||||||||||||||||||||||
| Total assets at fair value | $ | 37,122 | $ | 7,369 | $ | 29,753 | $ | — | $ | 35,141 | $ | 6,651 | $ | 28,490 | $ | — | ||||||||||||||||
8. ACCUMULATED OTHER COMPREHENSIVE INCOME
The following tables summarize the changes in Accumulated Other Comprehensive Income (Loss) (“OCI”) for 2013:
| Foreign | ||||||||||||||||
Cash Flow(a) | Pension(a) | Currency | ||||||||||||||
| (in thousands) | Hedges | Items | Items | Total | ||||||||||||
| Balance as of December 31, 2012 | $ | 35 | $ | (12,062 | ) | $ | 7,442 | $ | (4,585 | ) | ||||||
| Other comprehensive income before reclassifications | (212 | ) | 3,180 | 5,427 | 8,395 | |||||||||||
| Amounts reclassified from OCI | 78 | 2,114 | — | 2,192 | ||||||||||||
| Balance as of December 31, 2013 | $ | (99 | ) | $ | (6,768 | ) | $ | 12,869 | $ | 6,002 | ||||||
| (a) Cash Flow Hedges and Pension Items are net of tax. | ||||||||||||||||
See Note 7, Retirement Plans, for more information on the pension items reclassified out of OCI and into Selling and Administrative expenses in the Statement of Earnings during 2013. See Note 5, Derivative Instruments and Hedging Activity, for additional information on the Company’s cash flow hedges.
9. INCOME TAXES
The provision for income taxes was as follows:
| (in thousands) | 2013 | 2012 | 2011 | |||||||||
| Currently payable: | ||||||||||||
| Federal | $ | 21,252 | $ | 22,394 | $ | 28,480 | ||||||
| State | 3,065 | 3,024 | 2,845 | |||||||||
| Foreign | 24,781 | 22,065 | 22,713 | |||||||||
| 49,098 | 47,483 | 54,038 | ||||||||||
| Deferred (benefit) expense: | ||||||||||||
| Federal | (5,125 | ) | 170 | (5,669 | ) | |||||||
| State | 502 | 603 | (274 | ) | ||||||||
| Foreign | (1,555 | ) | 2,143 | 2,805 | ||||||||
| (6,178 | ) | 2,916 | (3,138 | ) | ||||||||
| Income taxes | $ | 42,920 | $ | 50,399 | $ | 50,900 | ||||||
The tax effects of temporary differences that give rise to significant portions of deferred tax assets and liabilities consisted of the following:
| (in thousands) | 2013 | 2012 | ||||||
| Deferred tax assets: | ||||||||
| Benefit plans | $ | 21,148 | $ | 17,375 | ||||
| Liabilities and reserves | 11,499 | 9,140 | ||||||
| Operating loss and credit carryovers | 51,292 | 48,441 | ||||||
| Other | 17,151 | 16,096 | ||||||
| Gross deferred tax assets | 101,090 | 91,052 | ||||||
| Valuation allowance | (43,048 | ) | (41,049 | ) | ||||
| Deferred tax assets | 58,042 | 50,003 | ||||||
| Deferred tax liabilities: | ||||||||
| Property, plant and equipment | (21,139 | ) | (19,430 | ) | ||||
| Other assets | (1,411 | ) | (2,784 | ) | ||||
| Other | (31,741 | ) | (26,668 | ) | ||||
| Deferred tax liabilities | (54,291 | ) | (48,882 | ) | ||||
| Net deferred tax assets | $ | 3,751 | $ | 1,121 | ||||
35
In 2012, the Company recorded a correction of a prior period item related to the tax effect on certain foreign denominated loan losses that were previously recorded in OCI. As a result, net deferred tax assets increased by $10.8 million, other current assets by $6.0 million and OCI by $16.8 million. The tax effect was recognized in OCI in 2012 and was not material to any previously reported year.
At December 31, 2013, foreign operating loss carryovers were $128.9 million. Included in the foreign operating loss carryovers are losses of $9.9 million that expire through 2028 and $119.0 million that do not have an expiration date. At December 31, 2013, state operating loss carryovers were $103.1 million, all of which expire through 2028.
The effective tax rate differed from the statutory federal income tax rate of 35% as described below:
| 2013 | 2012 | 2011 | ||||||||||
| Taxes at statutory rate | 35.0 | % | 35.0 | % | 35.0 | % | ||||||
| State income taxes, net of federal income tax benefit | 1.1 | 1.5 | 1.0 | |||||||||
| Tax credits | (0.3 | ) | — | (0.2 | ) | |||||||
| Taxes on foreign earnings | (5.3 | ) | (4.1 | ) | (2.5 | ) | ||||||
| Resolution of prior years’ tax matters | (0.7 | ) | (1.4 | ) | (0.6 | ) | ||||||
| Valuation allowance adjustments | (0.8 | ) | (0.5 | ) | (0.6 | ) | ||||||
| Revaluation of previously held interest | — | — | (0.7 | ) | ||||||||
| Other, net | (1.5 | ) | (1.6 | ) | (1.7 | ) | ||||||
| Effective tax rate | 27.5 | % | 28.9 | % | 29.7 | % | ||||||
Earnings before income taxes were as follows:
| (in thousands) | 2013 | 2012 | 2011 | |||||||||
| United States | $ | 55,461 | $ | 79,118 | $ | 70,023 | ||||||
| Foreign | 100,754 | 95,189 | 101,361 | |||||||||
| Total | $ | 156,215 | $ | 174,307 | $ | 171,384 | ||||||
Federal and state income taxes are provided on international subsidiary income distributed to or taxable in the United States during the year. At December 31, 2013, federal and state taxes have not been provided for approximately $427.9 million of unremitted earnings of the foreign subsidiaries that are considered to be invested indefinitely. Determination of the deferred tax liability on such earnings is not practicable.
A reconciliation of the change in the liability for unrecognized tax benefits for 2013 and 2012 is as follows:
| (in thousands) | 2013 | 2012 | ||||||
| Balance at beginning of year | $ | 7,091 | $ | 8,787 | ||||
| Increases for tax positions taken in the current year | 818 | 599 | ||||||
| Increases for tax positions taken in prior years | 875 | 553 | ||||||
| Decreases related to settlements with tax authorities | (3,113 | ) | (1,678 | ) | ||||
| Decreases as a result of lapse of the applicable statutes of limitations | (374 | ) | (1,362 | ) | ||||
| Foreign currency exchange rate changes | (2 | ) | 192 | |||||
| Balance at the end of year | $ | 5,295 | $ | 7,091 | ||||
The amount of the unrecognized tax benefits that would affect the effective tax rate, if recognized, was approximately $5.1 million. The Company recognizes interest and penalties related to the unrecognized tax benefits in income tax expense. As of December 31, 2013 and 2012, $0.7 million and $1.0 million, respectively, of accrued interest and penalties was reported as an income tax liability. The liability for unrecognized tax benefits relates to multiple jurisdictions and is reported in Other liabilities on the Consolidated Balance Sheet at December 31, 2013.
The Company believes that it is reasonably possible that the total amount of liability for unrecognized tax benefits as of December 31, 2013, will decrease by approximately $1.7 million during 2014. The potential decrease relates to various tax matters for which the statute of limitations may expire or will be otherwise settled in 2014. The amount that is ultimately recognized in the financial statements will be dependent upon various factors including potential increases or decreases to unrecognized tax benefits as a result of examinations, settlements and other unanticipated items that may occur during the year. With limited exceptions, the Company is no longer subject to federal, state and local, or non-U.S. income tax examinations by tax authorities for years before 2004.
10. SEGMENT AND GEOGRAPHIC INFORMATION
The accounting policies of the segments are the same as those described in the summary of significant accounting policies. The Company evaluates performance based on operating income of the respective business units before restructuring charges, interest expense and income taxes. Total revenue and operating income by business segment and geographic region include both sales to customers, as reported in the Company’s Consolidated Statements of Earnings, and intersegment sales, which are accounted for at prices that approximate market prices and are eliminated in consolidation. Corporate & Other revenue consists primarily of flavor, fragrances and color products sold by the Asia Pacific Group, China Group and Flavors Central & South America Group.
36
Assets by business segment and geographic region are those assets used in the Company’s operations in each segment and geographic region. Segment assets reflect the allocation of goodwill to each segment. Corporate & Other assets consist primarily of property and investments.
Segment Information The Company determines its operating segments based on information utilized by the chief operating decision maker to allocate resources and assess performance. The Company’s reportable segments consist of Flavors & Fragrances and Color and are both managed on a products and services basis. The Company’s Flavors & Fragrances segment produces flavor and fragrance products that impart a desired taste, texture, aroma or other characteristic to a broad range of consumer and other products. The Color segment produces natural and synthetic color systems for pharmaceuticals, foods and beverages; colors and formulations for cosmetics; and technical colors for industrial applications and digital imaging. Three additional segments, Asia Pacific, China and Flavors Central & South America are managed on a geographic basis and included in Corporate & Other.
Beginning in the first quarter of 2013, the results of operations for the Company’s cosmetic and pharmaceutical businesses in Asia Pacific and China, previously reported in the Corporate & Other segment, are reported in the Color segment. Results for 2012 and 2011 have been restated to reflect this change.
| Flavors & | Corporate | |||||||||||||||
| (in thousands) | Fragrances | Color | & Other | Consolidated | ||||||||||||
| 2013 | ||||||||||||||||
| Revenue from external customers | $ | 845,672 | $ | 473,281 | $ | 148,597 | $ | 1,467,550 | ||||||||
| Intersegment revenue | 35,626 | 20,691 | 1,847 | 58,164 | ||||||||||||
| Total revenue | 881,298 | 493,972 | 150,444 | 1,525,714 | ||||||||||||
| Operating income (loss) | 122,410 | 103,601 | (53,649 | ) | 172,362 | |||||||||||
| Interest expense | — | — | 16,147 | 16,147 | ||||||||||||
| Earnings (loss) before income taxes | 122,410 | 103,601 | (69,796 | ) | 156,215 | |||||||||||
| Assets | 897,216 | 790,531 | 182,987 | 1,870,734 | ||||||||||||
| Capital expenditures | 59,040 | 39,273 | 5,933 | 104,246 | ||||||||||||
| Depreciation and amortization | 27,458 | 18,664 | 5,894 | 52,016 | ||||||||||||
| 2012 | ||||||||||||||||
| Revenue from external customers | $ | 837,549 | $ | 477,385 | $ | 144,116 | $ | 1,459,050 | ||||||||
| Intersegment revenue | 37,732 | 21,825 | 1,464 | 61,021 | ||||||||||||
| Total revenue | 875,281 | 499,210 | 145,580 | 1,520,071 | ||||||||||||
| Operating income (loss) | 122,997 | 96,406 | (28,195 | ) | 191,208 | |||||||||||
| Interest expense | — | — | 16,901 | 16,901 | ||||||||||||
| Earnings (loss) before income taxes | 122,997 | 96,406 | (45,096 | ) | 174,307 | |||||||||||
| Assets | 860,395 | 744,200 | 172,048 | 1,776,643 | ||||||||||||
| Capital expenditures | 49,781 | 46,003 | 8,022 | 103,806 | ||||||||||||
| Depreciation and amortization | 27,021 | 15,499 | 5,832 | 48,352 | ||||||||||||
| 2011 | ||||||||||||||||
| Revenue from external customers | $ | 821,933 | $ | 476,958 | $ | 131,898 | $ | 1,430,789 | ||||||||
| Intersegment revenue | 35,527 | 19,833 | 1,728 | 57,088 | ||||||||||||
| Total revenue | 857,460 | 496,791 | 133,626 | 1,487,877 | ||||||||||||
| Operating income (loss) | 129,436 | 92,518 | (31,131 | ) | 190,823 | |||||||||||
| Interest expense | — | — | 19,439 | 19,439 | ||||||||||||
| Earnings (loss) before income taxes | 129,436 | 92,518 | (50,570 | ) | 171,384 | |||||||||||
| Assets | 803,844 | 699,017 | 151,303 | 1,654,164 | ||||||||||||
| Capital expenditures | 34,999 | 30,121 | 7,080 | 72,200 | ||||||||||||
| Depreciation and amortization | 26,743 | 14,125 | 5,231 | 46,099 | ||||||||||||
37
Geographic Information The Company has manufacturing facilities or sales offices in North America, South America, Europe, Asia, Australia and Africa.
| (in thousands) | 2013 | 2012 | 2011 | |||||||||
| Revenue from external customers: | ||||||||||||
| North America | $ | 784,658 | $ | 785,919 | $ | 737,154 | ||||||
| Europe | 382,464 | 371,658 | 405,312 | |||||||||
| Asia Pacific | 191,343 | 199,849 | 190,404 | |||||||||
| Other | 109,085 | 101,624 | 97,919 | |||||||||
| Consolidated | $ | 1,467,550 | $ | 1,459,050 | $ | 1,430,789 | ||||||
| Long-lived assets: | ||||||||||||
| North America | $ | 531,005 | $ | 504,483 | $ | 444,656 | ||||||
| Europe | 506,352 | 472,865 | 456,248 | |||||||||
| Asia Pacific | 32,148 | 35,891 | 35,151 | |||||||||
| Other | 11,404 | 12,050 | 11,239 | |||||||||
| Consolidated | $ | 1,080,909 | $ | 1,025,289 | $ | 947,294 | ||||||
Sales in the United States, based on the final country of destination of the Company’s products, were $592.6 million, $598.5 million and $561.9 million in 2013, 2012 and 2011, respectively. No other country of destination exceeded 10% of consolidated sales. Total long-lived assets in the United States amounted to $389.7 million, $360.1 million and $345.1 million at December 31, 2013, 2012 and 2011, respectively.
Product Information The Company’s revenue summarized by product portfolio is as follows:
| (in thousands) | 2013 | 2012 | 2011 | |||||||||
| Traditional Flavors & Fragrances | $ | 744,934 | $ | 725,165 | $ | 710,450 | ||||||
| Natural Ingredients | 244,155 | 252,941 | 240,844 | |||||||||
| Food & Beverage Colors | 307,301 | 310,739 | 317,880 | |||||||||
| Non-Food Colors | 229,324 | 231,226 | 218,703 | |||||||||
| Intersegment Revenue | (58,164 | ) | (61,021 | ) | (57,088 | ) | ||||||
| Consolidated | $ | 1,467,550 | $ | 1,459,050 | $ | 1,430,789 | ||||||
11. FAIR VALUE MEASUREMENTS
ASC 820, Fair Value Measurements and Disclosures, defines fair value for financial assets and liabilities, establishes a framework for measuring fair value in Generally Accepted Accounting Principles (“GAAP”) and expands disclosures about fair value measurements. As of December 31, 2013 and 2012, the Company’s only assets and liabilities subject to this standard are forward contracts, investments in a money market fund and municipal bonds, and defined benefit plan assets (See Note 7, Retirement Plans, for additional information on the defined benefit plan assets). The net fair value of the forward exchange contracts based on current pricing obtained for comparable derivative products (Level 2 inputs) was an asset of $0.2 million at December 31, 2013 and was negligible at December 31, 2012. The fair value of the investments based on December 31, 2013 and 2012, market quotes (Level 1 inputs) was an asset of $19.8 million and $20.3 million, respectively.
The carrying values of the Company’s cash and cash equivalents, trade accounts receivable, accounts payable, accrued expenses and short-term borrowings approximated fair values as of December 31, 2013 and 2012.
The fair value of the Company’s long-term debt, including current maturities, is estimated using discounted cash flows based on the Company’s current incremental borrowing rates for similar types of borrowing arrangements (Level 2 inputs). The carrying value of the long-term debt at December 31, 2013 and 2012, was $348.1 million and $334.0 million, respectively. The fair value of the long-term debt at December 31, 2013 and 2012, was approximately $351.0 million and $354.4 million, respectively.
12. RESTRUCTURING CHARGES
The Company recorded restructuring costs of $31.7 million ($22.0 million after tax) in 2013 related to the 2013 restructuring program to relocate the Flavors & Fragrances Group headquarters to Chicago, as well as a profit improvement plan across all segments of the Company.
Detail of the 2013 restructuring costs and the line items in which it was recorded in the Corporate & Other segment are as follows:
| Selling & | Cost of | |||||||||||
| (in thousands) | Administrative | Products Sold | Total | |||||||||
| Employee separations | $ | 18,081 | $ | — | $ | 18,081 | ||||||
| Long-lived asset impairment | 4,176 | — | 4,176 | |||||||||
| Gain on asset sales | (3,019 | ) | (3,019 | ) | ||||||||
| Write-down of inventory | — | 1,840 | 1,840 | |||||||||
| Other costs | 10,657 | — | 10,657 | |||||||||
| Total | $ | 29,895 | $ | 1,840 | $ | 31,735 | ||||||
The following table summarizes the 2013 restructuring costs by segment:
| (in thousands) | 2013 | |||
| Flavors | $ | 22,284 | ||
| Color | 7,065 | |||
| Corporate & Other | 2,386 | |||
| Total | $ | 31,735 | ||
The Company does not expect restructuring costs in 2014 to be material.
38
The following table summarizes the accrual for the restructuring and other charges for the twelve months ended December 31, 2013, which is recorded in Other accrued expenses:
| Employee | Assets Related | |||||||||||
| (in thousands) | Separations | and Other | Total | |||||||||
| Balance as of December 31, 2012 | $ | — | $ | — | $ | — | ||||||
| Restructuring costs | 18,081 | 13,654 | 31,735 | |||||||||
| Gain on sale of assets | — | 3,019 | 3,019 | |||||||||
| Cash spent | (13,505 | ) | (9,069 | ) | (22,574 | ) | ||||||
| Reduction of assets | — | (6,016 | ) | (6,016 | ) | |||||||
| Translation adjustment | (14 | ) | — | (14 | ) | |||||||
| Balance as of December 31, 2013 | $ | 4,562 | $ | 1,588 | $ | 6,150 | ||||||
In the fourth quarter of 2011, the company recorded a restructuring charge of $4.8 million ($3.7 million net of tax) related to a plan to improve the profitability and efficiency of selected operations. The restructuring charge mainly included severance and other employee separation costs. In 2012, approximately $1.8 million of payments were applied to the restructuring reserve.
13. COMMITMENTS AND CONTINGENCIES
LEASES
The Company leases certain facilities and equipment under operating lease arrangements. Aggregate minimum rental commitments at December 31, 2013, for all noncancelable operating leases with an initial lease term greater than one year for the years ending December 31 are as follows: 2014, $7.5 million; 2015, $5.3 million; 2016, $2.9 million; 2017, $1.1 million; 2018, $0.7 and $0.2 million thereafter.
Rent expense totaled $10.7 million, $10.8 million and $11.7 million during the years ended December 31, 2013, 2012 and 2011, respectively.
COMMERCIAL LITIGATION
Cherry Blossom Litigation
Cherry Blossom LLC, a Traverse City, Michigan contractor that had produced cherry products for the Company, ceased operations in May 2009. At the time, Cherry Blossom had physical possession of brined cherries belonging to the Company with a book value of approximately $0.5 million. Despite the Company’s demands, Cherry Blossom refused to permit the Company to take possession of the cherries for processing elsewhere.
In June 2009, the Company sued Cherry Blossom in the Circuit Court of Grand Traverse County, Michigan, seeking an order for return of the cherries. Cherry Blossom’s asset based lender, Crossroads Financial (which claimed to be owed over $1.4 million) (“Crossroads”), intervened and claimed a senior lien on the cherries. The Circuit Court denied the Company’s request for immediate possession and permitted Cherry Blossom to retain and process the cherries. The Circuit Court later held that Crossroads had a senior lien on the cherries and was entitled to receive the proceeds from the sale of the cherries. The Circuit Court also denied the Company’s cross claims against Crossroads to recoup certain overpayments that the Company made to Cherry Blossom/Crossroads and to recoup payments made by the Company to the United States Department of Labor on Cherry Blossom’s/Crossroads’ behalf. The Company appealed these adverse decisions of the Circuit Court.
Crossroads asserted a claim against the Company for money damages in an undetermined amount. Crossroads claimed that it had a lien on all of Cherry Blossom’s accounts receivable from the Company and that the Company had performed a number of offsets against its accounts payable to Cherry Blossom in derogation of Crossroads’ rights as lienholder. The Circuit Court denied Crossroads’ claims for money damages against the Company. Crossroads appealed this adverse decision of the Circuit Court.
The Michigan Court of Appeals heard oral argument on the appeals on September 10, 2013. On October 31, 2013, the Court issued its decision affirming the trial court in all respects, including the denial of the Crossroad claim to recover over $1.4 million from the Company. The Company and Crossroads both had the right to petition the Michigan Supreme Court to review the decision of the Court of Appeals. Neither party, however, sought Supreme Court review, and the case is now concluded.
Cherry Blossom counterclaimed against the Company, alleging that Cherry Blossom had purchased exclusive rights to certain proprietary cherry processing formulas used in the Company’s cherry product. Cherry Blossom sought a preliminary injunction against the Company’s delivery of copies of the formulas to any third party. The Court denied Cherry Blossom’s motion regarding the formulas and eventually dismissed Cherry Blossom’s claims. The Company also initiated a suit against Cherry Blossom in the United States District Court for the Western District of Michigan seeking a declaratory judgment that the Company has the right to use the cherry processing formulas. Because Cherry Blossom subsequently filed a petition in bankruptcy, the Federal District Court closed the matter. This closing was for administrative purposes only and did not constitute a decision on the merits.
Christopher Hubbell, a principal of Cherry Blossom, personally filed a petition for bankruptcy. The Company originally opposed the bankruptcy petition to the extent Hubbell sought a discharge of the Company’s alleged damages arising from his own fraudulent acts connected to Cherry Blossom’s granting of an allegedly superior interest in the Company’s cherries to Crossroads. The Company and Hubbell filed a joint motion to dismiss the Company’s claims against Hubbell without prejudice pending the Michigan state court action. The Bankruptcy Court granted the motion. Under the terms of the dismissal, if the state courts had determined that the Company was liable to Crossroads, the Company would have had 60 days to reopen the adversary proceeding and pursue its claims against Hubbell. Since neither the Company nor Crossroads pursued Supreme Court review and the state case is now concluded, the dismissal of the Company’s claims against Hubbell in his personal bankruptcy proceeding has become with prejudice.
39
Vega v. Sensient Dehydrated Flavors LLC
On January 3, 2013, Thomas Vega, a now former employee, filed (but did not serve) a Class Action Complaint in San Francisco County Superior Court against Sensient Dehydrated Flavors LLC. On February 11, 2013, Vega filed and served a First Amended Complaint (“Complaint”) against the Company and a Company supervisor. Vega alleges that the Company failed to provide alleged class members with meal periods, compensation for the alleged absence of meal periods, and accurate wage statements, in violation of the California labor code. The alleged class includes all employees paid on an hourly basis and forklift operators. The Complaint seeks damages, back wages, injunctive relief, penalties, interest, and attorneys’ fees for the members of the alleged class. The Complaint alleges that the total damages and costs “do not exceed a[n] aggregate of $4,999,999.99.”
The Complaint alleges two causes of action. The first cause of action is for “Unfair Competition.” The plaintiff’s theory is that the Company, by allegedly not complying with state wage and hour laws, had an unfair competitive advantage against other employers who were complying with those laws. The main strategic reason that plaintiffs plead this cause of action is that the statute of limitations is four years. The second cause of action is for alleged substantive violations of the California labor code provisions governing wages, hours, and meal periods.
On March 13, 2013, the parties filed a joint stipulation and proposed order to remove the case from San Francisco County Superior Court to Stanislaus County Superior Court. On April 18, 2013, the Court granted the request.
On October 7, 2013, following a private mediation, the parties signed a Memorandum of Understanding in which they agreed to resolve the action for a maximum of $275,000 on a claims made basis. On December 5, 2013, the settlement was presented to the Stanislaus County Superior Court. The Court granted preliminary approval of the settlement and scheduled a final approval hearing for March 14, 2014.
Other Claims and Litigation
The Company is involved in various other claims and litigation arising in the normal course of business. In the judgment of management, which relies in part on information from Company counsel, the ultimate resolution of these actions will not materially affect the consolidated financial statements of the Company except as described above.
40
Management’s Report on Internal Control Over Financial Reporting
The management of Sensient Technologies Corporation is responsible for establishing and maintaining adequate internal control over financial reporting. It is management’s policy to maintain a control-conscious environment through an effective system of internal accounting controls. These controls are supported by the careful selection of competent and knowledgeable personnel and by the communication of standard accounting and reporting policies and procedures throughout the Company. These controls are designed to provide reasonable assurance regarding the reliability of financial reporting and the preparation of financial statements for external purposes in accordance with generally accepted accounting principles.
Management has assessed the effectiveness of the Company’s internal control over financial reporting as of December 31, 2013. In making its assessment of internal control over financial reporting, management used the criteria set forth by the Committee of Sponsoring Organizations of the Treadway Commission in Internal Control – Integrated Framework (1992 Framework). Based on that assessment, management has concluded that the Company’s internal control over financial reporting was effective as of December 31, 2013.
The Company’s independent registered public accounting firm has issued its report on the Company’s internal control over financial reporting. This report appears on page 42.
Report of Independent Registered Public Accounting Firm
To The Board of Directors and Shareholders of
Sensient Technologies Corporation
Milwaukee, Wisconsin
We have audited the accompanying consolidated balance sheets of Sensient Technologies Corporation and subsidiaries as of December 31, 2013 and 2012, and the related consolidated statements of earnings, comprehensive income, shareholders’ equity, and cash flows for each of the three years in the period ended December 31, 2013. These financial statements are the responsibility of the Company’s management. Our responsibility is to express an opinion on these financial statements based on our audits.
We conducted our audits in accordance with the standards of the Public Company Accounting Oversight Board (United States). Those standards require that we plan and perform the audit to obtain reasonable assurance about whether the financial statements are free of material misstatement. An audit includes examining, on a test basis, evidence supporting the amounts and disclosures in the financial statements, assessing the accounting principles used and significant estimates made by management, as well as evaluating the overall financial statement presentation. We believe that our audits provide a reasonable basis for our opinion.
In our opinion, the financial statements referred to above present fairly, in all material respects, the consolidated financial position of Sensient Technologies Corporation and subsidiaries at December 31, 2013 and 2012, and the consolidated results of their operations and their cash flows for each of the three years in the period ended December 31, 2013, in conformity with U.S. generally accepted accounting principles.
We also have audited, in accordance with the standards of the Public Company Accounting Oversight Board (United States), Sensient Technologies Corporation’s internal control over financial reporting as of December 31, 2013, based on criteria established in Internal Control – Integrated Framework issued by the Committee of Sponsoring Organizations of the Treadway Commission (1992 Framework) and our report dated February 28, 2014 expressed an unqualified opinion thereon.
/s/ Ernst & Young LLP
Milwaukee, Wisconsin
February 28, 2014
41
Report of Independent Registered Public Accounting Firm on Internal Control Over Financial Reporting
To The Board of Directors and Shareholders of
Sensient Technologies Corporation
Milwaukee, Wisconsin
We have audited Sensient Technologies Corporation’s internal control over financial reporting as of December 31, 2013, based on criteria established in Internal Control – Integrated Framework issued by the Committee of Sponsoring Organizations of the Treadway Commission (1992 Framework) (the “COSO criteria”). Sensient Technologies Corporation’s management is responsible for maintaining effective internal control over financial reporting, and for its assessment of the effectiveness of internal control over financial reporting included in the accompanying Management’s Report on Internal Control Over Financial Reporting. Our responsibility is to express an opinion on the Company’s internal control over financial reporting based on our audit.
We conducted our audit in accordance with the standards of the Public Company Accounting Oversight Board (United States). Those standards require that we plan and perform the audit to obtain reasonable assurance about whether effective internal control over financial reporting was maintained in all material respects. Our audit included obtaining an understanding of internal control over financial reporting, assessing the risk that a material weakness exists, testing and evaluating the design and operating effectiveness of internal control based on the assessed risk, and performing such other procedures as we considered necessary in the circumstances. We believe that our audit provides a reasonable basis for our opinion.
A company’s internal control over financial reporting is a process designed to provide reasonable assurance regarding the reliability of financial reporting and the preparation of financial statements for external purposes in accordance with generally accepted accounting principles. A company’s internal control over financial reporting includes those policies and procedures that (1) pertain to the maintenance of records that, in reasonable detail, accurately and fairly reflect the transactions and dispositions of the assets of the company; (2) provide reasonable assurance that transactions are recorded as necessary to permit preparation of financial statements in accordance with generally accepted accounting principles, and that receipts and expenditures of the company are being made only in accordance with authorizations of management and directors of the company; and (3) provide reasonable assurance regarding prevention or timely detection of unauthorized acquisition, use, or disposition of the company’s assets that could have a material effect on the financial statements.
Because of its inherent limitations, internal control over financial reporting may not prevent or detect misstatements. Also, projections of any evaluation of effectiveness to future periods are subject to the risk that controls may become inadequate because of changes in conditions, or that the degree of compliance with the policies or procedures may deteriorate.
In our opinion, Sensient Technologies Corporation maintained, in all material respects, effective internal control over financial reporting as of December 31, 2013, based on the COSO criteria.
We also have audited, in accordance with the standards of the Public Company Accounting Oversight Board (United States), the consolidated balance sheets of Sensient Technologies Corporation as of December 31, 2013 and 2012, and the related consolidated statements of earnings, comprehensive income, shareholders’ equity, and cash flows for each of the three years in the period ended December 31, 2013 and our report dated February 28, 2014, expressed an unqualified opinion thereon.
/s/ Ernst & Young LLP
Milwaukee, Wisconsin
February 28, 2014
42
Quarterly Data
| Gross | Net | Net Earnings Per Share | ||||||||||||||||||
| (in thousands except per share amounts) (unaudited) | Revenue | Profit | Earnings | Basic | Diluted | |||||||||||||||
| 2013 | ||||||||||||||||||||
| First Quarter | $ | 365,640 | $ | 117,137 | $ | 21,439 | $ | 0.43 | $ | 0.43 | ||||||||||
| Second Quarter | 378,806 | 122,521 | 32,282 | 0.65 | 0.65 | |||||||||||||||
| Third Quarter | 371,993 | 120,059 | 31,525 | 0.63 | 0.63 | |||||||||||||||
| Fourth Quarter | 351,111 | 116,185 | 28,049 | 0.56 | 0.56 | |||||||||||||||
| 2012 | ||||||||||||||||||||
| First Quarter | $ | 365,660 | $ | 115,332 | $ | 28,906 | $ | 0.58 | $ | 0.58 | ||||||||||
| Second Quarter | 367,777 | 119,955 | 34,905 | 0.70 | 0.70 | |||||||||||||||
| Third Quarter | 369,371 | 117,593 | 32,876 | 0.66 | 0.66 | |||||||||||||||
| Fourth Quarter | 356,242 | 110,263 | 27,221 | 0.55 | 0.55 | |||||||||||||||
Common Stock Prices and Dividends
| Market Price | Dividends | |||||||||||
| High | Low | Per Share | ||||||||||
| 2013 | ||||||||||||
| First Quarter | $ | 39.39 | $ | 35.54 | $ | 0.22 | ||||||
| Second Quarter | 42.38 | 35.59 | 0.23 | |||||||||
| Third Quarter | 48.15 | 39.96 | 0.23 | |||||||||
| Fourth Quarter | 53.35 | 46.75 | 0.23 | |||||||||
| 2012 | ||||||||||||
| First Quarter | $ | 41.08 | $ | 35.43 | $ | 0.21 | ||||||
| Second Quarter | 39.25 | 34.14 | 0.22 | |||||||||
| Third Quarter | 37.92 | 34.26 | 0.22 | |||||||||
| Fourth Quarter | 38.02 | 33.13 | 0.22 | |||||||||
Company Stock Performance
This graph compares the cumulative total shareholder return for the Company’s common stock over the last five years to the total returns on the Standard & Poor’s Midcap Specialty Chemicals Index (the “S&P Midcap Specialty Chemicals Index”), the Standard & Poor’s Midcap FoodProducts Index (the “S&P Midcap Food Products Index”) and the Standard & Poor’s 500 Stock Index (the “S&P 500 Index”). The graph assumes a $100 investment made on December 31, 2008, and reinvestment of dividends. The stock performance shown on the graph is not necessarily indicative of future price performance.
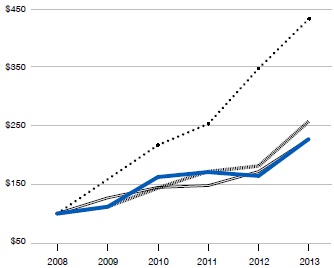

| 2008 | 2009 | 2010 | 2011 | 2012 | 2013 | |||||||||||||||||||
| Sensient Technologies Corporation | $ | 100 | $ | 113 | $ | 162 | $ | 171 | $ | 164 | $ | 228 | ||||||||||||
| S&P Midcap Specialty Chemicals Index | 100 | 156 | 217 | 254 | 348 | 435 | ||||||||||||||||||
| S&P Midcap Food Products Index | 100 | 114 | 142 | 171 | 181 | 257 | ||||||||||||||||||
| S&P 500 Index | 100 | 126 | 145 | 148 | 171 | 226 | ||||||||||||||||||
Standard & Poor’s and S&P are registered trademarks of Standard & Poor’s Financial Services, LLC.
43
Five Year Review
(in thousands except percentages, and employee and per share data) Years ended December 31, | 2013 | 2012 | 2011 | 2010 | 2009 | |||||||||||||||||||||||||||||||||||
| Summary of Operations | ||||||||||||||||||||||||||||||||||||||||
| Revenue | $ | 1,467,550 | 100.0 | % | $ | 1,459,050 | 100.0 | % | $ | 1,430,789 | 100.0 | % | $ | 1,328,180 | 100.0 | % | $ | 1,201,412 | 100.0 | % | ||||||||||||||||||||
| Cost of products sold | 991,648 | 67.6 | 995,907 | 68.3 | 981,137 | 68.6 | 919,821 | 69.3 | 832,382 | 69.3 | ||||||||||||||||||||||||||||||
| Selling and administrative expenses | 303,540 | 20.7 | 271,935 | 18.6 | 258,829 | 18.1 | 233,782 | 17.6 | 222,067 | 18.5 | ||||||||||||||||||||||||||||||
| Operating income | 172,362 | 11.7 | 191,208 | 13.1 | 190,823 | 13.3 | 174,577 | 13.1 | 146,963 | 12.2 | ||||||||||||||||||||||||||||||
| Interest expense | 16,147 | 1.1 | 16,901 | 1.2 | 19,439 | 1.4 | 20,384 | 1.5 | 23,788 | 2.0 | ||||||||||||||||||||||||||||||
| Earnings before income taxes | 156,215 | 10.6 | 174,307 | 11.9 | 171,384 | 12.0 | 154,193 | 11.6 | 123,175 | 10.3 | ||||||||||||||||||||||||||||||
| Income taxes | 42,920 | 2.9 | 50,399 | 3.5 | 50,900 | 3.6 | 47,049 | 3.5 | 36,614 | 3.0 | ||||||||||||||||||||||||||||||
| Net earnings | $ | 113,295 | 7.7 | % | $ | 123,908 | 8.5 | % | $ | 120,484 | 8.4 | % | $ | 107,144 | 8.1 | % | $ | 86,561 | 7.2 | % | ||||||||||||||||||||
| Earnings per share: | ||||||||||||||||||||||||||||||||||||||||
| Basic | $ | 2.28 | $ | 2.50 | $ | 2.42 | $ | 2.18 | $ | 1.79 | ||||||||||||||||||||||||||||||
| Diluted | $ | 2.27 | $ | 2.49 | $ | 2.41 | $ | 2.17 | $ | 1.78 | ||||||||||||||||||||||||||||||
| Other Related Data | ||||||||||||||||||||||||||||||||||||||||
| Dividends per share, declared and paid | $ | 0.91 | $ | 0.87 | $ | 0.84 | $ | 0.79 | $ | 0.76 | ||||||||||||||||||||||||||||||
| Average common shares outstanding: | ||||||||||||||||||||||||||||||||||||||||
| Basic | 49,755 | 49,596 | 49,746 | 49,138 | 48,379 | |||||||||||||||||||||||||||||||||||
| Diluted | 49,934 | 49,822 | 49,937 | 49,424 | 48,641 | |||||||||||||||||||||||||||||||||||
| Book value per common share | $ | 24.72 | $ | 23.09 | $ | 20.87 | $ | 19.70 | $ | 18.49 | ||||||||||||||||||||||||||||||
| Price range per common share | 35.54-53.35 | 33.13-41.08 | 30.15-39.69 | 24.76-37.61 | 18.42-29.07 | |||||||||||||||||||||||||||||||||||
| Share price at December 31 | 48.52 | 35.56 | 37.90 | 36.73 | 26.30 | |||||||||||||||||||||||||||||||||||
| Capital expenditures | 104,246 | 103,806 | 72,200 | 55,823 | 47,716 | |||||||||||||||||||||||||||||||||||
| Depreciation | 50,716 | 46,992 | 44,771 | 42,109 | 40,881 | |||||||||||||||||||||||||||||||||||
| Amortization | 1,300 | 1,360 | 1,328 | 1,314 | 1,302 | |||||||||||||||||||||||||||||||||||
| Total assets | 1,870,734 | 1,776,643 | 1,654,164 | 1,599,268 | 1,591,691 | |||||||||||||||||||||||||||||||||||
| Long-term debt | 348,124 | 333,979 | 312,422 | 324,360 | 388,852 | |||||||||||||||||||||||||||||||||||
| Total debt | 355,174 | 354,027 | 335,396 | 349,810 | 428,033 | |||||||||||||||||||||||||||||||||||
| Shareholders’ equity | 1,242,684 | 1,153,898 | 1,049,210 | 983,785 | 908,695 | |||||||||||||||||||||||||||||||||||
| Return on average shareholders’ equity | 9.5 | % | 11.3 | % | 11.4 | % | 11.6 | % | 10.0 | % | ||||||||||||||||||||||||||||||
| Total debt to total capital | 22.2 | % | 23.5 | % | 24.2 | % | 26.2 | % | 32.0 | % | ||||||||||||||||||||||||||||||
| Employees | 4,130 | 3,983 | 3,887 | 3,618 | 3,570 | |||||||||||||||||||||||||||||||||||
The 2013 results include a charge of $31.7 million ($22.0 million after tax, or $0.44 per share) related to the 2013 restructuring program related to the relocation of the Flavors & Fragrances Group headquarters to Chicago, as well as a profit improvement plan across all segments of the Company.
The 2011 results include a charge of $4.8 million ($3.7 million after tax, or $0.07 per share) related to the Company’s plan to improve the profitability and efficiency of selected operations. The 2011 results also include a gain of $3.6 million ($3.6 million after tax, or $0.07 per share) related to the revaluation of the Company’s non-controlling interest in a subsidiary.
The 2010 results include a credit of $1.5 million ($0.9 million after tax, or $0.02 per share) for additional insurance proceeds received on the 2009 environmental claims.
The 2009 results include charges for the settlement of environmental claims and related legal expenses, net of insurance reimbursements, of $11.3 million ($6.9 million after tax, or $0.14 per share).
44
Directors & Officers
| Board of Directors | Elected Officers |
| Kenneth P. Manning, 72 | Kenneth P. Manning, 72 |
| Chairman and Chief Executive Officer | Chairman and Chief Executive Officer |
| Sensient Technologies Corporation | With the Company 26 years |
| Elected Director in 1989 (2, 6) | |
| John F. Collopy, 44 | |
| Hank Brown, 74 | Vice President and Treasurer |
| President Emeritus | With the Company 14 years |
| University of Colorado | |
| Elected Director in 2004 (1, 4, 5) | Christopher M. Daniels, 40 |
| Vice President, Human Resources | |
| Edward H. Cichurski, 72 | With the Company 14 years |
| Retired, Former Partner | |
| PricewaterhouseCoopers | Michael C. Geraghty, 52 |
| Elected Director in 2013 (1, 5, 6) | President, Color Group |
| With the Company 2 years | |
| Fergus M. Clydesdale, Ph.D., 77 | |
| Distinguished Professor, | John L. Hammond, 67 |
| Department of Food Science, and Director | Senior Vice President, General Counsel and Secretary |
| of the Food Science Policy Alliance at the | With the Company 16 years |
| University of Massachusetts – Amherst | |
| Elected Director in 1998 (2, 3, 4, 6) | Richard F. Hobbs, 66 |
| Senior Vice President and Chief Financial Officer | |
| James A.D. Croft, 76 | With the Company 40 years |
| Chairman | |
| Bartlodge Limited | Jeffrey T. Makal, 50 |
| Elected Director in 1997 (1, 2, 3, 6) | Vice President, Controller |
| and Chief Accounting Officer | |
| William V. Hickey, 69 | With the Company 17 years |
| Retired, Former President and Chief Executive Officer | |
| Sealed Air Corporation | Richard J. Malin, 47 |
| Elected Director in 1997 (1, 2, 4, 5) | Assistant Controller |
| With the Company 22 years | |
| Paul Manning, 39 | |
| President and Chief Operating Officer | John J. Manning, 45 |
| Sensient Technologies Corporation | Vice President and Assistant General Counsel |
| Elected Director in 2012 (2, 5, 6) | With the Company 1 year |
| Elaine R. Wedral, Ph.D., 69 | Paul Manning, 39 |
| Retired, Former President | President and Chief Operating Officer |
| Nestle’s Research and Development | With the Company 4 years |
| Worldwide Food Service Systems | |
| Elected Director in 2006 (5, 6) | Stephen J. Rolfs, 49 |
| Senior Vice President, Administration | |
| Essie Whitelaw, 66 | With the Company 16 years |
| Retired, Former Senior Vice President, Operations | |
| Wisconsin Physician Services | Robert J. Wilkins, 57 |
| Elected Director in 1993 (3, 4, 6) | President, Asia Pacific Group |
| With the Company 10 years | |
| Committees | Appointed Officers |
| 1 Audit Committee | Douglas L. Arnold, 50 |
| 2 Executive Committee | Vice President, Administrative Services |
| 3 Compensation and | With the Company 16 years |
| Development Committee | |
| 4 Nominating and Corporate | Leroy C. Watson, 40 |
| Governance Committee | Vice President, Taxation |
| 5 Finance Committee | With the Company 8 years |
| 6 Scientific Advisory Committee |
45
Investor Information
World Headquarters
777 East Wisconsin Avenue
Milwaukee, Wisconsin 53202-5304
(414) 271-6755
(800) 558-9892
Fax: (414) 347-4788
E-mail:
corporate.communications@sensient.com
Web site:
www.sensient.com
Transfer Agent and Registrar
Wells Fargo Bank Minnesota, N.A.
Shareowner Services
P. O. Box 64854
St. Paul, Minnesota 55164-0854
(800) 468-9716
Web site:
www.wellsfargo.com/shareownerservices
Common Stock
Sensient Technologies Corporation Common Stock is traded on the New York Stock Exchange.
Ticker symbol: SXT.
There were 2,662 shareholders of record of Common Stock as of January 31, 2014.
Annual Meeting of Shareholders
The Annual Meeting of Shareholders is scheduled to be held at 2:00 p.m. (CDT) on Thursday, April 24, 2014, at Trump International Hotel, 401 N. Wabash Avenue, Chicago, Illinois.
Annual Report and Proxy Statement
The Company’s annual report and proxy statement are available online at www.sensient.com/financial/ annualreport_and_proxy.htm.
Form 10-K
The Company’s annual report filed with the Securities and Exchange Commission on Form 10-K is available without charge from the Company’s Investor Relations Department and on its web site at www.sensient.com.
In accordance with New York Stock Exchange rules and pursuant to Rule 13a-14 under the Securities Exchange Act of 1934, Paul Manning, as the Company’s Chief Executive Officer, and Richard F. Hobbs, as the Company’s Chief Financial Officer, have certified the quality of the Company’s public disclosure in an exhibit to the Company’s Annual Report on Form 10-K for the year ended December 31, 2013.
Dividends
Quarterly dividends are typically paid on the first business day of March, June, September and December. Automatic Dividend Reinvestment Plan The Sensient Technologies Corporation Dividend Reinvestment Plan provides shareholders with a convenient, economical way to increase their ownership of Sensient Technologies Corporation Common Stock. Through the plan, shareholders can automatically reinvest their dividends to acquire additional shares and make supplemental stock purchases without paying fees or commissions. An enrollment form and brochure describing the plan can be obtained by contacting the plan administrator, Wells Fargo Bank Minnesota, N.A. at (800) 468-9716, or the Company’s Investor Relations Department at (414) 347-3827.
Investor Relations
Communications concerning the transfer of shares, lost certificates, duplicate mailings or change of address should be directed to the transfer agent.
Other shareholder information, such as news releases and information regarding corporate governance, is available on the Company’s web site: www.sensient.com. Shareholders can also register to receive notification via e-mail when new information is added to the site. The Company’s web address is provided as an inactive textual reference only, and the contents of the web site are not incorporated in or otherwise to be regarded as part of this annual report.
Other requests for information should be directed to the Company’s Investor Relations Department at (414) 347-3827.
