Exhibit 13.1
2 0 1 4 A N N U A L R E P O R T growing shareholder value

Sensient Technologies Corporation is a leading global developer, manufacturer and marketer of advanced color, flavor and fragrance systems. Sensient uses state-ofthe-art technologies at facilities around the world to develop and manufacture customized food and beverage systems Pharmaceutical colors, coatings and excipients; cosmetic color and ingredient systems; household and industrial product formulations; digital inks; and other specialty colors and chemicals. Financial Highlights in thousands except per share Years ended December 31, 2014 2013 % Change % Change Local CurrencyResults from Continuing Operations Revenue $1,447,821 $1,462,126 (1%) 0% Operating Income from Continuing Operations 130,665 173,780 (25%) (24%) Net Earnings from Continuing Operations 81,771 114,298 (28%) (27%) Diluted Earnings per Share from Continuing Operations 1.67 2.29 (27%) (26%) Adjusted Results from Continuing Operations* Adjusted Operating Income* 221,215 205,515 8% 9% Adjusted Net Earnings* 147,307 136,257 8% 9% Adjusted Diluted Earning per Share* 3.02 2.73 11% 12% Cash Flow Activity Cash Flows from Operating Activities 189,188 153,553 23% Capital Expenditures 79,398 104,246 (24%) Free Cash Flow 109,790 49,307 123% Total Debt 466,899 355,174 31% Dividends per share 0.98 0.91 8%* These are non-GAAP financial measures. Please see page 15 of this report (reference to Non-GAAP Financial Measures in MD&A section) for a reconciliation of these measures to GAAP and a discussion of why the Company is presenting this information.
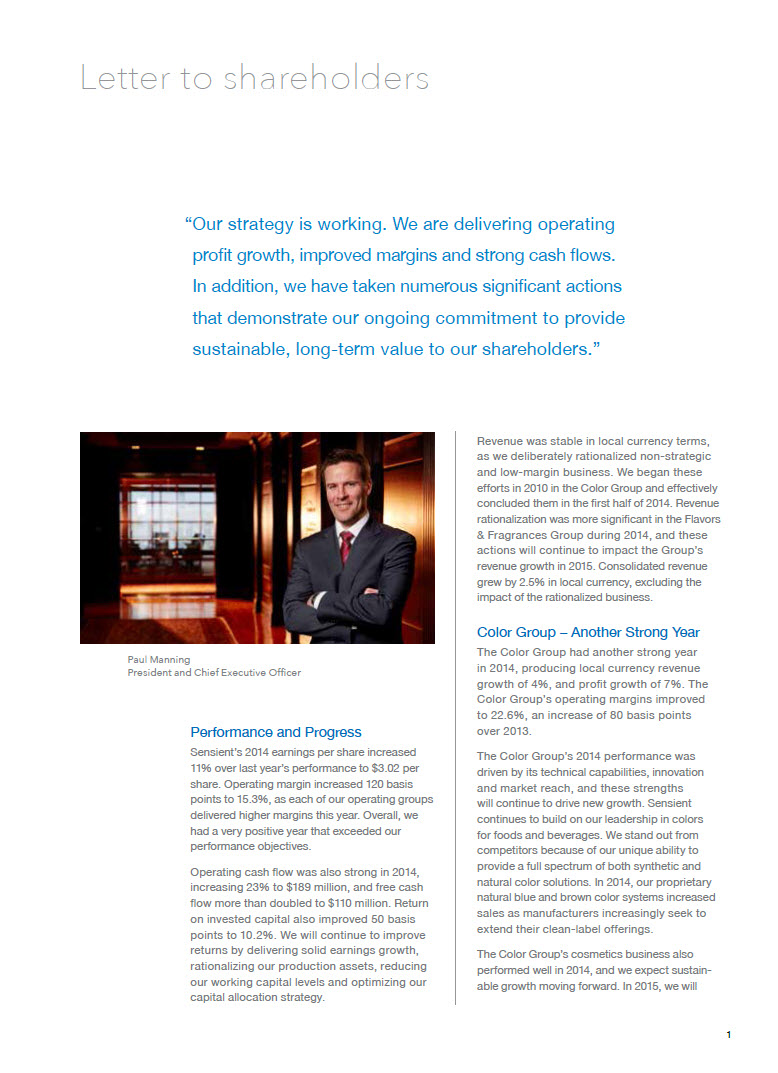
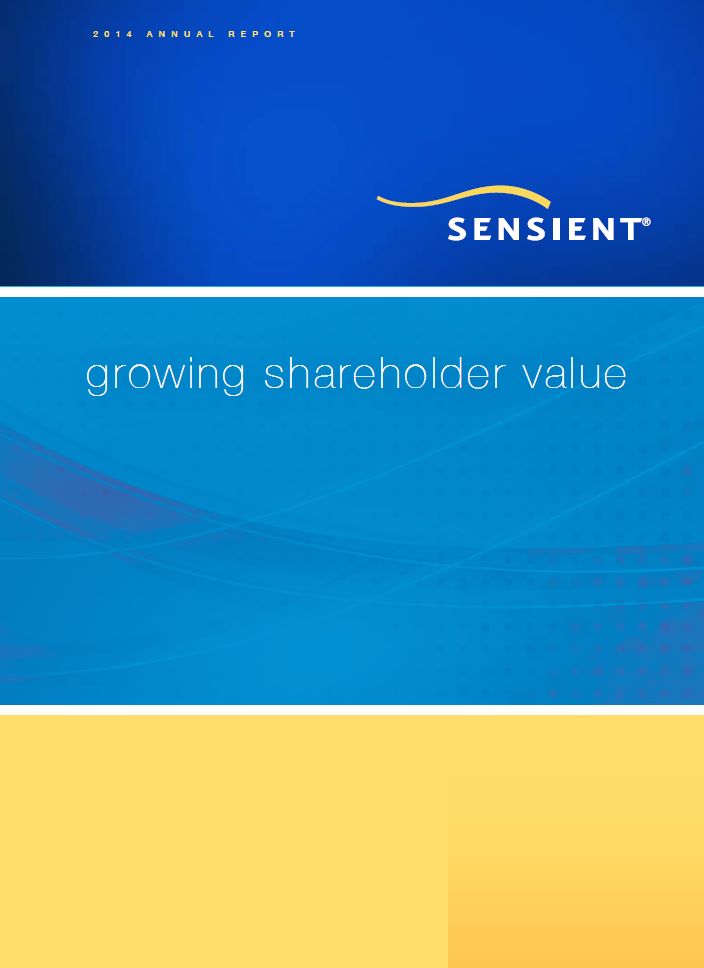
Letter to shareholders “ Our strategy is working. We are delivering operating profit growth, improved margins and strong cash flows. In addition, we have taken numerous significant actions that demonstrate our ongoing commitment to provide sustainable, long‐term value to our shareholders.” Paul Manning President and Chief Executive Officer Performance and Progress Sensient’s 2014 earnings per share increased 11% over last year’s performance to $3.02 per share. Operating margin increased 120 basis points to 15.3%, as each of our operating groups delivered higher margins this year. Overall, we had a very positive year that exceeded our performance objectives. Operating cash flow was also strong in 2014, increasing 23% to $189 million, and free cash flow more than doubled to $110 million. Return on invested capital also improved 50 basis points to 10.2%. We will continue to improve returns by delivering solid earnings growth, rationalizing our production assets, reducing our working capital levels and optimizing our capital allocation strategy. Revenue was stable in local currency terms, as we deliberately rationalized non‐strategic and low‐margin business. We began these efforts in 2010 in the Color Group and effectively concluded them in the first half of 2014. Revenue rationalization was more significant in the Flavors & Fragrances Group during 2014, and these actions will continue to impact the Group’s revenue growth in 2015. Consolidated revenue grew by 2.5% in local currency, excluding the impact of the rationalized business. Color Group – Another Strong Year The Color Group had another strong year in 2014, producing local currency revenue growth of 4%, and profit growth of 7%. The Color Group’s operating margins improved to 22.6%, an increase of 80 basis points over 2013. The Color Group’s 2014 performance was driven by its technical capabilities, innovation and market reach, and these strengths will continue to drive new growth. Sensient continues to build on our leadership in colors for foods and beverages. We stand out from competitors because of our unique ability to provide a full spectrum of both synthetic and natural color solutions. In 2014, our proprietary natural blue and brown color systems increased sales as manufacturers increasingly seek to extend their clean‐label offerings. The Color Group’s cosmetics business also performed well in 2014, and we expect sustainable growth moving forward. In 2015, we will 1
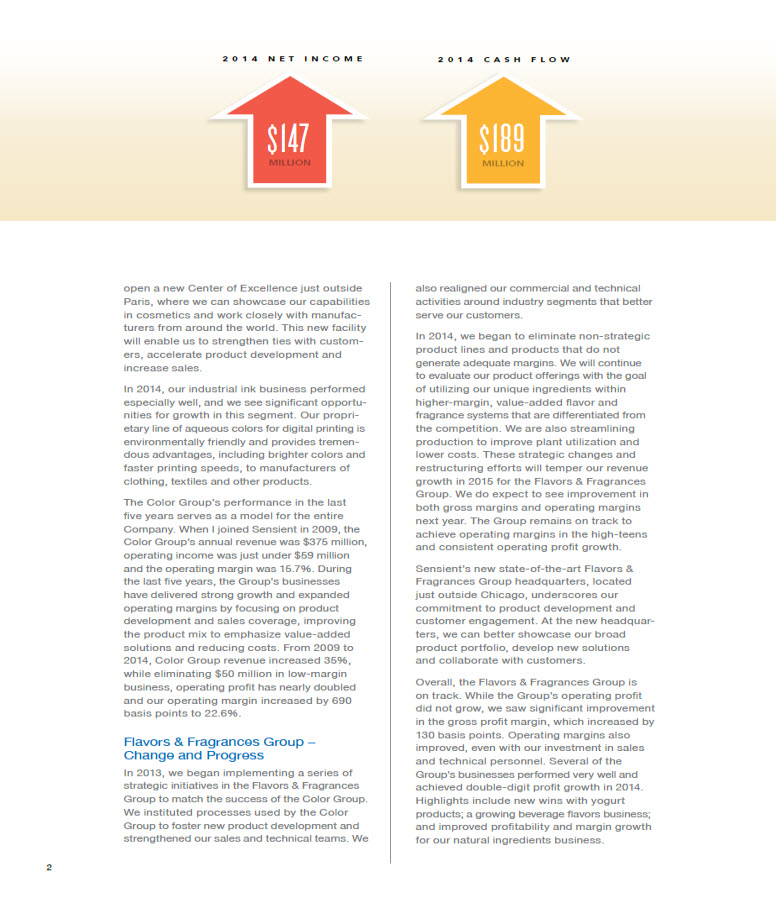
2 0 1 4 N E T I N C O M E MILLION $147 2 2 0 1 4 C A S H F L O W MILLION $189 open a new Center of Excellence just outside Paris, where we can showcase our capabilities in cosmetics and work closely with manufacturers from around the world. This new facility will enable us to strengthen ties with customers, accelerate product development and increase sales. In 2014, our industrial ink business performed especially well, and we see significant opportunities for growth in this segment. Our proprietary line of aqueous colors for digital printing is environmentally friendly and provides tremendous advantages, including brighter colors and faster printing speeds, to manufacturers of clothing, textiles and other products. The Color Group’s performance in the last five years serves as a model for the entire Company. When I joined Sensient in 2009, the Color Group’s annual revenue was $375 million, operating income was just under $59 million and the operating margin was 15.7%. During the last five years, the Group’s businesses have delivered strong growth and expanded operating margins by focusing on product development and sales coverage, improving the product mix to emphasize value‐added solutions and reducing costs. From 2009 to 2014, Color Group revenue increased 35%, while eliminating $50 million in low-margin business, operating profit has nearly doubled and our operating margin increased by 690 basis points to 22.6%. Flavors & Fragrances Group – Change and Progress In 2013, we began implementing a series of strategic initiatives in the Flavors & Fragrances Group to match the success of the Color Group. We instituted processes used by the Color Group to foster new product development and strengthened our sales and technical teams. We also realigned our commercial and technical activities around industry segments that better serve our customers. In 2014, we began to eliminate non‐strategic product lines and products that do not generate adequate margins. We will continue to evaluate our product offerings with the goal of utilizing our unique ingredients within higher‐margin, value‐added flavor and fragrance systems that are differentiated from the competition. We are also streamlining production to improve plant utilization and lower costs. These strategic changes and restructuring efforts will temper our revenue growth in 2015 for the Flavors & Fragrances Group. We do expect to see improvement in both gross margins and operating margins next year. The Group remains on track to achieve operating margins in the high‐teens and consistent operating profit growth. Sensient’s new state‐of‐the‐art Flavors & Fragrances Group headquarters, located just outside Chicago, underscores our commitment to product development and customer engagement. At the new headquarters, we can better showcase our broad product portfolio, develop new solutions and collaborate with customers. Overall, the Flavors & Fragrances Group is on track. While the Group’s operating profit did not grow, we saw significant improvement in the gross profit margin, which increased by 130 basis points. Operating margins also improved, even with our investment in sales and technical personnel. Several of the Group’s businesses performed very well and achieved double‐digit profit growth in 2014. Highlights include new wins with yogurt products; a growing beverage flavors business; and improved profitability and margin growth for our natural ingredients business. 2
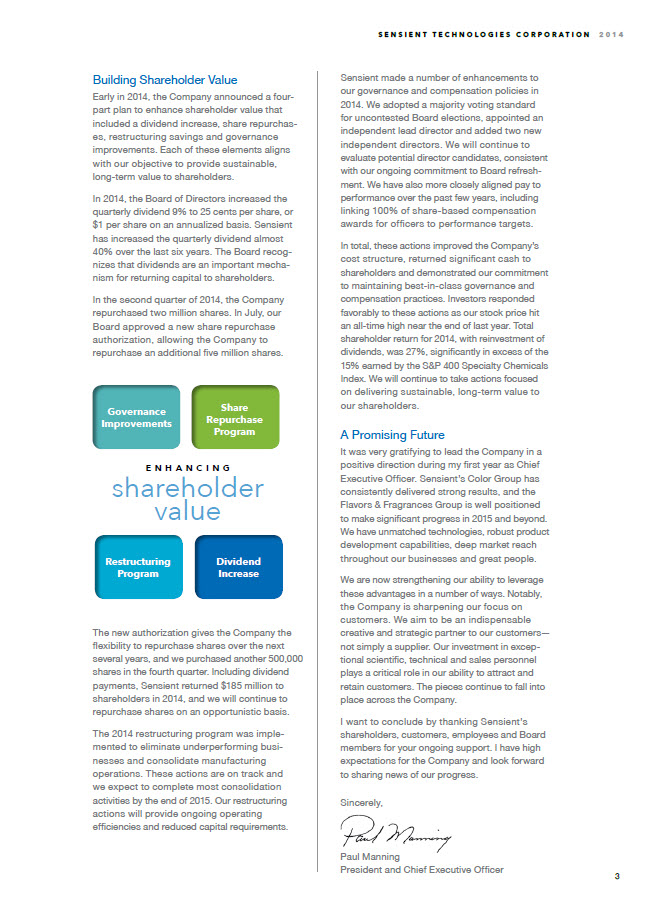
S E N S I E N T T E C H N O L O G I E S C O R P O R AT I O N 2 0 1 4 Building Shareholder Value Early in 2014, the Company announced a fourpart plan to enhance shareholder value that included a dividend increase, share repurchases, restructuring savings and governance improvements. Each of these elements aligns with our objective to provide sustainable, long-term value to shareholders. In 2014, the Board of Directors increased the quarterly dividend 9% to 25 cents per share, or $1 per share on an annualized basis. Sensient has increased the quarterly dividend almost 40% over the last six years. The Board recognizes that dividends are an important mechanism for returning capital to shareholders. In the second quarter of 2014, the Company repurchased two million shares. In July, our Board approved a new share repurchase authorization, allowing the Company to repurchase an additional five million shares. The new authorization gives the Company the flexibility to repurchase shares over the next several years, and we purchased another 500,000 shares in the fourth quarter. Including dividend payments, Sensient returned $185 million to shareholders in 2014, and we will continue to repurchase shares on an opportunistic basis. The 2014 restructuring program was implemented to eliminate underperforming businesses and consolidate manufacturing operations. These actions are on track and we expect to complete most consolidation activities by the end of 2015. Our restructuring actions will provide ongoing operating efficiencies and reduced capital requirements. Sensient made a number of enhancements to our governance and compensation policies in 2014. We adopted a majority voting standard for uncontested Board elections, appointed an independent lead director and added two new independent directors. We will continue to evaluate potential director candidates, consistent with our ongoing commitment to Board refreshment. We have also more closely aligned pay to performance over the past few years, including linking 100% of share-based compensation awards for officers to performance targets. In total, these actions improved the Company’s cost structure, returned significant cash to shareholders and demonstrated our commitment to maintaining best‐in‐class governance and compensation practices. Investors responded favorably to these actions as our stock price hit an all‐time high near the end of last year. Total shareholder return for 2014, with reinvestment of dividends, was 27%, significantly in excess of the 15% earned by the S&P 400 Specialty Chemicals Index. We will continue to take actions focused on delivering sustainable, long‐term value to our shareholders. A Promising Future It was very gratifying to lead the Company in a positive direction during my first year as Chief Executive Officer. Sensient’s Color Group has consistently delivered strong results, and the Flavors & Fragrances Group is well positioned to make significant progress in 2015 and beyond. We have unmatched technologies, robust product development capabilities, deep market reach throughout our businesses and great people. We are now strengthening our ability to leverage these advantages in a number of ways. Notably, the Company is sharpening our focus on customers. We aim to be an indispensable creative and strategic partner to our customers— not simply a supplier. Our investment in exceptional scientific, technical and sales personnel plays a critical role in our ability to attract and retain customers. The pieces continue to fall into place across the Company. I want to conclude by thanking Sensient’s shareholders, customers, employees and Board members for your ongoing support. I have high expectations for the Company and look forward to sharing news of our progress. Sincerely, Paul Manning President and Chief Executive Officer

RATEGIC Initiatives Sensient’s long-term strategy positions the Company for increased profitability and sustainable growth. The components of our strategy enable us to succeed in growing markets and deliver value to shareholders. E M P H A S I S O N Sensient is accelerating our shift to a product portfolio of complex, technology-driven systems that cannot be easily duplicated by our competitors. Our specialty systems bring unique attributes to our customers’ end products, which drives success in highly competitive consumer segments. Our products stand apart in the marketplace, enabling us to attract new projects, retain customers for the long term and achieve higher margins. We continue to exit low-margin, non-strategic businesses that do not offer growth opportunities or strong value to our customers. E N H A N C E D C A P I T A L A L L O C AT I O N The Company continues to improve capital allocation by reinvesting in projects with the highest return on invested capital, while maintaining investment-grade debt levels. We are also delivering shareholder value with a substantial dividend and stock buyback program.

I N D U S T R Y- L E A D I N G Personnel Sensient continually seeks out personnel with creative initiative, competitive energy and a commitment to serving customers and advancing the Company’s standing in the marketplace. We recruit top-level scientists, technicians and sales professionals with deep industry experience. Our personnel provide insight and expertise valued by our customers. O P T I M I Z E D M A N U FA C T U R I N G A C O M M I T M E N T TO O R G A N I C G R O W T H A N D I N N O V AT I O N Sensient is expanding our business by strengthening our engagement with customers at all stages of product development and manufacturing. We are also driving organic growth through our steadfast commitment to innovation and new product development.

COLOR Group Sensient’s Color Group is the leading global developer of high-performance colors and specialty ingredients for major consumer product segments. Through a robust R&D program, we advance the science of color and provide ongoing innovations that enable our customers to excel in highly competitive markets. We focus on developing unique products that deliver value to our customers. MARKETS WE SERV E % O F R E V E N U E G E N E R A T E D 59% 22% 14% Food and Beverage Colors Cosmetic Ingredients Specialty Inks
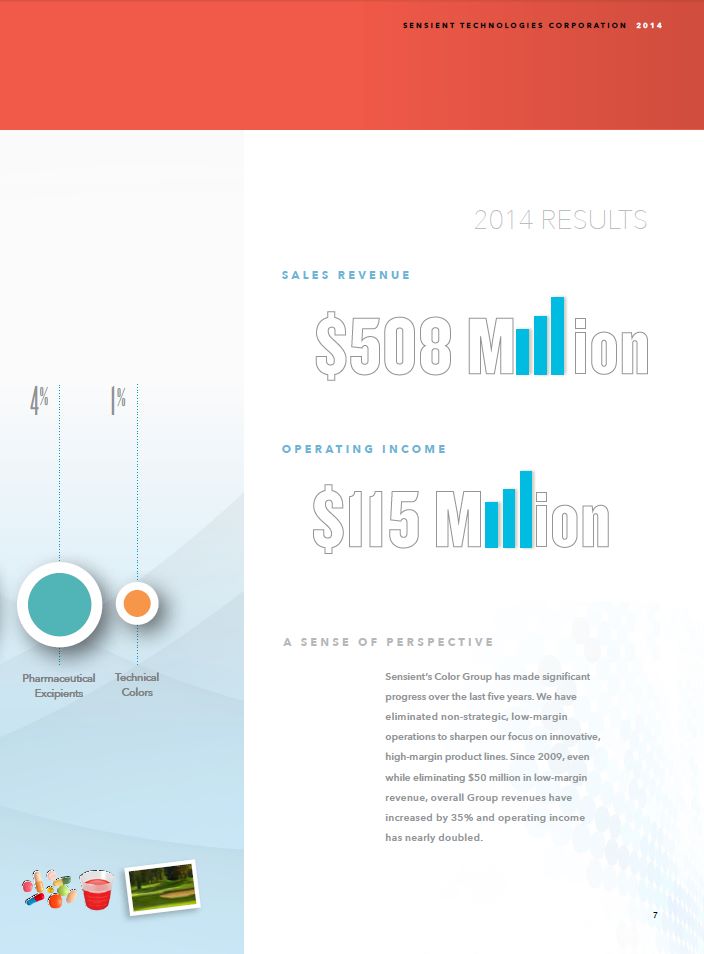
S E N S I E N T T E C H N O L O G I E S C O R P O R AT I O N 2 0 1 4 2014 RESULTS S A L E S R E V E N U E 4% 1% O P E R AT I N G I N C O M E A S E N S E O F P E R S P E C T I V E Pharmaceutical Excipients Technical Colors Sensient’s Color Group has made significant progress over the last five years. We have eliminated non-strategic, low-margin operations to sharpen our focus on innovative, high-margin product lines. Since 2009, even while eliminating $50 million in low-margin revenue, overall Group revenues have increased by 35% and operating income has nearly doubled.

OLOR Group I N N OVAT I V E C O LOR S O LU T I O N S LARGEST PORTFOLIO Sensient partners with our customers to help them recognize consumer trends and benefit from the latest color innovations. We offer the broadest spectrum of natural and synthetic color systems for food and non-food markets available in the industry. A REVOLUTIONARY CHANGE IN DIGITAL PRINTING Sensient’s high-performance aqueous color systems for digital printing are enabling clothing, textile and other industrial manufacturers to make significant production and logistics changes that greatly improve their businesses. With Sensient technology, our customers can create a versatile selection of products using rapid, short-run printing that reduces cost and minimizes environmental impacts.

S E N S I E N T T E C H N O L O G I E S C O R P O R AT I O N 2 0 1 4 Sensient’s comprehensive approach to supply chain management enables our customers to maintain efficient operations and protect the value of their brands. Our emphasis on product safety through sourcing, manufacturing and testing provides peace of mind to our customers G L O B A L I N N O V AT I O N GLO CAL L O C A L A P P L I C AT I O N While Sensient’s R&D centers develop technologies with global scope, our regional service labs work closely with customers to formulate applications for local markets. The Company’s best-in-class technical, regulatory and sales services strengthen our ties to customers. S U P P LY C H A I N S A F E T Y it’s only N AT U R A L CLEAN-LABEL FOOD AND BEVERAGE Consumers are increasingly seeking naturally sourced products but still want vibrant, colorful products. Sensient is making significant progress in closing the gap between natural and synthetic colors. Our proprietary natural blue greatly expands the range of natural colors available across all food and beverage categories.

Group Sensient’s Flavors & Fragrances Group is a leading provider of specialty systems for manufacturers of foods, beverages and household products. We combine proprietary technologies, scientific expertise and consumer insight to create unique solutions that enable our customers to excel in competitive markets. We will achieve higher margins and sustainable growth by emphasizing value-added, technology-based flavor and fragrance systems. MARKETS WE SERV E % O F R E V E N U E G E N E R A T E D 27% 27% 20% 10% Natural Ingredients Sweet Savory Fragrance

S E N S I E N T T E C H N O L O G I E S C O R P O R AT I O N 2 0 1 4 2014 RESULTS S A L E S R E V E N U E 9% 7% Beverage BioNutrient A S T R O N G E R D I R E C T I O N In 2013, Sensient changed the strategic direction of the Flavors & Fragrances Group to drive operating profit growth. We began to shift our product mix to higher-margin, value-added products; added new management talent; and focused on cost reduction. We realigned our business units around customer-focused segments and relocated the Group’s global headquarters to the Chicago area. In 2014, we started the process of consolidating manufacturing facilities, which will provide substantial, ongoing cost savings. The Group’s gross profit margins improved by 130 basis points in 2014, and we expect continued improvement in operating margins during the next few years.

FRAGRANCES Group Natural Extracts D E L I V E R I N G T H E TA S T E O F NAT U R E Sensient uses proprietary extraction technologies to develop vibrant, authentic taste profiles from botanical sources. The resulting natural extracts can be combined to create an infinite variety of flavors, enabling our customers to manufacture unique products that stand out in the marketplace. Sensient’s raw-material sourcing helps ensure quality control, product safety and traceability. As a result, manufacturers can enhance their marketing by labeling finished products with specific provenance declarations. health & wellness Drawing on Sensient’s unique flavor portfolio, food and beverage manufacturers are able to meet the growing consumer demand for products with reduced sugar, sodium and fat. Our flavor technologies enable caloric -reduction, while enhancing taste, masking offnotes and adding nutritional value. We will continue to increase sales and strengthen our leadership in the expanding health and wellness segment.

S E N S I E N T T E C H N O L O G I E S C O R P O R AT I O N 2 0 1 4 less fat less sodium less sugar A proprietary, all-natural line of flavormasking technologies, Smoothenol 2G™ eliminates off-notes and aftertastes associated with a new generation of natural, clean-label food and beverage products. This complete flavor-masking toolkit is unmatched in the industry. M O R E More Appealing SMOOTHENOL 2G™ NATURAL MASKING TECHNOLOGY More Choices PURE VARIETALS TRUE-TO-TYPE NATURAL FLAVORS Today’s consumers are increasingly seeking fruit varietals as part of a healthy and flavorful diet. To enable our customers to capitalize on this trend, we introduced Pure Varietals, which bring distinct true-to-type fruit flavors to foods and beverages. This product line includes several fruit varieties, notably ten apple, six peach and six cherry flavors.

FRAGRANCES Group 14 THE VALUE OF CONSUMER INSIGHT A P O S I T I V E R E ACTION Simple Apple Complete Apple Pie Sensient combines exclusive ingredients and reaction flavor technologies to develop more complex flavor profiles that appeal to consumers. These sophisticated systems result in authentic tastes that mirror entire dishes; for instance, not apple, but apple pie—complete with fruit, spice, sweetness and crust. Sensient consumer researchers shape product development and provide valuable insight to our customers. Through our proprietary predictive process, we identify consumer trends and emerging flavor preferences that drive new business development across all of our market segments. In 2014, our consumer insight research led to numerous product introductions including spirits, sauces and frozen desserts.
Sensient Technologies Corporation 2014
Management’s Discussion & Analysis of Operations & Financial Condition
OVERVIEW
Sensient Technologies Corporation (the “Company”) reported earnings per share from continuing operations of $1.67, which included $90.6 million, or $1.34 per share, of restructuring and other costs. As a part of its plan to enhance shareholder value, the Company implemented a restructuring plan (2014 Restructuring Plan), to eliminate underperforming operations, consolidate manufacturing facilities and improve efficiencies within the Company. The 2014 Restructuring Plan is anticipated to cost between $120 million and $130 million and reduce annual operating costs by approximately $30 million per year. Earnings per share from continuing operations were $2.29 in 2013, which includes restructuring costs of $31.7 million or $0.44 per share.
The Company’s adjusted 2014 earnings per share from continuing operations, adjusted to eliminate the impact of restructuring and other costs, increased 10.6% to $3.02 per share from $2.73 per share in 2013. Consolidated gross margin increased 130 basis points in 2014 to 33.9% and consolidated operating margin increased 120 basis points in 2014 to 15.3%, both before restructuring costs. The gross margin and operating margin improvements were driven by the Company’s focus on selling higher margin products and lower costs.
Cash flows from operating activities were very strong, increasing 23.2% in 2014 to $189.2 million from $153.6 million in 2013. The Company used its strong cash flows and debt capacity to repurchase 2.5 million shares of Company stock during the year. In addition, the Company increased its quarterly dividend 9% to 25 cents per share, or $1.00 per share on an annualized basis.
Additional information on the results is included below.
NON-GAAP FINANCIAL MEASURES
The table below reconciles certain reported results for years ended December 31, 2014 and 2013, to those results before the impact of the restructuring costs, which are non-GAAP financial measures. The Company has included non-GAAP financial measures to remove the costs related to the restructuring activities and other costs and provide investors with a view of operating performance excluding those costs. These non-GAAP financial measures are utilized by management in comparing the Company’s operating performance on a consistent basis. The Company believes that these financial measures are appropriate to enhance an overall understanding of the Company’s underlying operating performance trends compared to historical and prospective periods. The Company also believes that these measures should not be considered in isolation from, or as a substitute for, financial information calculated in accordance with GAAP.
| | | Twelve Months Ended December 31, | | | | |
| | | 2014 | | | 2013 | | | % Change | |
| Operating Income from continuing operations (GAAP) | | $ | 130,665 | | | $ | 173,780 | | | | (24.8 | %) |
| Restructuring - Cost of products sold | | | 1,914 | | | | 1,840 | | | | | |
| Restructuring & other - Selling and administrative | | | 88,636 | | | | 29,895 | | | | | |
| Adjusted operating income | | $ | 221,215 | | | $ | 205,515 | | | | 7.6 | % |
| Net Earnings from continuing operations (GAAP) | | $ | 81,771 | | | $ | 114,298 | | | | (28.5 | %) |
| Restructuring & other, before tax | | | 90,550 | | | | 31,735 | | | | | |
| Tax impact of restructuring & other | | | (25,014 | ) | | | (9,776 | ) | | | | |
| Adjusted net earnings | | $ | 147,307 | | | $ | 136,257 | | | | 8.1 | % |
| Diluted EPS from continuing operations (GAAP) | | $ | 1.67 | | | $ | 2.29 | | | | (27.1 | %) |
| Restructuring & other, net of tax | | | 1.34 | | | | 0.44 | | | | | |
| Adjusted diluted EPS | | $ | 3.02 | | | $ | 2.73 | | | | 10.6 | % |
RESTRUCTURING ACTIVITIES
In 2014, the Company announced that it was initiating its 2014 Restructuring Plan to eliminate underperforming operations, consolidate manufacturing facilities and improve efficiencies within the Company. The Company expects this plan to cost between $120 million and $130 million, and upon completion is anticipated to reduce annual operating costs by approximately $30 million per year. Incremental savings will be achieved over the next few years and the full benefit is expected to be achieved after 2016. Based on this plan, the Company determined that certain long-lived assets associated with the underperforming operations were impaired. The Company reduced the carrying amounts of these assets to their aggregate respective fair values of approximately $35 million, which were determined based on independent market values for these assets. Certain machinery and equipment has also been identified to be disposed of at the time of the facility closures and the associated depreciation for these assets has been accelerated. In addition, certain intangible assets and inventory were determined to be impaired and were written down. Employee separation and other restructuring costs were also incurred during 2014. The Company will reduce headcount by approximately 300 positions at impacted facilities primarily in the Flavors & Fragrance Group, related to direct and indirect labor at manufacturing sites. As of December 31, 2014, approximately 100 employees have been terminated. The Company recorded $101.5 million of restructuring and other costs in 2014, in accordance with GAAP and based on an internal review of the affected facilities and consultation with legal and other advisors. The Company expects to incur approximately $21 million to $31 million of additional restructuring costs by the end of 2016.
In connection with the 2014 Restructuring Plan, the Company approved a plan to dispose of a business within the Color segment. Production ceased in 2014 and the business met the criteria to be reported as a discontinued operation. The pre-tax loss from discontinued operations, which includes restructuring costs, was $11.5 million for 2014.
In 2013, the Company successfully completed its 2013 restructuring program related to relocating the Flavors & Fragrances Group headquarters to Chicago, and generating operating efficiencies across all segments of the Company by consolidating multiple facilities throughout Europe and North America. The Company recorded total costs of $31.7 million in 2013 related to the 2013 restructuring program, which included employee separation costs of $18.1 million, long-lived asset impairment of $4.2 million, gain on asset sale of $3.0 million, inventory write-down of $1.8 million, and other costs of $10.7 million. The other costs mainly consisted of decommissioning costs, professional service costs, personnel (other than employee separations) and moving related costs. The plan resulted in the reduction of global headcount of approximately 280 employees performing various functions. Management estimates that operating costs were reduced by approximately $12 million and $7 million as of December 31, 2014 and 2013, respectively.
RESULTS OF CONTINUING OPERATIONS
2014 vs. 2013
Sensient’s revenue was approximately $1.4 billion in 2014 and $1.5 billion in 2013. Sensient continues to shift to value added and technology driven products in each of our Groups, while actively rationalizing non-strategic and low margin business. Removing the impact of our rationalization efforts, our consolidated revenue increased 1.5% in 2014. Foreign currency translation did not have a material impact on consolidated revenue in 2014. Additional information on group results can be found in the Segment Information section.
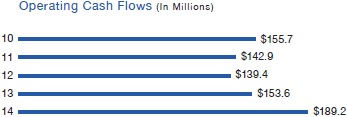
The Company’s gross margin was 33.7% in 2014 and 32.5% in 2013. Included in the cost of sales are $1.9 million and $1.8 million of restructuring costs for 2014 and 2013, respectively, which reduced gross profit. Before these restructuring costs, gross margin increased 130 basis points to 33.9% in 2014 from 32.6% in 2013, primarily due to an increase in selling prices.
Selling and administrative expense as a percent of revenue was 24.7% in 2014 and 20.6% in 2013. Restructuring costs of $88.6 million and $30.0 million for 2014 and 2013, respectively, were included in selling and administrative expense. Before these restructuring costs, selling and administrative expense as a percent of revenue was 18.6% in both 2014 and 2013.
Operating income was $130.7 million in 2014 and $173.8 million in 2013. Before the restructuring costs, operating income increased 7.6% to $221.2 million in 2014 from $205.5 million in 2013 and consolidated operating margin increased 120 basis points to 15.3%. Additional information on group results can be found in the Segment Information section.
Interest expense was $16.1 million in both 2014 and 2013. The decrease in average interest rates offset the higher average outstanding debt balance.
The effective income tax rate was 28.6% in 2014 and 27.5% in 2013. The effective tax rates for both 2014 and 2013 were reduced by discrete items, including the favorable resolution of prior years’ tax matters and restructuring costs. In total, the discrete items and the impact of restructuring costs had no impact on the effective tax rate for 2014 and reduced the effective tax rate by 2.0% in 2013.
| | | 2014 | | | 2013 | |
| Rate before restructuring and discrete items | | | 28.6 | % | | | 29.5 | % |
| Restructuring impact | | | 0.8 | % | | | (0.3 | %) |
| Discrete items | | | (0.8 | %) | | | (1.7 | %) |
| Reported effective tax rate | | | 28.6 | % | | | 27.5 | % |
The effective tax rate for 2015 is expected to be between 29.5% and 30.5% prior to the recording of any discrete items and restructuring costs.
SEGMENT INFORMATION
The Company determines its operating segments based on information utilized by the chief operating decision maker to allocate resources and assess performance. Group performance is evaluated on operating income of the respective business units before restructuring charges which are reported in the Corporate & Other segment.
The Company’s reportable segments consist of the Flavors & Fragrances Group and Color Group. The results of two additional operating segments, the Asia Pacific Group and Flavors Central & South America, are reported in the Corporate & Other segment. Beginning in 2014, the results of operations for the Company’s fragrances business in Asia Pacific, previously reported in the Corporate & Other segment, are reported in the Flavors & Fragrances segment, and the results of operations for the Company’s pharmaceutical flavors business, previously reported in the Flavors & Fragrances segment, are reported in the Color segment with the pharmaceutical colors business. The Color segment results have been restated to remove the impact of a discontinued operation. The prior year results have been restated as a result of these changes.
Flavors & Fragrances Revenue for the Flavors & Fragrances Group was $847.0 million in 2014 and $876.5 million in 2013. The decrease in revenue was primarily due to lower revenue in North America ($23.3 million) and the unfavorable impact of exchange rates ($5.5 million). The lower revenue in North America was primarily related to lower natural ingredient volumes. In local currency, revenue decreased 2.7%.
Gross margin increased 130 basis points to 26.6% in 2014 from 25.3% in 2013. The increase was primarily due to the impact of higher selling prices.
Operating income for the Flavors & Fragrances Group was $119.1 million in 2014 and $120.3 million in 2013. The decrease was primarily due to the impact of unfavorable exchange rates ($0.9 million). Higher profit in North America ($1.1 million) and Mexico ($0.4 million) was offset by lower profit in Europe ($1.8 million). The higher profit in North America was due to higher selling prices, and savings associated with the restructuring program. The lower profit in Europe was primarily due to higher employee costs. In local currency, operating income decreased 0.3%. Operating margin for the Flavors & Fragrances Group increased 40 basis points to 14.1% in 2014 from 13.7% in 2013, primarily due to the Group’s focus on higher margin, value-added products.
Color Revenue for the Color Group increased 2.6% in 2014 to $508.1 million from $495.1 million in 2013. The increase in revenue was primarily due to higher sales of non-food colors ($11.8 million) and food and beverage colors ($6.5 million) partially offset by the unfavorable impact of exchange rates ($5.3 million). The higher sales of non-food colors were primarily due to higher volumes, and the higher sales of food and beverage colors were due to higher selling prices. In local currency, revenue increased 3.7%.
Gross margin for the Color Group increased 80 basis points to 41.7% in 2014 from 40.9% in 2013. The increase was primarily due to the impact of higher selling prices and the higher volumes.
Operating income for the Color Group increased 6.5% to $114.9 million in 2014 from $107.9 million in 2013. The increase was primarily due to non-food colors ($5.5 million) and food and beverage colors ($2.3 million) partially offset by the unfavorable impact of exchange rates ($0.8 million). The higher profit for non-food colors was primarily due to the higher volumes and favorable product mix. The higher profit for food and beverage colors was primarily due to higher selling prices. Operating margin for the Color Group increased 80 basis points to 22.6% in 2014 from 21.8% in 2013. In local currency, operating income increased 7.3%.
Corporate & Other The Corporate & Other segment includes the Asia Pacific Group and certain flavors businesses in Central and South America, combined with the corporate office expenses.
Revenue for the Corporate & Other segment was $146.7 million in 2014 and $145.2 million in 2013. The increase was primarily due to higher volumes and selling prices in the Asia Pacific Group offset by the unfavorable impact of exchange rates ($4.5 million). In local currency, revenue increased 4.2%.
The Corporate & Other segment reported operating losses of $103.3 million in 2014 and $54.4 million in 2013. Before the impact of restructuring costs, the Corporate & Other segment reported operating losses of $12.8 million and $22.6 million in 2014 and 2013, respectively. The improvement on results before the impact of restructuring costs was primarily due to lower corporate expenses and higher profit in the Asia Pacific Group. The lower corporate expenses were due to lower employee related compensation.
RESULTS OF CONTINUING OPERATIONS
2013 vs. 2012
Sensient’s revenue was approximately $1.5 billion in both 2013 and 2012. Revenue in the Flavors & Fragrances Group was $876.5 million in 2013 and $870.0 million in 2012. Color Group revenue was $495.1 million in 2013 and $500.7 million in 2012. Corporate & Other revenue, which includes the Company’s operations in the Asia Pacific region and certain flavor operations in Central and South America, was $145.2 million in 2013 and $139.6 million in 2012. Foreign currency translation did not have a material impact on consolidated revenue in 2013. Additional information on group results can be found in the Segment Information section.
The Company’s gross margin was 32.5% in 2013, an increase of 70 basis points from 31.8% in 2012. The 2013 gross margin before the impact of restructuring costs was 32.6%. The impact of increased selling prices and favorable product mix more than offset higher manufacturing costs in 2013.
Selling and administrative expense as a percent of revenue was 20.6% in 2013 compared to 18.6% in 2012. The increase in selling and administrative expenses during 2013 was attributable to the Company’s restructuring costs recorded in the year. Selling and administrative expense as a percent of revenue before the impact of restructuring costs in 2013 was 18.6%.
Operating income was $173.8 million in 2013 compared to $192.9 million in 2012. Before the $31.7 million of total restructuring costs, operating income for 2013 was $205.5 million, an increase of 6.6% from the prior year. Additional information on group results can be found in the Segment Information section.
Interest expense decreased 4.5% to $16.1 million in 2013 from $16.9 million in 2012. The decrease was due to lower average interest rates partially offset by higher average outstanding debt balances.
The effective income tax rate was 27.5% in 2013 and 28.9% in 2012. The effective tax rates for both 2013 and 2012 were reduced by discrete items, including the favorable resolution of prior years’ tax matters. In addition, the 2013 rate was impacted by restructuring costs. In total, these discrete items and the impact of restructuring costs reduced the effective tax rate for 2013 and 2012 by 2.0% and 2.2%, respectively.
| | | 2013 | | | 2012 | |
| Rate before restructuring and discrete items | | | 29.5 | % | | | 31.1 | % |
| Restructuring impact | | | (0.3 | %) | | | — | |
| Discrete items | | | (1.7 | %) | | | (2.2 | %) |
| Reported effective tax rate | | | 27.5 | % | | | 28.9 | % |
SEGMENT INFORMATION
Flavors & Fragrances Revenue for the Flavors & Fragrances Group was $876.5 million in 2013 and $870.0 million in 2012. The Group reported higher selling prices ($15.4 million) and the favorable impact of foreign currency translation ($4.5 million), partially reduced by lower volumes ($13.4 million). Higher selling prices were reported in both natural ingredients and traditional flavors. The lower volumes were driven by natural ingredients in North America partially offset by higher volumes in traditional flavors.
Gross margins were 25.3% of revenue in both 2013 and 2012. The impact of higher selling prices offset an increase in manufacturing costs.
The Flavors & Fragrances Group operating income was $120.3 million in 2013 and $120.8 million in 2012. The decrease in operating income was primarily related to operations in Europe and other locations ($5.2 million), partially offset by higher operating income in North America ($4.8 million). The lower profit in Europe was driven by higher employee costs related to selling and technical personnel and other costs, partially offset by the impact of higher volume. The higher profit in North America was primarily due to higher selling prices, partially offset by the impact of lower volumes and higher raw material costs. Operating income as a percent of revenue was 13.7% in 2013 and 13.9% in 2012, primarily for the reasons discussed above.
Color The Color Group revenue was $495.1 million in 2013 and $500.7 million in 2012. The decrease in revenue was primarily driven by lower sales of non-food colors ($9.1 million), partially offset by higher sales of food and beverage colors ($3.7 million). The lower sales of non-food colors were driven by lower volumes of OEM inkjet products as a result of the termination of a supply agreement by a major customer in early 2013. The Group has been replacing non-strategic products such as these with higher margin, value-added products.
Gross margin for the Color Group increased 220 basis points to 40.9% in 2013 from 38.7% in 2012. Higher selling prices, favorable product mix and favorable raw material costs were the primary reasons for the improved margins. The 2013 results reflect the Group’s strategy to focus on higher margin products and eliminate non-strategic business.
Color Group operating income in 2013 increased 6.7% to $107.9 million from $101.1 million in 2012. The increase in operating income was primarily attributable to food and beverage colors ($3.9 million) and non-food colors ($3.0 million). The higher operating income from food and beverage colors was primarily due to the impact of favorable volumes and raw material costs. The increase in operating income for non-food colors was primarily due to favorable product mix and raw material costs. Operating income as a percent of revenue increased 160 basis points to 21.8% in 2013 from 20.2% in 2012, primarily due to the reasons described above.
Corporate & Other The Corporate & Other segment includes the Asia Pacific region, and certain of the Company’s flavor businesses in Central and South America, combined with corporate expenses.
Revenue for the Corporate & Other segment was $145.2 million and $139.6 million in 2013 and 2012, respectively. The increase was primarily related to higher volumes in Asia Pacific.
The Corporate & Other segment reported operating losses of $54.4 million and $29.0 million in 2013 and 2012, respectively. Before the impact of restructuring costs, the Corporate & Other segment reported operating losses of $22.6 million in 2013. The improvement in results before the impact of restructuring costs was primarily due to profit on higher volumes and favorable product mix in Asia Pacific and lower corporate expenses.
LIQUIDITY AND FINANCIAL POSITION
The Company’s financial position remains strong, enabling it to meet cash requirements for operations, acquisitions, capital expansion programs, dividend payments to shareholders and share repurchases. The Company intends to fund working capital requirements, principal and interest payments, acquisitions and other liabilities with cash provided by operations, to the extent available, and short-term and long-term borrowings under new and existing credit facilities.
The Company’s ratio of debt to total capital was 30.8% at December 31, 2014, compared to 22.2% at December 31, 2013. The increase in 2014 was primarily due to the increase in debt to fund share repurchases.
Net cash provided by operating activities was $189.2 million in 2014, $153.6 million in 2013 and $139.4 million in 2012. Operating cash flow provided the primary source of funds for operating needs, capital expenditures, shareholder dividends and some share repurchases. The increase in net cash provided by operating activities in 2014 was primarily due to higher earnings and working capital reductions in the second half of 2014. The increase in cash from operating activities in 2013 was primarily due to a lower use of working capital partially offset by lower earnings as a result of the 2013 restructuring program.
Net cash used in investing activities was $79.1 million in 2014, $98.2 million in 2013 and $102.7 million in 2012. Capital expenditures were $79.4 million in 2014, $104.2 million in 2013 and $103.8 million in 2012.
Net cash used in financing activities was $98.6 million in 2014, $48.2 million in 2013 and $48.8 million in 2012. The Company had a net increase in debt of $85.8 million in 2014 and a net decrease in debt of $3.7 million in 2013 and a net increase of $15.9 million in 2012. In 2014, Sensient purchased $137.2 million of Company stock which settled before December 31, 2014.
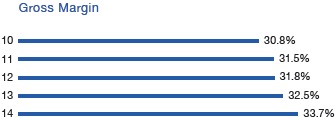
The Company has paid uninterrupted quarterly cash dividends since commencing public trading in its stock in 1962. In the first quarter of 2014, the Company announced an increase in its quarterly dividend from 23 cents per share to 25 cents per share. Dividends paid per share were 98 cents in 2014, 91 cents in 2013 and 87 cents in 2012. Total dividends paid were $47.9 million, $45.5 million and $43.4 million in 2014, 2013 and 2012, respectively.
The impact of inflation on both the Company’s financial position and its results of operations has been minimal and is not expected to significantly affect 2015 results.
ISSUER PURCHASES OF EQUITY SECURITIES
Sensient purchased 2.5 million shares of Company stock in 2014 for a total cost of $138.3 million and 0.6 million shares of Company stock in 2012 for a total cost of $23.2 million. There were no purchases of Company stock in 2013. In July 2014, the Board approved a new share repurchase program under which the Company is authorized to repurchase an additional five million shares of Company stock in addition to amounts remaining from prior Board authorizations. As of December 31, 2014, 4.9 million shares were available to be repurchased under existing authorizations. The Company’s share repurchase program has no expiration date.
CRITICAL ACCOUNTING POLICIES
In preparing the financial statements in accordance with accounting principles generally accepted in the U.S., management is required to make estimates and assumptions that have an impact on the asset, liability, revenue and expense amounts reported. These estimates can also affect supplemental information disclosures of the Company, including information about contingencies, risk and financial condition. The Company believes, given current facts and circumstances, that its estimates and assumptions are reasonable, adhere to accounting principles generally accepted in the U.S. and are consistently applied. Inherent in the nature of an estimate or assumption is the fact that actual results may differ from estimates and estimates may vary as new facts and circumstances arise. The Company makes routine estimates and judgments in determining the net realizable value of accounts receivable, inventories, property, plant and equipment, and prepaid expenses. Management believes the Company’s most critical accounting estimates and assumptions are in the following areas:
Revenue Recognition The Company recognizes revenue (net of estimated discounts, allowances and returns) when title passes, the customer is obligated to pay the Company and the Company has no remaining obligations. Such recognition typically corresponds with the shipment of goods.
Goodwill Valuation The Company reviews the carrying value of goodwill annually utilizing several valuation methodologies, including a discounted cash flow model. The Company completed its annual goodwill impairment test under Accounting Standards Codification (ASC) 350, Intangibles – Goodwill and Other, in the third quarter of 2014. In conducting its annual test for impairment, the Company estimates the fair value for each of its reporting units and compares each of these values to the net book value of each reporting unit. Fair value is estimated using both a discounted cash flow analysis and an analysis of comparable company market values. If the fair value of a reporting unit exceeds its net book value, no impairment exists. The Company has three reporting units that had goodwill recorded and were tested for impairment. The Flavors & Fragrances reporting unit and the Asia Pacific reporting unit had fair values that were over 100% above their respective net book values. The fair value of the Color reporting unit had a fair value that was over 90% above its net book value. Changes in estimates of future cash flows caused by items such as unforeseen events or changes in market conditions could negatively affect the reporting units’ fair value and result in an impairment charge.
Income Taxes The Company estimates its income tax expense in each of the taxing jurisdictions in which it operates. The Company is subject to a tax audit in each of these jurisdictions, which could result in changes to the estimated tax expense. The amount of these changes would vary by jurisdiction and would be recorded when probable and estimable. These changes could impact the Company’s financial statements. Management has recorded valuation allowances to reduce the Company’s deferred tax assets to the amount that is more likely than not to be realized. Examples of deferred tax assets include deductions, net operating losses and tax credits that the Company believes will reduce its future tax payments. In assessing the future realization of these assets, management has considered future taxable income and ongoing tax planning strategies. An adjustment to the recorded valuation allowance as a result of changes in facts or circumstances could result in a significant change in the Company’s tax expense. The Company does not provide for deferred taxes on unremitted earnings of foreign subsidiaries which are considered to be invested indefinitely.
Commitments and Contingencies The Company is subject to litigation and other legal proceedings arising in the ordinary course of its businesses or arising under provisions related to the protection of the environment. Estimating liabilities and costs associated with these matters requires the judgment of management, who rely in part on information from Company legal counsel. When it is probable that the Company has incurred a liability associated with claims or pending or threatened litigation matters and the Company’s exposure is reasonably estimable, the Company records a charge against earnings. The Company recognizes related insurance reimbursement when receipt is deemed probable. The Company’s estimate of liabilities and related insurance recoveries may change as further facts and circumstances become known.
MARKET RISK FACTORS
The Company is exposed to market risks, including changes in interest rates, currency exchange rates and commodity prices. To manage the volatility relating to these exposures on a consolidated basis, the Company nets the exposures to take advantage of natural offsets. The Company also enters into various derivative transactions for some of the remaining exposures pursuant to the Company’s policies covering hedging practices. The financial impacts of these hedging instruments are offset by corresponding changes in the underlying exposures being hedged.
The Company does not hold or issue derivative financial instruments for trading purposes. Note 1 and Note 4 to the Consolidated Financial Statements include a discussion of the Company’s accounting policies for financial instruments.
A key part of the Company’s strategy is to expand into new geographic markets. Because the Company manufactures and sells its products throughout the world, it is exposed to movements in foreign currency exchange rates. The major foreign currency exposures involve the markets in Western Europe, Mexico and Canada. The primary purpose of the Company’s foreign currency hedging activities is to protect against the volatility associated with foreign currency sales, purchases of materials, and other assets and liabilities created during the normal course of business. The Company generally utilizes foreign exchange contracts with durations of less than 12 months that may or may not be designated as cash flow hedges under ASC 815, Derivatives and Hedging. The net fair value of these instruments, based on dealer quotes, was a liability of $0.1 million at December 31, 2014, and an asset of $0.2 million at December 31, 2013. At December 31, 2014, the potential gain or loss in the fair value of the Company’s outstanding foreign exchange contracts, assuming a hypothetical 10% fluctuation in the currencies of such contracts, would be approximately $1.5 million. However, any change in the value of the contracts, real or hypothetical, would be significantly offset by a corresponding change in the value of the underlying hedged items. In addition, this hypothetical calculation assumes that each exchange rate would change in the same direction relative to the U.S. dollar.
The Company has certain debt denominated in Swiss Francs and Euros. These non-derivative debt instruments act as partial hedges of the Company’s Swiss Franc and Euro net asset positions. The potential increase or decrease in the annual U.S. dollar interest expense of the Company’s outstanding foreign currency-denominated debt, assuming a hypothetical 10% fluctuation in the currencies of such debt, would be approximately $0.2 million at December 31, 2014. However, any change in interest expense from fluctuations in currency, real or hypothetical, would be significantly offset by a corresponding change in the value of the foreign income before interest. In addition, this hypothetical calculation assumes that each exchange rate would change in the same direction relative to the U.S. dollar.
The Company manages its debt structure and interest rate risk through the use of fixed rate and floating rate debt and through the use of derivatives. The Company’s primary exposure is to interest rates in the U.S. and Western Europe. At December 31, 2014, the potential increase or decrease in annual interest expense, assuming a hypothetical 10% fluctuation in interest rates of floating rate debt, would be approximately $0.3 million.
The Company is the purchaser of certain commodities, such as corn, sugar, soybean meal and fruits. The Company generally purchases these commodities based upon market prices that are established with the vendor as part of the purchase process. In general, the Company does not use commodity financial instruments to hedge commodity prices due to a high correlation between the commodity cost and the ultimate selling price of the Company’s products. On occasion, the Company may enter into non-cancelable forward purchase contracts, as deemed appropriate, to reduce the effect of price fluctuations on future manufacturing requirements.
CONTRACTUAL OBLIGATIONS
The Company is subject to certain contractual obligations, including long-term debt, operating leases, manufacturing purchases and pension benefit obligations. The Company has unrecognized tax benefits of $13.9 million as of December 31, 2014. However, the Company cannot make a reasonably reliable estimate of the period of potential cash settlement of the liabilities and, therefore, has not included unrecognized tax benefits in the following table of significant contractual obligations as of December 31, 2014.
PAYMENTS DUE BY PERIOD
| (in thousands) | | Total | | | 1 year | | | 2-3 years | | | 4-5 years | | | > 5 years | |
| Long-term debt | | $ | 451,011 | | | $ | 18,384 | | | $ | 142,870 | | | $ | 168,487 | | | $ | 121,270 | |
| Interest payments on long-term debt | | | 53,143 | | | | 13,731 | | | | 22,331 | | | | 12,920 | | | | 4,161 | |
| Operating lease obligations | | | 19,479 | | | | 7,657 | | | | 6,803 | | | | 3,201 | | | | 1,818 | |
| Manufacturing purchase commitments | | | 50,064 | | | | 48,846 | | | | 1,218 | | | | — | | | | — | |
| Pension funding obligations | | | 44,217 | | | | 9,722 | | | | 10,016 | | | | 7,021 | | | | 17,458 | |
| Total contractual obligations | | $ | 617,914 | | | $ | 98,340 | | | $ | 183,238 | | | $ | 191,629 | | | $ | 144,707 | |
NEW PRONOUNCEMENTS
On January 1, 2014, the Company adopted Accounting Standards Update (ASU) No. 2013-11, Income Taxes (Topic 740), Presentation of an Unrecognized Tax Benefit When a Net Operating Loss Carryforward, a Similar Tax Loss, or a Tax Credit Carryforward Exists, which requires companies to change the balance sheet presentation of certain unrecognized tax benefits and deferred tax assets. The adoption of this ASU had no material impact on the Company’s balance sheet presentation, financial condition or results of operations.
On April 10, 2014, the Financial Accounting Standards Board (“FASB”) issued ASU No. 2014-08, Reporting Discontinued Operations and Disclosures of Disposals of Components of an Entity, which amends the definition of a discontinued operation in ASC 205-20, “Discontinued Operations” and requires companies to provide additional disclosures for disposal transactions. Under the revised standard, a discontinued operation represents a strategic shift that has or will have a major impact on an entity’s operations or financial results. ASU 2014-08 is required to be applied prospectively to all disposals that occur in annual periods beginning on or after December 15, 2014, with early adoption permitted. The Company will prospectively apply this guidance in 2015.
On May 28, 2014, the FASB issued ASU No. 2014-09, Revenue from Contracts with Customers. The requirements of the new standard are effective for interim and annual periods beginning after December 15, 2016, with early adoption not permitted. The Company is currently evaluating the expected impact of this new standard.
OFF-BALANCE SHEET ARRANGEMENTS
The Company had no off-balance sheet arrangements as of December 31, 2014.
FORWARD-LOOKING STATEMENTS
This document contains forward-looking statements that reflect management’s current assumptions and estimates of future economic circumstances, industry conditions, Company performance and financial results. Forward-looking statements include statements in the future tense, statements referring to any period after December 31, 2014, and statements including the terms “expect,” “believe,” “anticipate” and other similar terms that express expectations as to future events or conditions. The Private Securities Litigation Reform Act of 1995 provides a safe harbor for such forward-looking statements. Such forward-looking statements are not guarantees of future performance and involve known and unknown risks, uncertainties and other factors that could cause actual events to differ materially from those expressed in those statements. A variety of factors could cause the Company’s actual results and experience to differ materially from the anticipated results. These factors and assumptions include the pace and nature of new product introductions by the Company’s customers; the Company’s ability to successfully implement its growth strategies; the outcome of the Company’s various productivity-improvement and cost-reduction efforts or other restructuring or relocation activities; changes in costs and availability of raw materials and energy; industry and economic factors related to the Company’s domestic and international business; competition from other suppliers of colors, flavors and fragrances; growth or contraction in markets for products in which the Company competes; terminations and other changes in customer relationships; industry acceptance of price increases; currency exchange rate fluctuations; cost and availability of credit; and the matters discussed above including the critical accounting policies described therein. The Company does not undertake to publicly update or revise its forward-looking statements even if experience or future changes make it clear that any projected results expressed or implied therein will not be realized.
Consolidated Statements of Earnings
| (in thousands except per share amounts) Years ended December 31, | | 2014 | | | 2013 | | | 2012 | |
| Revenue | | $ | 1,447,821 | | | $ | 1,462,126 | | | $ | 1,453,555 | |
| Cost of products sold | | | 959,311 | | | | 987,080 | | | | 990,911 | |
| Selling and administrative expenses | | | 357,845 | | | | 301,266 | | | | 269,765 | |
| Operating Income | | | 130,665 | | | | 173,780 | | | | 192,879 | |
| Interest expense | | | 16,067 | | | | 16,147 | | | | 16,901 | |
| Earnings Before Income Taxes | | | 114,598 | | | | 157,633 | | | | 175,978 | |
| Income taxes | | | 32,827 | | | | 43,335 | | | | 50,896 | |
| Earnings from Continuing Operations | | | 81,771 | | | | 114,298 | | | | 125,082 | |
| Loss from discontinued operations, net of tax | | | (8,125 | ) | | | (1,003 | ) | | | (1,174 | ) |
| Net Earnings | | $ | 73,646 | | | $ | 113,295 | | | $ | 123,908 | |
| Earnings per common share: | | | | | | | | | | | | |
| Basic: | | | | | | | | | | | | |
| Continuing operations | | $ | 1.69 | | | $ | 2.30 | | | $ | 2.52 | |
| Discontinued operations | | | (0.17 | ) | | | (0.02 | ) | | | (0.02 | ) |
| Earnings per common share | | $ | 1.52 | | | $ | 2.28 | | | $ | 2.50 | |
| Diluted: | | | | | | | | | | | | |
| Continuing operations | | $ | 1.67 | | | $ | 2.29 | | | $ | 2.51 | |
| Discontinued operations | | | (0.17 | ) | | | (0.02 | ) | | | (0.02 | ) |
| Earnings per common share | | $ | 1.51 | | | $ | 2.27 | | | $ | 2.49 | |
| Weighted average number of common shares outstanding: | | | | | | | | | | | | |
| Basic | | | 48,525 | | | | 49,755 | | | | 49,596 | |
| Diluted | | | 48,819 | | | | 49,934 | | | | 49,822 | |
See notes to consolidated financial statements.
Consolidated Statements of Comprehensive Income
| (in thousands) Years ended December 31, | | 2014 | | | 2013 | | | 2012 | |
| Net earnings | | $ | 73,646 | | | $ | 113,295 | | | $ | 123,908 | |
| Cash flow hedges adjustment, net of tax of $153, $50 and $136, respectively | | | 423 | | | | (134 | ) | | | (350 | ) |
| Pension adjustment, net of tax of $226, $3,675 and $1,040, respectively | | | 1,598 | | | | 5,294 | | | | (2,216 | ) |
| Tax effect on losses previously recorded in other comprehensive income | | | — | | | | — | | | | 16,836 | |
| Foreign currency translation on net investment hedges | | | 12,677 | | | | (4,020 | ) | | | (1,251 | ) |
| Tax effect of current year activity on net investment hedges | | | (4,947 | ) | | | 1,810 | | | | — | |
| Foreign currency translation on long term intercompany loans | | | (8,325 | ) | | | 5,781 | | | | (1,540 | ) |
| Other foreign currency translation | | | (92,556 | ) | | | 1,856 | | | | 22,984 | |
| Total Comprehensive (Loss) Income | | $ | (17,484 | ) | | $ | 123,882 | | | $ | 158,371 | |
See notes to consolidated financial statements.
Consolidated Balance Sheets
| (in thousands except share and per share amounts) December 31, | | 2014 | | | 2013 | |
| Assets | | | | | | |
| Current Assets: | | | | | | |
| Cash and cash equivalents | | $ | 20,329 | | | $ | 19,836 | |
| Trade accounts receivable, less allowance for losses of $3,838 and $4,327, respectively | | | 228,907 | | | | 233,751 | |
| Inventories | | | 449,409 | | | | 474,452 | |
| Prepaid expenses and other current assets | | | 37,713 | | | | 38,079 | |
| Deferred income taxes | | | 21,735 | | | | 23,707 | |
| Assets held for sale | | | 1,296 | | | | — | |
| Total current assets | | | 759,389 | | | | 789,825 | |
| Other assets | | | 77,376 | | | | 47,786 | |
| Intangible assets – at cost, less accumulated amortization of $14,390 and $15,634, respectively | | | 8,760 | | | | 10,546 | |
| Goodwill | | | 424,114 | | | | 457,269 | |
| Property, Plant and Equipment: | | | | | | | | |
| Land | | | 42,868 | | | | 56,343 | |
| Buildings | | | 295,381 | | | | 374,388 | |
| Machinery and equipment | | | 723,631 | | | | 751,267 | |
| Construction in progress | | | 54,579 | | | | 55,236 | |
| | | | 1,116,459 | | | | 1,237,234 | |
| Less accumulated depreciation | | | (620,892 | ) | | | (671,926 | ) |
| | | | 495,567 | | | | 565,308 | |
| Total assets | | $ | 1,765,206 | | | $ | 1,870,734 | |
| Liabilities and Shareholders’ Equity | | | | | | | | |
| Current Liabilities: | | | | | | | | |
| Trade accounts payable | | $ | 99,033 | | | $ | 99,117 | |
| Accrued salaries, wages and withholdings from employees | | | 30,010 | | | | 32,669 | |
| Other accrued expenses | | | 76,383 | | | | 78,579 | |
| Income taxes | | | 3,591 | | | | 5,478 | |
| Short-term borrowings | | | 15,888 | | | | 7,050 | |
| Total current liabilities | | | 224,905 | | | | 222,893 | |
| Deferred income taxes | | | — | | | | 19,956 | |
| Other liabilities | | | 17,372 | | | | 8,539 | |
| Accrued employee and retiree benefits | | | 24,983 | | | | 28,538 | |
| Long-term debt | | | 451,011 | | | | 348,124 | |
| Shareholders’ Equity: | | | | | | | | |
| Common stock, par value $0.10 a share, authorized 100,000,000 shares; issued 53,954,874 shares | | | 5,396 | | | | 5,396 | |
| Additional paid-in capital | | | 110,969 | | | | 105,119 | |
| Earnings reinvested in the business | | | 1,243,627 | | | | 1,217,874 | |
| Treasury stock, 6,529,891 and 4,105,827 shares, respectively, at cost | | | (227,929 | ) | | | (91,707 | ) |
| Accumulated other comprehensive (loss) income | | | (85,128 | ) | | | 6,002 | |
| | | | 1,046,935 | | | | 1,242,684 | |
| Total liabilities and shareholders’ equity | | $ | 1,765,206 | | | $ | 1,870,734 | |
See notes to consolidated financial statements.
Consolidated Statements of Cash Flows
| (in thousands) Years ended December 31, | | 2014 | | | 2013 | | | 2012 | |
| Cash Flows from Operating Activities | | | | | | | | | |
| Net earnings | | $ | 73,646 | | | $ | 113,295 | | | $ | 123,908 | |
| Adjustments to arrive at net cash provided by operating activities: | | | | | | | | | | | | |
| Depreciation and amortization | | | 51,456 | | | | 52,016 | | | | 48,352 | |
| Share-based compensation | | | 6,265 | | | | 8,430 | | | | 10,086 | |
| Loss (gain) on assets | | | 70,745 | | | | 695 | | | | (869 | ) |
| Deferred income taxes | | | (16,780 | ) | | | (6,178 | ) | | | 2,916 | |
| Changes in operating assets and liabilities: | | | | | | | | | | | | |
| Trade accounts receivable | | | (10,582 | ) | | | 3,466 | | | | (15,158 | ) |
| Inventories | | | 64 | | | | (30,217 | ) | | | (23,125 | ) |
| Prepaid expenses and other assets | | | 6,479 | | | | 616 | | | | (9,405 | ) |
| Accounts payable and other accrued expenses | | | 6,745 | | | | 3,606 | | | | 225 | |
| Accrued salaries, wages and withholdings from employees | | | (365 | ) | | | 5,384 | | | | (1,209 | ) |
| Income taxes | | | 7,047 | | | | (100 | ) | | | (1,689 | ) |
| Other liabilities | | | (5,532 | ) | | | 2,540 | | | | 5,334 | |
| Net cash provided by operating activities | | | 189,188 | | | | 153,553 | | | | 139,366 | |
| Cash Flows from Investing Activities | | | | | | | | | | | | |
| Acquisition of property, plant and equipment | | | (79,398 | ) | | | (104,246 | ) | | | (103,806 | ) |
| Proceeds from sale of assets | | | 1,029 | | | | 6,225 | | | | 1,364 | |
| Other investing activities | | | (780 | ) | | | (208 | ) | | | (242 | ) |
| Net cash used in investing activities | | | (79,149 | ) | | | (98,229 | ) | | | (102,684 | ) |
| Cash Flows from Financing Activities | | | | | | | | | | | | |
| Proceeds from additional borrowings | | | 213,985 | | | | 194,973 | | | | 73,903 | |
| Debt payments | | | (128,186 | ) | | | (198,686 | ) | | | (58,052 | ) |
| Purchase of treasury stock | | | (137,192 | ) | | | — | | | | (23,154 | ) |
| Dividends paid | | | (47,893 | ) | | | (45,513 | ) | | | (43,426 | ) |
| Proceeds from options exercised and other equity transactions | | | 733 | | | | 1,007 | | | | 1,957 | |
| Net cash used in financing activities | | | (98,553 | ) | | | (48,219 | ) | | | (48,772 | ) |
| Effect of exchange rate changes on cash and cash equivalents | | | (10,993 | ) | | | (2,331 | ) | | | 4,297 | |
| Net increase (decrease) in cash and cash equivalents | | | 493 | | | | 4,774 | | | | (7,793 | ) |
| Cash and cash equivalents at beginning of year | | | 19,836 | | | | 15,062 | | | | 22,855 | |
| Cash and cash equivalents at end of year | | $ | 20,329 | | | $ | 19,836 | | | $ | 15,062 | |
| Cash paid during the year for: | | | | | | | | | | | | |
| Interest | | $ | 16,158 | | | $ | 16,168 | | | $ | 16,897 | |
| Income taxes | | | 42,335 | | | | 47,436 | | | | 53,492 | |
| Capitalized interest | | | 1,449 | | | | 1,875 | | | | 1,601 | |
See notes to consolidated financial statements.
Consolidated Statements of Shareholders’ Equity
| | | | | | | | | | | | Treasury Stock | | | | |
| (in thousands except share and per share amounts) | | Common Stock | | | Additional Paid-in Capital | | | Earnings Reinvested in the Business | | | Shares | | | Amount | | | Accumulated Other Comprehensive Income (Loss) | |
| Balances at December 31, 2011 | | $ | 5,396 | | | $ | 94,187 | | | $ | 1,069,610 | | | | 4,038,011 | | | $ | (80,935 | ) | | $ | (39,048 | ) |
| Net earnings | | | | | | | | | | | 123,908 | | | | | | | | | | | | | |
| Other comprehensive income | | | | | | | | | | | | | | | | | | | | | | | 34,463 | |
| Cash dividends paid – $0.87 per share | | | | | | | | | | | (43,426 | ) | | | | | | | | | | | | |
| Share-based compensation | | | | | | | 10,086 | | | | | | | | | | | | | | | | | |
| Stock options exercised | | | | | | | 52 | | | | | | | | (66,579 | ) | | | 1,438 | | | | | |
| Non-vested stock issued upon vesting | | | | | | | (6,999 | ) | | | | | | | (313,812 | ) | | | 6,999 | | | | | |
| Benefit plans | | | | | | | 388 | | | | | | | | (22,925 | ) | | | 480 | | | | | |
| Purchase of treasury stock | | | | | | | | | | | | | | | 626,251 | | | | (23,154 | ) | | | | |
| Other | | | | | | | 539 | | | | | | | | 3,875 | | | | (86 | ) | | | | |
| Balances at December 31, 2012 | | | 5,396 | | | | 98,253 | | | | 1,150, 092 | | | | 4,264,821 | | | | (95,258 | ) | | | (4,585 | ) |
| Net earnings | | | | | | | | | | | 113,295 | | | | | | | | | | | | | |
| Other comprehensive income | | | | | | | | | | | | | | | | | | | | | | | 10,587 | |
| Cash dividends paid – $0.91 per share | | | | | | | | | | | (45,513 | ) | | | | | | | | | | | | |
| Share-based compensation | | | | | | | 8,430 | | | | | | | | | | | | | | | | | |
| Stock options exercised | | | | | | | (63 | ) | | | | | | | (47,584 | ) | | | 1,063 | | | | | |
| Non-vested stock issued upon vesting | | | | | | | (2,113 | ) | | | | | | | (94,600 | ) | | | 2,113 | | | | | |
| Benefit plans | | | | | | | 385 | | | | | | | | (26,635 | ) | | | 595 | | | | | |
| Other | | | | | | | 227 | | | | | | | | 9,825 | | | | (220 | ) | | | | |
| Balances at December 31, 2013 | | | 5,396 | | | | 105,119 | | | | 1,217, 874 | | | | 4,105,827 | | | | (91,707 | ) | | | 6,002 | |
| Net earnings | | | | | | | | | | | 73,646 | | | | | | | | | | | | | |
| Other comprehensive income | | | | | | | | | | | | | | | | | | | | | | | (91,130 | ) |
| Cash dividends paid – $0.98 per share | | | | | | | | | | | (47,893 | ) | | | | | | | | | | | | |
| Share-based compensation | | | | | | | 6,265 | | | | | | | | | | | | | | | | | |
| Stock options exercised | | | | | | | (161 | ) | | | | | | | (27,001 | ) | | | 753 | | | | | |
| Non-vested stock issued upon vesting | | | | | | | (1,206 | ) | | | | | | | (40,300 | ) | | | 1,206 | | | | | |
| Benefit plans | | | | | | | 510 | | | | | | | | (18,185 | ) | | | 406 | | | | | |
| Purchase of treasury stock | | | | | | | | | | | | | | | 2,500,000 | | | | (138,288 | ) | | | | |
| Other | | | | | | | 442 | | | | | | | | 9,550 | | | | (299 | ) | | | | |
| Balances at December 31, 2014 | | $ | 5,396 | | | $ | 110,969 | | | $ | 1,243,627 | | | | 6,529,891 | | | $ | (227,929 | ) | | $ | (85,128 | ) |
See notes to consolidated financial statements.
Notes to Consolidated Financial Statements
Years ended December 31, 2014, 2013 and 2012
1.
SUMMARY OF SIGNIFICANT ACCOUNTING POLICIES
Nature of Operations Sensient Technologies Corporation, together with its subsidiaries (the “Company”), is a leading global manufacturer and marketer of colors, flavors and fragrances. The Company uses advanced technologies at facilities around the world to develop specialty food and beverage systems, cosmetic and pharmaceutical systems, specialty inks and colors, and other specialty and fine chemicals. The Company’s reportable segments consist of the Flavors & Fragrances and Color Groups, which are managed on a products and services basis. The Asia Pacific Group and certain of the Company’s flavor businesses in Central and South America (Flavors Central & South America), which are managed on a geographic basis, are included in Corporate & Other.
Principles of Consolidation and Basis of Presentation The consolidated financial statements include the accounts of the Company and have been prepared in accordance with accounting principles generally accepted in the United States of America (“GAAP”). All significant intercompany accounts and transactions have been eliminated in consolidation.
The results of operations for one of the Company’s business units within the Color Group have been reported as a discontinued operation for all periods presented. The corresponding assets have been reclassified in accordance with the authoritative literature on assets held for sale as of December 31, 2014. See Note 12, Discontinued Operations, for further information regarding discontinued operations.
Use of Estimates The preparation of the consolidated financial statements requires the use of management’s estimates and assumptions that affect reported amounts of assets, liabilities, revenue and expenses during the reporting period and the disclosure of contingent assets and liabilities at the date of the financial statements. Actual results could differ from those estimates.
Revenue Recognition The Company recognizes revenue (net of estimated discounts, allowances and returns) when title to goods passes, the customer is obligated to pay the Company and the Company has no remaining obligations. Such recognition typically corresponds with the shipment of goods.
Cost of Products Sold Cost of products sold includes materials, labor and overhead expenses incurred in the manufacture of our products. Cost of products sold also includes charges for obsolete and slow moving inventories, as well as costs for quality control, purchasing and receiving costs, inspection costs, warehousing costs, internal transfer costs, other costs of our internal distribution network and costs incurred for shipping and handling. The Company records fees billed to customers for shipping and handling as revenue.
Selling and Administrative Expenses Selling and administrative expenses primarily include the salaries and related costs for executive, finance, accounting, human resources, information technology, research and development and legal personnel as well as salaries and related costs of salespersons and commissions paid to external sales agents.
Cash Equivalents The Company considers all highly liquid investments with maturities of three months or less at the date of acquisition as cash equivalents.
Accounts Receivable Receivables are recorded at their face amount, less an allowance for doubtful accounts. The allowance for doubtful accounts is based on customer-specific analysis and general matters such as current assessments of past due balances and economic conditions. Specific accounts are written off against the allowance for doubtful accounts when it is deemed that the receivable is no longer collectible.
Inventories Inventories are stated at the lower of cost or market. Market is determined on the basis of estimated realizable values. Cost is determined using the first-in, first-out (“FIFO”) method with the exception of certain locations of the Flavors & Fragrances Group where cost is determined using a weighted average method. Inventories include finished and in-process products totaling $308.7 million and $317.1 million at December 31, 2014 and 2013, respectively, and raw materials and supplies of $140.7 million and $157.4 million at December 31, 2014 and 2013, respectively.
Property, Plant and Equipment Property, plant and equipment are recorded at cost reduced by accumulated depreciation. Depreciation is provided over the estimated useful life of the related asset using the straight-line method for financial reporting. The estimated useful lives for buildings and leasehold improvements range from 5 to 40 years. Machinery and equipment have estimated useful lives ranging from 3 to 20 years. Interest costs on significant projects constructed or developed for the Company’s own use are capitalized as part of the asset.
Goodwill and Other Intangible Assets The carrying value of goodwill is evaluated for impairment on an annual basis or more frequently when an indicator of impairment occurs. The impairment assessment includes comparing the carrying amount of net assets, including goodwill, of each reporting unit to its respective fair value as of the date of the assessment. Fair value was estimated based upon an evaluation of the reporting unit’s estimated future discounted cash flow as well as the public trading and private transaction valuation multiples for comparable companies. Such determination of fair value yielded no impairment in 2014, 2013 or 2012.
The cost of intangible assets with determinable useful lives is amortized on a straight-line basis to reflect the pattern of economic benefits consumed, ranging from 5 to 20 years. These assets include technological know-how, customer relationships, patents, trademarks and non-compete agreements, among others.
Impairment of Long-lived Assets The Company reviews long-lived assets for impairment whenever events or changes in business circumstances indicate that the carrying amount of the assets may not be fully recoverable. The Company performs undiscounted cash flow analyses to determine if potential impairment exists. If impairment is determined to exist, any related impairment loss is calculated based on the difference between fair value and carrying value. Impairment losses were recorded as a result of the Company’s 2014 Restructuring Plan and 2013 restructuring plan. See Note 11, Restructuring Charges, for additional information.
Financial Instruments The Company may use derivative financial instruments for the purpose of hedging currency and interest rate exposures which exist as part of ongoing business operations. As a policy, the Company does not engage in speculative or leveraged transactions, nor does the Company hold or issue financial instruments for trading purposes.
Hedge effectiveness is determined by how closely the changes in the fair value of the hedging instrument offset the changes in the fair value or cash flows of the hedged item. Hedge accounting is permitted only if the hedging relationship is expected to be highly effective at the inception of the transaction and on an ongoing basis. Any ineffective portions are recognized in earnings immediately.
Interest Rate Hedging The Company is exposed to interest rate risk through its corporate borrowing activities. The objective of the Company’s interest rate risk management activities is to manage the levels of the Company’s fixed and floating interest rate exposure to be consistent with the Company’s preferred mix. The interest rate risk management program may include entering into interest rate swaps, which qualify as fair value hedges, when there is a desire to modify the Company’s exposure to interest rates. Gains or losses on fair value hedges are recognized in earnings, net of gains and losses on the fair value of the hedged instruments.
Cash Flow Hedges The primary objectives of the foreign exchange risk management activities are to understand and mitigate the impact of potential foreign exchange fluctuations on the Company’s financial results and its economic well-being. Generally, these risk management transactions involve the use of foreign currency derivatives to protect against exposure resulting from recorded accounts receivable and payable. The Company may utilize forward exchange contracts, generally with maturities of less than 12 months, which qualify as cash flow hedges. These foreign exchange contracts are intended to offset the effect of exchange rate fluctuations on recorded intercompany receivables and payables. Gains and losses on these instruments are deferred in accumulated other comprehensive (loss) income (“OCI”) until the underlying transaction is recognized in earnings.
The Company’s existing cash flow hedges are highly effective. As a result, any current impact on earnings due to cash flow hedge ineffectiveness is immaterial.
Net Investments Hedging The Company may enter into foreign-denominated debt to be used as a non-derivative instrument to hedge the Company’s net investment in foreign subsidiaries. The change in the carrying amount of the foreign-denominated debt on the Company’s books, attributable to changes in the spot foreign exchange rate, is a hedge of the net investment in its foreign subsidiaries. Changes in the fair value of debt designated as a net investment hedge are recorded in foreign currency translation in OCI.
Commodity Purchases The Company purchases certain commodities in the normal course of business that result in physical delivery of the goods and, hence, are excluded from Accounting Standards Codification (“ASC”) 815, Derivatives and Hedging.
Translation of Foreign Currencies For all significant foreign operations, the functional currency is the local currency. Assets and liabilities of foreign operations are translated into U.S. dollars at current exchange rates. Revenue and expense accounts are translated into U.S. dollars at average exchange rates prevailing during the year. Adjustments resulting from the translation of foreign accounts into U.S. dollars are recorded in foreign currency translation in OCI. Transaction gains and losses that occur as a result of transactions denominated in non-functional currencies are included in earnings and were not significant during the three-year period ended December 31, 2014.
Share-Based Compensation Share-based compensation expense is recognized over the vesting period of each award based on the fair value of the instrument at the time of grant as summarized in Note 5, Share-Based Compensation.
Income Taxes The Company recognizes a current tax liability or asset for the estimated taxes payable or refundable on tax returns for the current year and a deferred tax liability or asset for the estimated future tax effects attributable to temporary differences and carryforwards. The measurement of current and deferred tax liabilities and assets is based on provisions of enacted tax law. Deferred tax assets are reduced, if necessary, by the amount of any tax benefits for which the utilization of the asset is not considered likely.
Earnings Per Share The difference between basic and diluted earnings per share (“EPS”) is the dilutive effect of stock options and non-vested stock. Diluted EPS assumes that non-vested stock has vested and all dilutive stock options, for which the average market price exceeds the exercise price (in-the-money), are exercised. Stock options for which the exercise price exceeds the average market price (out-of-the-money) have an anti-dilutive effect on EPS, and accordingly, are excluded from the calculation.
The following table sets forth the computation of basic and diluted earnings per share from continuing operations for the years ended December 31:
| (in thousands except per share amounts) | | 2014 | | | 2013 | | | 2012 | |
| Numerator: | | | | | | | | | |
| Net earnings from continuing operations | | $ | 81,771 | | | $ | 114,298 | | | $ | 125,082 | |
| Denominator: | | | | | | | | | | | | |
| Denominator for basic earnings per share-weighted average common shares | | | 48,525 | | | | 49,755 | | | | 49,596 | |
| Effect of dilutive securities | | | 294 | | | | 179 | | | | 226 | |
| Denominator for diluted earnings per share-adjusted weighted average shares outstanding | | | 48,819 | | | | 49,934 | | | | 49,822 | |
| Earnings per common share from continuing operations | | | | | | | | | | | | |
| Basic | | $ | 1.69 | | | $ | 2.30 | | | $ | 2.52 | |
| Diluted | | $ | 1.67 | | | $ | 2.29 | | | $ | 2.51 | |
The Company has a share-based compensation plan under which employees may be granted share-based awards in which non-forfeitable dividends are paid on non-vested shares for certain awards. As such, these shares are considered participating securities under the two-class method of calculating EPS as described in ASC Topic 260, Earnings per Share. The two-class method of calculating EPS did not have a material impact on the Company’s EPS calculations as of December 31, 2014, 2013 and 2012.
In 2014, 2013 and 2012, there were no anti-dilutive stock options. All EPS amounts are presented on a diluted basis unless otherwise noted.
Accumulated Other Comprehensive Income (Loss) Accumulated OCI is composed primarily of foreign currency translation, pension liability and unrealized gains or losses on cash flow hedges. See Note 7, Accumulated Other Comprehensive Income, for additional information.
Research and Development Research and development costs are recorded in selling and administrative expenses in the year they are incurred. Research and development costs related to continuing operations were $35.9 million, $34.1 million and $34.2 million during the years ended December 31, 2014, 2013 and 2012, respectively.
Advertising Advertising costs are recorded in selling and administrative expenses as they are incurred. Advertising costs related to continuing operations were $1.9 million, $1.6 million and $2.2 million during the years ended December 31, 2014, 2013 and 2012, respectively.
Environmental Liabilities The Company records liabilities related to environmental remediation obligations when estimated future expenditures are probable and reasonably estimable. Such accruals are adjusted as further information becomes available or as circumstances change. Estimated future expenditures are discounted to their present value when the timing and amount of future cash flows are fixed and readily determinable. Recoveries of remediation costs from other parties, if any, are recognized as assets when their receipt is assured.
Subsequent Events The Company performed an evaluation of subsequent events through the date these financial statements were issued and no such events were identified.
New Pronouncements On January 1, 2014, the Company adopted Accounting Standards Update (ASU) No. 2013-11, Income Taxes (Topic 740), Presentation of an Unrecognized Tax Benefit When a Net Operating Loss Carryforward, a Similar Tax Loss, or a Tax Credit Carryforward Exists, which requires companies to change the balance sheet presentation of certain unrecognized tax benefits and deferred tax assets. The adoption of this ASU had no material impact on the Company’s balance sheet presentation, financial condition or results of operations.
On April 10, 2014, the Financial Accounting Standards Board (“FASB”) issued ASU No. 2014-08, Reporting Discontinued Operations and Disclosures of Disposals of Components of an Entity, which amends the definition of a discontinued operation in ASC 205-20, “Discontinued Operations” and requires companies to provide additional disclosures for disposal transactions. Under the revised standard, a discontinued operation represents a strategic shift that has or will have a major impact on an entity’s operations or financial results. ASU 2014-08 is required to be applied prospectively to all disposals that occur in annual periods beginning on or after December 15, 2014, with early adoption permitted. The Company will prospectively apply this guidance in 2015.
On May 28, 2014, the FASB issued ASU No. 2014-09, Revenue from Contracts with Customers. The requirements of the new standard are effective for interim and annual periods beginning after December 15, 2016, with early adoption not permitted. The Company is currently evaluating the expected impact of this new standard.
2.
GOODWILL AND INTANGIBLE ASSETS
At December 31, 2014 and 2013, goodwill is the only intangible asset that is not subject to amortization.
The following table summarizes intangible assets with determinable useful lives by major category as of December 31, 2014 and 2013:
| | | | | | 2014 | | | 2013 | |
| (in thousands except weighted average amortization years) | | Weighted Average Amortization Years | | | Cost | | | Accumulated Amortization | | | Cost | | | Accumulated Amortization | |
| Technological know-how | | | 20.0 | | | $ | 6,459 | | | $ | (4,352 | ) | | $ | 8,606 | | | $ | (5,328 | ) |
| Customer relationships | | | 20.0 | | | | 6,938 | | | | (4,170 | ) | | | 7,944 | | | | (4,359 | ) |
| Patents, trademarks, non-compete agreements and other | | | 19.2 | | | | 9,753 | | | | (5,868 | ) | | | 9,630 | | | | (5,947 | ) |
| Total finite-lived intangibles | | | 19.7 | | | $ | 23,150 | | | $ | (14,390 | ) | | $ | 26,180 | | | $ | (15,634 | ) |
Amortization of intangible assets was $1.2 million in 2014, $1.3 million in 2013 and $1.4 million in 2012. Estimated amortization expense each year for the five years subsequent to December 31, 2014, is $1.2 million in each year from 2015 through 2019.
The changes in goodwill for the years ended December 31, 2014 and 2013, by reportable business segment, were as follows:
| (in thousands) | | Flavors & Fragrances | | | Color | | | Corporate & Other | | | Consolidated | |
| Balance as of December 31, 2012 | | $ | 135,784 | | | $ | 311,650 | | | $ | 3,884 | | | $ | 451,318 | |
| Currency translation impact | | | 853 | | | | 5,673 | | | | (575 | ) | | | 5,951 | |
| Balance as of December 31, 2013 | | $ | 136,637 | | | $ | 317,323 | | | $ | 3,309 | | | $ | 457,269 | |
| Currency translation impact | | | (10,614 | ) | | | (22,050 | ) | | | (333 | ) | | | (32,997 | ) |
| Impairment | | | — | | | | (158 | ) | | | — | | | | (158 | ) |
| Balance as of December 31, 2014 | | $ | 126,023 | | | $ | 295,115 | | | $ | 2,976 | | | $ | 424,114 | |
A portion of the Color segment’s goodwill was written down in 2014 related to the discontinued operation.
3.
DEBT
Long-term Debt Long-term debt consisted of the following unsecured obligations at December 31:
(in thousands) | | 2014 | | | 2013 | |
| 3.66% senior notes due November 2023 | | $ | 75,000 | | | $ | 75,000 | |
| 3.06% Euro-denominated senior notes due November 2023 | | | 46,270 | | | | 52,566 | |
| 4.47% senior notes due November 2018 | | | 25,000 | | | | 25,000 | |
| 4.14% senior notes due November 2017 | | | 25,000 | | | | 25,000 | |
| 4.91% senior notes due through May 2017 | | | 88,000 | | | | 99,000 | |
| 3.77% senior notes due November 2016 | | | 25,000 | | | | 25,000 | |
| Term loan | | | 98,750 | | | | — | |
| Long-term revolving loan agreement | | | 65,987 | | | | 43,982 | |
| Various other notes | | | 2,004 | | | | 2,576 | |
| | | | 451,011 | | | | 348,124 | |
| Less current maturities | | | — | | | | — | |
| Total long-term debt | | $ | 451,011 | | | $ | 348,124 | |
On October 24, 2014, the Company entered into a $450 million credit facility, consisting of a $350 million revolver and a $100 million term loan. The revolver will mature on October 24, 2019. Interest rates on borrowings under the revolver are at LIBOR plus a margin based on the Company’s leverage ratio. Currently, when fully drawn, the interest rate is at LIBOR plus 1.375% under the new agreement. The term loan bears interest at LIBOR plus 1.375% and has a final maturity date of October 24, 2019. The credit facility will be used to repay maturing debt and for general corporate purposes.
The borrowings under the long-term revolving loan agreement had an average interest rate of 1.54% for the years ended December 31, 2014 and 2013.
In April 2013, the Company entered into an agreement to issue $75 million and €38 million in ten-year, fixed-rate, senior notes at fixed coupon rates of 3.66% and 3.06%, respectively. These notes were issued in November 2013 and proceeds have been used to repay maturing notes and bank debt.
The aggregate amounts of contractual maturities on long-term debt each year for the five years subsequent to December 31, 2014, are as follows: 2015, $18.4 million; 2016, $43.8 million; 2017, $99.1 million; 2018, $35.0 million; and 2019, $133.5 million.
The Company has approximately $18.4 million of long-term debt that matures in 2015. It is the Company’s intention and ability to refinance these maturities under the long-term revolving loan agreement and accordingly, that maturing debt has been classified as long-term debt in the Consolidated Balance Sheet.
The Company has $277.7 million available under the revolving loan agreement and $41.8 million available under other lines of credit from several banks at December 31, 2014.
Substantially all of the senior loan agreements contain restrictions concerning interest coverage, borrowings, investments and tangible net worth amounts. The Company is in compliance with all of these restrictions at December 31, 2014. The following table summarizes the Company’s most restrictive loan covenants calculated in accordance with the applicable agreements as of December 31, 2014:
| (dollars in thousands) | | Actual | | | Required | |
| Debt to EBITDA (Maximum) | | | 1.74 | | | | 3.50 | |
| Net Worth (Minimum) | | $ | 1,046,935 | | | $ | 625,000 | |
| Interest Coverage (Minimum) | | | 8.64 | | | | 2.0 | |
The Company has stand-by and trade letters of credit outstanding of $6.3 million as of December 31, 2014 and 2013.
Short-term Borrowings The Company’s short-term borrowings consisted of the following items at December 31:
| (in thousands) | | 2014 | | | 2013 | |
| Uncommitted loans | | $ | 14,086 | | | $ | 4,600 | |
| Loans of foreign subsidiaries | | | 1,802 | | | | 2,450 | |
| Total | | $ | 15,888 | | | $ | 7,050 | |
The weighted average interest rates on short-term borrowings were 1.66% and 2.16% at December 31, 2014 and 2013, respectively.
4.
DERIVATIVE INSTRUMENTS AND HEDGING ACTIVITY
The Company may use derivative instruments for the purpose of hedging currency, commodity and interest rate exposures, which exist as part of ongoing business operations. As a policy, the Company does not engage in speculative or leveraged transactions, nor does the Company hold or issue financial instruments for trading purposes. Hedge effectiveness is determined by how closely the changes in the fair value of the hedging instrument offset the changes in the fair value or cash flows of the hedged transaction. Hedge accounting, which generally results in the deferral of derivative gains and losses until such time as the underlying transaction is recognized in net earnings, is permitted only if the hedging relationship is expected to be highly effective at the inception of the transaction and on an ongoing basis. Any ineffective portions are recognized in earnings immediately.
The Company manages its exposure to foreign exchange risk by the use of forward exchange contracts to reduce the effect of fluctuating foreign currencies on short-term foreign currency denominated intercompany transactions, non-functional currency raw material purchases, non-functional currency sales and other known foreign currency exposures. These forward exchange contracts generally have maturities of less than twelve months. The Company also uses certain debt denominated in foreign currencies to manage the net asset positions of the Company’s foreign subsidiaries. The Company’s primary hedging activities and their accounting treatment are summarized below:
Forward Exchange Contracts The forward exchange contracts that have been designated as hedges are accounted for as cash flow hedges. The Company had $17.8 million and $29.6 million of forward exchange contracts, designated as hedges, outstanding as of December 31, 2014 and 2013, respectively. Due to the short-term nature of these contracts, the results of these transactions are not material to the financial statements. In addition, the Company utilizes forward exchange contracts that are not designated as cash flow hedges and the results of these transactions are also not material to the financial statements.
Net Investment Hedges The Company has certain debt denominated in Euros and Swiss Francs. These debt instruments have been designated as partial hedges of the Company’s Euro and Swiss Franc net asset positions. Changes in the fair value of this debt attributable to changes in the spot foreign exchange rate are recorded in foreign currency translation in OCI. As of December 31, 2014 and 2013, the total value of the Company’s Euro and Swiss Franc debt designated as net investment hedges was $97.3 million and $96.5 million, respectively. The impact of foreign exchange rates on these debt instruments has decreased debt by $12.7 million for the year ended December 31, 2014 and increased debt by $4.0 million for the year ended December 31, 2013. These amounts have been recorded as foreign currency translation in OCI.
Concentrations of Credit Risk Counterparties to forward exchange contracts consist of large international financial institutions. While these counterparties may expose the Company to potential losses due to the credit risk of non-performance, losses are not anticipated. Concentrations of credit risk with respect to trade accounts receivable are limited by the large number of customers, generally short payment terms and their dispersion across geographic areas.
5.
SHARE-BASED COMPENSATION
The Company has various stock plans under which employees and directors may be granted non-vested stock which vests over a specific time period. The 2007 Stock Plan also allows for the granting of non-qualified stock options or incentive stock options. Upon vesting, the stock options allow the participant to purchase common stock at 100% of the closing market price on the day the options were granted. No options were granted in 2014, 2013 or 2012. As of December 31, 2014, there were 1.2 million shares available to be granted as non-vested stock under the Company’s existing stock plans.
Stock options became exercisable over a three-year vesting period, or earlier upon retirement, and expire 10 years from the date of grant. Expense for stock options was recognized on a straight-line basis over three years from the date of grant or over the period from the date of grant until the participant was retirement-eligible, whichever was less. Treasury shares are issued for non-vested stock awards and for the exercise of stock options.
The following table summarizes the transactions involving the Company’s stock option plans:
| (in thousands except exercise price and life) | | Options | | | Weighted Average Exercise Price | | | Weighted Average Remaining Life (Years) | | | Aggregate Intrinsic Value | |
| Outstanding at December 31, 2011 | | | 207 | | | $ | 22.36 | | | | 3.1 | | | $ | 3,222 | |
| Exercised | | | (66 | ) | | | 22.38 | | | | | | | | | |
| Outstanding at December 31, 2012 | | | 141 | | | | 22.35 | | | | 2.7 | | | | 1,859 | |
| Exercised | | | (48 | ) | | | 21.00 | | | | | | | | | |
| Outstanding at December 31, 2013 | | | 93 | | | | 23.04 | | | | 2.2 | | | | 2,374 | |
| Exercised | | | (27 | ) | | | 21.92 | | | | | | | | | |
| Outstanding at December 31, 2014 | | | 66 | | | $ | 23.49 | | | | 1.7 | | | $ | 2,438 | |
| Exercisable at December 31, 2014 | | | 66 | | | $ | 23.49 | | | | 1.7 | | | $ | 2,438 | |
The aggregate intrinsic value of stock options exercised during 2014, 2013 and 2012, was $0.8 million, $1.1 million and $0.9 million, respectively.
As of December 31, 2014, all stock options outstanding were vested.
The following table summarizes information concerning outstanding and exercisable stock options at December 31, 2014:
| | | Range of Exercise Price | |
| (in thousands except life and exercise price) | | $ | 18.57-23.08 | | | $ | 23.09-26.11 | | | $ | 26.12-30.07 | |
| Options outstanding | | | 25 | | | | 20 | | | | 21 | |
| Weighted average remaining contractual life, in years | | | 1.1 | | | | 1.3 | | | | 2.8 | |
| Weighted average exercise price | | $ | 19.34 | | | $ | 23.86 | | | $ | 28.16 | |
| Options exercisable | | | 25 | | | | 20 | | | | 21 | |
| Weighted average exercise price | | $ | 19.34 | | | $ | 23.86 | | | $ | 28.16 | |
The Company’s stock plans also provide for the awarding of non-vested stock. Prior to December 2014, expense for shares of non-vested stock is recognized over the vesting period or during the period from the date of grant until the participant reaches age 65, whichever is shorter. The vesting period is five years for awards granted prior to December 2013 and three years beginning with awards granted in December 2013. During the period of restriction, the holder of non-vested stock has voting rights and is entitled to receive all dividends and other distributions paid with respect to the stock.
The December 2013 grant consisted of 50% performance stock units and 50% time-vesting stock. The number of shares issued under the performance stock units are based on certain performance metrics measured over a two-year performance period and the awards have a three-year vesting period. Two year performance that exceeds the stated performance metrics would result in an award up to 150% of the original grant. The holder of the performance stock units are not entitled to vote or receive dividends and other distributions paid with respect to the stock, until the units have vested and the shares of stock are issued.
The December 2014 grant consisted of 100% performance stock unit awards which are based on a three-year performance and vesting period and a pro-rata vesting upon retirement. Three year performance that exceeds the stated performance metrics would result in an award up to 150% of the original grant. The holder of the performance stock units are not entitled to vote or receive dividends and other distributions paid with respect to the stock, until the units have vested and the shares of stock are issued.
The Company expenses awards for non-vested stock based on the fair value of the Company’s common stock at the date of the grant.
The following table summarizes the non-vested stock and performance stock unit activity:
| (in thousands except fair value) | | Shares | | | Grant Date Weighted Average Fair Value | | | Aggregate Intrinsic Value | |
| Outstanding at December 31, 2011 | | | 400 | | | $ | 31.42 | | | $ | 15,142 | |
| Granted | | | 293 | | | | 36.09 | | | | | |
| Vested | | | (314 | ) | | | 33.59 | | | | | |
| Cancelled | | | (40 | ) | | | 33.41 | | | | | |
| Outstanding at December 31, 2012 | | | 339 | | | | 33.22 | | | | 12,046 | |
| Granted | | | 262 | | | | 46.14 | | | | | |
| Vested | | | (94 | ) | | | 40.57 | | | | | |
| Cancelled | | | (10 | ) | | | 42.22 | | | | | |
| Outstanding at December 31, 2013 | | | 497 | | | | 38.46 | | | | 24,095 | |
| Granted | | | 171 | | | | 55.21 | | | | | |
| Vested | | | (40 | ) | | | 27.15 | | | | | |
| Cancelled | | | (24 | ) | | | 40.84 | | | | | |
| Outstanding at December 31, 2014 | | | 604 | | | $ | 43.84 | | | $ | 36,454 | |
The total intrinsic values of shares vested during 2014, 2013 and 2012, was $2.2 million, $4.4 million and $11.2 million, respectively.
As of December 31, 2014, total remaining unearned compensation, net of expected forfeitures, related to non-vested stock and performance stock units was $15.7 million, which will be amortized over the weighted average remaining service period of 1.98 years.
Total pre-tax share-based compensation recognized in the Consolidated Statements of Earnings was $6.3 million, $8.4 million and $10.1 million in 2014, 2013 and 2012, respectively. Tax related benefits of $2.4 million, $2.6 million and $2.4 million were also recognized in 2014, 2013 and 2012, respectively. Cash received from the exercise of stock options was $0.6 million, $1.0 million and $1.5 million for 2014, 2013 and 2012, respectively, and is reflected in cash flows from financing activities in the Consolidated Statements of Cash Flows.
6.
RETIREMENT PLANS
The Company provides benefits under defined contribution plans including a savings plan and an employee stock ownership plan (“ESOP”). The savings plan covers substantially all domestic salaried and certain non-union hourly employees and provides for matching contributions up to 4% of each employee’s salary. The ESOP covers substantially all domestic employees and provides for contributions based on a percentage of each employee’s compensation as determined by the Company’s Board of Directors. Total expense for the Company’s defined contribution plans was $5.0 million in 2014 and $4.7 million in 2013 and 2012.
Although the Company intends for these defined contribution plans to be the primary retirement benefit for most employees, the Company also has several defined benefit plans. The funded status of the defined benefit plans was as follows at December 31:
| (in thousands) | | 2014 | | | 2013 | |
| Benefit obligation at beginning of year | | $ | 72,582 | | | $ | 76,957 | |
| Service cost | | | 2,523 | | | | 3,260 | |
| Interest cost | | | 2,390 | | | | 2,557 | |
| Foreign currency exchange rate changes | | | (1,889 | ) | | | (703 | ) |
| Benefits paid | | | (23,726 | ) | | | (5,194 | ) |
| Actuarial loss (gain) | | | 5,858 | | | | (4,295 | ) |
| Curtailment gain | | | (2,342 | ) | | | — | |
| Benefit obligation at end of year | | | 55,396 | | | | 72,582 | |
| Plan assets at beginning of year | | | 37,122 | | | | 35,141 | |
| Company contributions | | | 22,402 | | | | 5,701 | |
| Foreign currency exchange rate changes | | | (2,379 | ) | | | (539 | ) |
| Benefits paid | | | (23,726 | ) | | | (5,258 | ) |
| Actual gain on plan assets | | | 6,101 | | | | 2,077 | |
| Plan assets at end of year | | | 39,520 | | | | 37,122 | |
| Funded status | | $ | (15,876 | ) | | $ | (35,460 | ) |
| Accumulated benefit obligation | | $ | 54,435 | | | $ | 68,391 | |
Amounts recognized in the Consolidated Balance Sheets at December 31:
| (in thousands) | | 2014 | | | 2013 | |
| Accrued employee and retiree benefits | | $ | (18,258 | ) | | $ | (21,206 | ) |
| Other accrued expenses | | | (7,263 | ) | | | (19,144 | ) |
| Prepaid expenses and other current assets | | | 9,645 | | | | 4,890 | |
| Net liability | | $ | (15,876 | ) | | $ | (35,460 | ) |
Components of annual benefit cost:
| (in thousands) | | 2014 | | | 2013 | | | 2012 | |
| Service cost | | $ | 2,523 | | | $ | 3,260 | | | $ | 2,583 | |
| Interest cost | | | 2,390 | | | | 2,557 | | | | 2,659 | |
| Expected return on plan assets | | | (1,791 | ) | | | (1,689 | ) | | | (1,428 | ) |
| Amortization of prior service cost | | | 171 | | | | 172 | | | | 1,971 | |
| Recognized actuarial (gain) loss | | | (305 | ) | | | 3,203 | | | | 799 | |
| Settlement expense | | | 1,467 | | | | 1,177 | | | | — | |
| Curtailment gain | | | (754 | ) | | | — | | | | — | |
| Defined benefit expense | | $ | 3,701 | | | $ | 8,680 | | | $ | 6,584 | |
Weighted average liability assumptions as of December 31:
| | | 2014 | | | 2013 | |
| Discount rate | | | 3.70 | % | | | 3.91 | % |
| Expected return on plan assets | | | 3.32 | % | | | 5.12 | % |
| Rate of compensation increase | | | 0.37 | % | | | 4.59 | % |
Weighted average cost assumptions for the year ended December 31:
| | | 2014 | | | 2013 | |
| Discount rate | | | 3.91 | % | | | 3.27 | % |
| Expected return on plan assets | | | 5.12 | % | | | 4.76 | % |
| Rate of compensation increase | | | 4.59 | % | | | 4.01 | % |
The aggregate amounts of benefits expected to be paid from defined benefit plans in each of the next five years subsequent to December 31, 2014, which include employees’ expected future service, are as follows: 2015, $9.6 million; 2016, $7.7 million; 2017, $2.3 million; 2018, $4.5 million; 2019, $2.5 million; and $17.5 million in total for the years 2020 through 2024.
The Company expects to contribute $9.7 million to defined benefit plans in 2015.
Amounts in accumulated other comprehensive income at December 31 were as follows:
| (in thousands) | | 2014 | | | 2013 | |
| Prior service cost | | $ | — | | | $ | 1,182 | |
| Unrecognized net actuarial loss | | | 7,407 | | | | 7,944 | |
The pension adjustments, net of tax, recognized in OCI, were as follows:
| (in thousands) | | 2014 | | | 2013 | | | 2012 | |
| Net actuarial (loss) gain arising during the period | | $ | (387 | ) | | $ | 3,180 | | | $ | (3,947 | ) |
| Amortization of actuarial loss, included in defined benefit expense | | | 1,252 | | | | 2,006 | | | | 526 | |
| Amortization of prior service cost, included in defined benefit expense | | | 733 | | | | 108 | | | | 1,205 | |
| Pension adjustment, net of tax | | $ | 1,598 | | | $ | 5,294 | | | $ | (2,216 | ) |
The estimated actuarial loss for the defined benefit plans that will be amortized from accumulated other comprehensive loss into periodic benefit cost during 2015 is $0.3 million.
The investment objectives and target allocations for the Company’s pension plans related to the assets of the plans are reviewed on a regular basis. The investment objectives for the pension assets are to maximize the return on assets while maintaining an overall level of risk appropriate for a retirement fund and ensuring the availability of funds for the payment of retirement benefits. The levels of risk assumed by the pension plans are determined by market conditions, the rate of return expectations and the liquidity requirements of each pension plan. The actual asset allocations of each pension plan are reviewed on a regular basis to ensure that they are in line with the target allocations.
The following table presents the Company’s pension plan assets by asset category as of December 31, 2014 and 2013:
| | | Fair value as of December 31, | | | Fair Value Measurements at December 31, 2014 Using Fair Value Hierarchy | | | Fair Value as of December 31, | | | Fair Value Measurements at December 31, 2013 Using Fair Value Hierarchy | |
| (in thousands) | | 2014 | | | Level 1 | | | Level 2 | | | Level 3 | | | 2013 | | | Level 1 | | | Level 2 | | | Level 3 | |
| Equity Funds | | | | | | | | | | | | | | | | | | | | | | | | |
| Domestic | | $ | 6,424 | | | $ | 6,424 | | | $ | — | | | $ | — | | | $ | 6,143 | | | $ | 6,143 | | | $ | — | | | $ | — | |
| International | | | 242 | | | | — | | | | 242 | | | | — | | | | 7,294 | | | | — | | | | 7,294 | | | | — | |
| International Fixed Income Funds | | | 22,710 | | | | 960 | | | | 21,750 | | | | — | | | | 23,162 | | | | 1,186 | | | | 21,976 | | | | — | |
| Other investments | | | 10,144 | | | | 38 | | | | 10,106 | | | | — | | | | 523 | | | | 40 | | | | 483 | | | | — | |
| Total assets at fair value | | $ | 39,520 | | | $ | 7,422 | | | $ | 32,098 | | | $ | — | | | $ | 37,122 | | | $ | 7,369 | | | $ | 29,753 | | | $ | — | |
The Company is required to categorize pension plan assets based on the following fair value hierarchy:
Level 1: Observable inputs that reflect quoted prices (unadjusted) for identical assets or liabilities in active markets.
Level 2: Inputs other than quoted prices included in Level 1 that are observable for the asset or liability through corroboration with observable market data.
Level 3: Unobservable inputs that reflect the reporting entity’s own assumptions.
7.
ACCUMULATED OTHER COMPREHENSIVE INCOME
The following tables summarize the changes in OCI for 2014:
| (in thousands) | | Cash Flow Hedges(a) | | | Pension Items(a) | | | Foreign Currency Items | | | Total | |
| Balance as of December 31, 2013 | | $ | (99 | ) | | $ | (6,768 | ) | | $ | 12,869 | | | $ | 6,002 | |
| Other comprehensive income before reclassifications | | | 554 | | | | (387 | ) | | | (93,151 | ) | | | (92,984 | ) |
| Amounts reclassified from OCI | | | (131 | ) | | | 1,985 | | | | — | | | | 1,854 | |
| Balance as of December 31, 2014 | | $ | 324 | | | $ | (5,170 | ) | | $ | (80,282 | ) | | $ | (85,128 | ) |
(a) Cash Flow Hedges and Pension Items are net of tax.
See Note 6, Retirement Plans, for more information on the pension items reclassified out of OCI and into Selling and Administrative expenses in the Statement of Earnings during 2014. See Note 4, Derivative Instruments and Hedging Activity, for additional information on the Company’s cash flow hedges.
8.
INCOME TAXES
The provision for income taxes for continuing operations was as follows:
| (in thousands) | | 2014 | | | 2013 | | | 2012 | |
| Currently payable: | | | | | | | | | |
| Federal | | $ | 18,642 | | | $ | 21,252 | | | $ | 22,394 | |
| State | | | 2,264 | | | | 3,065 | | | | 3,024 | |
| Foreign | | | 25,435 | | | | 25,175 | | | | 22,670 | |
| | | | 46,341 | | | | 49,492 | | | | 48,088 | |
| Deferred (benefit) expense: | | | | | | | | | | | | |
| Federal | | | 1,532 | | | | (5,125 | ) | | | 170 | |
| State | | | (935 | ) | | | 502 | | | | 603 | |
| Foreign | | | (14,111 | ) | | | (1,534 | ) | | | 2,035 | |
| | | | (13,514 | ) | | | (6,157 | ) | | | 2,808 | |
| Income taxes | | $ | 32,827 | | | $ | 43,335 | | | $ | 50,896 | |
The tax effects of temporary differences that give rise to significant portions of deferred tax assets and liabilities consisted of the following:
| (in thousands) | | 2014 | | | 2013 | |
| Deferred tax assets: | | | | | | |
| Benefit plans | | $ | 15,507 | | | $ | 21,148 | |
| Liabilities and reserves | | | 19,384 | | | | 11,499 | |
| Operating loss and credit carryovers | | | 57,128 | | | | 51,292 | |
| Other | | | 6,872 | | | | 17,151 | |
| Gross deferred tax assets | | | 98,891 | | | | 101,090 | |
| Valuation allowance | | | (43,055 | ) | | | (43,048 | ) |
| Deferred tax assets | | | 55,836 | | | | 58,042 | |
| Deferred tax liabilities: | | | | | | | | |
| Property, plant and equipment | | | (1,619 | ) | | | (21,139 | ) |
| Other assets | | | (1,462 | ) | | | (1,411 | ) |
| Goodwill | | | (28,583 | ) | | | (28,573 | ) |
| Other | | | (1,426 | ) | | | (3,168 | ) |
| Deferred tax liabilities | | | (33,090 | ) | | | (54,291 | ) |
| Net deferred tax assets | | $ | 22,746 | | | $ | 3,751 | |
As of December 31, 2014, $1.0 million of the net deferred tax asset balance, is a non-current asset and is reported in the other assets line item in the Consolidated Balance Sheet.
In 2012, the Company recorded a correction of a prior period item related to the tax effect on certain foreign denominated loan losses that were previously recorded in OCI. As a result, net deferred tax assets increased by $10.8 million, other current assets by $6.0 million and OCI by $16.8 million. The tax effect was recognized in OCI in 2012 and was not material to any previously reported year.
At December 31, 2014, foreign operating loss carryovers were $116.2 million. Included in the foreign operating loss carryovers are losses of $10.1 million that expire through 2029 and $106.0 million that do not have an expiration date. At December 31, 2014, state operating loss carryovers were $99.3 million, all of which expire through 2029.
The effective tax rate for continuing operations differed from the statutory federal income tax rate of 35% as described below:
| | | 2014 | | | 2013 | | | 2012 | |
| Taxes at statutory rate | | | 35.0 | % | | | 35.0 | % | | | 35.0 | % |
| State income taxes, net of federal income tax benefit | | | 1.9 | | | | 1.1 | | | | 1.5 | |
| Tax credits | | | (0.4 | ) | | | (0.3 | ) | | | — | |
| Taxes on foreign earnings | | | (4.7 | ) | | | (5.3 | ) | | | (4.1 | ) |
| Resolution of prior years’ tax matters | | | (0.6 | ) | | | (0.7 | ) | | | (1.4 | ) |
| U.S. manufacturing deduction | | | (2.0 | ) | | | (1.6 | ) | | | (1.8 | ) |
| Valuation allowance adjustments | | | 0.2 | | | | (0.8 | ) | | | (0.5 | ) |
| Other, net | | | (0.8 | ) | | | 0.1 | | | | 0.2 | |
| Effective tax rate | | | 28.6 | % | | | 27.5 | % | | | 28.9 | % |
Earnings from continuing operations before income taxes were as follows:
| (in thousands) | | 2014 | | | 2013 | | | 2012 | |
| United States | | $ | 56,211 | | | $ | 55,461 | | | $ | 79,118 | |
| Foreign | | | 58,387 | | | | 102,172 | | | | 96,860 | |
| Total | | $ | 114,598 | | | $ | 157,633 | | | $ | 175,978 | |
Federal and state income taxes are provided on international subsidiary income distributed to or taxable in the United States during the year. At December 31, 2014, federal and state taxes have not been provided for approximately $449.8 million of unremitted earnings of the foreign subsidiaries that are considered to be invested indefinitely. Determination of the deferred tax liability on such earnings is not practicable.
A reconciliation of the change in the liability for unrecognized tax benefits for 2014 and 2013 is as follows:
| (in thousands) | | 2014 | | | 2013 | |
| Balance at beginning of year | | $ | 5,295 | | | $ | 7,091 | |
| Increases for tax positions taken in the current year | | | 718 | | | | 818 | |
| Increases for tax positions taken in prior years | | | 10,238 | | | | 875 | |
| Decreases related to settlements with tax authorities | | | (1,044 | ) | | | (3,113 | ) |
| Decreases as a result of lapse of the applicable statutes of limitations | | | (751 | ) | | | (374 | ) |
| Foreign currency exchange rate changes | | | (516 | ) | | | (2 | ) |
| Balance at the end of year | | $ | 13,940 | | | $ | 5,295 | |
The amount of the unrecognized tax benefits that would affect the effective tax rate, if recognized, was approximately $4.3 million. The Company recognizes interest and penalties related to the unrecognized tax benefits in income tax expense. As of December 31, 2014 and 2013, $0.5 million and $0.7 million, respectively, of accrued interest and penalties were reported as an income tax liability. The liability for unrecognized tax benefits relates to multiple jurisdictions and is reported in Other liabilities on the Consolidated Balance Sheet at December 31, 2014.
The Company believes that it is reasonably possible that the total amount of liability for unrecognized tax benefits as of December 31, 2014, will decrease by approximately $10.2 million during 2015, of which $0.3 million is estimated to impact the effective tax rate. The potential decrease relates to various tax matters for which the statute of limitations may expire or will be otherwise settled in 2015. The amount that is ultimately recognized in the financial statements will be dependent upon various factors including potential increases or decreases to unrecognized tax benefits as a result of examinations, settlements and other unanticipated items that may occur during the year. With limited exceptions, the Company is no longer subject to federal, state and local, or non-U.S. income tax examinations by tax authorities for years before 2004.
9.
SEGMENT AND GEOGRAPHIC INFORMATION
The accounting policies of the segments are the same as those described in the summary of significant accounting policies. The Company evaluates performance based on operating income of the respective business units before restructuring charges, interest expense and income taxes. Total revenue and operating income by business segment and geographic region include both sales to customers, as reported in the Company’s Consolidated Statements of Earnings, and intersegment sales, which are accounted for at prices that approximate market prices and are eliminated in consolidation. Corporate & Other revenue consists primarily of flavor, fragrances and color products sold by the Asia Pacific Group and Flavors Central & South America Group.
Assets by business segment and geographic region are those assets used in the Company’s operations in each segment and geographic region. Segment assets reflect the allocation of goodwill to each segment. Corporate & Other assets consist primarily of property and investments.
Segment Information The Company determines its operating segments based on information utilized by the chief operating decision maker to allocate resources and assess performance. The Company’s reportable segments consist of Flavors & Fragrances and Color and are both managed on a products and services basis. The Company’s Flavors & Fragrances segment produces flavor and fragrance products that impart a desired taste, texture, aroma or other characteristic to a broad range of consumer and other products. The Color segment produces natural and synthetic color systems for pharmaceuticals, foods and beverages; colors and formulations for cosmetics; and technical colors for industrial applications. Two additional segments, Asia Pacific and Flavors Central & South America are managed on a geographic basis and included in Corporate & Other.
Beginning in 2014, the results of operations for the Company’s fragrances businesses in Asia Pacific, previously reported in the Corporate & Other segment, are reported in the Flavors & Fragrances segment, and the results of operations for the Company’s pharmaceutical flavors business, previously reported in the Flavors & Fragrances segment, are reported in the Color segment with the pharmaceutical colors business. The Color segment results have been restated to remove the impact of a discontinued operation. The prior year results have been restated as a result of these changes.
Restructuring and other costs related to continuing operations for the years ended December 31, 2014 and 2013, are further described in Note 11, Restructuring Charges, and are included in the Operating income (loss) results in the Corporate & Other segment below. Consistent with presentation in the Consolidated Balance Sheets and Statements of Cash Flows, the below amounts for Assets, Capital expenditures, and Depreciation and amortization include discontinued operations for all periods presented and are included in the Corporate & Other segment.
| (in thousands) | | Flavors & Fragrances | | | Color | | | Corporate & Other | | | Consolidated | |
| | | | | | | | | | | | | |
| 2014 | | | | | | | | | | | | |
| Revenue from external customers | | $ | 813,808 | | | $ | 487,503 | | | $ | 146,510 | | | $ | 1,447,821 | |
| Intersegment revenue | | | 33,214 | | | | 20,574 | | | | 229 | | | | 54,017 | |
| Total revenue | | | 847,022 | | | | 508,077 | | | | 146,739 | | | | 1,501,838 | |
| Operating income (loss) | | | 119,093 | | | | 114,884 | | | | (103,312 | ) | | | 130,665 | |
| Interest expense | | | — | | | | — | | | | 16,067 | | | | 16,067 | |
| Earnings (loss) before income taxes from continuing operations | | | 119,093 | | | | 114,884 | | | | (119,379 | ) | | | 114,598 | |
| Assets | | | 814,215 | | | | 732,364 | | | | 218,627 | | | | 1,765,206 | |
| Capital expenditures | | | 41,131 | | | | 31,883 | | | | 6,384 | | | | 79,398 | |
| Depreciation and amortization | | | 26,180 | | | | 18,785 | | | | 6,491 | | | | 51,456 | |
| | | | | | | | | | | | | | | | | |
| 2013 | | | | | | | | | | | | | | | | |
| Revenue from external customers | | $ | 843,233 | | | $ | 473,811 | | | $ | 145,082 | | | $ | 1,462,126 | |
| Intersegment revenue | | | 33,269 | | | | 21,246 | | | | 97 | | | | 54,612 | |
| Total revenue | | | 876,502 | | | | 495,057 | | | | 145,179 | | | | 1,516,738 | |
| Operating income (loss) | | | 120,278 | | | | 107,873 | | | | (54,371 | ) | | | 173,780 | |
| Interest expense | | | — | | | | — | | | | 16,147 | | | | 16,147 | |
| Earnings (loss) before income taxes from continuing operations | | | 120,278 | | | | 107,873 | | | | (70,518 | ) | | | 157,633 | |
| Assets | | | 896,335 | | | | 761,485 | | | | 212,914 | | | | 1,870,734 | |
| Capital expenditures | | | 59,040 | | | | 38,639 | | | | 6,567 | | | | 104,246 | |
| Depreciation and amortization | | | 27,435 | | | | 17,541 | | | | 7,040 | | | | 52,016 | |
| | | | | | | | | | | | | | | | | |
| 2012 | | | | | | | | | | | | | | | | |
| Revenue from external customers | | $ | 835,619 | | | $ | 478,341 | | | $ | 139,595 | | | $ | 1,453,555 | |
| Intersegment revenue | | | 34,428 | | | | 22,326 | | | | 34 | | | | 56,788 | |
| Total revenue | | | 870,047 | | | | 500,667 | | | | 139,629 | | | | 1,510,343 | |
| Operating income (loss) | | | 120,825 | | | | 101,062 | | | | (29,008 | ) | | | 192,879 | |
| Interest expense | | | — | | | | — | | | | 16,901 | | | | 16,901 | |
| Earnings (loss) before income taxes from continuing operations | | | 120,825 | | | | 101,062 | | | | (45,909 | ) | | | 175,978 | |
| Assets | | | 859,303 | | | | 715,683 | | | | 201,657 | | | | 1,776,643 | |
| Capital expenditures | | | 49,781 | | | | 45,858 | | | | 8,167 | | | | 103,806 | |
| Depreciation and amortization | | | 26,996 | | | | 14,393 | | | | 6,963 | | | | 48,352 | |
Geographic Information The Company has manufacturing facilities or sales offices in North America, Europe, Asia, Australia, South America and Africa. The Company’s annual revenue from continuing operations summarized by geographic location is as follows:
| (in thousands) | | 2014 | | | 2013 | | | 2012 | |
| Revenue from external customers: | | | | | | | | | |
| North America | | $ | 750,345 | | | $ | 782,088 | | | $ | 783,840 | |
| Europe | | | 389,588 | | | | 382,077 | | | | 370,490 | |
| Asia Pacific | | | 193,163 | | | | 188,917 | | | | 197,658 | |
| Other | | | 114,725 | | | | 109,044 | | | | 101,567 | |
| Consolidated | | $ | 1,447,821 | | | $ | 1,462,126 | | | $ | 1,453,555 | |
| Long-lived assets: | | | | | | | | | | | | |
| North America | | $ | 537,668 | | | $ | 531,005 | | | $ | 504,483 | |
| Europe | | | 423,972 | | | | 506,352 | | | | 472,865 | |
| Asia Pacific | | | 29,948 | | | | 32,148 | | | | 35,891 | |
| Other | | | 14,229 | | | | 11,404 | | | | 12,050 | |
| Consolidated | | $ | 1,005,817 | | | $ | 1,080,909 | | | $ | 1,025,289 | |
Sales in the United States, based on the final country of destination of the Company’s products, were $573.6 million, $590.0 million and $596.4 million in 2014, 2013 and 2012, respectively. No other country of destination exceeded 10% of consolidated sales. Total long-lived assets in the United States amounted to $450.8 million, $389.7 million and $360.1 million at December 31, 2014, 2013 and 2012, respectively.
Product Information The Company’s revenue from continuing operations summarized by product portfolio is as follows:
| (in thousands) | | 2014 | | | 2013 | | | 2012 | |
| Traditional Flavors & Fragrances | | $ | 724,693 | | | $ | 736,107 | | | $ | 715,227 | |
| Natural Ingredients | | | 227,538 | | | | 244,155 | | | | 252,941 | |
| Food & Beverage Colors | | | 334,565 | | | | 307,179 | | | | 310,639 | |
| Non-Food Colors | | | 215,042 | | | | 229,297 | | | | 231,536 | |
| Interdivision Revenue | | | (54,017 | ) | | | (54,612 | ) | | | (56,788 | ) |
| Consolidated | | $ | 1,447,821 | | | $ | 1,462,126 | | | $ | 1,453,555 | |
10.
FAIR VALUE MEASUREMENTS
ASC 820, Fair Value Measurements and Disclosures, defines fair value for financial assets and liabilities, establishes a framework for measuring fair value in GAAP and expands disclosures about fair value measurements. As of December 31, 2014 and 2013, the Company’s only assets and liabilities subject to this standard are forward contracts, investments in a money market fund and municipal bonds, and defined benefit plan assets (See Note 6, Retirement Plans, for additional information on the defined benefit plan assets). The net fair value of the forward exchange contracts based on current pricing obtained for comparable derivative products (Level 2 inputs) was a liability of $0.1 million at December 31, 2014 and an asset of $0.2 million at December 31, 2013. The fair value of the investments based on December 31, 2014, and 2013, market quotes (Level 1 inputs) was an asset of $1.9 million and $19.8 million, respectively.
The carrying values of the Company’s cash and cash equivalents, trade accounts receivable, accounts payable, accrued expenses and short-term borrowings approximated fair values as of December 31, 2014 and 2013.
The fair value of the Company’s long-term debt, including current maturities, is estimated using discounted cash flows based on the Company’s current incremental borrowing rates for similar types of borrowing arrangements (Level 2 inputs). The carrying value of the long-term debt at December 31, 2014 and 2013, was $451.0 million and $348.1 million, respectively. The fair value of the long-term debt at December 31, 2014 and 2013, was approximately $464.5 million and $351.0 million, respectively.
11.
RESTRUCTURING CHARGES
The Company incurred restructuring costs in both continuing and discontinued operations. The discussion in this note relates to the combination of both continuing and discontinued operations unless otherwise noted. Restructuring costs related to discontinued operations are recorded in discontinued operations within the Company’s Consolidated Condensed Statements of Earnings and are discussed in Note 12, Discontinued Operations, in more detail.
In March of this year, the Company announced the 2014 Restructuring Plan related to eliminating underperforming operations, consolidating manufacturing facilities and improving efficiencies within the Company. The 2014 Restructuring Plan will impact several facilities and will generate cost savings estimated to be approximately $30 million per year, with incremental savings expected to be achieved over the next few years and the full benefit expected to be achieved after 2016. The Company also anticipates that the 2014 Restructuring Plan will include a reduction in headcount by approximately 300 employees, primarily direct and indirect manufacturing labor, and pre-tax charges of approximately $120 million to $130 million. In connection with the 2014 Restructuring Plan, approximately 100 employees were terminated as of December 31, 2014, and approximately $2.6 million of savings were recognized by December 31, 2014.
The Company determined that certain long-lived assets, including land, buildings and certain pieces of equipment associated with the identified operations were impaired. As a result, the Company has reduced the carrying amounts of these assets to approximately $35 million, their aggregate respective fair values, which were determined based on independent market valuations for these assets. Also, certain machinery and equipment has been identified to be disposed of at the time of the facility closures, and the associated depreciation has been accelerated. In addition, certain intangible assets and inventory were determined to be impaired and were written down.
For the year ended December 31, 2014, the Company recorded restructuring and other costs of $101.5 million ($73.3 million after-tax), in accordance with GAAP and based on an internal review of the affected facilities and consultation with legal and other advisors. Included within the restructuring and other costs, the Company incurred $3.2 million for the year ended December 31, 2014, related to the 2014 proxy contest. For the year ended December 31, 2013, the Company recorded restructuring costs of $31.7 million ($22.0 million after-tax) related to the 2013 restructuring program to relocate the Flavors & Fragrances Group headquarters to Chicago and to implement a profit improvement plan across all segments of the Company. Costs incurred in 2014 related to the 2013 restructuring program were not material.
The Company evaluates performance based on operating income of each segment before restructuring costs. The restructuring and other costs related to continuing operations are recorded in the Corporate & Other segment. The following table summarizes the restructuring and other costs by segment and discontinued operations for the years ended December 31, 2014 and 2013:
| (in thousands) | | 2014 | | | 2013 | |
| Flavors & Fragrances | | $ | 83,871 | | | $ | 22,284 | |
| Color | | | — | | | | 7,065 | |
| Corporate & Other | | | 6,679 | | | | 2,386 | |
| Total Continuing Operations | | | 90,550 | | | | 31,735 | |
| Discontinued Operations | | | 10,998 | | | | — | |
| Total Restructuring | | $ | 101,548 | | | $ | 31,735 | |
The Company recorded restructuring and other charges in continuing operations for the years ended December 31, 2014 and 2013, as follows:
| (in thousands) | | Selling & Administrative | | | Cost of Products Sold | | | Total | |
| 2014 | | | | | | | | | |
| Employee separations | | $ | 17,794 | | | $ | — | | | $ | 17,794 | |
| Long-lived asset impairment | | | 63,431 | | | | — | | | | 63,431 | |
| Gain on asset sales | | | (602 | ) | | | — | | | | (602 | ) |
| Write-down of inventory | | | — | | | | 1,914 | | | | 1,914 | |
Other costs(1) | | | 8,013 | | | | — | | | | 8,013 | |
| Total | | $ | 88,636 | | | $ | 1,914 | | | $ | 90,550 | |
(1)Other costs include decommissioning costs, professional services, personnel moving costs, other related costs and 2014 proxy contest costs.
| (in thousands) | | Selling & Administrative | | | Cost of Products Sold | | | Total | |
| 2013 | | | | | | | | | |
| Employee separations | | $ | 18,081 | | | $ | — | | | $ | 18,081 | |
| Long-lived asset impairment | | | 4,176 | | | | — | | | | 4,176 | |
| Gain on asset sales | | | (3,019 | ) | | | — | | | | (3,019 | ) |
| Write-down of inventory | | | — | | | | 1,840 | | | | 1,840 | |
Other costs(2) | | | 10,657 | | | | — | | | | 10,657 | |
| Total | | $ | 29,895 | | | $ | 1,840 | | | $ | 31,735 | |
(2)Other costs include decommissioning costs, professional services, personnel (other than employee separations) and moving related costs.
The Company expects to incur approximately $21 million to $31 million of additional restructuring costs by the end of 2016, consisting primarily of employee separations, asset impairments, and other restructuring related costs.
Activities impacting the Company’s reserve for restructuring and other charges for the years ended December 31, 2014 and 2013 were as follows:
| (in thousands) | | Employee Separations | | | Assets Related and Other | | | Total | |
| Balance as of December 31, 2012 | | $ | — | | | $ | — | | | $ | — | |
| Restructuring and other costs | | | 18,081 | | | | 13,654 | | | | 31,735 | |
| Gain on sale of assets | | | — | | | | 3,019 | | | | 3,019 | |
| Cash spent | | | (13,505 | ) | | | (9,069 | ) | | | (22,574 | ) |
| Reduction of assets | | | — | | | | (6,016 | ) | | | (6,016 | ) |
| Translation adjustment | | | (14 | ) | | | — | | | | (14 | ) |
| Balance as of December 31, 2013 | | $ | 4,562 | | | $ | 1,588 | | | $ | 6,150 | |
| Restructuring and other costs | | | 18,951 | | | | 82,597 | | | | 101,548 | |
| Gain on sale of assets | | | — | | | | 602 | | | | 602 | |
| Cash spent | | | (7,067 | ) | | | (8,773 | ) | | | (15,840 | ) |
| Reduction of assets | | | — | | | | (75,117 | ) | | | (75,117 | ) |
| Translation adjustment | | | (1,537 | ) | | | — | | | | (1,537 | ) |
| Balance as of December 31, 2014 | | $ | 14,909 | | | $ | 897 | | | $ | 15,806 | |
These reserves are classified as current liabilities in the Consolidated Balance Sheets.
12.
DISCONTINUED OPERATIONS
In connection with the 2014 Restructuring Plan, the Company approved a plan to dispose of a business unit within the Color segment. The Company determined that as of September 30, 2014, the business met the criteria to be presented as a discontinued operation as established in ASC Subtopic 205-20, Discontinued Operations. The results of this business have been reported as a discontinued operation in the Consolidated Statements of Earnings for all periods presented. The corresponding assets, which include property, plant, and equipment, have met the held for sale criteria and have been properly presented on the Consolidated Balance Sheets.
The following table summarizes the discontinued operation’s results, which are included in the loss from discontinued operations in the Consolidated Statements of Earnings for the years ended December 31, 2014, 2013, and 2012:
| (in thousands) | | 2014 | | | 2013 | | | 2012 | |
| Net sales | | $ | 5,197 | | | $ | 5,424 | | | $ | 5,495 | |
| Loss from discontinued operations before income taxes | | | (11,496 | ) | | | (1,418 | ) | | | (1,671 | ) |
| Income tax benefit | | | 3,371 | | | | 415 | | | | 497 | |
| Loss from discontinued operations, net of tax | | $ | (8,125 | ) | | $ | (1,003 | ) | | $ | (1,174 | ) |
Included in the loss before income taxes from discontinued operations are pre-tax restructuring costs of $11.0 million for the year ended December 31, 2014. See Note 11, Restructuring Charges, for additional information.
13.
COMMITMENTS AND CONTINGENCIES
Leases
The Company leases certain facilities and equipment under operating lease arrangements. Aggregate minimum rental commitments at December 31, 2014, for all noncancelable operating leases with an initial lease term greater than one year for the years ending December 31 are as follows: 2015, $7.7 million; 2016, $4.3 million; 2017, $2.5 million; 2018, $1.8 million; 2019, $1.4 and $1.8 million thereafter.
Rent expense from continuing operations totaled $10.7 million, $10.6 million and $10.7 million during the years ended December 31, 2014, 2013 and 2012, respectively.
Litigation and Other Claims
The Company is subject to various claims and litigation arising in the normal course of business. The Company establishes reserves for claims and proceedings when it is probable that liabilities exist and reasonable estimates of loss can be made. While it is not possible to predict the outcome of these matters, based on our assessment of the facts and circumstances now known, we do not believe that these matters, individually or in the aggregate, will have a material adverse effect on our financial position. However, actual outcomes may be different from those expected and could have a material effect on our results of operations or cash flows in a particular period.
Management’s Report on Internal Control Over Financial Reporting
The management of Sensient Technologies Corporation is responsible for establishing and maintaining adequate internal control over financial reporting. It is management’s policy to maintain a control-conscious environment through an effective system of internal accounting controls. These controls are supported by the careful selection of competent and knowledgeable personnel and by the communication of standard accounting and reporting policies and procedures throughout the Company. These controls are designed to provide reasonable assurance regarding the reliability of financial reporting and the preparation of financial statements for external purposes in accordance with generally accepted accounting principles.
Management has assessed the effectiveness of the Company’s internal control over financial reporting as of December 31, 2014. In making its assessment of internal control over financial reporting, management used the criteria set forth by the Committee of Sponsoring Organizations of the Treadway Commission in Internal Control – Integrated Framework. Based on that assessment, management has concluded that the Company’s internal control over financial reporting was effective as of December 31, 2014.
The Company’s independent registered public accounting firm has issued its report on the Company’s internal control over financial reporting. This report appears on page 43.
Report of Independent Registered Public Accounting Firm
To The Board of Directors and Shareholders of
Sensient Technologies Corporation
Milwaukee, Wisconsin
We have audited the accompanying consolidated balance sheets of Sensient Technologies Corporation and subsidiaries as of December 31, 2014 and 2013, and the related consolidated statements of earnings, comprehensive income, shareholders’ equity, and cash flows for each of the three years in the period ended December 31, 2014. These financial statements are the responsibility of the Company’s management. Our responsibility is to express an opinion on these financial statements based on our audits.
We conducted our audits in accordance with the standards of the Public Company Accounting Oversight Board (United States). Those standards require that we plan and perform the audit to obtain reasonable assurance about whether the financial statements are free of material misstatement. An audit includes examining, on a test basis, evidence supporting the amounts and disclosures in the financial statements. An audit also includes assessing the accounting principles used and significant estimates made by management, as well as evaluating the overall financial statement presentation. We believe that our audits provide a reasonable basis for our opinion.
In our opinion, the financial statements referred to above present fairly, in all material respects, the consolidated financial position of Sensient Technologies Corporation and subsidiaries at December 31, 2014 and 2013, and the consolidated results of their operations and their cash flows for each of the three years in the period ended December 31, 2014, in conformity with U.S. generally accepted accounting principles.
We also have audited, in accordance with the standards of the Public Company Accounting Oversight Board (United States), Sensient Technologies Corporation’s internal control over financial reporting as of December 31, 2014, based on criteria established in Internal Control – Integrated Framework issued by the Committee of Sponsoring Organizations of the Treadway Commission (2013 framework) and our report dated February 26, 2015 expressed an unqualified opinion thereon.
Milwaukee, Wisconsin
February 26, 2015
Report of Independent Registered Public Accounting Firm
on Internal Control Over Financial Reporting
To The Board of Directors and Shareholders of
Sensient Technologies Corporation
Milwaukee, Wisconsin
We have audited Sensient Technologies Corporation’s internal control over financial reporting as of December 31, 2014, based on criteria established in Internal Control – Integrated Framework issued by the Committee of Sponsoring Organizations of the Treadway Commission (2013 framework) (the COSO criteria). Sensient Technologies Corporation’s management is responsible for maintaining effective internal control over financial reporting, and for its assessment of the effectiveness of internal control over financial reporting included in the accompanying Management’s Report on Internal Control Over Financial Reporting. Our responsibility is to express an opinion on the Company’s internal control over financial reporting based on our audit.
We conducted our audit in accordance with the standards of the Public Company Accounting Oversight Board (United States). Those standards require that we plan and perform the audit to obtain reasonable assurance about whether effective internal control over financial reporting was maintained in all material respects. Our audit included obtaining an understanding of internal control over financial reporting, assessing the risk that a material weakness exists, testing and evaluating the design and operating effectiveness of internal control based on the assessed risk, and performing such other procedures as we considered necessary in the circumstances. We believe that our audit provides a reasonable basis for our opinion.
A company’s internal control over financial reporting is a process designed to provide reasonable assurance regarding the reliability of financial reporting and the preparation of financial statements for external purposes in accordance with generally accepted accounting principles. A company’s internal control over financial reporting includes those policies and procedures that (1) pertain to the maintenance of records that, in reasonable detail, accurately and fairly reflect the transactions and dispositions of the assets of the company; (2) provide reasonable assurance that transactions are recorded as necessary to permit preparation of financial statements in accordance with generally accepted accounting principles, and that receipts and expenditures of the company are being made only in accordance with authorizations of management and directors of the company; and (3) provide reasonable assurance regarding prevention or timely detection of unauthorized acquisition, use, or disposition of the company’s assets that could have a material effect on the financial statements.
Because of its inherent limitations, internal control over financial reporting may not prevent or detect misstatements. Also, projections of any evaluation of effectiveness to future periods are subject to the risk that controls may become inadequate because of changes in conditions, or that the degree of compliance with the policies or procedures may deteriorate.
In our opinion, Sensient Technologies Corporation maintained, in all material respects, effective internal control over financial reporting as of December 31, 2014, based on the COSO criteria.
We also have audited, in accordance with the standards of the Public Company Accounting Oversight Board (United States), the consolidated balance sheets of Sensient Technologies Corporation as of December 31, 2014 and 2013, and the related consolidated statements of earnings, comprehensive income, shareholders’ equity, and cash flows for each of the three years in the period ended December 31, 2014 and our report dated February 26, 2015, expressed an unqualified opinion thereon.
Milwaukee, Wisconsin
February 26, 2015
Quarterly Data
| (in thousands except per share amounts) (unaudited) | | First Quarter | | | Second Quarter | | | Third Quarter | | | Fourth Quarter | | | Full Year | |
| 2014 | | | | | | | | | | | | | | | |
| Revenue | | $ | 367,125 | | | $ | 373,373 | | | $ | 364,504 | | | $ | 342,819 | | | $ | 1,447,821 | |
| Gross profit | | | 124,496 | | | | 129,408 | | | | 121,501 | | | | 113,105 | | | | 488,510 | |
| Earnings from continuing operations | | | 2,631 | | | | 30,147 | | | | 22,664 | | | | 26,329 | | | | 81,771 | |
| Loss from discontinued operations, net of tax | | | (4,706 | ) | | | (1,086 | ) | | | (1,359 | ) | | | (974 | ) | | | (8,125 | ) |
| Net earnings | | | (2,075 | ) | | | 29,061 | | | | 21,305 | | | | 25,355 | | | | 73,646 | |
| Earnings per basic share: | | | | | | | | | | | | | | | | | | | | |
| Continuing operations | | | 0.05 | | | | 0.62 | | | | 0.47 | | | | 0.55 | | | | 1.69 | |
| Discontinued operations | | | (0.09 | ) | | | (0.02 | ) | | | (0.03 | ) | | | (0.02 | ) | | | (0.17 | ) |
| Earnings per basic share | | | (0.04 | ) | | | 0.60 | | | | 0.44 | | | | 0.53 | | | | 1.52 | |
| Earnings per diluted share: | | | | | | | | | | | | | | | | | | | | |
| Continuing operations | | | 0.05 | | | | 0.62 | | | | 0.47 | | | | 0.55 | | | | 1.67 | |
| Discontinued operations | | | (0.09 | ) | | | (0.02 | ) | | | (0.03 | ) | | | (0.02 | ) | | | (0.17 | ) |
| Earnings per diluted share | | | (0.04 | ) | | | 0.59 | | | | 0.44 | | | | 0.53 | | | | 1.51 | |
| | | | | | | | | | | | | | | | | | | | | |
| 2013 | | | | | | | | | | | | | | | | | | | | |
| Revenue | | $ | 364,254 | | | $ | 377,295 | | | $ | 370,457 | | | $ | 350,120 | | | $ | 1,462,126 | |
| Gross profit | | | 117,015 | | | | 122,288 | | | | 119,812 | | | | 115,931 | | | | 475,046 | |
| Earnings from continuing operations | | | 21,775 | | | | 32,470 | | | | 31,764 | | | | 28,289 | | | | 114,298 | |
| Loss from discontinued operations, net of tax | | | (336 | ) | | | (188 | ) | | | (239 | ) | | | (240 | ) | | | (1,003 | ) |
| Net earnings | | | 21,439 | | | | 32,282 | | | | 31,525 | | | | 28,049 | | | | 113,295 | |
| Earnings per basic share: | | | | | | | | | | | | | | | | | | | | |
| Continuing operations | | | 0.44 | | | | 0.65 | | | | 0.64 | | | | 0.57 | | | | 2.30 | |
| Discontinued operations | | | (0.01 | ) | | | — | | | | — | | | | — | | | | (0.02 | ) |
| Earnings per basic share | | | 0.43 | | | | 0.65 | | | | 0.63 | | | | 0.56 | | | | 2.28 | |
| Earnings per diluted share: | | | | | | | | | | | | | | | | | | | | |
| Continuing operations | | | 0.44 | | | | 0.65 | | | | 0.64 | | | | 0.57 | | | | 2.29 | |
| Discontinued operations | | | (0.01 | ) | | | — | | | | — | | | | — | | | | (0.02 | ) |
| Earnings per diluted share | | | 0.43 | | | | 0.65 | | | | 0.63 | | | | 0.56 | | | | 2.27 | |
Common Stock Prices and Dividends
| | | 2014 | | | Dividends | | | 2013 | | | Dividends | |
| | | Market Price | | | Declared | | | Market Price | | | Declared | |
| | | High | | | Low | | | Per Share | | | High | | | Low | | | Per Share | |
| First Quarter | | $ | 57.11 | | | $ | 46.08 | | | $ | 0.48 | | | $ | 39.39 | | | $ | 35.54 | | | $ | 0.22 | |
| Second Quarter | | | 57.35 | | | | 51.39 | | | | — | | | | 42.38 | | | | 35.59 | | | | 0.23 | |
| Third Quarter | | | 56.99 | | | | 51.60 | | | | 0.25 | | | | 48.15 | | | | 39.96 | | | | 0.23 | |
| Fourth Quarter | | | 63.35 | | | | 49.72 | | | | 0.25 | | | | 53.35 | | | | 46.75 | | | | 0.23 | |
Company Stock Performance
This graph compares the cumulative total shareholder return for the Company’s common stock over the last five years to the total returns on the Standard & Poor’s Midcap Specialty Chemicals Index (the “S&P Midcap Specialty Chemicals Index”), the Standard & Poor’s Midcap Food Products Index (the “S&P Midcap Food Products Index”) and the Standard & Poor’s 500 Stock Index (the “S&P 500 Index”). The graph assumes a $100 investment made on December 31, 2009, and reinvestment of dividends. The stock performance shown on the graph is not necessarily indicative of future price performance.
| December 31, | | 2009 | | | 2010 | | | 2011 | | | 2012 | | | 2013 | | | 2014 | |
| Sensient Technologies Corporation | | $ | 100 | | | $ | 143 | | | $ | 150 | | | $ | 145 | | | $ | 201 | | | $ | 254 | |
| S&P Midcap Specialty Chemicals Index | | | 100 | | | | 139 | | | | 162 | | | | 223 | | | | 278 | | | | 319 | |
| S&P Midcap Food Products Index | | | 100 | | | | 125 | | | | 150 | | | | 159 | | | | 225 | | | | 330 | |
| S&P 500 Index | | | 100 | | | | 115 | | | | 117 | | | | 136 | | | | 179 | | | | 204 | |
Standard & Poor’s and S&P are registered trademarks of Standard & Poor’s Financial Services, LLC.
Five Year Review
(in thousands except percentages, employee and per share data) Years ended December 31, | | 2014 | | | 2013 | | | 2012 | | | 2011 | | | 2010 | |
| Summary of Operations | | | | | | | | | | | | | | | | | | | | | | | | | | | | | | |
| Revenue | | $ | 1,447,821 | | | | 100.0 | % | | $ | 1,462,126 | | | | 100.0 | % | | $ | 1,453,555 | | | | 100.0 | % | | $ | 1,423,893 | | | | 100.0 | % | | $ | 1,322,449 | | | | 100.0 | % |
| Cost of products sold | | | 959,311 | | | | 66.3 | | | | 987,080 | | | | 67.5 | | | | 990,911 | | | | 68.2 | | | | 975,494 | | | | 68.5 | | | | 915,324 | | | | 69.2 | |
| Selling and administrative expenses | | | 357,845 | | | | 24.7 | | | | 301,266 | | | | 20.6 | | | | 269,765 | | | | 18.6 | | | | 256,283 | | | | 18.0 | | | | 231,680 | | | | 17.5 | |
| Operating income | | | 130,665 | | | | 9.0 | | | | 173,780 | | | | 11.9 | | | | 192,879 | | | | 13.3 | | | | 192,116 | | | | 13.5 | | | | 175,445 | | | | 13.3 | |
| Interest expense | | | 16,067 | | | | 1.1 | | | | 16,147 | | | | 1.1 | | | | 16,901 | | | | 1.2 | | | | 19,439 | | | | 1.4 | | | | 20,384 | | | | 1.5 | |
| Earnings before income taxes | | | 114,598 | | | | 7.9 | | | | 157,633 | | | | 10.8 | | | | 175,978 | | | | 12.1 | | | | 172,677 | | | | 12.1 | | | | 155,061 | | | | 11.7 | |
| Income taxes | | | 32,827 | | | | 2.3 | | | | 43,335 | | | | 3.0 | | | | 50,896 | | | | 3.5 | | | | 51,279 | | | | 3.6 | | | | 47,299 | | | | 3.6 | |
| Earnings from continuing operations | | | 81,771 | | | | 5.6 | | | | 114,298 | | | | 7.8 | | | | 125,082 | | | | 8.6 | | | | 121,398 | | | | 8.5 | | | | 107,762 | | | | 8.1 | |
| Loss from discontinued operations, net of tax | | | (8,125 | ) | | | (0.6 | ) | | | (1,003 | ) | | | (0.1 | ) | | | (1,174 | ) | | | (0.1 | ) | | | (914 | ) | | | (0.1 | ) | | | (618 | ) | | | — | |
| Net earnings | | $ | 73,646 | | | | 5.1 | % | | $ | 113,295 | | | | 7.7 | % | | $ | 123,908 | | | | 8.5 | % | | $ | 120,484 | | | | 8.5 | % | | $ | 107,144 | | | | 8.1 | % |
| Earnings per basic share: | | | | | | | | | | | | | | | | | | | | | | | | | | | | | | | | | | | | | | | | |
| Continuing operations | | $ | 1.69 | | | | | | | $ | 2.30 | | | | | | | $ | 2.52 | | | | | | | $ | 2.44 | | | | | | | $ | 2.19 | | | | | |
| Discontinued operations | | | (0.17 | ) | | | | | | | (0.02 | ) | | | | | | | (0.02 | ) | | | | | | | (0.02 | ) | | | | | | | (0.01 | ) | | | | |
| Earnings per basic share | | $ | 1.52 | | | | | | | $ | 2.28 | | | | | | | $ | 2.50 | | | | | | | $ | 2.42 | | | | | | | $ | 2.18 | | | | | |
| Earnings per diluted share: | | | | | | | | | | | | | | | | | | | | | | | | | | | | | | | | | | | | | | | | |
| Continuing operations | | $ | 1.67 | | | | | | | $ | 2.29 | | | | | | | $ | 2.51 | | | | | | | $ | 2.43 | | | | | | | $ | 2.18 | | | | | |
| Discontinued operations | | | (0.17 | ) | | | | | | | (0.02 | ) | | | | | | | (0.02 | ) | | | | | | | (0.02 | ) | | | | | | | (0.01 | ) | | | | |
| Earnings per diluted share | | $ | 1.51 | | | | | | | $ | 2.27 | | | | | | | $ | 2.49 | | | | | | | $ | 2.41 | | | | | | | $ | 2.17 | | | | | |
| Other Related Data | | | | | | | | | | | | | | | | | | | | | | | | | | | | | | | | | | | | | | | | |
| Dividends per share, declared and paid | | $ | 0.98 | | | | | | | $ | 0.91 | | | | | | | $ | 0.87 | | | | | | | $ | 0.84 | | | | | | | $ | 0.79 | | | | | |
| Average common shares outstanding: | | | | | | | | | | | | | | | | | | | | | | | | | | | | | | | | | | | | | | | | |
| Basic | | | 48,525 | | | | | | | | 49,755 | | | | | | | | 49,596 | | | | | | | | 49,746 | | | | | | | | 49,138 | | | | | |
| Diluted | | | 48,819 | | | | | | | | 49,934 | | | | | | | | 49,822 | | | | | | | | 49,937 | | | | | | | | 49,424 | | | | | |
| Book value per common share | | $ | 21.94 | | | | | | | $ | 24.72 | | | | | | | $ | 23.09 | | | | | | | $ | 20.87 | | | | | | | $ | 19.70 | | | | | |
| Price range per common share | | | 46.08-63.35 | | | | | | | | 35.54-53.35 | | | | | | | | 33.13-41.08 | | | | | | | | 30.15-39.69 | | | | | | | | 24.76-37.61 | | | | | |
| Share price at December 31 | | | 60.34 | | | | | | | | 48.52 | | | | | | | | 35.56 | | | | | | | | 37.90 | | | | | | | | 36.73 | | | | | |
| Capital expenditures | | | 79,398 | | | | | | | | 104,246 | | | | | | | | 103,806 | | | | | | | | 72,200 | | | | | | | | 55,823 | | | | | |
| Depreciation | | | 50,225 | | | | | | | | 50,716 | | | | | | | | 46,992 | | | | | | | | 44,771 | | | | | | | | 42,109 | | | | | |
| Amortization | | | 1,231 | | | | | | | | 1,300 | | | | | | | | 1,360 | | | | | | | | 1,328 | | | | | | | | 1,314 | | | | | |
| Total assets | | | 1,765,206 | | | | | | | | 1,870,734 | | | | | | | | 1,776,643 | | | | | | | | 1,654,164 | | | | | | | | 1,599,268 | | | | | |
| Long-term debt | | | 451,011 | | | | | | | | 348,124 | | | | | | | | 333,979 | | | | | | | | 312,422 | | | | | | | | 324,360 | | | | | |
| Total debt | | | 466,899 | | | | | | | | 355,174 | | | | | | | | 354,027 | | | | | | | | 335,396 | | | | | | | | 349,810 | | | | | |
| Shareholders’ equity | | | 1,046,935 | | | | | | | | 1,242,684 | | | | | | | | 1,153,898 | | | | | | | | 1,049,210 | | | | | | | | 983,785 | | | | | |
| Return on average shareholders’ equity | | | 6.4 | % | | | | | | | 9.5 | % | | | | | | | 11.3 | % | | | | | | | 11.4 | % | | | | | | | 11.6 | % | | | | |
| Total debt to total capital | | | 30.8 | % | | | | | | | 22.2 | % | | | | | | | 23.5 | % | | | | | | | 24.2 | % | | | | | | | 26.2 | % | | | | |
| Employees | | | 4,053 | | | | | | | | 4,130 | | | | | | | | 3,983 | | | | | | | | 3,887 | | | | | | | | 3,618 | | | | | |
The 2014 results include a charge of $90.6 million ($65.5 million after tax, or $1.34 per share) related to the 2014 Restructuring Plan related to eliminating underperforming operations, consolidating manufacturing facilities and improving efficiencies within the Company.
The 2013 results include a charge of $31.7 million ($22.0 million after tax, or $0.44 per share) related to the 2013 restructuring program related to the relocation of the Flavors & Fragrances Group headquarters to Chicago, as well as a profit improvement plan across all segments of the Company.
The 2011 results include a charge of $4.8 million ($3.7 million after tax, or $0.07 per share) related to the Company’s plan to improve the profitability and efficiency of selected operations. The 2011 results also include a gain of $3.6 million ($3.6 million after tax, or $0.07 per share) related to the revaluation of the Company’s non-controlling interest in a subsidiary.
The 2010 results include a credit of $1.5 million ($0.9 million after tax, or $0.02 per share) for additional insurance proceeds received on the 2009 environmental claims.
Directors & Officers B O A R D O F D I R E C T O R S Kenneth P. Manning, 73 Chairman Sensient Technologies Corporation Elected Director in 1989 (2, 6) Hank Brown, 75 President Emeritus University of Colorado Elected Director in 2004 (1, 4, 5) Joseph Carleone, Ph.D., 69 President and Chief Executive Officer American Pacific Corporation Elected Director in 2014 (1, 6) Edward H. Cichurski, 73 Retired, Former Partner PricewaterhouseCoopers Elected Director in 2013 (1, 3, 4, 5, 6) Fergus M. Clydesdale, Ph.D., 78 Distinguished Professor, Department of Food Science, and Director of the Food Science Policy Alliance at the University of Massachusetts – Amherst Elected Director in 1998 (1, 2, 3, 4, 6) James A.D. Croft, 77 Chairman Bartlodge Limited Elected Director in 1997 (1, 2, 3, 6) William V. Hickey, 70 Retired, Former President and Chief Executive Officer Sealed Air Corporation Elected Director in 1997 (1, 2, 4, 5) Paul Manning, 40 President and Chief Executive Officer Sensient Technologies Corporation Elected Director in 2012 (2, 5, 6) Deborah McKeithan-Gebhardt, 56 President and Chief Operating Officer Tamarack Petroleum Company, Inc. Elected Director in 2014 (6) Elaine R. Wedral, Ph.D., 70 Retired, Former President Nestle’s Research and Development Worldwide Food Service Systems Elected Director in 2006 and Lead Director in 2014 (3, 5, 6) Essie Whitelaw, 66 Retired, Former Senior Vice President, Operations Wisconsin Physician Services Elected Director in 1993 (3, 4, 6) E L E C T E D O F F I C E R S Paul Manning, 40 President and Chief Executive Officer With the Company 5 years John F. Collopy, 45 Vice President and Treasurer With the Company 15 years Christopher M. Daniels, 41 Vice President, Human Resources With the Company 15 years Michael C. Geraghty, 53 President, Color Group With the Company 3 years John L. Hammond, 68 Senior Vice President, General Counsel and Secretary With the Company 17 years Richard F. Hobbs, 67 Senior Vice President and Chief Financial Officer With the Company 41 years Jeffrey T. Makal, 51 Vice President, Controller and Chief Accounting Officer With the Company 18 years John J. Manning, 46 Vice President and Assistant General Counsel With the Company 2 years Stephen J. Rolfs, 50 Senior Vice President, Administration With the Company 17 years Robert J. Wilkins, 58 President, Asia Pacific Group With the Company 11 years A PPOIN T ED O F F ICERS Douglas L. Arnold, 51 Vice President, Administrative Services With the Company 17 years Sara Humphrey, 42 Vice President, Operations With the Company 16 years Leroy C. Watson, 41 Vice President, Taxation With the Company 9 years C O M M I T T E E S 1 Audit Committee 4 Nominating and Corporate Governance Committee 2 Executive Committee 5 Finance Committee 3 Compensation and Development Committee 6 Scientific Advisory Committee
Investor Information World Headquarters 777 East Wisconsin Avenue Milwaukee, Wisconsin 53202-5304 (414) 271-6755 (800) 558-9892 Fax: (414) 347-4788 E-mail: corporate.communications@sensient.com Web site: www.sensient.com Transfer Agent and Registrar Wells Fargo Bank Minnesota, N.A. Shareowner Services P. O. Box 64854 St. Paul, Minnesota 55164-0854 (800) 468-9716 Web site: www.wellsfargo.com/shareownerservices Common Stock Sensient Technologies Corporation Common Stock is traded on the New York Stock Exchange. Ticker symbol: SXT. There were 2,564 shareholders of record of Common Stock as of January 31, 2015. Annual Meeting of Shareholders The Annual Meeting of Shareholders is scheduled to be held at 2:00 p.m. (CDT) on Thursday, April 23, 2015, at Trump International Hotel, 401 N. Wabash Avenue, Chicago, Illinois. Annual Report and Proxy Statement The Company’s annual report and proxy statement are available online at http://investor.sensient.com. Form 10-K The Company’s Annual Report on Form 10-K for the year ended December 31, 2014 has been filed with the Securities and Exchange Commission and is available without charge from the Company’s Investor Relations Department and on its web site at www.sensient.com. In accordance with New York Stock Exchange rules and pursuant to Rule 13a-14 under the Securities Exchange Act of 1934, Paul Manning, as the Company’s Chief Executive Officer, and Stephen J. Rolfs, as the Company’s Chief Financial Officer, have certified the quality of the Company’s public disclosure in an exhibit to the Company’s Annual Report on Form 10-K for the year ended December 31, 2014. Dividends Quarterly dividends are typically paid on the first business day of March, June, September and December. Automatic Dividend Reinvestment Plan The Sensient Technologies Corporation Dividend Reinvestment Plan provides shareholders with a convenient, economical way to increase their ownership of Sensient Technologies Corporation Common Stock. Through the plan, shareholders can automatically reinvest their dividends to acquire additional shares and make supplemental stock purchases without paying fees or commissions. An enrollment form and brochure describing the plan can be obtained by contacting the plan administrator, Wells Fargo Bank Minnesota, N.A. at (800) 468-9716, or the Company’s Investor Relations Department at (414) 347-3827. Investor Relations Communications concerning the transfer of shares, lost certificates, duplicate mailings or change of address should be directed to the transfer agent. Other shareholder information, such as news releases and information regarding corporate governance, is available on the Company’s web site: www.sensient.com. Shareholders can also register to receive notification via e-mail when new information is added to the site. The Company’s web address is provided as an inactive textual reference only, and the contents of the web site are not incorporated in or otherwise to be regarded as part of this annual report. Other requests for information should be directed to the Company’s Investor Relations Department at (414) 347-3827.

777 East Wisconsin Avenue Milwaukee, WI 53202-5304 www.sensient.com