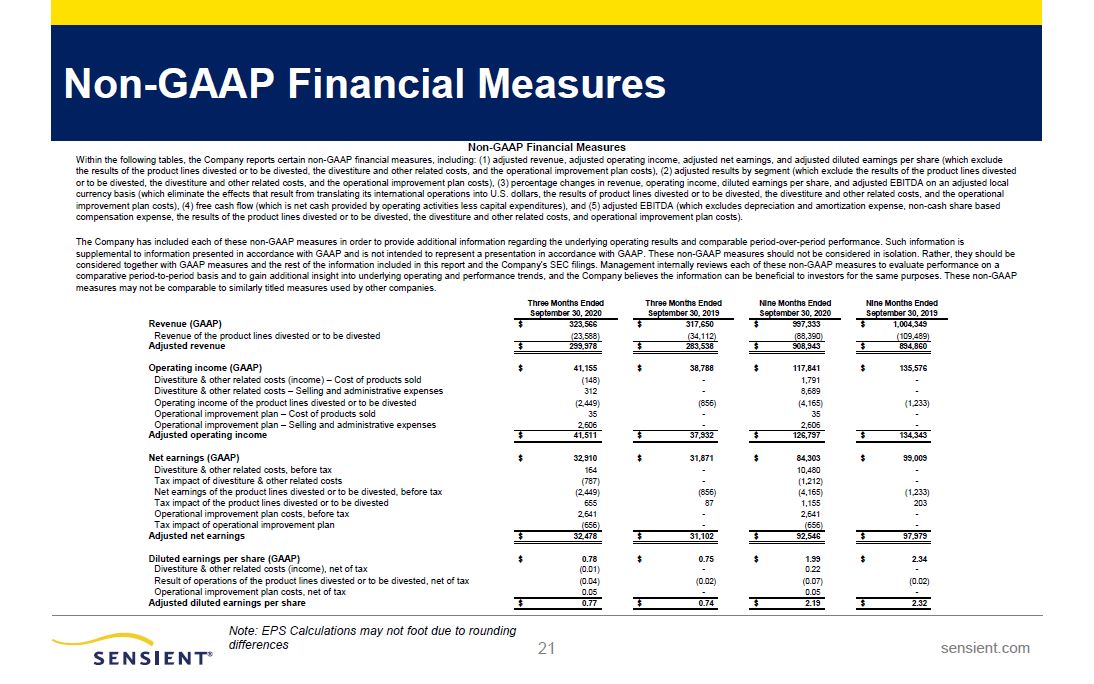
21 sensient.com Non-GAAP Financial Measures Note: EPS Calculations may not foot due to rounding differences Non-GAAP Financial MeasuresWithin the following tables, the Company reports certain non-GAAP financial measures, including: (1) adjusted revenue, adjusted operating income, adjusted net earnings, and adjusted diluted earnings per share (which exclude the results of the product lines divested or to be divested, the divestiture and other related costs, and the operational improvement plan costs), (2) adjusted results by segment (which exclude the results of the product lines divested or to be divested, the divestiture and other related costs, and the operational improvement plan costs), (3) percentage changes in revenue, operating income, diluted earnings per share, and adjusted EBITDA on an adjusted local currency basis (which eliminate the effects that result from translating its international operations into U.S. dollars, the results of product lines divested or to be divested, the divestiture and other related costs, and the operational improvement plan costs), (4) free cash flow (which is net cash provided by operating activities less capital expenditures), and (5) adjusted EBITDA (which excludes depreciation and amortization expense, non-cash share based compensation expense, the results of the product lines divested or to be divested, the divestiture and other related costs, and operational improvement plan costs).The Company has included each of these non-GAAP measures in order to provide additional information regarding the underlying operating results and comparable period-over-period performance. Such information is supplemental to information presented in accordance with GAAP and is not intended to represent a presentation in accordance with GAAP. These non-GAAP measures should not be considered in isolation. Rather, they should be considered together with GAAP measures and the rest of the information included in this report and the Company’s SEC filings. Management internally reviews each of these non-GAAP measures to evaluate performance on a comparative period-to-period basis and to gain additional insight into underlying operating and performance trends, and the Company believes the information can be beneficial to investors for the same purposes. These non-GAAP measures may not be comparable to similarly titled measures used by other companies. Three Months Ended Three Months Ended Nine Months Ended Nine Months Ended September 30, 2020 September 30, 2019 September 30, 2020 September 30, 2019 Revenue (GAAP) $ 323,566 $ 317,650 $ 997,333 $ 1,004,349 Revenue of the product lines divested or to be divested (23,588) (34,112) (88,390) (109,489) Adjusted revenue $ 299,978 $ 283,538 $ 908,943 $ 894,860 Operating income (GAAP) $ 41,155 $ 38,788 $ 117,841 $ 135,576 Divestiture & other related costs (income) – Cost of products sold (148) - 1,791 - Divestiture & other related costs – Selling and administrative expenses 312 - 8,689 - Operating income of the product lines divested or to be divested (2,449) (856) (4,165) (1,233) Operational improvement plan – Cost of products sold 35 - 35 - Operational improvement plan – Selling and administrative expenses 2,606 - 2,606 - Adjusted operating income $ 41,511 $ 37,932 $ 126,797 $ 134,343 Net earnings (GAAP) $ 32,910 $ 31,871 $ 84,303 $ 99,009 Divestiture & other related costs, before tax 164 - 10,480 - Tax impact of divestiture & other related costs (787) - (1,212) - Net earnings of the product lines divested or to be divested, before tax (2,449) (856) (4,165) (1,233) Tax impact of the product lines divested or to be divested 655 87 1,155 203 Operational improvement plan costs, before tax 2,641 - 2,641 - Tax impact of operational improvement plan (656) - (656) - Adjusted net earnings $ 32,478 $ 31,102 $ 92,546 $ 97,979 Diluted earnings per share (GAAP) $ 0.78 $ 0.75 $ 1.99 $ 2.34 Divestiture & other related costs (income), net of tax (0.01) - 0.22 - Result of operations of the product lines divested or to be divested, net of tax (0.04) (0.02) (0.07) (0.02) Operational improvement plan costs, net of tax 0.05 - 0.05 - Adjusted diluted earnings per share $ 0.77 $ 0.74 $ 2.19 $ 2.32