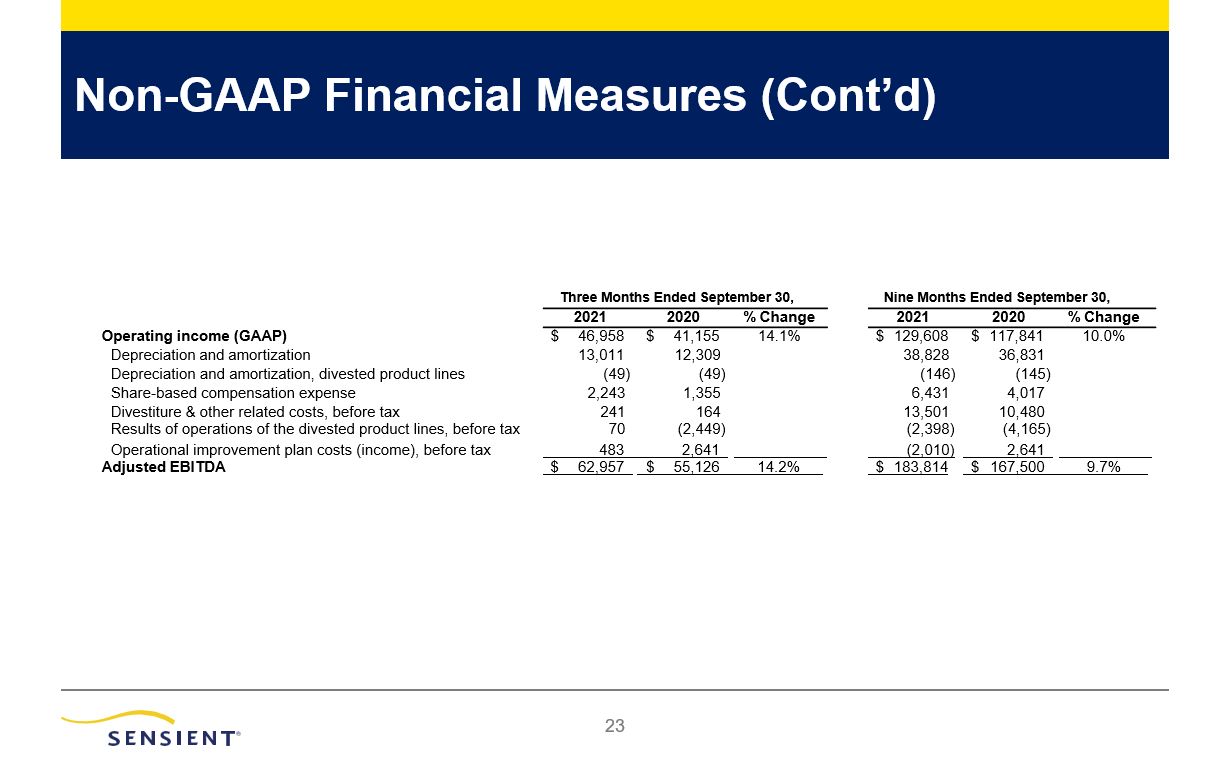
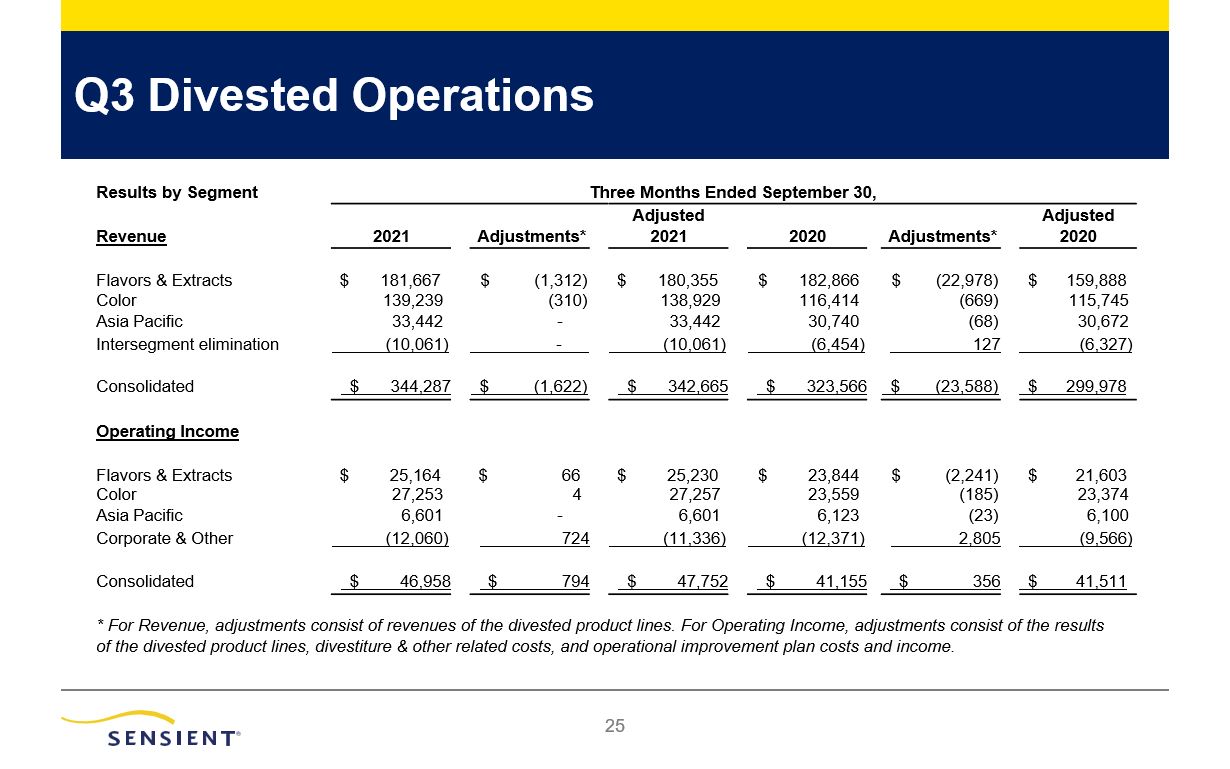
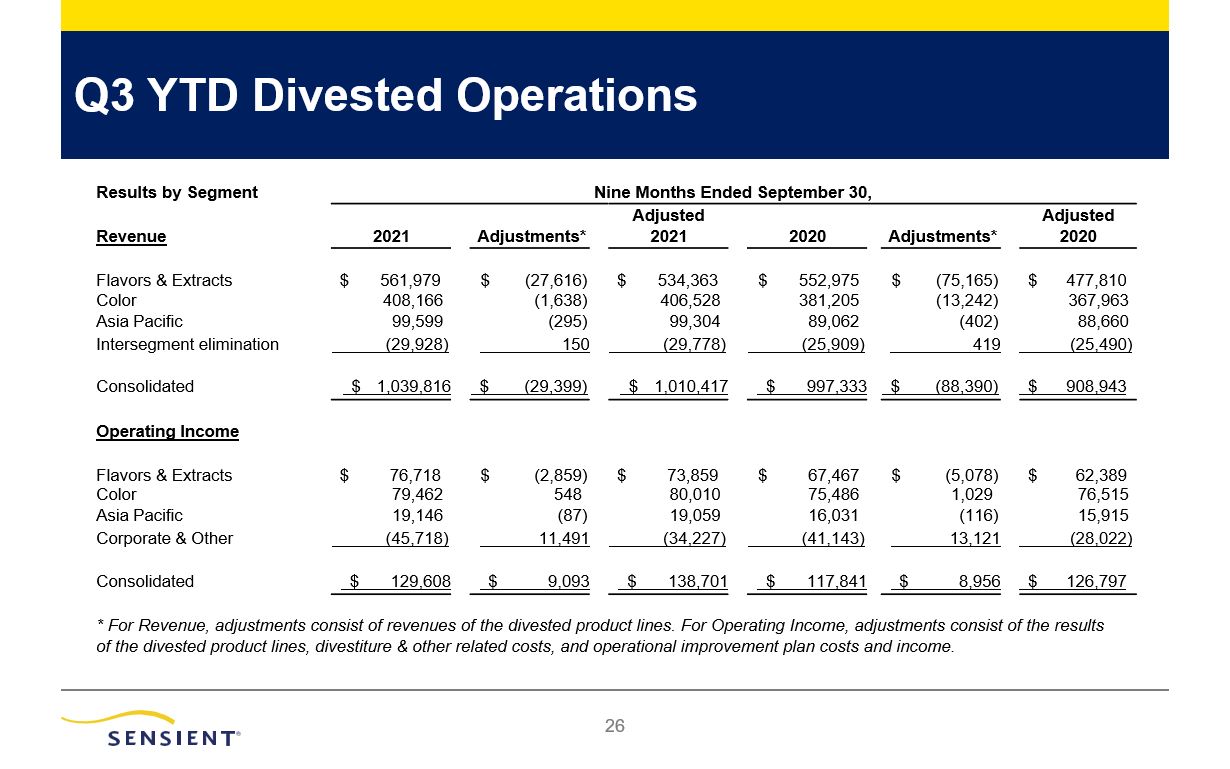
21 Non-GAAP Financial Measures Note: EPS Calculations may not foot due to roundingdifferences Three Months EndedSeptember 30, 2021 Three Months EndedSeptember 30, 2020 Nine Months EndedSeptember 30, 2021 Nine Months EndedSeptember 30, 2020 Revenue (GAAP) $ 344,287 $ 323,566 $ 1,039,816 $ 997,333 Revenue of the divested product lines (1,622) (23,588) (29,399) (88,390) Adjusted revenue $ 342,665 $ 299,978 $ 1,010,417 $ 908,943 Operating income (GAAP) $ 46,958 $ 41,155 $ 129,608 $ 117,841 Divestiture & other related costs (income) – Cost of products sold - (148) 28 1,791 Divestiture & other related costs – Selling and administrative expenses 241 312 13,473 8,689 Operating loss (income) of the divested product lines 70 (2,449) (2,398) (4,165) Operational improvement plan - Cost of products sold - 35 - 35 Operational improvement plan - Selling and administrative expenses (income) 483 2,606 (2,010) 2,606 Adjusted operating income $ 47,752 $ 41,511 $ 138,701 $ 126,797 Net earnings (GAAP) $ 33,912 $ 32,910 $ 91,516 $ 84,303 Divestiture & other related costs, before tax 241 164 13,501 10,480 Tax impact of divestiture & other related costs 1,179 (787) 283 (1,212) Net loss (earnings) of the divested product lines, before tax 70 (2,449) (2,398) (4,165) Tax impact of the divested product lines (18) 655 590 1,155 Operational improvement plan costs (income), before tax 483 2,641 (2,010) 2,641 Tax impact of operational improvement plan (115) (656) 44 (656) Adjusted net earnings $ 35,752 $ 32,478 $ 101,526 $ 92,546 Diluted earnings per share (GAAP) $ 0.80 $ 0.78 $ 2.16 $ 1.99 Divestiture & other related costs (income), net of tax 0.03 (0.01) 0.33 0.22 Results of operations of the divested product lines, net of tax 0.00 (0.04) (0.04) (0.07) Operational improvement plan costs (income), net of tax 0.01 0.05 (0.05) 0.05 Adjusted diluted earnings per share $ 0.85 $ 0.77 $ 2.40 $ 2.19