Exhibit 99.1
Sidoti Investor Conference September 21, 2022
FORWARD-LOOKING STATEMENTS 2 This document contains statements that may constitute “forward-looking statements” within the meaning of Federal securities laws. Such forward-looking statements are not guarantees of future performance and involve known and unknown risks, uncertainties and other factors concerning the Company’s operations and business environment. Important factors that could cause actual results to differ materially from those sugges ted by these forward-looking statements and that could adversely affect the Company’s future financial performance include the following: the impact and uncertainty created by the ongoing COVID-19 pandemic, including, but not limited to, its effects on our employees, facilities, customers, and suppliers, the availability and cost of raw materials, energy, and other supplies, the availability and cost of labor, logistics, and transportation, governmental regulations and restrictions, and general economic conditions, including inflation; the uncertain impacts of the ongoing conflict between Russia and Ukraine on our supply chain, input costs, including energy and transportation, and on general economic conditions; the pace and nature of new product introductions by the Company and the Company’s customers; the Company’s ability to anticipate and respond to changing consumer preferences and changing technologies; the Company’s ability to successfully implement its growth strategies; the outcome of the Company’s various productivity-improvement and cost-reduction efforts, acquisition and divestiture activities, and operational improvement plan; changes in costs of raw materials, including energy; industry, regulatory, legal, and economic factors related to the Company’s domestic and international business; the effects of tariffs, trade barriers, and disputes; growth in markets for products in which the Company competes; industry and customer acceptance of price increases; actions by competitors; currency exchange rate fluctuations; and other factors included in “Risk Factors” in the Company's Annual Report on Form 10-K for the year ended December 31, 2021, as updated and supplemented by the Company’s Quarterly Report on Form 10-Q for the quarter ended March 31, 2022, and in other documents that the Company files with the SEC. The risks and uncertainties identified above are not the only risks the Company faces. Additional risks and uncertainties not presently known to the Company or that it currently believes to be immaterial also may adversely affect the Company. Should any known or unknown risks and uncertainties develop into actual events, these developments could have material adverse effects on our business, financial condition, and results of operations. This presentation contains time-sensitive information that reflects management’s best analysis only as of the date of this presentation. Except to the extent required by applicable laws, the Company does not undertake to publicly update or revise its forward-looking statements even if experience or future changes make it clear that any projected results expressed or implied herein will not be realized.
NON-GAAP FINANCIAL MEASURES 2 Within this document, the Company reports certain non-GAAP financial measures, including: (1) adjusted revenue, adjusted operating income, and adjusted operating margin (which exclude divestiture & other related costs, the results of the divested product lines, and restructuring and other costs, which include operational improvement plan costs and income), (2) adjusted results by segment (which exclude divestiture & other related costs, operational improvement plan costs and income, and the results of the divested operations), and (3) percentage changes in revenue on an adjusted local currency basis (which eliminate the effects that result from translating its international operations into U.S. dollars and revenue of the divested product lines). The Company has included each of these non-GAAP measures in order to provide additional information regarding the underlying operating results and comparable period-over- period performance. Such information is supplemental to information presented in accordance with GAAP and is not intended to represent a presentation in accordance with GAAP. These non-GAAP measures should not be considered in isolation. Rather, they should be considered together with GAAP measures and the rest of the information included in this presentation and the Company’s SEC filings. Management internally reviews each of these non-GAAP measures to evaluate performance on a comparative period-to-period basis and to gain additional insight into underlying operating and performance trends. The Company believes this information can be beneficial to investors for these same purposes. These non-GAAP measures may not be comparable to similarly titled measures used by other companies. Refer to “Non-GAAP Financial Measures” at the end of this presentation for reconciliations and additional information.
Sensient Technologies Corporation 2 Provider of customized solutions for the food and beverage, pharmaceutical, and personal care markets Global market leader offering an extensive portfolio of flavor and color technology platforms and solutions Exceptional innovation & applications expertise with unique ability to service global, regional, and local customers Technically-driven products deliver high impact relative to cost
5 Flavors & Extracts Group 2021 Revenue: $739M 2021 Adj. Revenue*: $712M (+9.4% vs. 2020) Core Areas of Focus: Flavors & Extracts, Natural Ingredients, and Other Flavor Ingredients Color Group 2021 Revenue: $545M 2021 Adj. Revenue*: $543M (+9.4% vs. 2020) Core Areas of Focus: Food & Beverage Colors, Pharmaceuticals, Natural Extracts, and Personal Care Asia Pacific Group 2021 Revenue: $135M 2021 Adj. Revenue*: $135M (+10.1% vs. 2020) Core Areas of Focus: Flavors and Colors for food and beverage Group Overview *2021 Global Revenues include intercompany sales which are eliminated on a consolidated basis. Adj. Revenue is a Non-GAAP metric, please see our GAAP to Non-GAAP Reconciliation at the end of this document.
Flavors & Extracts Capabilities 6 Unique ability to service global, regional, and local customers Broad product offering includes flavors, extracts, taste modulation, and natural ingredients (onion, garlic, capsicums) Leading flavor masking technologies Strong innovation and application capabilities
Color Capabilities 6 Leader in natural color technologies that improve product performance and stability Strong innovation and applications expertise Extensive range of extraction technologies and expanding agronomy capabilities Pharmaceutical business provides unique solutions with colors, flavors, coatings, and extracts Personal care business recognized for innovative, functional products and ingredients for use in color cosmetics, hair care, and skin care
8 Financial Performance * Adjusted operating income and adjusted operating margin are Non-GAAP metrics. Please see our GAAP to Non-GAAP Reconciliation at the end of this document. DOLLARS IN MILLIONS DOLLARS IN MILLIONS DOLLARS IN MILLIONS DOLLARS IN MILLIONS
Capital Allocation Prioritize ROI capital projects Maintain financial flexibility to pursue M&A Dividend payout increased 5.1% in 2021 Excess capital returned to shareholders through opportunistic share repurchases $87 $77 $43 $54 $57 $62 $66 $67 $56 $51 $39 $52 $61 $31 $14 $9 $87 $118 $- $50 $100 $150 $200 $250 2017 2018 2019 2020 2021 DOLLARS IN MILLIONS Share Repurchase Acquisitions Dividends Debt Repayments Capital Expenditures 10
Why Invest? 10 Strong competitive position ‘Sticky’ business (& low portion of customer costs) Global presence Exposure to stable and growing markets Focused on improving returns and on growth
APPENDIX *Amounts in thousands, except percentages
Non-GAAP Financial Measures 15 Revenue Total Foreign Exchange Rates Adjustments* Adjusted Local Currency Flavors & Extracts (0.4%) 1.6% (11.4%) 9.4% Color 8.8% 2.1% (2.7%) 9.4% Asia Pacific 11.6% 1.7% (0.2%) 10.1% Total Revenue 3.6% 1.8% (7.3%) 9.1% Year Ended December 31, 2021 *Revenue adjustments consist of revenue of the divested product lines.
Non-GAAP Financial Measures (Cont’d) Year Ended December 31, 2021 2020 2019 Revenue (GAAP) $ 1,380,264 $ 1,332,001 $ 1,322,934 Revenue of the divested product lines (30,062) (113,553) (143,172) Adjusted revenue $ 1,350,202 $ 1,218,448 $ 1,179,762 Operating income (GAAP) $ 170,028 $ 152,656 $ 121,110 Divestiture & other related costs (income) – Cost of products sold 86 1,795 10,567 Divestiture & other related costs – Selling and administrative expenses 14,052 10,360 35,313 Operating loss (income) of the divested product lines (1,880) (7,580) (1,978) Operational improvement plan - Cost of products sold - 35 - Operational improvement plan - Selling and administrative expenses (income) (1,895) 3,304 - COVID-19 employee payment - Cost of products sold - 1,036 - COVID-19 employee payment - Selling and administrative expenses - 1,986 - Adjusted operating income $ 180,391 $ 163,592 $ 165,012 15
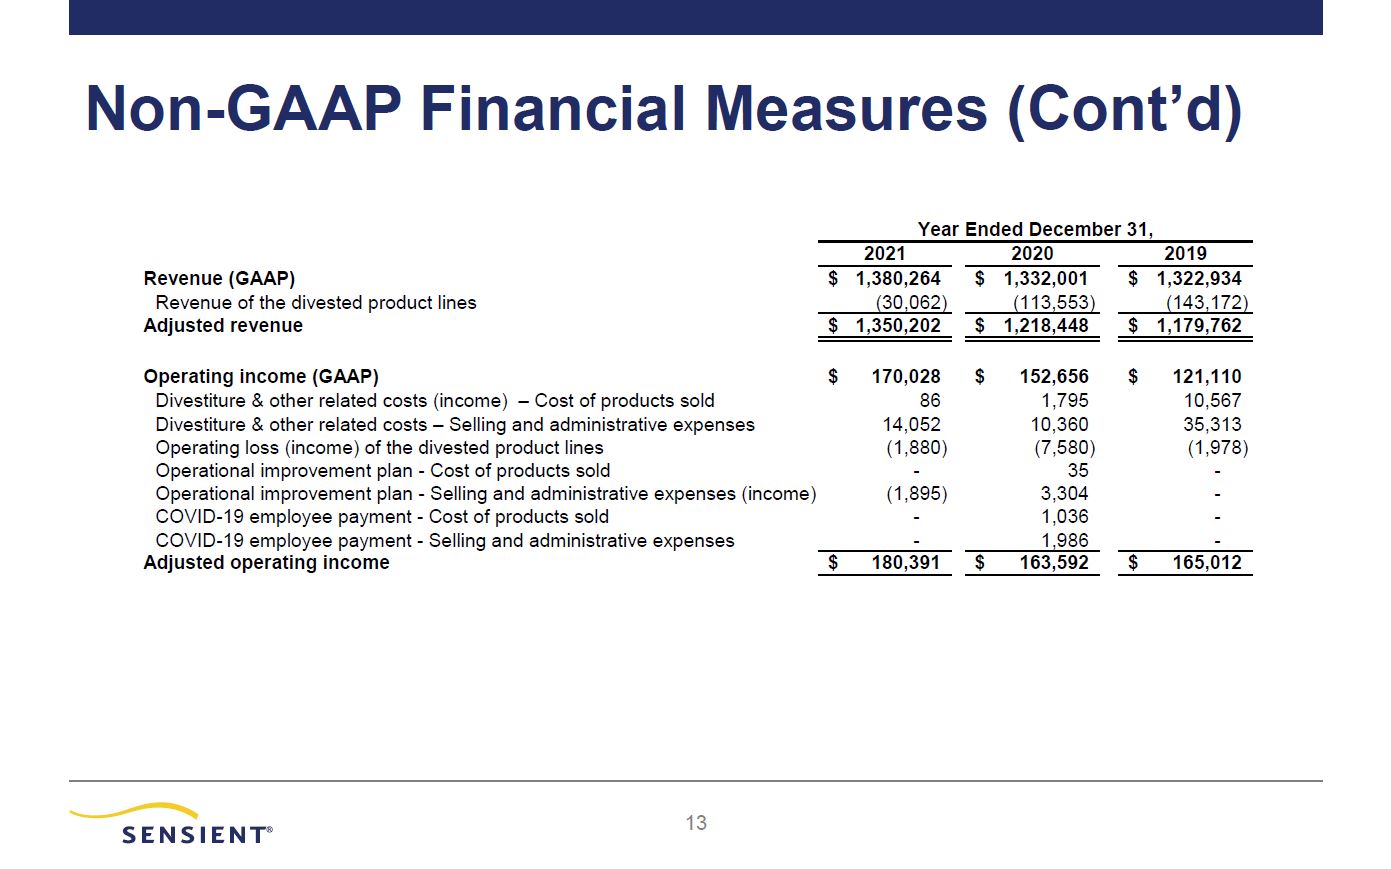
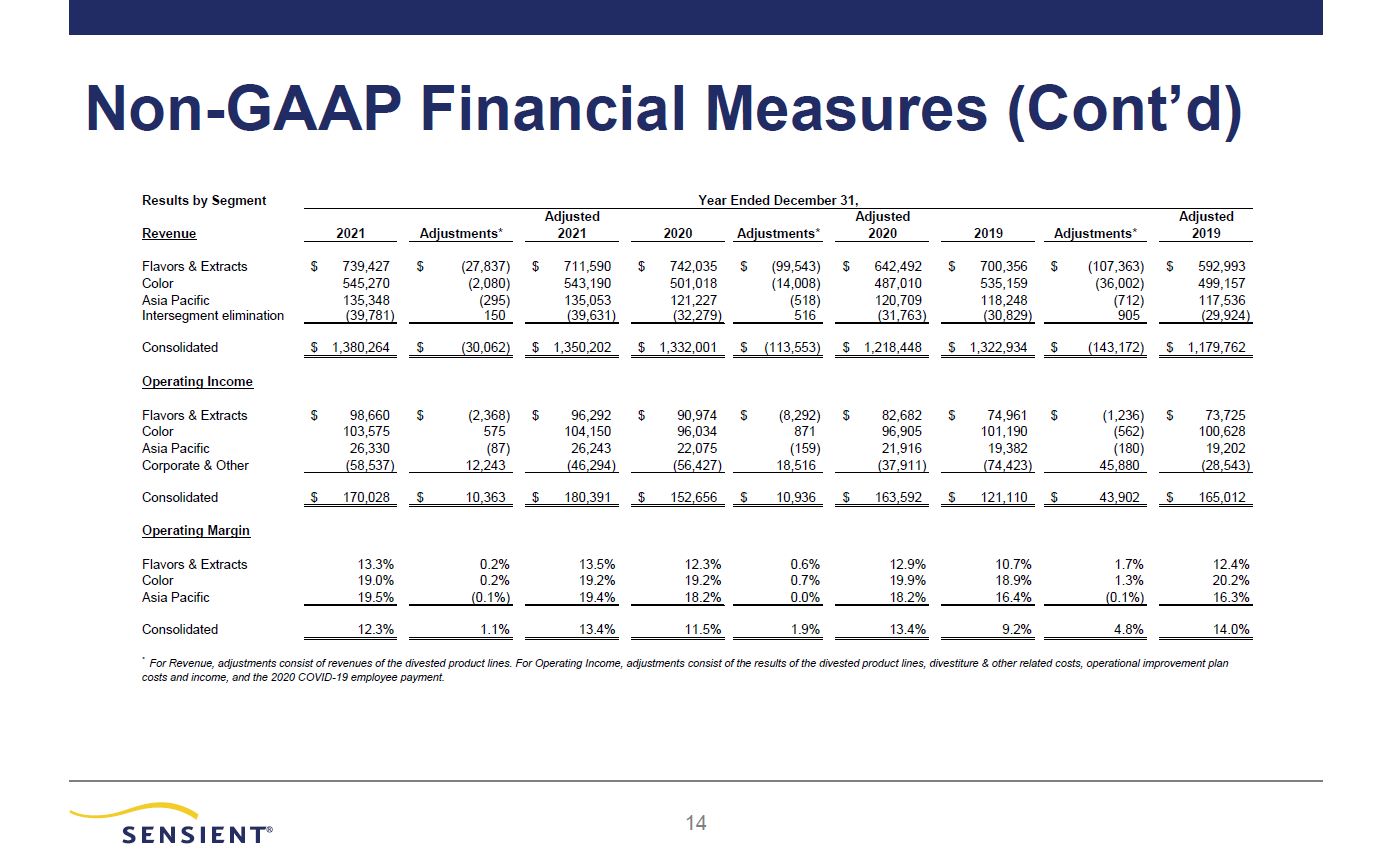
Non-GAAP Financial Measures (Cont’d) Results by Segment Year Ended December 31, * For Revenue, adjustments consist of revenues of the divested product lines. For Operating Income, adjustments consist of the results of the divested product lines, divestiture & other related costs, operational improvement plan costs and income, and the 2020 COVID-19 employee payment. Adjusted Adjusted Adjusted Revenue 2021 Adjustments* 2021 2020 Adjustments* 2020 2019 Adjustments* 2019 Flavors & Extracts $ 739,427 $ (27,837) $ 711,590 $ 742,035 $ (99,543) $ 642,492 $ 700,356 $ (107,363) $ 592,993 Color 545,270 (2,080) 543,190 501,018 (14,008) 487,010 535,159 (36,002) 499,157 Asia Pacific 135,348 (295) 135,053 121,227 (518) 120,709 118,248 (712) 117,536 Intersegment elimination (39,781) 150 (39,631) (32,279) 516 (31,763) (30,829) 905 (29,924) Consolidated $ 1,380,264 $ (30,062) $ 1,350,202 $ 1,332,001 $ (113,553) $ 1,218,448 $ 1,322,934 $ (143,172) $ 1,179,762 Operating Income Flavors & Extracts $ 98,660 $ (2,368) $ 96,292 $ 90,974 $ (8,292) $ 82,682 $ 74,961 $ (1,236) $ 73,725 Color 103,575 575 104,150 96,034 871 96,905 101,190 (562) 100,628 Asia Pacific 26,330 (87) 26,243 22,075 (159) 21,916 19,382 (180) 19,202 Corporate & Other (58,537) 12,243 (46,294) (56,427) 18,516 (37,911) (74,423) 45,880 (28,543) Consolidated $ 170,028 $ 10,363 $ 180,391 $ 152,656 $ 10,936 $ 163,592 $ 121,110 $ 43,902 $ 165,012 Operating Margin Flavors & Extracts 13.3% 0.2% 13.5% 12.3% 0.6% 12.9% 10.7% 1.7% 12.4% Color 19.0% 0.2% 19.2% 19.2% 0.7% 19.9% 18.9% 1.3% 20.2% Asia Pacific 19.5% (0.1%) 19.4% 18.2% 0.0% 18.2% 16.4% (0.1%) 16.3% Consolidated 12.3% 1.1% 13.4% 11.5% 1.9% 13.4% 9.2% 4.8% 14.0% 15
15