Exhibit 13.1
MANAGEMENT’S DISCUSSION AND ANALYSIS of operations & financial condition
| • | overview |
During 2003, Sensient Technologies Corporation (the “Company”) focused primarily on growing and improving its existing businesses and on integrating its recent acquisitions. The Company reported record levels of revenue and earnings per share. On April 24, 2003, the Company announced an increase in the quarterly cash dividend paid on its common stock from 14 cents per share to 15 cents per share. This was the second dividend increase since September 2002.
Sensient Technologies Corporation responded to difficult challenges within its markets during 2003. For much of the year, the Company continued to face soft customer demand for its food and beverage flavors and colors. These conditions particularly impacted the synthetic color product lines, which also faced increased competitive pressures. The Company’s diversified product lines provided solid growth in other areas, such as cosmetic colors and natural food and beverage colors.
In the fourth quarter of 2003, the Company implemented a number of specific initiatives to improve profitability and growth opportunities within its businesses, particularly within the Color Group. These initiatives will deliver annualized pre-tax savings of approximately $10 million, beginning in 2004. These initiatives resulted in special fourth quarter charges of $6.5 million ($4.7 million after-tax, $0.10 per share). The charges include $4.0 million of cash expenditures for severance and other employee separation costs associated with a work-force reduction of approximately 165 employees and $2.5 million of non-cash costs related to asset impairment charges. The Company has spent $1.2 million through December 31, 2003, and expects to spend the remainder in 2004.
The Company also took actions during the fourth quarter of 2003 to significantly reduce its liabilities for certain postretirement benefit programs. In the future, the Company will no longer subsidize the cost of health care coverage offered to retirees. As a result of this change in benefits, the Company recognized a one-time, non-cash credit of $13.3 million ($8.2 million after-tax, $0.17 per share).
During 2003, the Company substantially completed projects to upgrade several of its flavor and color facilities. In addition, the Company completed the integration of two recent acquisitions. As a result of these projects, capital expenditures in 2003 increased to $74.2 million, compared to $47.3 million during 2002. The completion of these projects will allow the Company to realize cost efficiencies, and it will also improve the Company’s ability to win new business.
The Company achieved operating income in 2003 of $137.5 million, which included the postretirement credit and special charges, compared to operating income of $146.5 million in 2002. Earnings of $81.4 million in 2003 were slightly above 2002 earnings of $80.7 million. Diluted earnings per share were $1.73 in 2003, an increase over 2002 diluted earnings per share of $1.69.
| • | results of operations |
2003 vs. 2002
Revenue for 2003 was $987.4 million, an increase of $47.5 million, or 5.1%, over 2002. The Color Group increased revenue by $14.4 million, or 4.2%, over 2002, to $360.9 million for 2003. Revenue for the Flavors & Fragrances Group increased by $22.5 million, or 3.9%, over 2002, to $594.7 million for 2003. Asia Pacific increased revenue by 10.4%. Favorable foreign exchange rates and acquisitions resulted in a 5.2% and 1.5% increase in revenue, respectively. Excluding exchange rates and acquisitions, revenue decreased 1.6% or $17.6 million primarily as a result of lower sales in North America and Europe of flavors as well as synthetic food and beverage colors. Additional information on group results can be found in the Segment Information section.
Gross profit for 2003 was $312.0 million, an increase of $5.1 million, or 1.7%, over 2002. The Company’s gross margin decreased 110 basis points to 31.6%, versus 32.7% in 2002, primarily as a result of lower pricing in synthetic food and beverage colors, dehydrated flavors and inkjet ink products.
Selling and administrative expenses were $168.0 million in 2003, a net increase of $7.6 million versus $160.4 million

| 15 | SENSIENT 2003 annual report |
MANAGEMENT’S DISCUSSION AND ANALYSIS of operations & financial condition
in 2002. The primary reason for the increase in selling and administrative expenses was the weakening dollar, which added approximately $8.9 million in expenses from foreign operations during the year. Expenses related to personnel changes and additions to manage the expanded size and scope of the Company’s businesses also added $6.9 million of selling and administrative expense. These increases were partially offset by the postretirement credit of $13.3 million. For the year, selling and administrative expenses as a percent of revenue decreased to 17.0%, versus 17.1% in 2002.
Operating income in 2003 was $137.5 million compared to $146.5 million in 2002, a decrease of $9.0 million. Operating income declined approximately $13 million from the lower pricing in the colors and dehydrated flavors businesses and $6.5 million from special charges. These declines were partially offset by the postretirement credit of $13.3 million.
Interest expense decreased slightly to $29.1 million from $29.5 million in 2002. The decrease was primarily the result of lower interest rates.
The effective income tax rate was 24.8% and 31.0% in 2003 and 2002, respectively. The effective tax rates for both 2003 and 2002 were reduced as a result of favorable settlements of certain prior year tax matters and other adjustments. The effective tax rate for 2003 also included a benefit from the planned utilization of certain foreign tax losses. These one-time benefits reduced the effective tax rate for 2003 and 2002 by 6.2% and 0.8%, respectively.
| 2003 | 2002 | |||||
Reported effective tax rate | 24.8 | % | 31.0 | % | ||
One-time adjustments | 6.2 | 0.8 | ||||
Rate excluding adjustments | 31.0 | % | 31.8 | % | ||
The effective tax rate for 2004 is expected to be approximately 31.0%.
Earnings were $81.4 million, or $1.73 per share diluted, in 2003, compared to $80.7 million, or $1.69 per share diluted, in 2002.
SEGMENT INFORMATION
Color - For the year ended December 31, 2003, revenue for the Color Group increased by $14.4 million, or 4.2%, to $360.9 million. Favorable foreign exchange rates and acquisitions resulted in a 4.7% and 3.0% increase in revenue, respectively. Excluding exchange rates and acquisitions, revenue decreased 3.5% or $12.2 million, primarily as a result of lower sales of synthetic food and beverage colors in North America and Europe ($9.8 million and $7.2 million, respectively), partially offset by increased sales in Latin America ($4.9 million). Sales of synthetic food and beverage colors declined because of lower volumes and prices attributable to increased competition. Customer demand for these products was also lower due to a reduction in new product introductions by customers and a soft economic environment. Gross profit margin was 37.2%, a 210 basis point decrease from Color’s 39.3% gross margin last year. This change is a result of more competitive pricing in synthetic colors and in inkjet inks. Operating income for 2003 was $71.6 million versus $80.7 million for 2002. Excluding the favorable effect of exchange rates ($3.8 million) and acquisitions ($2.2 million), the $15.1 million decrease in operating income was the result of lower sales of food and beverage colors in North America and Europe ($7.3 million and $1.6 million, respectively) and lower margins from the paper/industrial colors business ($5.5 million). These lower margins were partly attributable to manufacturing inefficiencies in consolidating operations. Operating income as a percent of revenue was 19.8%, a decrease of 350 basis points from the comparable period last year. This change is primarily a result of the reasons provided above.
Flavors & Fragrances - For the year ended December 31, 2003, the Flavors & Fragrances Group reported a 3.9% increase in revenue, to $594.7 million. Favorable foreign exchange rates and acquisitions resulted in a 5.6% and 0.6% increase in revenue, respectively. Excluding exchange rates and acquisitions, revenue decreased 2.3%, or $13.0 million, primarily as a result of soft demand for flavors in the U.S. and Europe ($13.1 million and $1.7 million, respectively), which was partially offset by higher sales in Canada ($1.5 million). Gross profit margin was 26.6%, a 50 basis point decrease from the 27.1% gross margin last year. This change is a result of more competitive pricing in the dehydrated flavors business. Operating income for 2003 was $83.8 million, compared to $85.5 million last year. Favorable foreign exchange rates and acquisitions resulted in a 5.2% and 0.8%

SENSIENT 2003 annual report | 16 |
increase in operating income, respectively. Excluding the effect of exchange rates ($4.5 million) and acquisitions ($0.6 million), the $6.9 million decrease was primarily attributable to a shift in product mix in Latin America ($2.0 million), higher overall group expenses related to personnel changes ($1.7 million) and lower sales of flavors in the U.S. and Europe. Operating income as a percent of revenue was 14.1%, a decrease of 80 basis points from last year. This change is primarily a result of the reasons provided above.
2002 vs. 2001 – CONTINUING OPERATIONS
Revenue from continuing operations for 2002 was $939.9 million, an increase of $123.0 million, or 15.0%, over 2001. The Color Group increased revenue by $70.5 million, or 25.5% over 2001, to $346.5 million for 2002 as a result of the recently acquired technical color businesses. Revenue was relatively unchanged in the existing businesses, as the combined growth of $6.0 million in the pharmaceutical, cosmetic and natural color product lines was offset by lower sales of synthetic color systems to food and beverage customers. Revenue for the Flavors & Fragrances Group increased by $46.5 million, or 8.8%, over 2001, to $572.2 million for 2002. Approximately 70% of the increased revenue came from existing businesses, as revenue grew in all major categories. The March 2002 acquisition of the flavors and essential oils operations of C. Melchers GmbH & Company accounted for the remaining portion of the increase.
Gross profit for 2002 was $306.9 million, an increase of $40.3 million, or 15.1%, over 2001. The Color Group increased gross profit 29.3%, to $136.1 million in 2002, primarily as a result of recently acquired businesses. Gross profit for the Flavors & Fragrances Group increased 6.1%, to $155.1 million in 2002. In addition to higher revenue, Flavors & Fragrances gross profit benefited from $5.5 million of cost savings, offset by higher raw material costs. The Company’s gross margin was 32.7% and 32.6% for 2002 and 2001, respectively. The Color Group increased its gross margin 120 basis points, to 39.3% of revenue, primarily as a result of recently acquired higher-margin businesses. The Flavors & Fragrances Group gross margin decreased 70 basis points, to 27.1% of revenue, which resulted primarily from increased material costs.
Selling and administrative expenses were $160.4 million in 2002, a 10.5% increase over 2001. The primary reason for the increase in selling and administrative expenses was the acquired businesses, which added $16.3 million of expense. Higher employee benefit expense also contributed $5.8 million of additional selling and administrative expense. These increases were offset by the mandatory adoption of Statement of Financial Accounting Standards (“SFAS”) No. 142, “Goodwill and Other Intangible Assets,” which reduced selling and administrative expenses by $8.9 million. For the year, selling and administrative expenses as a percent of revenue decreased to 17.1% versus 17.8% in 2001.
Operating income was $146.5 million, compared to $121.5 million in 2001, an increase of 20.6%. The adoption of SFAS No. 142 increased operating income by $8.9 million or 8.3%. The remaining $16.1 million increase in operating income, or 12.3%, was driven by realized cost savings of $10.5 million and revenue growth. The impact of exchange rates on earnings for the year was minimal.
Interest expense decreased $2.0 million to $29.5 million in 2002. The decrease was primarily the result of lower interest rates.
The effective income tax rate on continuing operations was 31.0% in 2002. The 2002 tax rate was reduced by 0.8% as a result of the expected settlement of certain tax liabilities. The effective tax rate was 27.8% in 2001. The 2001 tax rate was reduced by 5.4% as a result of the expected settlement of certain tax liabilities and an adjustment of the valuation allowance made possible by the ability to utilize state and foreign net operating loss carryforwards. Had SFAS No. 142 been adopted in 2001, the 2001 effective tax rate would have been reduced by 1.6%.
| 2002 | 2001 | |||||
Reported effective tax rate | 31.0 | % | 27.8 | % | ||
Adjustments | 0.8 | 5.4 | ||||
Impact of SFAS No. 142 | — | (1.6 | ) | |||
Rate excluding adjustments | 31.8 | % | 31.6 | % | ||
Earnings from continuing operations were $80.7 million, or $1.69 per share diluted, in 2002 compared to $65.0 million,

| 17 | SENSIENT 2003 annual report |
MANAGEMENT’S DISCUSSION AND ANALYSIS of operations & financial condition
or $1.36 per share diluted, in 2001. Diluted earnings per share from continuing operations in 2002 included a benefit of $0.17 from the required adoption of SFAS No. 142.
| • | liquidity and financial position |
The Company’s financial position remains strong, enabling it to meet cash requirements for operations, capital expansion programs and dividend payments to shareholders. The Company intends to fund acquisitions, working capital requirements, principal and interest payments and other liabilities with cash provided by operations, to the extent available, and short-term and long-term borrowings under existing credit facilities.
Cash provided by operating activities of continuing operations was $56.5 million in 2003, $94.1 million in 2002 and $58.9 million in 2001. Operating cash flow provided the primary source of funds to finance operating needs, capital expenditures and shareholder dividends. The decrease in cash provided by continuing operations in 2003 was the result of increased levels of inventories and other working capital combined with the $13.3 million postretirement credit, which was a non-cash transaction. Inventory levels in 2003 increased to plan for the consolidation of several facilities and also because of higher energy and crop costs associated with the dehydrated flavors business. The increase in cash provided by continuing operations in 2002 was the result of increased earnings and working capital reductions as compared to 2001.
Cash used for investing activities was $85.2 million in 2003 and $88.2 million in 2002, compared to cash provided of $25.2 million in 2001. Cash proceeds from the sale of assets were $8.2 million in 2003, $8.9 million in 2002 and $114.6 million in 2001. The 2001 proceeds were primarily a result of the sale of Red Star Yeast. Cash used for acquisitions was $19.3 million in 2003, $48.5 million in 2002 and $50.7 million in 2001. Acquisitions in 2003 include Formulabs Iberica S.A., a Barcelona, Spain, manufacturer and marketer of specialty inks, primarily for inkjet applications, and certain assets of Kyowa Koryo Kagaku Kabushiki Kaisha, a former Japanese flavor producer. The Company may be required to pay up to 1.8 million Euro of additional cash consideration for the 2002 acquisitions subject to specific performance targets in the second year following the acquisitions. Capital expenditures for continuing operations were $74.2 million in 2003, $47.3 million in 2002 and $38.0 million in 2001. The increase in capital expenditures in 2003 was partly attributable to the integration of recently acquired businesses, as well as initiatives to upgrade certain of the Company’s Flavor and Color facilities. Capital expenditures in 2004 are expected to be approximately $55 million.
Cash provided by financing activities was $28.4 million in 2003, compared to cash used of $6.8 million in 2002 and $85.5 million in 2001. The Company had net borrowings of $69.7 million in 2003 and $25.5 million in 2002, compared to a reduction in debt of $31.9 million in 2001. Cash proceeds received from the additional borrowings were used to fund acquisitions as well as for general corporate purposes. The Company maintains debt levels it considers prudent based on its cash flows, interest coverage and percentage of total debt to total capital.
The Company’s ratio of debt to total capital was 53.0% as of December 31, 2003, consistent with 52.8% as of December 31, 2002.
The Company has a share repurchase program under which it is authorized to repurchase up to 10.0 million shares of Company stock. As of December 31, 2003, 4.3 million shares were available under the authorization. During 2003, 2002 and 2001, the Company repurchased 0.9 million, 0.9 million and 1.7 million shares at a cost of $17.9 million, $18.9 million and $37.0 million, respectively.
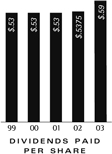
The Company has paid uninterrupted quarterly cash dividends since commencing public trading in its stock in 1962. On April 24, 2003, the Company announced an increase in the quarterly cash dividend on its common stock, from 14 cents per share to 15 cents per share. On an annualized basis, this announcement increased the Company’s dividend from 56 cents per share to 60 cents per share, commencing with the dividend paid on June 2, 2003. In 2003 and 2002, total dividends paid per share were $0.59 and $0.5375, respectively.
The impact of inflation on both the Company’s financial position and its results of operations has been minimal and is not expected to adversely affect 2004 results.
SENSIENT 2003 annual report | 18 |
| • | critical accounting policies |
In preparing the financial statements in accordance with accounting principles generally accepted in the U.S., management is required to make estimates and assumptions that have an impact on the assets, liabilities, revenue and expense amounts reported. These estimates can also affect supplemental information disclosures of the Company, including information about contingencies, risk and financial condition. The Company believes, given current facts and circumstances, its estimates and assumptions are reasonable, adhere to accounting principles generally accepted in the U.S., and are consistently applied. Inherent in the nature of an estimate or assumption is the fact that actual results may differ from estimates, and estimates may vary as new facts and circumstances arise. The Company makes routine estimates and judgments in determining the net realizable value of accounts receivable, inventories, fixed assets and prepaid expenses. Management believes the Company’s most critical accounting estimates and assumptions are in the following areas:
Goodwill Valuation The Company reviews the carrying value of goodwill annually utilizing several valuation methodologies, including a discounted cash flow model. Changes in estimates of future cash flows caused by items such as unforeseen events or changes in market conditions, could negatively affect the reporting segment’s fair value and result in an impairment charge. However, the current fair values of the reporting segments are significantly in excess of carrying values. The Company estimates that a 100 basis point increase in its weighted average cost of capital would not result in impairment. Accordingly, management believes that only significant changes in the cash flow assumptions would result in impairment.
Income Taxes The Company files income tax returns and estimates its income tax expense in each of the taxing jurisdictions in which it operates. The Company is subject to a tax audit in each of these jurisdictions, which could result in changes to the estimated tax expense. The amount of these changes would vary by jurisdiction and would be recorded when known. These changes could impact the Company’s financial statements. Management has recorded valuation allowances to reduce its deferred tax assets to the amount that is more likely than not to be realized. In doing so, management has considered future taxable income and ongoing tax planning strategies in assessing the need for the valuation allowance. An adjustment to the recorded valuation allowance as a result of changes in facts or circumstances could result in a significant change in the Company’s tax expense.
| • | market risk factors |
The Company is exposed to market risks, including changes in interest rates, currency exchange rates and commodity prices. To manage the volatility relating to these exposures on a consolidated basis, the Company nets the exposures to take advantage of natural offset. The Company also enters into various derivative transactions for some of the remaining exposures pursuant to the Company’s policies covering hedging practices. The financial impacts of these hedging instruments are offset by corresponding changes in the underlying exposures being hedged. The Company does not hold or issue derivative financial instruments for trading purposes. Note 1 and Note 6 to the Consolidated Financial Statements include a discussion of the Company’s accounting policies for financial instruments.
A key part of the Company’s strategy is to expand into new geographic markets. Because the Company manufactures and sells its products throughout the world, it is exposed to movements in foreign currency exchange rates. The major foreign currency exposures involve the markets in Western Europe, Mexico and Canada. The primary purpose of the Company’s foreign currency hedging activities is to protect against the volatility associated with foreign currency sales, purchases of materials and other assets and liabilities created during the normal course of business. The Company utilizes foreign exchange contracts with durations of generally less than 12 months that qualify as cash flow hedges under SFAS No. 133, “Accounting for Derivative Instruments and Hedging Activities,” as amended. At December 31, 2003 and 2002, the fair values of these instruments, based on dealer quotes, were liabilities of $0.5 million and $2.3 million, respectively. At December 31, 2003 and 2002, the potential gain or loss in the fair value of the Company’s outstanding foreign exchange contracts, assuming a hypothetical 10% fluctuation in the currencies of such contracts, would be approximately $2.8 million and $6.1 million, respectively. However, any change in the value of the contracts, real or hypothetical, would be significantly offset by an equivalent change in the value of
| 19 | SENSIENT 2003 annual report |
MANAGEMENT’S DISCUSSION AND ANALYSIS of operations & financial condition
the underlying hedged items. In addition, this hypothetical calculation assumes that each exchange rate would change in the same direction relative to the U.S. dollar.
The Company has certain long-term debt denominated in Swiss Francs and Euros. These non-derivative debt instruments have been designated as partial hedges of the Company’s Swiss Franc and Euro net asset positions. At December 31, 2003 and 2002, the potential increase or decrease in the annual U.S. dollar interest expense of the Company’s outstanding foreign currency-denominated debt, assuming a hypothetical 10% fluctuation in the currencies of such debt, would be approximately $1.1 million and $1.0 million, respectively. However, any change in interest expense from fluctuations in currency, real or hypothetical, would be offset by an equivalent change in the value of the foreign income before interest. In addition, this hypothetical calculation assumes that each exchange rate would change in the same direction relative to the U.S. dollar.
The Company manages its debt structure and interest rate risk through the use of fixed rate and floating rate debt and through the use of derivatives. The Company’s primary exposure is to interest rates in the U.S. and Western Europe. The Company uses interest rate swaps to hedge its exposure to interest rate changes, manage the level of fixed and floating interest exposure and lower its financing costs. During 2003 and 2002, the Company entered into a series of interest rate swap agreements to manage the mix of fixed and floating interest rate debt. These instruments are accounted for as fair value hedges under SFAS No. 133. As of December 31, 2003 and 2002, the notional amount of the interest rate swaps was $187.4 million and $197.7 million, respectively, with varying maturities through January 2011. The fair value of the swaps, based on dealer quotes, was an asset of $4.0 million and $13.2 million, which was recorded primarily in the “Other assets” line on the consolidated balance sheets, at December 31, 2003 and 2002, respectively. The potential gain or loss in the fair value of the outstanding interest rate swaps at December 31, 2003 and 2002, assuming a hypothetical 10% fluctuation in interest rates of such contracts, would be approximately $2.3 million and $3.4 million, respectively. At December 31, 2003 and 2002, the potential increase or decrease in annual interest expense, assuming a hypothetical 10% fluctuation in interest rates of floating rate debt, including the impact of swap contracts, would be approximately $0.4 million for each year.
The Company is the purchaser of certain commodities such as corn, sugar, soybean meal and fruits. The Company generally purchases these commodities based upon market prices that are established with the vendor as part of the purchase process. In general, the Company does not use commodity financial instruments to hedge commodity prices due to a high correlation between the commodity cost and the ultimate selling price of the Company’s products. On occasion, the Company may enter into non-cancelable forward purchase contracts, as deemed appropriate, to reduce the effect of price fluctuations on future manufacturing requirements.
| • | contractual obligations |
The Company is subject to certain contractual obligations, including long-term debt, operating leases and manufacturing purchases. The following table summarizes the Company’s significant contractual obligations as of December 31, 2003.
| • | payments due by period |
(IN THOUSANDS) | total | £ 1 year | 2-3 years | 4-5 years | > 5 years | ||||||||||
Long-term debt | $ | 539,683 | $ | 13,759 | $ | 238,101 | $ | 100,055 | $ | 187,768 | |||||
Operating lease obligations | 30,481 | 7,397 | 10,811 | 5,353 | 6,920 | ||||||||||
Manufacturing purchase commitments | 53,939 | 29,583 | 20,675 | 3,681 | — | ||||||||||
Total contractual obligations | $ | 624,103 | $ | 50,739 | $ | 269,587 | $ | 109,089 | $ | 194,688 | |||||
SENSIENT 2003 annual report | 20 |
| • | new pronouncements |
On January 1, 2003, the Company adopted SFAS No. 146, “Accounting for Costs Associated with Exit or Disposal Activities.” This pronouncement generally requires exit or disposal activities that are initiated after December 31, 2002, to be recognized when the liability is incurred and not at project initiation. The impact of adopting this pronouncement on the Company’s consolidated financial statements was not significant.
On January 1, 2003, the Company adopted the Financial Accounting Standards Board (“FASB”) Interpretation (“FIN”) No. 45, “Guarantor’s Accounting and Disclosure Requirements for Guarantees, Including Indirect Guarantees of Indebtedness of Others.” This interpretation elaborates on the disclosures to be made by a guarantor in its interim and annual financial statements about its obligations under certain guarantees that it has issued. It also clarifies that a guarantor is required to recognize, at the inception of a guarantee, a liability for the fair value of the obligation undertaken in issuing the guarantee. This pronouncement is effective on a prospective basis for guarantees issued or modified after December 31, 2002. The impact of adopting this interpretation was not significant on the Company’s consolidated financial statements.
On December 31, 2003, the Company adopted the revised SFAS No. 132, “Employers’ Disclosures About Pensions and Other Post Retirement Benefits,” which enhances the financial statement disclosures for defined benefit plans. The impact of adopting this statement was not significant on the Company’s consolidated financial statements.
In December 2003, the FASB issued a revision to FIN No. 46 (“46R”), “Consolidation of Variable Interest Entities,” to clarify certain provisions of FIN No. 46, and to exempt certain entities from its requirements. The Company is currently evaluating the impact of adopting the remaining provisions of 46R in 2004 and does not anticipate that the adoption of this interpretation will have a significant impact on the Company’s consolidated financial statements.
| • | forward-looking statements |
This document contains forward-looking statements that reflect management’s current assumptions and estimates of future economic circumstances, industry conditions, Company performance and financial results. The Private Securities Litigation Reform Act of 1995 provides a safe harbor for such forward-looking statements. Such forward-looking statements are not guarantees of future performance and involve known and unknown risks, uncertainties and other factors that could cause actual events to differ materially from those expressed in those statements. A variety of factors could cause the Company’s actual results and experience to differ materially from the anticipated results. These factors and assumptions include the pace and nature of new product introductions by the Company’s customers; results of newly acquired businesses; the Company’s ability to successfully implement its growth strategies; the outcome of the Company’s various productivity-improvement and cost-reduction efforts; changes in costs of raw materials, including energy; industry and economic factors related to the Company’s domestic and international business; growth in markets for products in which the Company competes; industry acceptance of price increases; and currency exchange rate fluctuations. The Company does not undertake to publicly update or revise its forward-looking statements even if experience or future changes make it clear that any projected results expressed or implied therein will not be realized.
| • | certifications |
Pursuant to Rule 13a-14(a) of the Securities Exchange Act of 1934, the Company’s CEO, Kenneth P. Manning, and the Company’s CFO, Richard F. Hobbs, certified the quality of the Company’s public disclosure in an exhibit to the Company’s Annual Report on Form 10-K for the year ended December 31, 2003.
| 21 | SENSIENT 2003 annual report |
CONSOLIDATED STATEMENTS of earnings
IN THOUSANDS EXCEPT PER SHARE AMOUNTS Years ended December 31, | 2003 | 2002 | 2001 | ||||||
revenue | $ | 987,408 | $ | 939,886 | $ | 816,947 | |||
Cost of products sold | 675,412 | 633,011 | 550,331 | ||||||
Selling and administrative expenses | 168,036 | 160,380 | 145,126 | ||||||
Special charges (see Note 14) | 6,476 | — | — | ||||||
operating income | 137,484 | 146,495 | 121,490 | ||||||
Interest expense | 29,140 | 29,523 | 31,531 | ||||||
earnings from continuing operations before income taxes | 108,344 | 116,972 | 89,959 | ||||||
Income taxes | 26,912 | 36,282 | 24,996 | ||||||
Earnings from continuing operations | 81,432 | 80,690 | 64,963 | ||||||
Earnings from discontinued operations | — | — | 8,639 | ||||||
net earnings | $ | 81,432 | $ | 80,690 | $ | 73,602 | |||
Basic earnings per share | |||||||||
Continuing operations | $ | 1.74 | $ | 1.70 | $ | 1.36 | |||
Discontinued operations | — | — | .18 | ||||||
Net earnings | $ | 1.74 | $ | 1.70 | $ | 1.54 | |||
Diluted earnings per share | |||||||||
Continuing operations | $ | 1.73 | $ | 1.69 | $ | 1.36 | |||
Discontinued operations | — | — | .18 | ||||||
Net earnings | $ | 1.73 | $ | 1.69 | $ | 1.54 | |||
Average common shares outstanding - basic | 46,741 | 47,379 | 47,671 | ||||||
Average common shares outstanding - diluted | 47,041 | 47,788 | 47,926 | ||||||
See notes to consolidated financial statements.
SENSIENT 2003 annual report | 22 |
CONSOLIDATED balance sheets
IN THOUSANDS EXCEPT SHARE AND PER SHARE AMOUNTS December 31, | 2003 | 2002 | ||||||
assets | ||||||||
Current Assets: | ||||||||
Cash and cash equivalents | $ | 3,250 | $ | 2,103 | ||||
Trade accounts receivable, less allowance for losses of $4,843 and $4,885, respectively | 168,073 | 160,155 | ||||||
Inventories | 318,755 | 269,701 | ||||||
Prepaid expenses and other current assets | 27,719 | 26,275 | ||||||
Deferred income taxes | 18,933 | 17,344 | ||||||
Total current assets | 536,730 | 475,578 | ||||||
Other assets | 78,525 | 85,679 | ||||||
Goodwill | 428,922 | 379,955 | ||||||
Intangible assets - at cost, less accumulated amortization of $3,484 and $4,089, respectively | 17,553 | 13,235 | ||||||
Property, Plant and Equipment: | ||||||||
Land | 29,042 | 20,214 | ||||||
Buildings | 193,147 | 162,250 | ||||||
Machinery and equipment | 537,623 | 462,925 | ||||||
| 759,812 | 645,389 | |||||||
Less accumulated depreciation | 368,014 | 314,151 | ||||||
| 391,798 | 331,238 | |||||||
Total assets | $ | 1,453,528 | $ | 1,285,685 | ||||
liabilities and shareholders’ equity | ||||||||
Current Liabilities: | ||||||||
Trade accounts payable | $ | 67,535 | $ | 55,546 | ||||
Accrued salaries, wages and withholdings from employees | 12,871 | 14,197 | ||||||
Other accrued expenses | 61,464 | 63,927 | ||||||
Income taxes | 11,817 | 23,239 | ||||||
Short-term borrowings | 114,974 | 34,618 | ||||||
Current maturities of long-term debt | 13,759 | 12,374 | ||||||
Total current liabilities | 282,420 | 203,901 | ||||||
Deferred income taxes | 23,529 | 10,942 | ||||||
Other liabilities | 11,329 | 16,141 | ||||||
Accrued employee and retiree benefits | 30,208 | 43,636 | ||||||
Long-term debt | 525,924 | 511,707 | ||||||
Commitments and contingencies | — | — | ||||||
Shareholders’ Equity: | ||||||||
Common stock, par value $.10 a share, authorized 250,000,000 shares; issued 53,954,874 shares | 5,396 | 5,396 | ||||||
Additional paid-in capital | 72,194 | 72,390 | ||||||
Earnings reinvested in the business | 674,803 | 621,525 | ||||||
Treasury stock, 7,230,781 and 6,746,164 shares, respectively, at cost | (147,472 | ) | (137,074 | ) | ||||
Unearned portion of restricted stock | (3,844 | ) | (2,951 | ) | ||||
Accumulated other comprehensive income (loss) | (20,959 | ) | (59,928 | ) | ||||
| 580,118 | 499,358 | |||||||
Total liabilities and shareholders’ equity | $ | 1,453,528 | $ | 1,285,685 | ||||
See notes to consolidated financial statements.
| 23 | SENSIENT 2003 annual report |
CONSOLIDATED STATEMENTS of shareholders’ equity
IN THOUSANDS EXCEPT SHARE AND PER SHARE AMOUNTS | common stock | additional paid-in capital | earnings reinvested in the business | ||||||||
Balances at December 31, 2000 | $ | 5,396 | $ | 72,870 | $ | 518,128 | |||||
Net earnings | 73,602 | ||||||||||
Cumulative effect of accounting change, net of tax of $363 | |||||||||||
Unrealized gain on cash flow hedges, net of tax of $289 | |||||||||||
Foreign currency translation | |||||||||||
Total comprehensive income | |||||||||||
Cash dividends paid – $.53 a share | (25,356 | ) | |||||||||
Stock options exercised | (552 | ) | |||||||||
Benefit plans | 261 | ||||||||||
Restricted stock | (86 | ) | |||||||||
Other | |||||||||||
Purchase of treasury stock | |||||||||||
Balances at December 31, 2001 | 5,396 | 72,493 | 566,374 | ||||||||
Net earnings | 80,690 | ||||||||||
Unrealized loss on cash flow hedges, arising during the period, net of tax of $522 | |||||||||||
Reclassification adjustment for cash flow hedges included in net income, net of tax of $370 | |||||||||||
Foreign currency translation | |||||||||||
Total comprehensive income | |||||||||||
Cash dividends paid – $.5375 a share | (25,539 | ) | |||||||||
Stock options exercised | (342 | ) | |||||||||
Benefit plans | 54 | ||||||||||
Restricted stock | 185 | ||||||||||
Other | |||||||||||
Purchase of treasury stock | |||||||||||
Balances at December 31, 2002 | 5,396 | 72,390 | 621,525 | ||||||||
Net earnings | 81,432 | ||||||||||
Unrealized gain on cash flow hedges, arising during the period, net of tax of $1,809 | |||||||||||
Reclassification adjustment for cash flow hedges included in net income, net of tax of $1,633 | |||||||||||
Minimum pension liability, net of tax of $52 | |||||||||||
Foreign currency translation | |||||||||||
Total comprehensive income | |||||||||||
Cash dividends paid – $.59 a share | (27,688 | ) | |||||||||
Redemption of rights – $.01 a share | (466 | ) | |||||||||
Stock options exercised | (285 | ) | |||||||||
Benefit plans | 216 | ||||||||||
Restricted stock | (127 | ) | |||||||||
Other | |||||||||||
Purchase of treasury stock | |||||||||||
Balances at December 31, 2003 | $ | 5,396 | $ | 72,194 | $ | 674,803 | |||||
See notes to consolidated financial statements.
SENSIENT 2003 annual report | 24 |
| treasury stock | unearned portion of restricted stock | accumulated other comprehensive income (loss) | total comprehensive income (loss) | ||||||||||||||
| shares | amount | ||||||||||||||||
| 5,403,015 | $ | (106,472 | ) | $ | (1,964 | ) | $ | (70,900 | ) | ||||||||
| $ | 73,602 | ||||||||||||||||
| (3,264 | ) | (3,264 | ) | ||||||||||||||
| 2,837 | 2,837 | ||||||||||||||||
| (7,142 | ) | (7,142 | ) | ||||||||||||||
| $ | 66,033 | ||||||||||||||||
| (416,323 | ) | 8,022 | |||||||||||||||
| (105,716 | ) | 2,087 | |||||||||||||||
| (52,000 | ) | 970 | (659 | ) | |||||||||||||
| (200 | ) | 4 | |||||||||||||||
| 1,716,400 | (36,966 | ) | |||||||||||||||
| 6,545,176 | (132,355 | ) | (2,623 | ) | (78,469 | ) | |||||||||||
| $ | 80,690 | ||||||||||||||||
| (5,497 | ) | (5,497 | ) | ||||||||||||||
| 3,898 | 3,898 | ||||||||||||||||
| 20,140 | 20,140 | ||||||||||||||||
| $ | 99,231 | ||||||||||||||||
| (563,441 | ) | 11,332 | |||||||||||||||
| (98,155 | ) | 1,985 | |||||||||||||||
| (43,000 | ) | 868 | (328 | ) | |||||||||||||
| 584 | (12 | ) | |||||||||||||||
| 905,000 | (18,892 | ) | |||||||||||||||
| 6,746,164 | (137,074 | ) | (2,951 | ) | (59,928 | ) | |||||||||||
| $ | 81,432 | ||||||||||||||||
| 16,330 | 16,330 | ||||||||||||||||
| (14,741 | ) | (14,741 | ) | ||||||||||||||
| (84 | ) | (84 | ) | ||||||||||||||
| 37,464 | 37,464 | ||||||||||||||||
| $ | 120,401 | ||||||||||||||||
| (235,004 | ) | 4,781 | |||||||||||||||
| (108,307 | ) | 2,201 | |||||||||||||||
| (89,200 | ) | 1,821 | (893 | ) | |||||||||||||
| 61,128 | (1,270 | ) | |||||||||||||||
| 856,000 | (17,931 | ) | |||||||||||||||
| 7,230,781 | $ | (147,472 | ) | $ | (3,844 | ) | $ | (20,959 | ) | ||||||||
| 25 | SENSIENT 2003 annual report |
CONSOLIDATED STATEMENTS of cash flows
IN THOUSANDS Years ended December 31, | 2003 | 2002 | 2001 | |||||||||
cash flows from operating activities | ||||||||||||
Earnings from continuing operations | $ | 81,432 | $ | 80,690 | $ | 64,963 | ||||||
Adjustments to arrive at net cash provided by operating activities: | ||||||||||||
Depreciation and amortization | 43,098 | 41,290 | 46,290 | |||||||||
Special charges | 6,476 | — | — | |||||||||
Gain on sale of assets | (4,368 | ) | (1,907 | ) | (3,230 | ) | ||||||
Changes in operating assets and liabilities (net of effects from acquisition of businesses): | ||||||||||||
Trade accounts receivable | 1,236 | (8,922 | ) | (9,865 | ) | |||||||
Inventories | (31,334 | ) | (17,377 | ) | 8,007 | |||||||
Prepaid expenses and other assets | (13,240 | ) | (13,695 | ) | (1,528 | ) | ||||||
Accounts payable and other accrued expenses | (6,447 | ) | 3,239 | (28,691 | ) | |||||||
Accrued salaries, wages and withholdings from employees | (2,407 | ) | 3,521 | (1,762 | ) | |||||||
Income taxes | (9,270 | ) | 7,303 | (3,580 | ) | |||||||
Deferred income taxes | 10,538 | (2,592 | ) | (9,496 | ) | |||||||
Other liabilities | (19,171 | ) | 2,551 | (2,237 | ) | |||||||
Net cash provided by operating activities of continuing operations | 56,543 | 94,101 | 58,871 | |||||||||
Net cash provided by operating activities of discontinued operations | — | — | 707 | |||||||||
| 56,543 | 94,101 | 59,578 | ||||||||||
cash flows from investing activities | ||||||||||||
Acquisition of property, plant and equipment | (74,208 | ) | (47,317 | ) | (38,001 | ) | ||||||
Acquisition of businesses – net of cash acquired | (19,307 | ) | (48,450 | ) | (50,749 | ) | ||||||
Proceeds from sale of assets | 8,223 | 8,908 | 114,606 | |||||||||
Decrease (increase) in other assets | 112 | (1,322 | ) | (671 | ) | |||||||
Net cash (used in) provided by investing activities | (85,180 | ) | (88,181 | ) | 25,185 | |||||||
cash flows from financing activities | ||||||||||||
Proceeds from additional borrowings | 121,761 | 74,004 | 254,179 | |||||||||
Reduction in debt | (52,044 | ) | (48,550 | ) | (286,051 | ) | ||||||
Purchase of treasury stock | (17,931 | ) | (18,892 | ) | (37,385 | ) | ||||||
Dividends paid | (28,154 | ) | (25,539 | ) | (25,356 | ) | ||||||
Proceeds from options exercised and other equity transactions | 4,809 | 12,204 | 9,115 | |||||||||
Net cash provided by (used in) financing activities | 28,441 | (6,773 | ) | (85,498 | ) | |||||||
Effect of exchange rate changes on cash and cash equivalents | 1,343 | 639 | (165 | ) | ||||||||
Net increase (decrease) in cash and cash equivalents | 1,147 | (214 | ) | (900 | ) | |||||||
Cash and cash equivalents at beginning of year | 2,103 | 2,317 | 3,217 | |||||||||
Cash and cash equivalents at end of year | $ | 3,250 | $ | 2,103 | $ | 2,317 | ||||||
Cash paid during the year for: | ||||||||||||
Interest | $ | 29,544 | $ | 30,729 | $ | 32,102 | ||||||
Income taxes | 23,482 | 23,743 | 35,986 | |||||||||
Liabilities assumed in acquisitions | 992 | 12,683 | 23,903 | |||||||||
Capitalized interest | 2,081 | 734 | 966 | |||||||||
See notes to consolidated financial statements.
SENSIENT 2003 annual report | 26 |
NOTES to consolidated financial statements
Years ended December 31, 2003, 2002 and 2001
| • | 1 summary of significant accounting policies |
Principles of ConsolidationThe consolidated financial statements include the accounts of Sensient Technologies Corporation and its subsidiaries (the “Company”). All significant intercompany accounts and transactions are eliminated.
Use of EstimatesThe preparation of the consolidated financial statements in conformity with accounting principles generally accepted in the United States of America requires management to make estimates and assumptions that affect reported amounts of assets and liabilities and the disclosure of contingent assets and liabilities at the date of the financial statements and the reported amounts of revenue and expenses during the reporting periods. Actual results could differ from those estimates.
Revenue RecognitionThe Company recognizes revenue, net of estimated discounts, allowances and returns, upon shipment of goods to customers, at which time title passes, the customer is obligated to pay the Company, and the Company has no remaining obligations.
Cost of Products SoldCost of products sold includes materials, labor and overhead expenses incurred in the manufacture of our products. Cost of products sold also includes charges for obsolete and slow moving inventories, as well as costs for quality control, purchasing and receiving costs, inspection costs, warehousing costs, internal transfer costs, other costs of our internal distribution network and costs incurred for shipping and handling. The Company records fees billed to customers for shipping and handling as revenue.
Selling and Administrative ExpensesSelling and administrative expenses primarily include the salaries and related costs for executive, finance, accounting, human resources, research and development and legal personnel as well as salaries and related costs of salespersons, and commissions paid to external sales agents.
Cash EquivalentsThe Company considers all highly liquid investments with maturities of three months or less at the date of acquisition as cash equivalents.
InventoriesInventories are stated at the lower of cost or market. Cost is determined using the first-in, first-out (“FIFO”) method.
Property, Plant and EquipmentProperty, plant and equipment are recorded at cost reduced by accumulated depreciation. Depreciation is provided over the estimated useful life using the straight-line method for financial reporting. The estimated useful lives for buildings ranges from 5 to 35 years. The buildings category consists of building improvements, which have useful lives ranging from 5 to 35 years and buildings, which have useful lives ranging from 10 to 35 years. Machinery and equipment have useful lives ranging from 3 to 10 years.
Goodwill and Other Intangible AssetsOn January 1, 2002, the Company adopted Statement of Financial Accounting Standards (“SFAS”) No. 142, “Goodwill and Other Intangible Assets.” SFAS No. 142 requires that upon adoption, amortization of goodwill and other intangible assets with indefinite useful lives cease and instead, the carrying value of goodwill is evaluated for impairment on an annual basis. The Company performed the transitional impairment assessment of goodwill on January 1, 2002, and the annual assessments on July 1, 2003 and 2002. The assessments included comparing the carrying amount of net assets, including goodwill, of each reporting unit to their respective fair value as of the date of the assessment. Fair value was estimated based upon an evaluation of future discounted cash flow as well as the public trading and private transaction valuation multiples for comparable companies. Such determination of fair value yielded no impairment. Prior to the adoption of SFAS No. 142, goodwill was amortized using the straight-line method over 40 years.
The cost of intangible assets with determinable useful lives is amortized on a straight-line basis to reflect the pattern of economic benefits consumed, ranging from 5 to 20 years.
Impairment of Long-lived AssetsThe Company reviews long-lived assets for impairment whenever events or changes in business circumstances indicate that the carrying amount of the assets may not be fully recoverable. The Company performs undiscounted cash flow analyses to determine if an impairment exists. If an impairment is determined to exist, any related impairment loss is calculated based on discounted future cash flows.
Financial InstrumentsThe Company uses derivative financial instruments for the purpose of hedging currency and interest rate exposures which exist as part of ongoing business operations. As a policy, the Company does not engage in speculative or leveraged transactions, nor does the Company hold or issue financial instruments for trading purposes.
| 27 | SENSIENT 2003 annual report |
NOTES to consolidated financial statements
Years ended December 31, 2003, 2002 and 2001
On January 1, 2001, the Company adopted SFAS No. 133, “Accounting for Derivative Instruments and Hedging Activities,” as amended, which requires that all derivative instruments be reported on the consolidated balance sheets at fair value and establishes criteria for designation and effectiveness of hedging relationships. The cumulative effect of adopting SFAS No. 133 was a decrease in accumulated other comprehensive income (loss) (“OCI”) at January 1, 2001 of $3.3 million, net of tax of $0.4 million.
Interest Rate HedgingThe Company is exposed to interest rate risk through its corporate borrowing activities. The objective of the Company’s interest rate risk management activities is to manage the levels of the Company’s fixed and floating interest rate exposure to be consistent with the Company’s preferred mix. The interest rate risk management program consists of entering into interest rate swaps, which qualify as fair value hedges, when there is a desire to modify the Company’s exposure to interest rates. Gains or losses on fair value hedges are recognized in earnings, net of gains and losses on the fair value of the hedged instruments.
Hedge effectiveness is determined by how closely the changes in the fair value of the hedging instrument offset the changes in the fair value or cash flows of the hedged item. Hedge accounting is permitted only if the hedging relationship is expected to be highly effective at the inception of the transaction and on an on-going basis. Any ineffective portions are to be recognized in earnings immediately.
The Company’s existing fair value hedges are 100% effective. As a result, there is no current impact to earnings due to fair value hedge ineffectiveness.
Currency Rate HedgingThe primary objectives of the foreign exchange risk management activities are to understand and mitigate the impact of potential foreign exchange fluctuations on the Company’s financial results and its economic well-being. Generally, these risk management transactions involve the use of foreign currency derivatives to protect against exposure resulting from recorded accounts receivable and payable. The Company primarily utilizes forward exchange contracts with maturities of less than 12 months, which qualify as cash flow hedges. These foreign exchange contracts are intended to offset the effect of exchange rate fluctuations on recorded intercompany receivables and payables. Effective January 1, 2001, gains and losses on these instruments are deferred in accumulated OCI until the underlying transaction is recognized in earnings.
The Company’s existing cash flow hedges are 100% effective. As a result, there is no current impact on earnings due to cash flow hedge ineffectiveness.
Net Investments HedgingThe Company may enter into foreign-denominated debt to be used as a non-derivative instrument to hedge the Company’s net investment in foreign subsidiaries. The change in the carrying amount of the foreign-denominated debt on the Company’s books, attributable to changes in the spot foreign exchange rate, is a hedge of the net investment in its foreign subsidiaries.
Commodity PurchasesThe Company purchases certain commodities in the normal course of business which result in physical delivery of the goods and hence, are excluded from SFAS No. 133, as amended.
Translation of Foreign CurrenciesFor all significant foreign operations, the functional currency is the local currency. Assets and liabilities of foreign operations are translated into U. S. dollars at current exchange rates. Revenue and expense accounts are translated into U. S. dollars at average exchange rates prevailing during the year. Adjustments resulting from the translation of assets and liabilities to U.S. dollars are included in OCI as foreign currency translation adjustments. Transaction gains and losses are included in earnings and were not significant during the three-year period ended December 31, 2003.
SENSIENT 2003 annual report | 28 |
Stock-Based CompensationThe Company accounts for its stock-based compensation plans using the intrinsic value-based method in accordance with Accounting Principles Board Opinion No. 25, “Accounting for Stock Issued to Employees.” Stock options are granted at prices equal to the fair market value of the Company’s common stock on the grant dates. Accordingly, the Company did not record any compensation expense with respect to the grant of stock options during the three-year period ended December 31, 2003. If the Company had elected to recognize compensation cost based on the fair value of the options granted at grant date as prescribed by SFAS No. 123, net earnings and earnings per share would have been reduced to the proforma amounts indicated below:
(IN THOUSANDS, EXCEPT PER SHARE DATA) | 2003 | 2002 | 2001 | |||||||||
Net earnings: | ||||||||||||
As reported | $ | 81,432 | $ | 80,690 | $ | 73,602 | ||||||
Add: reported stock compensation expense – net of tax | 493 | 449 | 55 | |||||||||
Less: fair value stock compensation expense – net of tax | (2,442 | ) | (2,038 | ) | (1,793 | ) | ||||||
Pro forma net earnings | $ | 79,483 | $ | 79,101 | $ | 71,864 | ||||||
Earnings per common share: | ||||||||||||
Basic as reported | $ | 1.74 | $ | 1.70 | $ | 1.54 | ||||||
Less: net impact of fair value stock expense – net of tax | (.04 | ) | (.03 | ) | (.03 | ) | ||||||
Basic pro forma | $ | 1.70 | $ | 1.67 | $ | 1.51 | ||||||
Diluted as reported | $ | 1.73 | $ | 1.69 | $ | 1.54 | ||||||
Less: net impact of fair value stock expense – net of tax | (.04 | ) | (.03 | ) | (.04 | ) | ||||||
Diluted pro forma | $ | 1.69 | $ | 1.66 | $ | 1.50 | ||||||
The weighted-average fair value per share of options granted was $4.68 in 2003, $5.23 in 2002 and $6.40 in 2001.
The fair value of each option granted was estimated on the date of grant using the Black-Scholes option-pricing model with the following weighted average assumptions:
| 2003 | 2002 | 2001 | |||||||
Dividend yield | 2.9 | % | 2.4 | % | 2.5 | % | |||
Volatility | 29.0 | % | 28.8 | % | 39.5 | % | |||
Risk-free interest rate | 3.1 | % | 2.9 | % | 4.5 | % | |||
Expected term (years) | 5.5 | 5.4 | 6.0 |
Earnings Per ShareThe difference between basic and diluted earnings per share is the dilutive effect of stock options and restricted stock. Diluted earnings per share assumes that all dilutive stock options are exercised and restricted stock has vested. All earnings per share amounts are presented on a diluted basis unless otherwise noted.
Accumulated Other Comprehensive Income (Loss)Accumulated OCI is comprised primarily of foreign currency translation and unrealized gains and losses on cash flow hedges. The components of accumulated OCI at December 31 were:
(IN THOUSANDS) | 2003 | 2002 | ||||
Foreign currency translation | $(20,438) | $ | (57,902 | ) | ||
Other | (84) | — | ||||
Unrealized losses on cash flow hedges (net of tax) | (437) | (2,026 | ) | |||
Accumulated other comprehensive income (loss) | $(20,959) | $ | (59,928 | ) | ||
Research andDevelopment Research and development costs are recorded in selling and administrative expenses in the year they are incurred. Research and development costs related to continuing operations were $22.9 million, $21.2 million and $16.7 million during the years ended December 31, 2003, 2002 and 2001, respectively.
AdvertisingAdvertising costs are recorded in selling and administrative expenses as they are incurred. Advertising costs related to continuing operations were $1.7 million, $1.2 million and $1.0 million during the years ended December 31, 2003, 2002 and 2001, respectively.
New PronouncementsOn January 1, 2003, the Company adopted SFAS No. 146, “Accounting for Costs Associated with Exit or Disposal Activities.” This pronouncement generally requires exit or disposal activities that are initiated after December 31, 2002, to be recognized when the liability is incurred and not at project initiation. The impact of adopting this pronouncement on the Company’s consolidated financial statements was not significant.
On January 1, 2003, the Company adopted the Financial Accounting Standards Board (“FASB”) Interpretation (“FIN”) No. 45, “Guarantor’s Accounting and Disclosure Requirements for Guarantees, Including Indirect Guarantees of Indebtedness of Others.” This interpretation elaborates on the disclosures to be made by a guarantor in its interim and annual financial statements about its obligations under certain guarantees that it has issued. It also clarifies that a guarantor is required to recognize, at the inception of a guarantee, a liability for the fair
| 29 | SENSIENT 2003 annual report |
NOTES to consolidated financial statements
Years ended December 31, 2003, 2002 and 2001
value of the obligation undertaken in issuing the guarantee. This pronouncement is effective on a prospective basis for guarantees issued or modified after December 31, 2002. The impact of adopting this interpretation was not significant on the Company’s consolidated financial statements.
On December 31, 2003, the Company adopted the revised SFAS No. 132, “Employers’ Disclosures About Pensions and Other Post Retirement Benefits,” which enhances the financial statement disclosures for defined benefit plans. The impact of adopting this statement was not significant on the Company’s consolidated financial statements.
In December 2003, the FASB issued a revision to FIN No. 46 (“46R”), “Consolidation of Variable Interest Entities,” to clarify certain provisions of FIN No. 46, and to exempt certain entities from its requirements. The Company is currently evaluating the impact of adopting the remaining provisions of 46R in 2004 and does not anticipate that the adoption of this interpretation will have a significant impact on the Company’s consolidated financial statements.
Reclassifications Certain amounts as previously presented have been reclassified to conform to the current year presentation.
| • | 2 acquisitions |
During 2003, the Company acquired two businesses for cash in an aggregate amount of $17.1 million, net of cash acquired. Formulabs Iberica S.A., a manufacturer and marketer of specialty inks, primarily for inkjet applications, was acquired in August 2003. In March 2003, the Company acquired certain assets of Kyowa Koryo Kagaku Kabushiki Kaisha, a former Japanese flavor producer. The preliminary allocation of the purchase price resulted in finite-lived intangibles of $2.8 million, amortizable over a weighted average period of 20 years and goodwill of $8.1 million. The Company has not completed the purchase price allocations related to these acquisitions. The final purchase price allocation will be completed in 2004.
During 2002, the Company acquired four businesses for cash in an aggregate amount of $48.5 million, net of cash acquired.
The businesses acquired were Cardre, Inc., a manufacturer of specialty ingredients used in cosmetics, ECS Specialty Inks and Dyes, a producer and marketer of inks for specialty printing applications, the flavors and essential oils operations of C. Melchers GmbH & Company, and SynTec GmbH, a manufacturer of specialty dyes and chemicals for the imaging industry. In 2003, the Company paid $2.2 million and may be required to pay up to 1.8 million Euros of additional cash consideration for the 2002 acquisitions subject to specific performance targets in the second year following the acquisitions. The allocation of the purchase prices resulted in finite-lived intangibles of $7.6 million amortizable over a period of 19 years and goodwill of $28.7 million.
In the fourth quarter of 2001, the Company acquired two businesses for cash in an aggregate amount of $50.7 million, net of cash acquired. Acquisitions made during 2001 were Formulabs, a manufacturer of specialty inks for ink-jet and industrial applications, and the technical dye business of Crompton Colors Incorporated, a manufacturer of technical dyes and colors for paper, ink-jet printing applications, plastics and a number of specialty markets. The final allocation of the purchase prices resulted in finite-lived intangibles of $4.4 million amortizable over a period of 19 years and goodwill of $47.1 million, which includes final purchase price allocations made in 2002. The finite-lived intangibles were primarily customer lists and technology.
All acquisitions have been accounted for as purchases and, accordingly, their results of operations have been included in the consolidated financial statements since their respective dates of acquisition. The effects of presenting the acquisitions on an unaudited pro-forma basis were not significant to the Company’s financial position or results of operations.
SENSIENT 2003 annual report | 30 |
| • | 3 goodwill and intangible assets |
The following table reflects the consolidated results of the Company as if the adoption of SFAS No. 142 had occurred on January 1, 2001. Discontinued operations did not have any goodwill amortization in 2001; therefore, separate disclosure for these operations is not presented.
(IN THOUSANDS, EXCEPT PER SHARE DATA) Years ended December 31, | 2003 | 2002 | 2001 | ||||||
Earnings from Continuing Operations: | |||||||||
Reported earnings from continuing operations | $ | 81,432 | $ | 80,690 | $ | 64,963 | |||
Goodwill amortization, net of tax | — | — | 8,035 | ||||||
Proforma earnings from continuing operations | $ | 81,432 | $ | 80,690 | $ | 72,998 | |||
Net Earnings: | |||||||||
Reported net earnings | $ | 81,432 | $ | 80,690 | $ | 73,602 | |||
Goodwill amortization, net of tax | — | — | 8,035 | ||||||
Proforma net earnings | $ | 81,432 | $ | 80,690 | $ | 81,637 | |||
Basic earnings per share: | |||||||||
Continuing operations: | |||||||||
As reported | $ | 1.74 | $ | 1.70 | $ | 1.36 | |||
Proforma | $ | 1.74 | $ | 1.70 | $ | 1.53 | |||
Net earnings: | |||||||||
As reported | $ | 1.74 | $ | 1.70 | $ | 1.54 | |||
Proforma | $ | 1.74 | $ | 1.70 | $ | 1.71 | |||
Diluted earnings per share: | |||||||||
Continuing operations: | |||||||||
As reported | $ | 1.73 | $ | 1.69 | $ | 1.36 | |||
Proforma | $ | 1.73 | $ | 1.69 | $ | 1.52 | |||
Net earnings: | |||||||||
As reported | $ | 1.73 | $ | 1.69 | $ | 1.54 | |||
Proforma | $ | 1.73 | $ | 1.69 | $ | 1.70 | |||
The Company does not have any intangible assets other than goodwill that are not subject to amortization. The following table summarizes finite-lived intangible assets by major category as of December 31, 2003 and 2002:
weighted average amortization | 2003 | 2002 | ||||||||||||||
(IN THOUSANDS, EXCEPT WEIGHTED AVERAGE AMORTIZATION | cost | accumulated amortization | cost | accumulated amortization | ||||||||||||
Technological know-how | 20.0 | $ | 7,853 | $ | (1,272 | ) | $ | 7,317 | $ | (886 | ) | |||||
Customer relationships | 20.0 | 6,482 | (463 | ) | 4,360 | (184 | ) | |||||||||
Patents, trademarks, non-compete agreements and other | 17.4 | 6,702 | (1,749 | ) | 5,647 | (3,019 | ) | |||||||||
Total finite-lived intangibles | 19.1 | $ | 21,037 | $ | (3,484 | ) | $ | 17,324 | $ | (4,089 | ) | |||||
Amortization of intangible assets was not significant during the periods presented and the estimated aggregate amortization expense for each of the five succeeding years is not anticipated to be significant.
| 31 | SENSIENT 2003 annual report |
NOTES to consolidated financial statements
Years ended December 31, 2003, 2002 and 2001
The changes in goodwill for the years ended December 31, 2003 and 2002 by reportable business segment are as follows:
(IN THOUSANDS) | flavors & fragrances | color | corporate & other | consolidated | ||||||||
Balance as of December 31, 2001 | $ | 102,986 | $ | 193,825 | $ | 1,921 | $ | 298,732 | ||||
Goodwill of acquired businesses | 4,108 | 45,943 | — | 50,051 | ||||||||
Currency translation impact | 10,109 | 21,020 | 43 | 31,172 | ||||||||
Balance as of December 31, 2002 | 117,203 | 260,788 | 1,964 | 379,955 | ||||||||
Goodwill of acquired businesses | — | 9,923 | 344 | 10,267 | ||||||||
Currency translation impact | 13,129 | 24,728 | 843 | 38,700 | ||||||||
Balance as of December 31, 2003 | $ | 130,332 | $ | 295,439 | $ | 3,151 | $ | 428,922 | ||||
During 2002, the Company allocated goodwill to its reporting segments to conform with the reporting requirements of SFAS No. 142.
| • | 4 inventories |
Inventories include finished and in-process products totaling $227.2 million and $195.9 million at December 31, 2003 and 2002, respectively, and raw materials and supplies of $91.6 million and $73.8 million at December 31, 2003 and 2002, respectively.
| • | 5 debt |
Long-term debt consists of the following unsecured obligations at December 31:
(IN THOUSANDS) | 2003 | 2002 | ||||
6.68% senior notes due through January 2011 | $ | 15,000 | $ | 15,000 | ||
6.77% senior notes due through January 2010 | 15,000 | 15,000 | ||||
6.60% notes due through April 2009 | 149,322 | 149,217 | ||||
7.59% senior notes due through December 2008 | 21,429 | 25,714 | ||||
6.99% senior notes due through December 2007 | 40,000 | 40,000 | ||||
4.57% senior notes due December 2007 | 38,000 | 38,000 | ||||
Floating rate Swiss Franc-denominated senior notes due December 2007 | 26,269 | 23,587 | ||||
5.63% Euro-denominated senior notes due November 2006 | 168,595 | 140,735 | ||||
5.85% senior notes due November 2006 | 30,000 | 30,000 | ||||
9.06% senior notes due through July 2004 | 6,000 | 12,000 | ||||
Various other notes | 21,565 | 21,616 | ||||
Deferred realized gains on interest rate swaps | 4,479 | — | ||||
Fair value of interest rate swaps | 4,024 | 13,212 | ||||
| 539,683 | 524,081 | |||||
Less current maturities | 13,759 | 12,374 | ||||
Total long-term debt | $ | 525,924 | $ | 511,707 | ||
The floating rate Swiss Franc-denominated notes had an average coupon rate of 1.39% and 1.57% at December 31, 2003 and 2002, respectively.
The Company has a $150 million multi-currency unsecured revolving loan agreement with a group of five banks, of which $100 million matures in June 2005 and $50 million matures in June 2004. Interest rates are determined based upon the LIBOR rate plus a margin. A facility fee is payable on the total amount of the commitment. The Company issues short-term commercial paper obligations supported by committed lines of credit included in the revolving loan agreement.
The Company had outstanding commercial paper obligations of $68.6 million and $19.2 million at December 31, 2003 and 2002, respectively. Direct borrowings under the revolving loan agreement were $13.0 million and $6.2 million at December 31, 2003 and 2002, respectively. The Company also had $19.6 million and $7.4 million outstanding in uncommitted loans at December 31, 2003 and 2002, respectively.
The Company has $68.4 million available under the revolving loan agreement and $25.4 million available under other uncommitted lines of credit from several banks at December 31, 2003.
The aggregate amounts of maturities on long-term debt each year for the five years subsequent to December 31, 2003, are as follows: 2004, $13.8 million; 2005, $20.2 million; 2006, $217.9 million; 2007, $92.7 million; and 2008, $7.4 million.
Substantially all of the senior loan agreements contain restrictions concerning interest coverage, borrowings, investments and tangible net worth amounts. Earnings reinvested of $165 million at December 31, 2003, were unrestricted.
Short-term borrowings consist of commercial paper, uncommitted loans and loans of foreign subsidiaries denominated in local currencies which are borrowed under various foreign uncommitted lines of credit. The weighted-average interest rates on short-term
SENSIENT 2003 annual report | 32 |
borrowings were 1.96% and 2.51% at December 31, 2003 and 2002, respectively.
| • | 6 financial instruments and risk management |
Interest Rate Swap Agreements During 2003 and 2002, the Company entered into a series of interest rate swap agreements to manage the level of fixed and floating interest rate debt. As of December 31, 2003 and 2002, the notional principal amounts of outstanding interest rate swap agreements (accounted for as fair value hedges) were $187.4 million and $197.7 million, respectively, with varying maturities through January 2011. The notional amounts are used to calculate interest payments, which are exchanged over the life of the swap transactions and are equal to the dollar principal exchanged. The fair value of the swaps, based on dealer quotes, was an asset of $4.0 million and $13.2 million which was recorded primarily in the other assets line on the consolidated balance sheets at December 31, 2003 and 2002, respectively. In October 2003, the Company settled certain interest rate swaps. As a result of these settlements, the counterparty paid the Company $4.8 million. The net realized gains on the swaps have been deferred, classified as a separate component of debt and are being amortized to income as a reduction of interest expense over the remaining term of the debt.
Foreign Currency Contracts The Company uses forward exchange contracts to reduce the effect of fluctuating foreign currencies on short-term foreign currency-denominated intercompany transactions and other known foreign currency exposures. At December 31, 2003 and 2002, the Company had forward exchange contracts (accounted for as cash flow hedges), generally with maturities of one year or less, of $80.4 million and $105.4 million, respectively. The fair values of these instruments, based on dealer quotes, were liabilities of $0.5 million and $2.3 million at December 31, 2003 and 2002, respectively.
Foreign-denominated Debt In December 2002, the Company entered into a 33 million Swiss Franc-denominated note agreement. In November 2001, the Company entered into a 134 million Euro-denominated note agreement. These non-derivative instruments have been designated as partial hedges of the Company’s Swiss Franc and Euro net asset positions.
Concentrations of Credit Risk Counterparties to currency exchange and interest rate swap contracts consist of large international financial institutions. The Company continually monitors its positions and the credit ratings of the counterparties involved and limits the amount of credit exposure to any one party. While the Company may be exposed to potential losses due to the credit risk of non-performance by these counterparties, losses are not anticipated. Concentrations of credit risk with respect to trade accounts receivable are limited by the large number of customers, generally short payment terms, and their dispersion across geographic areas.
Fair Values The carrying amount of cash and cash equivalents, trade accounts receivable, accounts payable, accrued expenses and short-term borrowings approximated fair value as of December 31, 2003 and 2002.
The fair value of the Company’s long-term debt, including current maturities, is estimated using discounted cash flows based on the Company’s current incremental borrowing rates for similar types of borrowing arrangements. The carrying value of long-term debt at December 31, 2003 and 2002 was $539.7 million and $524.1 million, respectively. The fair value of long-term debt at December 31, 2003 and 2002 was approximately $569.5 million and $547.9 million, respectively.
| • | 7 shareholders’ equity |
On July 17, 2003, the Board of Directors authorized the redemption of the rights issued pursuant to the Company’s Shareholder Rights Plan. Under the rights plan, one right was attached to each outstanding share of common stock. The rights were redeemed at a price of $0.01 per right on September 3, 2003, to shareholders along with the $0.15 per share quarterly dividend payment. The total amount paid to shareholders related to the rights redemption was $0.5 million and is reported on the Dividends Paid line of the 2003 Statement of Cash Flows.
| • | 8 stock plans |
The Company has various stock option plans under which employees and directors may be granted options to purchase common stock at 100% of the market price on the day the options are granted.
Under the 2002 Stock Option Plan, up to 2.4 million shares of common stock are available for employee awards, of which no more than 0.6 million shares may be restricted stock. Under the 1998 Stock Option Plan, up to 2.4 million shares of common stock are available for awards, of which no more than 0.6 million shares may be restricted stock. Under the 1994 Stock Option Plan, up to 2.4 million shares of common stock are
| 33 | SENSIENT 2003 annual report |
NOTES to consolidated financial statements
Years ended December 31, 2003, 2002 and 2001
available for awards, of which no more than 0.5 million shares may be restricted stock. The 1994 Plan also authorizes the grant of up to 0.8 million stock appreciation rights in connection with stock options. Under the 1999 Non-Employee Director Stock Option Plan, up to 0.25 million shares of common stock are available for awards.
Generally, stock options become exercisable over a three-year vesting period and expire 10 years from the date of grant. Awarded shares of restricted stock become freely transferable at the end of five years. During the period of restriction, the employee has voting rights and is entitled to receive all dividends and other distributions paid with respect to the stock.
The changes in outstanding stock options during the three years ended December 31, 2003, are summarized below:
(IN THOUSANDS OF SHARES) | outstanding options | weighted- average price | ||||
Balances at December 31, 2000 | 3,369 | $ | 19.28 | |||
Granted | 644 | 18.32 | ||||
Exercised | (498 | ) | 17.89 | |||
Cancelled | (348 | ) | 20.73 | |||
Balances at December 31, 2001 | 3,167 | 19.14 | ||||
Granted | 629 | 21.85 | ||||
Exercised | (583 | ) | 18.02 | |||
Cancelled | (291 | ) | 19.80 | |||
Balances at December 31, 2002 | 2,922 | 19.88 | ||||
Granted | 492 | 20.38 | ||||
Exercised | (236 | ) | 17.99 | |||
Cancelled | (157 | ) | 21.23 | |||
Balances at December 31, 2003 | 3,021 | $ | 20.04 | |||
(IN THOUSANDS OF SHARES) | available | options exercisable | weighted- average price | ||||
December 31, 2001 | 965 | 2,140 | $ | 19.00 | |||
December 31, 2002 | 2,975 | 1,808 | $ | 19.46 | |||
December 31, 2003 | 2,544 | 2,041 | $ | 19.76 | |||
The following summarizes information concerning outstanding and exercisable stock options at December 31, 2003:
| range of exercise price | |||||||||
(IN THOUSANDS OF SHARES) | $14.13- 18.50 | $18.51- 21.50 | $21.51- 25.19 | ||||||
Number outstanding | 737 | 1,233 | 1,051 | ||||||
Weighted-average remaining contractual life, in years | 3.9 | 7.5 | 6.9 | ||||||
Weighted-average exercise price | $ | 16.88 | $ | 19.78 | $ | 22.56 | |||
Number exercisable | 683 | 548 | 810 | ||||||
Weighted-average exercise price | $ | 16.79 | $ | 19.57 | $23.38 | ||||
| • | 9 retirement plans |
The Company provides benefits under defined contribution plans including a savings plan and an employee stock ownership plan (“ESOP”). The savings plan covers substantially all domestic salaried and certain non-union hourly employees and provides for matching contributions up to 4% of each employee’s salary. The ESOP covers substantially all domestic employees not covered by a defined benefit plan and provides for contributions based on a percentage of each employee’s compensation as determined by the Board of Directors. Total expense related to continuing operations for the Company’s defined contribution plans was $2.7 million, $6.7 million and $2.3 million in 2003, 2002 and 2001, respectively.
Although the Company intends the defined contribution plans mentioned above to be the primary retirement benefit for most employees, the Company also has several defined benefit plans. The funded status of the defined benefit plans is as follows at December 31:
(IN THOUSANDS) | 2003 | 2002 | ||||||
Benefit obligation at beginning of year | $ | 22,556 | $ | 21,834 | ||||
Service cost | 698 | 661 | ||||||
Interest cost | 1,524 | 1,138 | ||||||
Plan amendments | — | 492 | ||||||
Benefits paid | (1,334 | ) | (1,791 | ) | ||||
Actuarial loss | 2,293 | 222 | ||||||
Benefit obligation at end of year | 25,737 | 22,556 | ||||||
Plan assets at beginning of year | 3,300 | 3,000 | ||||||
Company contributions | 1,790 | 2,447 | ||||||
Benefits paid | (1,334 | ) | (1,791 | ) | ||||
Actual gain/(loss) on plan assets | 264 | (356 | ) | |||||
Plan assets at end of year | 4,020 | 3,300 | ||||||
Funded status | (21,717 | ) | (19,256 | ) | ||||
Unrecognized prior service cost | 15,011 | 16,289 | ||||||
Unrecognized net actuarial (gain)/loss | 2,189 | (241 | ) | |||||
Additional minimum liability | (14,397 | ) | (15,800 | ) | ||||
Accrued benefit liability | $ | (18,914 | ) | $ | (19,008 | ) | ||
The additional minimum liability of the Company’s defined benefit plans has been recorded primarily as an increase to Other Assets.
Components of annual benefit cost:
(IN THOUSANDS) | 2003 | 2002 | 2001 | ||||||||
Service cost | $ | 698 | $ | 661 | $ | 493 | |||||
Interest cost | 1,524 | 1,138 | 740 | ||||||||
Expected return on plan assets | (254 | ) | (293 | ) | — | ||||||
Amortization of prior service cost | 1,192 | 1,227 | 797 | ||||||||
Recognized actuarial gain | — | (3 | ) | — | |||||||
Defined benefit expense | $ | 3,160 | $ | 2,730 | $ | 2,030 | |||||
SENSIENT 2003 annual report | 34 |
Weighted-average liability assumptions as of December 31:
| 2003 | 2002 | |||||
Discount rate | 6.25 | % | 6.75 | % | ||
Expected return on plan assets | 8.00 | % | 8.00 | % | ||
Rate of compensation increase | 5.00 | % | 5.00 | % |
Weighted-average cost assumptions for the year ended December 31:
| 2003 | 2002 | |||||
Discount rate | 6.75 | % | 7.25 | % | ||
Expected return on plan assets | 8.00 | % | 8.00 | % | ||
Rate of compensation increase | 5.00 | % | 5.00 | % |
| • | 10 other postretirement benefits |
During the fourth quarter of 2003, the Company eliminated its subsidy for certain post-retirement programs. As a result of this change in benefits, the Company recognized a one-time, non-cash credit of $13.6 million, which was partially offset by a $0.3 million accrual for claims incurred but not reported, resulting in a net postretirement credit for 2003 of $13.3 million ($8.2 million after-tax, $0.17 per share), which has been included in selling and administrative expenses in the accompanying income statement.
The funded status of the postretirement benefit plan is as follows at December 31:
(IN THOUSANDS) | 2003 | 2002 | ||||||
Benefit obligation at beginning of year | $ | 9,900 | $ | 7,793 | ||||
Interest cost | 627 | 565 | ||||||
Benefits paid | (890 | ) | (1,216 | ) | ||||
Actuarial loss | 811 | 2,758 | ||||||
Benefit obligation at end of year | 10,448 | 9,900 | ||||||
Plan assets | — | — | ||||||
Funded status | (10,448 | ) | (9,900 | ) | ||||
Unrecognized prior service credit | (5,855 | ) | (6,506 | ) | ||||
Unrecognized net actuarial loss | 2,674 | 1,803 | ||||||
Termination of benefits | 13,629 | — | ||||||
Net amount recognized | $ | — | $ | (14,603 | ) | |||
Components of net periodic benefit cost for continuing operations were:
(IN THOUSANDS) | 2003 | 2002 | 2001 | |||||||||
Interest cost | $ | 627 | $ | 565 | $ | 406 | ||||||
Amortization of prior service credit | (651 | ) | (651 | ) | (651 | ) | ||||||
Recognized actuarial loss (gain) | 163 | (205 | ) | (1,077 | ) | |||||||
Termination of benefits | (13,629 | ) | — | — | ||||||||
Postretirement income | $ | (13,490 | ) | $ | (291 | ) | $ | (1,322 | ) | |||
The weighted-average discount rate used in determining the accumulated postretirement benefit obligation at December 31, 2002, was 6.75%. The health care cost trend rates were assumed to be 11.00% in 2002 and 10.00% in 2003, declining to 5.00% in the year 2008 and remaining at that level thereafter.
Assumed health care cost trend rates have a significant effect on the amounts reported for the health care plan. A one percentage point change in assumed health care cost trend rates would have the following effects:
(IN THOUSANDS) | 1% increase | 1% decrease | |||||
Effect on interest cost component | $ | 67 | $ | (64 | ) | ||
| • | 11 income taxes |
The provision for income taxes for continuing operations is as follows:
(IN THOUSANDS) | 2003 | 2002 | 2001 | |||||||||
Currently payable (refundable): | ||||||||||||
Federal | $ | (1,538 | ) | $ | 16,330 | $ | 4,961 | |||||
State | 1,246 | 4,089 | (108 | ) | ||||||||
Foreign | 19,028 | 18,316 | 13,445 | |||||||||
Deferred (benefit): | ||||||||||||
Federal | 10,399 | (772 | ) | 6,432 | ||||||||
State | (565 | ) | (1,029 | ) | 243 | |||||||
Foreign | (1,658 | ) | (652 | ) | 23 | |||||||
| $ | 26,912 | $ | 36,282 | $ | 24,996 | |||||||
The tax effects of temporary differences that give rise to significant portions of deferred tax assets and liabilities consist of the following:
(IN THOUSANDS) | 2003 | 2002 | ||||||
Deferred tax assets: | ||||||||
Benefit plans | $ | 6,658 | $ | 11,140 | ||||
Liabilities and reserves | 12,069 | 14,964 | ||||||
Foreign operating loss carryovers | 28,186 | 21,996 | ||||||
Other | 7,970 | 11,077 | ||||||
Gross deferred tax assets | 54,883 | 59,177 | ||||||
Valuation allowance | (15,830 | ) | (13,427 | ) | ||||
Net deferred tax assets | 39,053 | 45,750 | ||||||
Deferred tax liabilities: | ||||||||
Property, plant and equipment | (22,911 | ) | (22,601 | ) | ||||
Other assets | (13,712 | ) | (13,046 | ) | ||||
Other | (7,026 | ) | (3,701 | ) | ||||
Total deferred tax liabilities | (43,649 | ) | (39,348 | ) | ||||
Net deferred tax (liabilities) assets | $ | (4,596 | ) | $ | 6,402 | |||
| 35 | SENSIENT 2003 annual report |
NOTES to consolidated financial statements
Years ended December 31, 2003, 2002 and 2001
At December 31, 2003, foreign operating loss carryovers were $78.7 million. Included in the total net operating loss carryovers are losses of $12.7 million that expire through 2013 and $66.0 million that do not expire.
The effective tax rate for continuing operations differs from the statutory federal income tax rate of 35% as described below:
| 2003 | 2002 | 2001 | |||||||
Taxes at statutory rate | 35.0 | % | 35.0 | % | 35.0 | % | |||
State income taxes, net of federal income tax benefit | 1.0 | 1.4 | 1.2 | ||||||
Tax credits | (4.0 | ) | (6.3 | ) | (5.7 | ) | |||
Foreign tax rate | 3.7 | 3.4 | 4.3 | ||||||
Foreign sales corporation/ extraterritorial income tax benefit | (2.3 | ) | (0.9 | ) | (1.1 | ) | |||
Actual and expected settlements of prior years’ issues | (3.1 | ) | (0.8 | ) | (3.4 | ) | |||
Valuation allowance adjustments | (3.1 | ) | — | (2.5 | ) | ||||
Other, net | (2.4 | ) | (0.8 | ) | — | ||||
Effective tax rate | 24.8 | % | 31.0 | % | 27.8 | % | |||
Earnings from continuing operations, before income taxes, are summarized as follows:
(IN THOUSANDS) | 2003 | 2002 | 2001 | ||||||
United States | $ | 59,997 | $ | 78,051 | $ | 58,575 | |||
Foreign | 48,347 | 38,921 | 31,384 | ||||||
| $ | 108,344 | $ | 116,972 | �� | $ | 89,959 | |||
Domestic income taxes have not been provided on undistributed earnings of foreign subsidiaries which are considered to be permanently invested. If undistributed foreign earnings were to be remitted, foreign tax credits would substantially offset any resulting domestic tax liability. Tax benefits associated with the exercise of employee stock options were credited directly to additional paid-in capital and amounted to $0.3 million, $0.9 million and $0.5 million during the years ended December 31, 2003, 2002 and 2001, respectively.
| • | 12 segment and geographic information |
The accounting policies of the segments are the same as those described in the summary of significant accounting policies. The Company evaluates performance based on operating income of the respective business units before special charges, goodwill amortization, interest expense and income taxes. Total revenue and operating income by business segment and geographic region include both sales to customers, as reported in the Company’s consolidated statements of earnings, and intersegment sales, which are accounted for at prices which approximate market prices and are eliminated in consolidation. Corporate and other revenue consist primarily of flavor, fragrances and color products sold by the Asia Pacific Group.
Assets by business segment and geographic region are those assets used in the Company’s continuing operations in each segment and geographic region. Segment assets reflect the allocation of goodwill to each segment. Corporate and other assets consist primarily of property and investments. Capital expenditures are reported exclusive of discontinued operations and acquisitions.
Segment InformationThe Company’s operations, except for the Asia Pacific Group, are managed on a products and services basis. The Company’s reportable segments consist of Flavors&Fragrances and Color. The Company’s Flavors & Fragrances segment produces flavor and fragrance products that impart a desired taste, texture, aroma or other characteristic to a broad range of consumer and other products. The Color segment produces technical colors for industrial applications and digital imaging; colors and formulations for cosmetics; and natural and synthetic color systems for pharmaceuticals, foods and beverages.
SENSIENT 2003 annual report | 36 |
(IN THOUSANDS) | flavors & fragrances | color | corporate & other | consolidated | |||||||||
2001 | |||||||||||||
Revenue from external customers | $ | 505,197 | $ | 255,131 | $ | 56,619 | $ | 816,947 | |||||
Intersegment revenue | 20,476 | 20,864 | — | 41,340 | |||||||||
Total revenue | 525,673 | 275,995 | 56,619 | 858,287 | |||||||||
Operating income (loss) | 74,209 | 69,443 | (22,162 | ) | 121,490 | ||||||||
Interest expense | — | — | 31,531 | 31,531 | |||||||||
Earnings (loss) from continuing operations before income taxes | 74,209 | 69,443 | (53,693 | ) | 89,959 | ||||||||
Assets | 538,467 | 465,752 | 104,674 | 1,108,893 | |||||||||
Capital expenditures | 22,099 | 10,498 | 5,404 | 38,001 | |||||||||
Depreciation and amortization | 24,298 | 9,830 | 12,162 | 46,290 | |||||||||
2002 | |||||||||||||
Revenue from external customers | $ | 548,889 | $ | 331,533 | $ | 59,464 | $ | 939,886 | |||||
Intersegment revenue | 23,298 | 14,919 | — | 38,217 | |||||||||
Total revenue | 572,187 | 346,452 | 59,464 | 978,103 | |||||||||
Operating income (loss) | 85,523 | 80,741 | (19,769 | ) | 146,495 | ||||||||
Interest expense | — | — | 29,523 | 29,523 | |||||||||
Earnings (loss) before income taxes | 85,523 | 80,741 | (49,292 | ) | 116,972 | ||||||||
Assets | 586,131 | 547,247 | 152,307 | 1,285,685 | |||||||||
Capital expenditures | 32,188 | 11,758 | 3,371 | 47,317 | |||||||||
Depreciation and amortization | 24,666 | 11,000 | 5,624 | 41,290 | |||||||||
2003 | |||||||||||||
Revenue from external customers | $ | 570,692 | $ | 350,438 | $ | 66,278 | $ | 987,408 | |||||
Intersegment revenue | 23,982 | 10,438 | — | 34,420 | |||||||||
Total revenue | 594,674 | 360,876 | 66,278 | 1,021,828 | |||||||||
Operating income (loss) | 83,756 | 71,607 | (17,879 | ) | 137,484 | ||||||||
Interest expense | — | — | 29,140 | 29,140 | |||||||||
Earnings (loss) before income taxes | 83,756 | 71,607 | (47,019 | ) | 108,344 | ||||||||
Assets | 690,765 | 622,258 | 140,505 | 1,453,528 | |||||||||
Capital expenditures | 43,330 | 22,993 | 7,885 | 74,208 | |||||||||
Depreciation and amortization | 24,662 | 11,900 | 6,536 | 43,098 | |||||||||
Special Charges | — | — | 6,476 | 6,476 | |||||||||
| 37 | SENSIENT 2003 annual report |
NOTES to consolidated financial statements
Years ended December 31, 2003, 2002 and 2001
Geographic InformationThe Company has manufacturing facilities or sales offices in North America, South America, Europe, Asia, Australia and Africa.
(IN THOUSANDS) | 2003 | 2002 | 2001 | ||||||
Revenue from external customers: | |||||||||
U.S.A. | $ | 436,947 | $ | 488,424 | $ | 397,268 | |||
Europe, excluding the United Kingdom | 235,026 | 203,211 | 176,568 | ||||||
Asia Pacific | 86,492 | 75,103 | 67,356 | ||||||
United Kingdom | 51,831 | 32,165 | 32,480 | ||||||
Other | 177,112 | 140,983 | 143,275 | ||||||
Consolidated | $ | 987,408 | $ | 939,886 | $ | 816,947 | |||
Long-lived assets: | |||||||||
U.S.A. | $ | 366,003 | $ | 364,606 | $ | 349,716 | |||
Europe, excluding the United Kingdom | 362,122 | 276,989 | 168,424 | ||||||
Asia Pacific | 18,841 | 10,610 | 11,104 | ||||||
United Kingdom | 103,626 | 96,212 | 93,195 | ||||||
Other | 66,206 | 61,690 | 71,232 | ||||||
Consolidated | $ | 916,798 | $ | 810,107 | $ | 693,671 | |||
| • | 13 discontinued operations |
In June 2000, the Company’s Board of Directors approved a plan to dispose of the operations of its Yeast business. On February 23, 2001, the Company completed the sale of substantially all of its Yeast business for approximately $113 million in cash, of which $4 million was received in August 2000. Accordingly, the operating results of the Yeast business have been reported separately from continuing operations and reported as a separate line item on the consolidated statements of earnings.
Summarized financial information for the discontinued operation is as follows for the years ended December 31:
(IN THOUSANDS) | 2003 | 2002 | 2001 | ||||
Revenue | — | — | $ | 16,810 | |||
Earnings before income taxes | — | — | 15,399 | ||||
Income taxes | — | — | 6,760 | ||||
Earnings from discontinued operations | — | — | $ | 8,639 | |||
The effective tax rate in 2001 is higher than the statutory rate of 35% because of state income taxes.
| • | 14 special charges |
The Company recorded special charges of $6.5 million ($4.7 million after-tax, $0.10 per share) in December 2003, related primarily to improving cost efficiency worldwide with primary emphasis on the Color Group. The $6.5 million in charges includes $4.0 million of cash expenditures for severance and other employee separation costs associated with a workforce reduction of approximately 165 employees and $2.5 million of non-cash costs related to asset impairment charges. The employees were terminated as of December 31, 2003. These cost saving initiatives will deliver annualized savings of approximately $10 million, beginning in 2004. The Company has spent $1.2 million through December 31, 2003, and expects to spend the remainder in 2004.
In April 2001, the Company announced a plan to reduce its workforce by 200 employees. The separation costs were recorded in the Special Charges line in the 2001 consolidated statement of earnings. These employees were terminated as of December 31, 2001.
The Company announced a facilities consolidation plan in December 2000. This plan was implemented to improve manufacturing efficiencies in both the Flavors & Fragrances and the Color businesses. Based on a review of the business outlook in the second quarter of 2001, this plan was modified. This modification and lower than estimated costs and cash outlays for certain items in the original plan resulted in a reversal of a portion of the special charges reserve. These transactions were included primarily in the Special Charges line in the 2001 consolidated statement of earnings. The employees associated with this plan were terminated as of December 31, 2001.
SENSIENT 2003 annual report | 38 |
The following summarizes the programs:
(IN THOUSANDS) | employee separations | asset impairments | total | |||||||||
December 2003 cost reduction plan | ||||||||||||
Charges | $ | 3,952 | $ | 2,524 | $ | 6,476 | ||||||
Cash spent | (1,184 | ) | — | (1,184 | ) | |||||||
Reductions of assets | — | (2,524 | ) | (2,524 | ) | |||||||
Balances at December 31, 2003 | $ | 2,768 | $ | — | $ | 2,768 | ||||||
December 2000 facilities consolidation plan | ||||||||||||
Balances at December 31, 2000 | $ | 9,650 | $ | — | $ | 9,650 | ||||||
Reversal of special charges reserve | (3,200 | ) | — | (3,200 | ) | |||||||
Cash spent | (6,150 | ) | — | (6,150 | ) | |||||||
Balances at December 31, 2001 | 300 | — | 300 | |||||||||
Cash spent | (300 | ) | — | (300 | ) | |||||||
Balances at December 31, 2002 | $ | — | $ | — | $ | — | ||||||
April 2001 workforce reduction program | ||||||||||||
Charges | $ | 3,000 | $ | — | $ | 3,000 | ||||||
Cash spent | (3,000 | ) | — | (3,000 | ) | |||||||
Balances at December 31, 2001 | $ | — | $ | — | $ | — | ||||||
| • | 15 commitments and contingencies |
The Company leases certain facilities and equipment under operating lease arrangements. Aggregate minimum rental commitments at December 31, 2003, for all noncancelable operating leases with an initial lease term greater than one year are as follows for the years ending December 31,
(IN THOUSANDS) | |||
2004 | $ | 7,397 | |
2005 | 5,875 | ||
2006 | 4,936 | ||
2007 | 3,378 | ||
2008 | 1,975 | ||
Thereafter | 6,920 | ||
| $ | 30,481 | ||
Rent expense totaled $9.2 million, $7.9 million and $7.6 million during the years ended December 31, 2003, 2002 and 2001, respectively.
In connection with the sale of substantially all of the Company’s Yeast business on February 23, 2001, the Company has provided the buyer of these operations with indemnification against certain potential liabilities as is customary in transactions of this nature. The period provided for indemnification against most types of claims has now expired, but for specific types of claims including, but not limited to tax and environmental liabilities, the amount of time provided for indemnification is either five years or the applicable statute of limitations. The maximum amount of the Company’s liability related to these provisions is capped at approximately 35% of the consideration received in the transaction. In cases where the Company believes it is probable that payments will be required under these provisions, a liability was recognized at the time of the asset sale. The Company believes that the probability of incurring payments under these provisions in excess of the amount of the liability recorded is remote.
The Company is involved in various claims and litigation arising in the normal course of business. In the opinion of management and Company counsel, the ultimate resolution of these actions will not materially affect the consolidated financial statements of the Company.
| 39 | SENSIENT 2003 annual report |
MANAGEMENT’S RESPONSIBILITY for financial statements
Years ended December 31, 2003, 2002 and 2001
The management of Sensient Technologies Corporation is responsible for preparation of the financial statements and other financial information included in this annual report. The financial statements have been prepared in accordance with accounting principles generally accepted in the United States of America.
It is management’s policy to maintain a control-conscious environment through an effective system of internal accounting controls. These controls are supported by the careful selection of competent and knowledgeable personnel and by the communication of standard accounting and reporting policies and procedures throughout the Company. These controls are adequate to provide reasonable assurance that assets are safeguarded against material loss or unauthorized use and to produce the records necessary for the preparation of reliable financial information. There are limits inherent in all systems of internal control based on the recognition that the costs of such systems should be related to the benefits to be derived. Management believes that its systems provide this appropriate balance.
The control environment is complemented by the Company’s internal audit function, which evaluates the adequacy of the controls, policies and procedures in place, as well as adherence to them, and recommends improvements for implementation when applicable. In addition, the Company’s independent auditors, Deloitte & Touche LLP, have developed an understanding of the Company’s accounting and financial controls and have conducted such tests as they considered necessary to render an opinion on the Company's financial statements.
The Board of Directors pursues its oversight role with respect to the Company’s financial statements through the Audit Committee, which is composed solely of outside directors. The Audit Committee selects the Company’s independent auditors and meets with them and the internal auditors to review the overall scope and specific plans for their respective audits and results from those audits. The Committee also meets with management to review overall accounting policies relating to the reporting of financial results. Both the independent auditors and internal auditors have unrestricted access to the Audit Committee.
| /S/ KENNETH P. MANNING |
Kenneth P. Manning Chairman, President and Chief Executive Officer |
/S/ RICHARD F. HOBBS |
Richard F. Hobbs Vice President, Chief Financial Officer and Treasurer |
INDEPENDENT AUDITORS’report
To the Shareholders and Board of Directors of Sensient Technologies Corporation:
We have audited the accompanying consolidated balance sheets of Sensient Technologies Corporation and subsidiaries (the “Company”) as of December 31, 2003 and 2002, and the related consolidated statements of earnings, shareholders’ equity and cash flows for each of the three years in the period ended December 31, 2003. These financial statements are the responsibility of the Company's management. Our responsibility is to express an opinion on these financial statements based on our audits.
We conducted our audits in accordance with auditing standards generally accepted in the United States of America. Those standards require that we plan and perform the audit to obtain reasonable assurance about whether the financial statements are free of material misstatement. An audit includes examining, on a test basis, evidence supporting the amounts and disclosures in the financial statements. An audit also includes assessing the accounting principles used and significant estimates made by management, as well as evaluating the overall financial statement presentation. We believe that our audits provide a reasonable basis for our opinion.
In our opinion, such consolidated financial statements present fairly, in all material respects, the financial position of the Company as of December 31, 2003 and 2002, and the results of its operations and its cash flows for each of the three years in the period ended December 31, 2003, in conformity with accounting principles generally accepted in the United States of America.
As discussed in Note 3 to the Consolidated Financial Statements, on January 1, 2002, the Company adopted Statement of Financial Accounting Standards No. 142, “Goodwill and Other Intangible Assets.”
/S/ DELOITTE & TOUCHE |
| Milwaukee, Wisconsin |
February 12, 2004
SENSIENT 2003 annual report | 40 |
QUARTERLY data
IN THOUSANDS EXCEPT PER SHARE AMOUNTS (UNAUDITED) | revenue | gross profit | net earnings | earnings per share basic | earnings per share diluted | ||||||||||
2003 | |||||||||||||||
First Quarter | $ | 235,097 | $ | 77,146 | $ | 20,4622 | $ | .43 | $ | .43 | |||||
Second Quarter | 261,928 | 84,692 | 21,669 | .46 | .46 | ||||||||||
Third Quarter | 247,288 | 79,344 | 20,667 | .44 | .44 | ||||||||||
Fourth Quarter | 243,095 | 70,814 | 18,634 | .40 | .40 | ||||||||||
2002 | |||||||||||||||
First Quarter | $ | 213,123 | $ | 70,277 | $ | 16,945 | $ | .36 | $ | .36 | |||||
Second Quarter | 239,576 | 77,968 | 21,185 | .44 | .44 | ||||||||||
Third Quarter | 237,995 | 79,241 | 20,186 | .43 | .42 | ||||||||||
Fourth Quarter | 249,192 | 79,389 | 22,374 | .47 | .47 | ||||||||||
The fourth quarter of 2003 includes special charges of $6.5 million pre-tax, $4.7 million after-tax or $0.10 per share (see Note 14) and a one-time benefit of $13.3 million pre-tax, $8.2 million after-tax or $0.17 per share for eliminating certain post-retirement programs subsidies (see Note 10).
COMMON STOCK prices and dividends
| market price | dividends per share | ||||||||
| high | low | ||||||||
2003 | |||||||||
First Quarter | $ | 24.26 | $ | 19.30 | $ | .1400 | |||
Second Quarter | 23.35 | 19.80 | .1500 | ||||||
Third Quarter | 23.85 | 20.13 | .1500 | ||||||
Fourth Quarter | 21.96 | 17.86 | .1500 | ||||||
2002 | |||||||||
First Quarter | $ | 23.39 | $ | 18.06 | $ | .1325 | |||
Second Quarter | 25.25 | 22.37 | .1325 | ||||||
Third Quarter | 23.49 | 17.95 | .1325 | ||||||
Fourth Quarter | 25.96 | 19.33 | .1400 | ||||||
| 41 | SENSIENT 2003 annual report |
FIVE YEAR review
IN THOUSANDS EXCEPT EMPLOYEE AND PER SHARE DATA Years ended December 31, | 2003 | ||||||
Summary of Operations | |||||||
Revenue | $ | 987,408 | 100.0 | % | |||
Cost of products sold | 675,412 | 68.4 | |||||
Selling and administrative expenses | 168,036 | 17.0 | |||||
Special charges | 6,476 | 0.7 | |||||
Operating income | 137,484 | 13.9 | |||||
Interest expense | 29,140 | 2.9 | |||||
Earnings from continuing operations before income taxes | 108,344 | 11.0 | |||||
Income taxes | 26,912 | 2.8 | |||||
Earnings from continuing operations | 81,432 | 8.2 | |||||
Earnings from discontinued operations | — | 0.0 | |||||
Accounting change | — | 0.0 | |||||
Net earnings | $ | 81,432 | 8.2 | % | |||
Basic earnings per share | |||||||
Continuing operations | $ | 1.74 | |||||
Discontinued operations | — | ||||||
Accounting change | — | ||||||
Net earnings | $ | 1.74 | |||||
Diluted earnings per share | |||||||
Continuing operations | $ | 1.73 | |||||
Discontinued operations | — | ||||||
Accounting change | — | ||||||
Net earnings | $ | 1.73 | |||||
Other related data | |||||||
Dividends per share, declared and paid | $ | .5900 | |||||
Average common shares outstanding: | |||||||
Basic | 46,741 | ||||||
Diluted | 47,041 | ||||||
Book value per common share | $ | 12.42 | |||||
Price range per common share | 17.86-24.26 | ||||||
Share price at December 31 | 19.77 | ||||||
Capital expenditures for continuing operations | 74,208 | ||||||
Depreciation for continuing operations | 40,385 | ||||||
Amortization for continuing operations | 2,713 | ||||||
Total assets | 1,453,528 | ||||||
Long-term debt | 525,924 | ||||||
Shareholders’ equity | 580,118 | ||||||
Return on average shareholders’ equity | 15.2 | % | |||||
Total debt to total capital | 53.0 | % | |||||
Employees | 3,707 | ||||||
The 2003 results include special charges related to a cost reduction plan of $6.5 million (See Note 14) and a $13.3 million credit related to termination of postretirement health care plan benefits included in selling and administrative expenses (See Note 10).
The 2000 results include special charges related to a facilities consolidation plan of $19.0 million (See Note 14) and a $4.3 million credit related to the effect of a postretirement health care plan amendment included in selling and administrative expenses.
The 2003 and 2002 results exclude amortization of goodwill due to an accounting change. Goodwill amortization, net of tax, was $8.0 million, $8.4 million and $7.0 million in 2001, 2000 and 1999, respectively (see Note 3).
SENSIENT 2003 annual report | 42 |
2002 | 2001 | 2000 | 1999 | |||||||||||||||||||||||
| $ | 939,886 | 100.0 | % | $ | 816,947 | 100.0 | % | $ | 809,163 | 100.0 | % | $ | 796,250 | 100.0 | % | |||||||||||
| 633,011 | 67.3 | 550,331 | 67.3 | 525,717 | 65.0 | 527,598 | 66.3 | |||||||||||||||||||
| 160,380 | 17.1 | 145,126 | 17.8 | 152,253 | 18.8 | 144,387 | 18.1 | |||||||||||||||||||
| — | 0.0 | — | 0.0 | 19,000 | 2.3 | — | 0.0 | |||||||||||||||||||
| 146,495 | 15.6 | 121,490 | 14.9 | 112,193 | 13.9 | 124,265 | 15.6 | |||||||||||||||||||
| 29,523 | 3.1 | 31,531 | 3.9 | 34,165 | 4.3 | 27,425 | 3.4 | |||||||||||||||||||
| 116,972 | 12.5 | 89,959 | 11.0 | 78,028 | 9.6 | 96,840 | 12.2 | |||||||||||||||||||
| 36,282 | 3.9 | 24,996 | 3.0 | 21,681 | 2.6 | 30,329 | 3.8 | |||||||||||||||||||
| 80,690 | 8.6 | 64,963 | 8.0 | 56,347 | 7.0 | 66,511 | 8.4 | |||||||||||||||||||
| — | 0.0 | 8,639 | 1.0 | 3,265 | 0.4 | 15,250 | 1.9 | |||||||||||||||||||
| — | 0.0 | — | 0.0 | 2,431 | 0.3 | — | 0.0 | |||||||||||||||||||
| $ | 80,690 | 8.6 | % | $ | 73,602 | 9.0 | % | $ | 62,043 | 7.7 | % | $ | 81,761 | 10.3 | % | |||||||||||
| $ | 1.70 | $ | 1.36 | $ | 1.15 | $ | 1.32 | |||||||||||||||||||
| — | .18 | .07 | .30 | |||||||||||||||||||||||
| — | — | .05 | — | |||||||||||||||||||||||
| $ | 1.70 | $ | 1.54 | $ | 1.27 | $ | 1.63 | |||||||||||||||||||
| $ | 1.69 | $ | 1.36 | $ | 1.15 | $ | 1.31 | |||||||||||||||||||
| — | .18 | .07 | .30 | |||||||||||||||||||||||
| — | — | .05 | — | |||||||||||||||||||||||
| $ | 1.69 | $ | 1.54 | $ | 1.26 | $ | 1.61 | |||||||||||||||||||
| $ | .5375 | $ | .53 | $ | .53 | $ | .53 | |||||||||||||||||||
| 47,379 | 47,671 | 48,898 | 50,296 | |||||||||||||||||||||||
| 47,788 | 47,926 | 49,166 | 50,791 | |||||||||||||||||||||||
| $ | 10.58 | $ | 9.09 | $ | 8.59 | $ | 8.64 | |||||||||||||||||||
| 17.95-25.96 | 15.55-23.99 | 16.00-23.19 | 18.25-27.38 | |||||||||||||||||||||||
| 22.47 | 20.81 | 22.75 | 20.38 | |||||||||||||||||||||||
| 47,317 | 38,001 | 45,199 | 50,820 | |||||||||||||||||||||||
| 38,899 | 37,019 | 35,507 | 32,709 | |||||||||||||||||||||||
| 2,391 | 9,271 | 10,047 | 8,095 | |||||||||||||||||||||||
| 1,285,685 | 1,108,893 | 1,164,248 | 1,131,713 | |||||||||||||||||||||||
| 511,707 | 423,137 | 417,141 | 380,378 | |||||||||||||||||||||||
| 499,358 | 430,816 | 417,058 | 430,872 | |||||||||||||||||||||||
| 17.3 | % | 17.7 | % | 14.7 | % | 19.4 | % | |||||||||||||||||||
| 52.8 | % | 53.3 | % | 55.7 | % | 52.1 | % | |||||||||||||||||||
| 3,572 | 3,454 | 3,722 | 3,900 | |||||||||||||||||||||||
| 43 | SENSIENT 2003 annual report |
BOARD OF directors
Kenneth P. Manning, 62
Chairman, President and Chief Executive Officer
Sensient Technologies Corporation
Elected Director in 1989 (2, 6)
Michael E. Batten, 63
Chairman and Chief Executive Officer
Twin Disc, Inc.
Elected Director in 1980 (5)
John F. Bergstrom, 57
Chairman and Chief Executive Officer
Bergstrom Corporation
Elected Director in 1994 (1, 2, 3, 4)
Hank Brown, 64
President and Chief Executive Officer
The Daniels Fund
Elected Director in 2004
Fergus M. Clydesdale, Ph.D., 67
Distinguished Professor and Head of the Department of Food Science
University of Massachusetts-Amherst
Elected Director in 1998 (5, 6)
James A.D. Croft, 66
Chairman
Bartlodge Limited
Elected Director in 1997 (1, 3)
Alberto Fernandez, 57
Chairman
Pyosa, S.A. de C.V.
Elected Director in 1999 (1, 6)
William V. Hickey, 59
President and Chief Executive Officer
Sealed Air Corporation
Elected Director in 1997 (1, 2, 4, 5)
Essie Whitelaw, 56
Senior Vice President of Private Sector Claims Administration
Wisconsin Physician Services
Elected Director in 1993 (3, 4)
committees
| 1 | Audit Committee |
| 2 | Executive Committee |
| 3 | Compensation and Development Committee |
| 4 | Nominating Committee |
| 5 | Finance Committee |
| 6 | Scientific Advisory Committee |
CORPORATE officers
Kenneth P. Manning, 62
Chairman, President and Chief Executive Officer
With the Company 16 years
Richard Carney, 53
Vice President - Administration
With the Company 22 years
John L. Hammond, 57
Vice President, Secretary and General Counsel
With the Company 6 years
Richard F. Hobbs, 56
Vice President, Chief Financial Officer and Treasurer
With the Company 30 years
Richard J. Malin, 37
Assistant Treasurer
With the Company 12 years
Charles A. Nicolais, 43
President - Color Group
With the Company less than 1 year
Ralph G. Pickles, 57
President - Flavors & Fragrances Group
With the Company 8 years
Stephen J. Rolfs, 39
Vice President, Controller and Chief Accounting Officer
With the Company 6 years
Ho-Seung Yang, Ph.D., 56
Vice President - Marketing & Technology
With the Company 8 years
APPOINTED officers
Peter Bradley, 44
President, Asia Pacific Group
With the Company 1 year
Neil G. Cracknell, 42
President, Dehydrated Flavors
With the Company 9 years
Christopher L. Lawlor, 53
Vice President, Human Resources
With the Company 3 years
Harry Meggos, 61
Vice President, Technical Service, Color
With the Company 33 years
Robert L. Menzl, 47
Vice President, Information Technology
With the Company 8 years
Lance E. Solter, Ph.D., 58
Vice President, Manufacturing, Color
With the Company 29 years
SENSIENT 2003 annual report | 44 |
INVESTOR information
world headquarters
777 East Wisconsin Avenue
Milwaukee, Wisconsin 53202-5304
(414) 271-6755
(800) 558-9892
Fax: (414) 347-4795
E-mail: corporate.communications@sensient-tech.com
Web site: www.sensient-tech.com
transfer agent and registrar
Wells Fargo Bank Minnesota, N.A.
Shareowner Services
P. O. Box 64854
St. Paul, Minnesota 55164-0854
(800) 468-9716
Web site: www.wellsfargo.com/com/shareowner_services/
common stock
Sensient Technologies Corporation Common Stock is traded on the New York Stock Exchange. Ticker symbol: SXT.
There were 4,130 shareholders of record of Common Stock as of January 31, 2004.
annual meeting of shareholders
The Annual Meeting of Shareholders will be held at 2:00 p.m. (MDT) on Thursday, April 22, 2004, at The Brown Palace Hotel, 321 Seventeenth Street, Denver, Colorado.
form 10-k
The Company’s annual report filed with the Securities and Exchange Commission on Form 10-K is available without charge from the Company’s Investor Relations Department and on its Web site at www.sensient-tech.com.
dividends
Quarterly dividends are typically paid on the first business day of March, June, September and December.
automatic dividend reinvestment plan
The Sensient Technologies Corporation Dividend Reinvestment Plan provides shareholders with a convenient, economical way to increase their ownership of Sensient Technologies Corporation Common Stock. Through the plan, shareholders can automatically reinvest their dividends to acquire additional shares and make supplemental stock purchases without paying fees or commissions. An enrollment form and brochure describing the plan can be obtained by contacting the plan administrator, Wells Fargo Bank Minnesota at (800) 468-9716 or the Company’s Investor Relations Department at (414) 347-3779.
investor relations
Communication concerning the transfer of shares, lost certificates, duplicate mailings, or change of address should be directed to the transfer agent.
Other shareholder information, such as news releases and information regarding corporate governance, is available on the Company’s Web site: www.sensient-tech.com. Shareholders can also register to receive notification via e-mail when new information is added to the site. The Company’s Web address is provided as an inactive textual reference only, and the contents of the Web site are not incorporated in or otherwise to be regarded as part of this annual report.
Other requests for information should be directed to the Company’s Investor Relations Department at (414) 347-3779.
The Company maintains a direct mailing list for news releases and quarterly reports. If you would like your name added to this list, please contact the Company’s Investor Relations Department.

SENSIENT TECHNOLOGIES CORPORATION
777 East Wisconsin Avenue
Milwaukee, Wisconsin 53202-5304
www.sensient-tech.com