Exhibit 13.1

SENSIENT TECHNOLOGIES CORPORATION
is a leading global developer, manufacturer and marketer of colors, flavors and fragrances. Sensient uses advanced, proprietary technologies at facilities around the world to develop specialty food and beverage systems, cosmetic and pharmaceutical systems, inkjet and specialty inks and colors and other specialty chemicals.
| | | | |
CORPORATE Milwaukee, Wisconsin, U.S.A. ASIA PACIFIC Singapore Melbourne, Australia Sydney, Australia Mumbai, India Jakarta, Indonesia Auckland, New Zealand Manila, Philippines Bangkok, Thailand | | FLAVORS & FRAGRANCES Indianapolis, Indiana, U.S.A. Amboy, Illinois, U.S.A. Harbor Beach, Michigan, U.S.A. Juneau, Wisconsin, U.S.A. Greenfield, California, U.S.A. Livingston, California, U.S.A.(2) Turlock, California, U.S.A. Delta, British Columbia, Canada Cornwall, Ontario, Canada Mississauga, Ontario, Canada Rexdale, Ontario, Canada, Tara, Ontario, Canada, Celaya, Mexico Mexico City, Mexico (2) São Paulo, Brazil Brussels, Belgium Heverlee, Belgium Marchais, France Strasbourg, France Bremen, Germany Milan, Italy Elburg, Netherlands Naarden, Netherlands Barcelona, Spain Granada, Spain Kristianstad, Sweden Milton Keynes (Bletchley), U.K. Ceredigion (Felinfach), U.K. Beijing, China Guangzhou, China Hong Kong, China Qingdao, China Shanghai, China Hitachi, Japan Osaka, Japan Tokyo, Japan Seoul, Korea | | COLOR St. Louis, Missouri, U.S.A. Escondido, California, U.S.A. South Plainfield, New Jersey, U.S.A.(2) Kingston, Ontario, Canada Lerma, Mexico Tijuana, Mexico Buenos Aires, Argentina São Paulo, Brazil Prague, Czech Republic Paris, France (2) Hamburg, Germany Leipzig, Germany Budapest, Hungary Reggio Emilia, Italy Warsaw, Poland Oradea, Romania Zenta, Serbia Johannesburg, South Africa Lausanne, Switzerland King’s Lynn, U.K. |
FLAVORS & FRAGRANCES GROUP
Sensient develops, manufactures and distributes flavor and fragrance systems that are found in thousands of consumer products worldwide. The Company’s formulations are essential components of food, beverage, household and personal care products. Sensient’s value-added flavors and fragrances enable our customers to excel in highly competitive markets. The Company’s operations in China and Japan are now part of the Flavors & Fragrances Group.
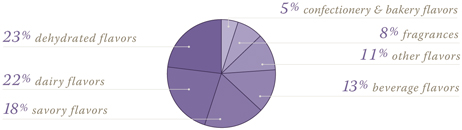
REVENUE BY PRODUCT LINE
COLOR GROUP
Sensient is a leading developer, manufacturer and marketer of natural and synthetic color systems for businesses around the globe. The Company’s high-performance products play an integral role in the manufacture of food and beverages, cosmetics, pharmaceuticals, inkjet and specialty inks and colors, textiles and paper products.
REVENUE BY PRODUCT LINE

TABLE OF CONTENTS
2 Letter to Shareholders 4 Our Markets 14 Financial Review
48 Board of Directors 48 Officersinside back coverInvestor Information
– 1 –

LETTER TO SHAREHOLDERS
In 2005, Sensient Technologies Corporation took action to reposition the Company for higher sales and more cost-effective operations. Our outlook remains excellent.
2005 RESULTS
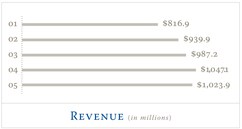
Total 2005 revenue was $1.024 billion. The Company achieved solid revenue growth in flavor and in food and beverage color product lines. Success in several markets was offset by higher raw material and energy costs.
As we contain these costs, we will continue to focus on profit improvement as well as revenue growth. We have identified areas of the business where our cost structure can be significantly reduced, and implemented a cost reduction program. We anticipate that cost reductions will save $10 million in 2006. Our strategy of cost reduction and price increases is aimed at improving earnings.
We are taking other actions to enhance shareholder value, including continuing our share repurchase program. We repurchased 1.1 million shares of Sensient stock in the fourth quarter of 2005. These repurchases represent an excellent investment for the Company and should result in higher returns to our stockholders.
EXPANDING SALES IN FOOD AND BEVERAGE
Sensient’s dedication to innovation in our traditional food and beverage businesses was rewarded in the marketplace in 2005. Sensient’s industry-leading extraction, savory and dehydrated flavor technologies differentiate our products in the marketplace. Traditional flavor sales in North America and Asia increased. Our food and beverage flavor and color revenue in Latin America grew at a healthy pace in 2005. We added new customers in all geographic regions and now provide about 30,000 flavors worldwide.
Color Group profits this year were reduced by lower inkjet ink revenues and higher raw material costs. Nevertheless, profits from food and beverage color product lines were up, reflecting a strong competitive position. The Company develops and markets the widest array of synthetic and natural food color systems available in the world. Our color chemists serve as important product development partners for both established and new customers. Sensient’s country-specific knowledge and technical expertise are providing opportunities in the emerging markets of Central Europe, China and Latin America.
Sensient continues to benefit from product breadth. Gains are expected from our 156 new product introductions in 2006. We provide efficiency and dependability as a unified Company operating under the well-respected and recognized Sensient brand.
GLOBAL PRODUCTS FOR GLOBAL MARKETS
In our industry, Sensient provides a unique combination of regional expertise and global range. We
– 2 –

KENNETH P. MANNING
Chairman, President
and Chief Executive Officer
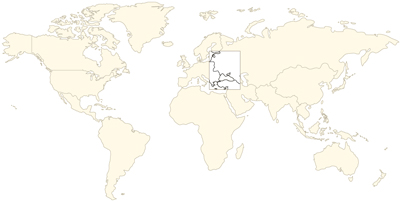
operate from 70 facilities in 30 countries. More than half of our 2005 revenue came from sales outside the U.S.
Sensient’s local knowledge enables us to develop customized products for regional tastes. At the same time, the Company develops high-margin products that enjoy a growing international market. High-performance cosmetics formulations developed primarily at European and U.S. facilities can be found in consumer products in Latin America, China and Australia.
We are also marketing our lines of pharmaceutical colors and coatings all around the globe. Pharmaceuticals play an increasingly important role in health care, and Sensient’s business is expected to grow as a result. China recently updated its national standards for pharmaceutical manufacturing, and Sensient is well positioned to benefit in this market. In addition, we will seek to extend our business in colors for printing on pharmaceuticals.
Cultural, technological and economic changes are creating new global opportunities for Sensient’s industrial colors, inkjet inks and specialty inks. Digital photography continues to replace traditional photography on a global scale, and Sensient provides inks for home and professional photographic printing. We also develop technical colors for a wide range of commercial and industrial applications. Sensient’s technical sophistication enables us to meet the growing demand for printing products that address environmental concerns.
OPPORTUNITIES ON THE HORIZON
The strength of Sensient’s operations is the result of substantial changes that we made in the direction of the Company, beginning about 10 years ago. We divested under-performing domestic operations and expanded into faster-growing, value-added lines of business. I believe that the Company survives today because we had the foresight to exit businesses that offered little, if any, opportunity for growth. Our international presence is also a hallmark of our transformation.
We plan to continue to grow the Company by maximizing our present strengths, including the production capacity of our state-of- the-art facilities.
I expect many opportunities for Sensient on the horizon. I look forward to a great future and continuing success for the Company.
|
| Sincerely, |
|
 |
KENNETH P. MANNING |
Chairman, President and Chief Executive Officer |
– 3 –

Right now in
NORTH AMERICA
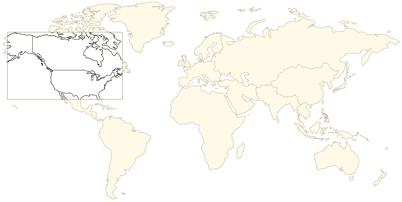
For the North American market, Sensient develops customized technologies preferred by manufacturers of food, beverages, cosmetics, pharmaceuticals and household products and other technology companies. We continue to expand our flavor and color offerings with unique formulations for foods and beverages and specialty chemical applications.

– 4 –
| | |
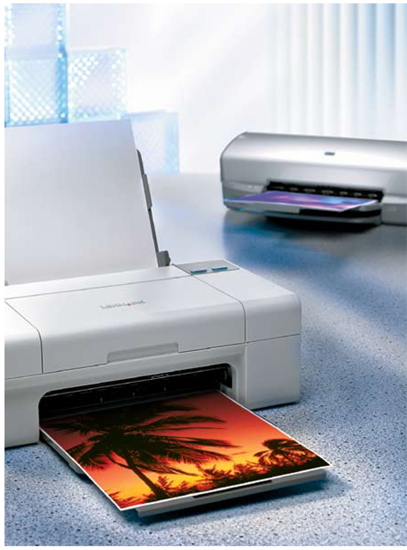
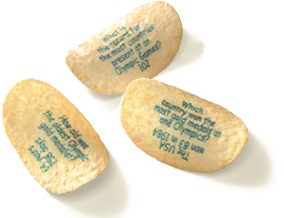 | | The Company’s colors for inkjet inks are found in both consumer and professional digital photo printers manufactured by some of the best-known technology companies. Our inkjet and specialty inks also play an important role in printing on textiles, paper and food products. |
– 5 –

Right now in
WESTERN EUROPE

Sensient’s colors and ingredients for cosmetics supply leading European manufacturers of high-performance beauty products. The Company’s formulations are found in lipstick, foundation, blush and moisturizers sold throughout the continent. The high-margin global cosmetics business continues to offer significant growth opportunities. Sensient also provides color and flavor systems and specialty chemicals to food, beverage and technology companies in Europe.

– 6 –

| | |
 | | At facilities in Western Europe, Sensient’s flavor and color scientists are finding new ways to use natural and synthetic ingredients to formulate innovative products. Our colors and flavors are enabling leading food and beverage manufacturers to enhance their product lines and improve quality. |
– 7 –

Right now in
CENTRAL EUROPE
In Central Europe, Sensient is benefiting from fast-growing markets in new member countries of the European Union. As local manufacturers in Hungary, the Czech Republic, Romania and Poland pursue new ventures, Sensient is supplying them with a wide range of sophisticated products, including confectionery color and flavor systems. We are also drawing on a highly educated local workforce to lead innovation in our Central European facilities.

– 8 –

| | |
 | | Urban consumers in Central Europe are increasingly purchasing manufactured foods, from ice cream to sauces to spice mixes. Sensient’s market-leading natural color and savory flavor technologies are finding favor among local manufacturers and food service companies. |
– 9 –

Right now in
LATIN AMERICA

Sensient’s color and flavor systems, including chiral tropical flavors, are helping Latin American beverage manufacturers provide a wide variety of high-quality products to local markets. Traditionally, many beverages were made with local, fresh ingredients, and today people in Latin America seek similar taste and quality from manufactured beverages. Sensient’s expertise in beverage formulation is helping win new business throughout the region, from Chile to Brazil to Mexico.

– 10 –

| | |
 | | Food processors in Latin America are increasingly turning to Sensient to help them stand out in highly competitive markets. Our value-added color and flavor systems are found in ice cream, meat products, canned foods and seasonings manufactured throughout the region. |
– 11 –

Right now in
ASIA PACIFIC

Sensient is positioned to benefit from cultural change and economic growth in China and the Asia Pacific region. Larger incomes are enabling people in China’s metropolitan centers to purchase high-quality processed foods, including savory soup base made with Sensient dehydrated flavor systems. At facilities in Guangzhou, we offer product development, testing and manufacturing for a variety of goods that appeal to the traditional and emerging tastes of Chinese consumers.

– 12 –

| | |
 | | From colorful dish soaps to delicately flavored teas, Sensient is bringing our global expertise in color purification and flavor extraction to consumer products in China. In the coming years, we expect to increase sales further in China and throughout the Asia Pacific region. |
– 13 –
FINANCIAL REVIEW
TABLE OF CONTENTS
| | |
15 | | MANAGEMENT’S DISCUSSION & ANALYSISOF OPERATIONS & FINANCIAL CONDITION |
25 | | CONSOLIDATED STATEMENTSOF EARNINGS |
26 | | CONSOLIDATED BALANCE SHEETS |
27 | | CONSOLIDATED STATEMENTSOF CASH FLOWS |
28 | | CONSOLIDATED STATEMENTSOF SHAREHOLDERS’ EQUITY |
30 | | NOTESTO CONSOLIDATED FINANCIAL STATEMENTS |
43 | | MANAGEMENT’S REPORTON INTERNAL CONTROL OVER FINANCIAL REPORTING |
43 | | REPORTOF INDEPENDENT REGISTERED PUBLIC ACCOUNTING FIRM |
44 | | REPORTOF INDEPENDENT REGISTERED PUBLIC ACCOUNTING FIRMON INTERNAL CONTROL OVER FINANCIAL REPORTING |
45 | | CHANGEININDEPENDENTREGISTEREDPUBLICACCOUNTINGFIRM |
45 | | QUARTERLY DATA |
45 | | COMMON STOCK PRICESAND DIVIDENDS |
46 | | FIVE YEAR REVIEW |
FINANCIAL HIGHLIGHTS
in thousands except per share, employee and shareholder data
| | | | | | | | | |
Years ended December 31, | | 2005 | | 2004 | | % CHANGE | |
RESULTS OF OPERATIONS | | | | | | | | | |
Revenue | | $ | 1,023,930 | | $ | 1,047,133 | | (2.2 | ) |
Operating Income* | | | 94,214 | | | 129,156 | | (27.1 | ) |
Net Earnings* | | | 44,195 | | | 73,918 | | (40.2 | ) |
| | | | | | | | | |
PER COMMON SHARE | | | | | | | | | |
Net Earnings:* | | | | | | | | | |
Basic | | $ | 0.95 | | $ | 1.59 | | (40.3 | ) |
Diluted | | | 0.94 | | | 1.58 | | (40.5 | ) |
Dividends | | | 0.60 | | | 0.60 | | — | |
Book Value | | | 13.43 | | | 13.99 | | (4.0 | ) |
| | | | | | | | | |
OTHER INFORMATION | | | | | | | | | |
Capital Expenditures | | $ | 36,102 | | $ | 49,845 | | (27.6 | ) |
Depreciation and Amortization | | $ | 46,769 | | $ | 46,243 | | 1.1 | |
Total Debt | | $ | 553,682 | | $ | 615,196 | | (10.0 | ) |
Number of Employees | | | 3,518 | | | 3,728 | | (5.6 | ) |
Number of Shareholders of Record | | | 3,708 | | | 3,954 | | (6.2 | ) |
Average Common Shares Outstanding – Basic | | | 46,746 | | | 46,562 | | 0.4 | |
Average Common Shares Outstanding – Diluted | | | 47,067 | | | 46,877 | | 0.4 | |
| * | The 2005 results include restructuring and other charges of $12.8 million ($9.8 million after tax, or $0.21 per share) related to a cost reduction program and an impairment charge (see Note 11). |
– 14 –
MANAGEMENT’S DISCUSSION & ANALYSIS OF OPERATIONS & FINANCIAL CONDITION
Overview
During 2005, Sensient Technologies Corporation (the “Company”) was adversely affected by increases in raw material and energy costs. In response to these rising costs, the Company initiated a cost reduction program to improve profitability. The restructuring costs associated with the cost reduction program were recorded in the fourth quarter of 2005 and are discussed below. In addition, the Company’s Flavors & Fragrances Group began to recognize benefits from price increases late in 2005. It is expected that these increases and additional increases planned for 2006 will offset the impact of the Group’s higher costs during 2006. Sensient strengthened its competitive position in 2005 and was able to grow its share in certain markets such as food and beverage colors. As a result of the actions taken in 2005, management believes that the Company is positioned to deliver earnings growth in 2006.
The Company recorded restructuring and other charges of $12.8 million ($9.8 million after tax, or $0.21 per share) in the fourth quarter of 2005 related to the previously disclosed cost reduction program. The charges included an impairment charge to write-down the value of a minority investment as a result of a change in plans for that business by its majority shareholder. The cost reduction program also addresses the need to close facilities and reduce head-count in response to lower inkjet ink volumes following the termination of a significant supply agreement discussed below. The program resulted in the closure of two excess manufacturing facilities, a total reduction in global head-count of approximately 140 employees across all segments and the elimination of three product lines. The charges were recorded in cost of products sold ($4.3 million) and in restructuring and other charges ($8.5 million) and are included in the Corporate and Other segment. Savings of approximately $10 million are anticipated in 2006 as a result of this plan.
Revenue for 2005 was $1,023.9 million compared to $1,047.1 million in 2004. The primary reason for the decrease is due to the previously disclosed winding-up of a supply agreement with an original equipment manufacturer at the end of 2004. During 2004, this customer represented approximately $47.5 million of revenue (see Segment Information on Color for additional information).
Sensient’s operating income was $94.2 million in 2005 versus $129.2 million in 2004. The primary factors for the lower operating income in 2005 include the winding-up of the supply agreement in 2004, which contributed approximately $10.3 million of operating income, the 2005 restructuring and other charges ($12.8 million) and the impact of an arbitration order ($4.5 million). Operating income in 2004 also included the benefits of $6.8 million related to the reduction of purchase accounting reserves. Additional information on these items is included above and in Results of Operations. Net earnings in 2005 were $44.2 million versus $73.9 million in 2004. Diluted earnings per share were $0.94, compared to $1.58 per share in 2004.
Results of Operations
2005 vs. 2004
Revenue for 2005 was $1,023.9 million compared to $1,047.1 million in 2004, a decrease of $23.2 million, or 2.2%. Revenue for the Flavors & Fragrances Group in 2005 was $670.6 million, an increase of $22.3 million, or 3.4%, over 2004. Color Group revenue decreased $43.9 million, or 11.4%, from 2004, to $339.9 million for 2005. The Asia Pacific Group increased revenue by 4.3%. Consolidated revenue decreased primarily as a result of decreases in sales of technical colors ($48.6 million) discussed below partially offset by an increase from the impact of favorable exchange rates ($8.1 million) and the increase in sales for Flavors & Fragrances. Additional information on Group results can be found in the Segment Information section.
The Company’s 2005 gross margin decreased 120 basis points to 28.6% from 29.8% in 2004. Approximately 90 basis points of the margin decrease was due to the impact of higher raw material costs in both the Flavors & Fragrances and Color Groups. Approximately 40 basis
– 15 –
MANAGEMENT’S DISCUSSION & ANALYSIS OF OPERATIONS & FINANCIAL CONDITION
points of the decrease related to higher energy costs in the Flavors & Fragrances Group. The $4.3 million portion of the 2005 restructuring charge reported in cost of products sold reduced margins by 40 basis points. Favorable product mix and pricing in the Flavors & Fragrances Group were the primary factors that partially offset these declines.
Selling and administrative expenses as a percent of revenue in 2005 were 18.6% versus 17.5% in 2004. The increase in percentage was a result of an expense recorded in the first quarter of 2005 related to an arbitration order in the matter of Kraft Foods North America, Inc. v. Sensient Colors Inc. ($4.5 million) and the benefits recorded in 2004 from the reduction of purchase accounting reserves ($6.8 million) as a result of lower than expected shut-down costs associated with the closure of two facilities (see Segment Information on Color for additional information).
Operating income in 2005 was $94.2 million compared to $129.2 million in 2004. The 2005 restructuring and other charges discussed above had the net effect of decreasing 2005 operating income by $12.8 million. Favorable exchange rates increased operating income by $2.1 million in 2005 compared to 2004.
Interest expense increased to $35.7 million in 2005 from $31.3 million in 2004. The increase was the result of higher interest rates partially offset by a reduction in average outstanding debt.
The effective income tax rate was 24.4% and 24.5% in 2005 and 2004, respectively. The effective tax rates for both 2005 and 2004 were reduced by discrete items primarily including the favorable resolution of prior years’ tax matters and the reduction of the valuation allowance related to the planned use of foreign tax losses. The 2005 reported rate was increased because certain costs incurred as part of the 2005 restructuring program are not expected to generate a tax benefit. These net discrete items reduced the effective tax rate for 2005 and 2004 by 5.3% and 4.2%, respectively.
| | | | | | |
| | | 2005 | | | 2004 | |
Rate excluding discrete items | | 29.7 | % | | 28.7 | % |
Discrete items | | (6.7 | %) | | (4.2 | %) |
Restructuring and other charges | | 1.4 | % | | — | |
| | | | | | |
Reported effective tax rate | | 24.4 | % | | 24.5 | % |
| | | | | | |
The effective tax rate for 2006 is expected to be approximately 31% prior to the recording of any discrete items.
Segment Information
The Company determines its operating segments based on information utilized by senior management to allocate resources and assess performance. The Company’s reportable segments consist of the Flavors & Fragrances Group and the Color Group. The Asia Pacific Group, which is reported in the Corporate and Other segment, was realigned during the third quarter of 2005. As a result, the Company’s operations in Japan and China, previously included within the Asia Pacific Group, are now reported as part of the Flavors & Fragrances Group. In addition, the sales of dehydrated flavor products within the Asia Pacific region are now included in the Flavors & Fragrances segment. These changes in reporting segments have been reflected in the results for 2005 and other years presented.
FLAVORS & FRAGRANCES Revenue for the Flavors & Fragrances segment in 2005 increased 3.4%, to $670.6 million, over 2004. The increase in revenue is primarily due to higher sales of traditional flavors in North America ($7.0 million) and Latin America ($2.9 million) and higher dehydrated flavors sales ($6.2 million) combined with the favorable impact of exchange rates ($5.7 million).
Gross margin was 24.8% in 2005, a 190 basis point decrease from the 26.7% gross margin in 2004. This change was
– 16 –
Sensient Technologies Corporation2005Annual Report
primarily related to higher raw material, energy and other manufacturing costs in all businesses. Selling prices began to increase late in 2005 and are expected to offset the effect of higher costs in 2006.
Operating income for 2005 was $82.5 million compared to $84.8 million last year. The operating income decrease of $2.3 million was due to lower profit in traditional flavors ($ 3.8 million) and fragrances ($0.8 million) partially offset by improved profit in dehydrated flavors ($0.6 million) and the favorable impact of exchange rates ($1.7 million). The prior year comparison of operating income for the Group is impacted by a $3.0 million write-off of a receivable in the traditional flavor business that occurred in 2004. The decrease in profits from traditional flavors is primarily due to higher raw material, transportation and energy costs. The impact of these factors more than offset the benefit of price increases. The decrease in profit for fragrances was primarily due to higher raw material costs. Operating profit for the dehydrated flavors business improved as price increases more than offset the impact of higher raw material and energy costs. Operating income as a percent of revenue was 12.3%, a decrease of 80 basis points from last year. This change was primarily a result of the reasons provided above.
COLOR The Color segment reported revenue of $339.9 million in 2005, a decrease of $43.9 million, or 11.4%, from 2004. The decrease in revenue was primarily as a result of reduced sales of technical colors ($48.6 million) partially offset by increased food and beverage color sales ($4.1 million) in North America, Latin America and Europe and the favorable impact of exchange rates ($2.0 million). The decrease in sales of technical colors is primarily attributed to the previously disclosed winding-up of a supply agreement with an original equipment manufacturer at the end of 2004 ($47.5 million).
Gross margin for the Color segment was 34.7% in 2005, an increase of 150 basis points from the 33.2% gross margin in 2004. The margin increase was due to improved product mix in part because the sales under the terminated supply agreement mentioned above were at a lower margin than the average margin for the Color segment. Benefits from the restructuring of synthetic dye production which occurred in 2003 and 2004 had a positive impact on margins but were offset by unfavorable raw material costs.
Operating income for 2005 was $54.2 million versus $68.0 million for 2004. Results in 2004 included approximately $10.3 million related to the above-mentioned supply agreement, which ended in December 2004. Results for 2004 also included benefits of $6.8 million related to the reduction of purchase accounting reserves. The reduction of purchase accounting reserves in 2004 was due to lower than expected environmental costs, shutdown costs and inventory-related costs associated with the closure of two manufacturing sites. The unfavorable impact of these two items was partially offset by improved profits from higher sales of food and beverage colors ($6.5 million) and the favorable impact of exchange rates ($0.5 million). Operating income as a percent of revenue was 15.9%, a decrease of 180 basis points from last year. This change was primarily a result of the reasons provided above.
2004 vs. 2003
Revenue for 2004 was $1,047.1 million, an increase of $59.9 million, or 6.1%, over 2003. Revenue for the Flavors & Fragrances Group increased by $38.8 million, or 6.4%, over 2003, to $648.3 million for 2004. The Color Group increased revenue by $23.1 million, or 6.4%, over 2003, to
– 17 –
MANAGEMENT’S DISCUSSION & ANALYSIS OF OPERATIONS & FINANCIAL CONDITION
$383.8 million for 2004. The Asia Pacific Group revenue increased 1.7%. The increase in consolidated revenue was primarily as a result of the favorable impact of exchange rates ($33.0 million), an acquisition ($3.4 million) and increases in sales of flavors in North America and Latin America ($9.9 million) as well as higher sales of technical colors ($7.1 million). Additional information on Group results can be found in the Segment Information section.
The Company’s gross margin decreased 160 basis points to 29.8% in 2004, versus 31.4% in 2003. Approximately one-half of the margin decrease was due to lower pricing in the dehydrated flavors business and in technical colors. The decrease in selling prices was a result of increased competitive activity. The remainder of the decrease primarily related to lower production costs in 2003 from the buildup of inventory in anticipation of manufacturing consolidations at the Company, which were completed in the first half of 2004.
Selling and administrative expenses as a percent of revenue increased to 17.5% in 2004, versus 16.8% in 2003. The increase in percentage was the result of a postretirement credit recorded in 2003 of $13.3 million, partially offset by savings in 2004 from the cost reduction programs initiated in 2003 and 2004. The postretirement credit recorded in 2003 was the result of the Company’s decision to end its subsidy of retiree health care coverage.
Operating income in 2004 was $129.2 million compared to $137.5 million in 2003. Favorable exchange rates increased operating income by $3.5 million compared to 2003. A separately stated charge of $6.5 million recorded in 2003 and the postretirement credit discussed above had the effect of increasing 2003 operating income by a net amount of $6.8 million.
Interest expense increased to $31.3 million in 2004 from $29.1 million in 2003. The increase was primarily the result of higher interest rates.
The effective income tax rate was 24.5% and 24.8% in 2004 and 2003, respectively. The effective tax rates for both 2004 and 2003 were reduced as a result of discrete items, including favorable resolution of certain prior years’ tax matters and the reduction of the valuation allowance related to the planned use of foreign tax losses. These discrete items reduced the effective tax rate for 2004 and 2003 by 4.2% and 6.2%, respectively.
| | | | | | |
| | | 2004 | | | 2003 | |
Rate excluding discrete items | | 28.7 | % | | 31.0 | % |
Discrete items | | (4.2 | %) | | (6.2 | %) |
Reported effective tax rate | | 24.5 | % | | 24.8 | % |

Segment Information
Results for 2004 and 2003 have been restated to reflect the changes in segments noted previously.
FLAVORS & FRAGRANCES For the year ended December 31, 2004, revenue for the Flavors & Fragrances segment increased 6.4%, to $648.3 million. The increase of $38.8 million was primarily as a result of the favorable impact of exchange rates ($21.4 million), higher sales of traditional flavors in North America and Latin America ($ 9.9 million) and higher fragrance sales due to the expansion in the aroma chemical product line ($2.3 million).
Gross margin was 26.7% in 2004, a 50 basis point decrease from the 27.2% gross margin in 2003. This change was primarily a result of more competitive pricing in the dehydrated flavors business.
Operating income for 2004 was $84.8 million compared to $86.7 million in 2003. The decrease in operating income was primarily attributable to two events. In the fourth quarter of 2004, operating income was reduced by the write-off of a $3.0 million receivable related to a previously divested product line. The $2.9 million postretirement
– 18 –
Sensient Technologies Corporation2005Annual Report
credit recorded in the fourth quarter of 2003 also unfavorably impacted comparability. In addition to these items, operating income was impacted by favorable product mix and increased sales of traditional flavors in North America ($ 8.6 million) and the favorable impact of exchange rates ($1.3 million), partially offset by lower profits in the dehydrated flavors business due to lower pricing ($3.7 million), and lower profits in fragrances due to lower pricing and higher costs of production ($3.1 million). Operating income as a percent of revenue was 13.1%, a decrease of 110 basis points from 2003. This change was primarily a result of the reasons provided above.
COLOR For the year ended December 31, 2004, revenue for the Color segment increased 6.4% to $383.8 million. The increase in revenue was primarily due to the favorable impact of exchange rates ($11.9 million) and an acquisition ($3.4 million) combined with revenue increases in technical colors ($7.1 million), cosmetic colors ($4.8 million) and pharmaceuticals ($1.0 million). These revenue increases were partially offset by lower volumes and prices in food and beverage colors ($5.2 million). Cosmetic colors and pharmaceuticals each showed double-digit growth. Within technical colors, revenue related to inkjet ink products increased in advance of the wind-up of a supply agreement by a major customer. The customer decided to consolidate inkjet ink purchases with other suppliers, but increased purchases in advance of the changeover. During 2004, this customer represented 12% or approximately $47.5 million and 15% or approximately $10.3 million of Sensient’s Color Group total revenue and operating income, respectively. The increase in sales to this customer was offset by lower sales of technical colors due to competitive pressures reducing pricing and volume.
Gross margin was 33.2% in 2004, a 340 basis point decrease from Color’s 36.6% gross margin in 2003. Approximately one-half of this change was a result of more competitive pricing in synthetic colors and in technical colors. The remainder of the decrease was related primarily to lower production costs in 2003 from the buildup of inventory in anticipation of manufacturing consolidations at the Company, which were completed in the first half of 2004.

Operating income for 2004 was $68.0 million versus $71.6 million for 2003. The $3.6 million decrease in operating income was the result of several factors. These factors include the $1.1 million post-retirement credit recorded in 2003, declines in the food and beverage colors business in North America and Europe ($7.2 million and $2.7 million, respectively) and lower margins from the paper/industrial colors business ($3.6 million). These lower margins were attributable to pricing declines and a change in product mix to lower-margin products. These items were partially offset by continued growth in the cosmetic color business ($1.2 million), the reduction of purchase accounting reserves ($6.8 million) and the favorable impact of exchange rates ($2.0 million) and acquisitions ($0.8 million). The reduction of purchase accounting reserves was related to lower than expected environmental costs, shutdown costs and inventory-related costs associated with the closure of two manufacturing sites. Operating income as a percent of revenue was 17.7%, a decrease of 220 basis points from 2003. This change was primarily a result of the reasons provided above.
– 19 –
MANAGEMENT’S DISCUSSION & ANALYSIS OF OPERATIONS & FINANCIAL CONDITION
Liquidity and Financial Position
The Company’s financial position remains strong, enabling it to meet cash requirements for operations, capital expansion programs and dividend payments to shareholders. The Company intends to fund working capital requirements, principal and interest payments, acquisitions (if any) and other liabilities with cash provided by operations, to the extent available, and short-term and long-term borrowings under new and existing credit facilities. The Company intends to finance current maturities of long-term debt of $207.3 million by using existing bank facilities and by utilizing new sources of financing with banks and other financial institutions.
In the Consolidated Statements of Cash Flows, the changes in operating assets and liabilities are presented excluding the effects of changes in foreign currency exchange rates, as these do not reflect actual cash flows. Accordingly, the amounts in the Consolidated Statements of Cash Flows do not agree with changes in the operating assets and liabilities that are presented in the Consolidated Balance Sheets.
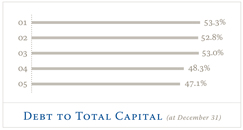
The Company’s ratio of debt to total capital improved to 47.1% at December 31, 2005, compared to 48.3% and 53.0% at December 31, 2004 and 2003, respectively. The improvement resulted primarily from a reduction in debt. Debt was reduced $61.5 million since December 31, 2004, and over $100 million since December 31, 2003. The reduction of debt resulted from strong net cash provided by operating activities.
Net cash provided by operating activities was $110.3 million in 2005, $125.7 million in 2004 and $56.5 million in 2003. Operating cash flow provided the primary source of funds to finance operating needs, capital expenditures, share repurchases and shareholder dividends, and to reduce net borrowings. The decrease in net cash provided by operating activities in 2005 was primarily due to lower net earnings.
Net cash used in investing activities was $34.0 million in 2005, $44.8 million in 2004 and $85.2 million in 2003. Cash proceeds from the sale of assets were $1.1 million in 2005, $2.0 million in 2004 and $8.2 million in 2003. Capital expenditures were $36.1 million in 2005, $49.8 million in 2004 and $74.2 million in 2003. Capital expenditures decreased in 2005 and 2004 primarily due to the completion of several large facility improvements and the integration of certain acquired companies. Net cash used in investing activities in 2003 also included $19.3 million for the acquisitions of a manufacturer and marketer of specialty inks in Spain and a Japanese flavor producer.
Net cash used in financing activities was $71.2 million in 2005 and $83.5 million in 2004, compared to net cash provided of $28.4 million in 2003. The Company had net reductions in debt of $28.5 million in 2005 and $59.7 million in 2004, versus net borrowings of $69.7 million in 2003. In 2005 and 2004, the Company’s net cash provided by operating activities was more than adequate to finance capital expenditures, share repurchases and dividend payments.
On August 18, 2005, the Company amended its unsecured revolving credit facility which increased the available credit to $225 million from $150 million and extended the term to August 2010. At December 31, 2005, the Company had outstanding commercial paper backed by the revolving credit facility of $50.9 million and no direct borrowings under the facility. The Company has available credit facilities with domestic and foreign banks for various purposes. The amount of unused credit facilities at December 31, 2005, was $217.3 million. Additional information on the amended facility and the Company’s borrowings and available credit is included in Note 4 to the Consolidated Financial Statements. The Company maintains debt levels it considers prudent based on its cash flows, interest coverage and percentage of total debt to total capital.
– 20 –
Sensient Technologies Corporation2005Annual Report
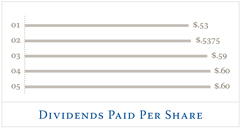
The Company has paid uninterrupted quarterly cash dividends since commencing public trading in its stock in 1962. In 2005 and 2004, dividends paid per share were $0.60 each year, or $28.3 million and $28.1 million, respectively.
With the exception of the increase in energy and raw material costs discussed above, the impact of inflation on both the Company’s financial position and its results of operations has been minimal and is not expected to adversely affect 2006 results.
Issuer Purchases of Equity Securities
During 2005, the Company repurchased 1.1 million shares of Company stock at a total cost of $18.9 million. The Company did not repurchase any shares of Company stock during 2004. During 2003, the Company repurchased 0.9 million shares at a cost of $17.9 million. On April 27, 2001, the Board approved a share repurchase program under which the Company is authorized to repurchase up to 5.0 million shares of Company stock in addition to amounts remaining from prior Board authorizations. As of December 31, 2005, 3.2 million shares were authorized to be repurchased. The Company’s share repurchase program has no expiration date.
Critical Accounting Policies
In preparing the financial statements in accordance with accounting principles generally accepted in the U.S., management is required to make estimates and assumptions that have an impact on the assets, liabilities, revenue and expense amounts reported. These estimates can also affect supplemental information disclosures of the Company, including information about contingencies, risk and financial condition. The Company believes, given current facts and circumstances, that its estimates and assumptions are reasonable, adhere to accounting principles generally accepted in the U.S. and are consistently applied. Inherent in the nature of an estimate or assumption is the fact that actual results may differ from estimates and estimates may vary as new facts and circumstances arise. The Company makes routine estimates and judgments in determining the net realizable value of accounts receivable, inventories, property, plant and equipment, and prepaid expenses. Management believes the Company’s most critical accounting estimates and assumptions are in the following areas:
REVENUE RECOGNITION The Company recognizes revenue, net of estimated discounts, allowances and returns, upon shipment of goods to customers, at which time title passes, the customer is obligated to pay the Company, and the Company has no remaining obligations.
GOODWILL VALUATION The Company reviews the carrying value of goodwill annually utilizing several valuation methodologies, including a discounted cash flow model. Changes in estimates of future cash flows caused by items such as unforeseen events or changes in market conditions could negatively affect the reporting segment’s fair value and result in an impairment charge. However, the current fair values of the reporting segments are significantly in excess of carrying values. The Company estimates that a 100 basis point increase in its weighted average cost of capital would not result in impairment. Accordingly, management believes that only significant changes in its cash flow assumptions would result in impairment.
INCOME TAXESThe Company estimates its income tax expense in each of the taxing jurisdictions in which it operates. The Company is subject to a tax audit in each of these jurisdictions, which could result in changes to the estimated tax expense. The amount of these changes would vary by jurisdiction and would be recorded when known. These changes could impact the Company’s financial statements. Management has recorded valuation allowances to reduce its deferred tax assets to the amount that is more likely than not to be realized. In doing so, management has considered future taxable income and ongoing tax planning strategies in assessing the need for the valuation allowance. An adjustment to the recorded valuation allowance as a result of changes in facts or circumstances could result in a significant change in the Company’s tax expense.
– 21 –
MANAGEMENT’S DISCUSSION & ANALYSIS OF OPERATIONS & FINANCIAL CONDITION
COMMITMENTSAND CONTINGENCIES The Company is subject to litigation and other legal proceedings arising in the ordinary course of its businesses or arising under provisions related to the protection of the environment. Estimating liabilities and costs associated with these matters requires the judgment of management, which relies in part on information from Company counsel. When it is probable that the Company has incurred a liability associated with claims or pending or threatened litigation matters and the Company’s exposure is reasonably estimable, the Company records a charge against earnings. The estimate of any exposure to the Company may change as further facts and circumstances become known.
Market Risk Factors
The Company is exposed to market risks, including changes in interest rates, currency exchange rates and commodity prices. To manage the volatility relating to these exposures on a consolidated basis, the Company nets the exposures to take advantage of natural offsets. The Company also enters into various derivative transactions for some of the remaining exposures pursuant to the Company’s policies covering hedging practices. The financial impacts of these hedging instruments are offset by corresponding changes in the underlying exposures being hedged.
The Company does not hold or issue derivative financial instruments for trading purposes. Note 1 and Note 5 to the Consolidated Financial Statements include a discussion of the Company’s accounting policies for financial instruments.
A key part of the Company’s strategy is to expand into new geographic markets. Because the Company manufactures and sells its products throughout the world, it is exposed to movements in foreign currency exchange rates. The major foreign currency exposures involve the markets in Western Europe, Mexico and Canada. The primary purpose of the Company’s foreign currency hedging activities is to protect against the volatility associated with foreign currency sales, purchases of materials and other assets and liabilities created during the normal course of business. The Company utilizes foreign exchange contracts with durations of generally less than 12 months that qualify as cash flow hedges under Statement of Financial Accounting Standards (“SFAS”) No. 133, “Accounting for Derivative Instruments and Hedging Activities,” as amended. At December 31, 2005 and 2004, the fair values of these instruments, based on dealer quotes, were an asset of $0.1 million and a liability of $0.7 million, respectively. At December 31, 2005 and 2004, the potential gain or loss in the fair value of the Company’s outstanding foreign exchange contracts, assuming a hypothetical 10% fluctuation in the currencies of such contracts, would be approximately $2.2 million and $4.7 million, respectively. However, any change in the value of the contracts, real or hypothetical, would be significantly offset by an equivalent change in the value of the underlying hedged items. In addition, this hypothetical calculation assumes that each exchange rate would change in the same direction relative to the U.S. dollar.
The Company has certain long-term debt denominated in Swiss Francs, Euros and British Pounds. These non-derivative debt instruments have been designated as partial hedges of the Company’s Swiss Franc, Euro and British Pound net asset positions. The potential increase or decrease in the annual U.S. dollar interest expense of the Company’s outstanding foreign currency-denominated debt, assuming a hypothetical 10% fluctuation in the currencies of such debt, would be approximately $1.0 million and $1.1 million at December 31, 2005 and 2004, respectively. However, any change in interest expense from fluctuations in currency, real or hypothetical, would be offset by an equivalent change in the value of the foreign income before interest. In addition, this hypothetical calculation assumes that each exchange rate would change in the same direction relative to the U.S. dollar.
– 22 –
Sensient Technologies Corporation2005Annual Report
The Company manages its debt structure and interest rate risk through the use of fixed rate and floating rate debt and through the use of derivatives. The Company’s primary exposure is to interest rates in the U.S. and Western Europe. The Company may use interest rate swaps to hedge its exposure to interest rate changes, manage the level of fixed and floating interest exposure and lower its financing costs. During 2003 and 2002, the Company entered into a series of interest rate swap agreements to manage the mix of fixed and floating interest rate debt. In October 2003 and September 2005, the Company settled all of the outstanding swap agreements. At December 31, 2005, there were no outstanding interest rate swaps. At December 31, 2004, the notional principal amounts of outstanding interest rate swap agreements were $177.1 million with varying maturities through 2011. These instruments were accounted for as fair value hedges under SFAS No. 133. The fair value of the swaps at December 31, 2004, based on dealer quotes, was an asset of $2.6 million, which was recorded in the other assets line on the consolidated balance sheets. The potential gain or loss in the fair value of the outstanding interest rate swaps at December 31, 2004, assuming a hypothetical 10% fluctuation in interest rates of such contracts, would be approximately $2.9 million. At December 31, 2005 and 2004, the potential increase or decrease in annual interest expense, assuming a hypothetical 10% fluctuation in interest rates of floating rate debt, including the impact of swap contracts, would be approximately $0.3 million and $0.7 million, respectively.
The Company is the purchaser of certain commodities such as corn, sugar, soybean meal and fruits. The Company generally purchases these commodities based upon market prices that are established with the vendor as part of the purchase process. In general, the Company does not use commodity financial instruments to hedge commodity prices due to a high correlation between the commodity cost and the ultimate selling price of the Company’s products. On occasion, the Company may enter into non-cancelable forward purchase contracts, as deemed appropriate, to reduce the effect of price fluctuations on future manufacturing requirements.
Contractual Obligations
The Company is subject to certain contractual obligations, including long-term debt, operating leases, manufacturing purchases and pension benefit obligations. The following table summarizes the Company’s significant contractual obligations as of December 31, 2005.
Payments due by period
| | | | | | | | | | | | | | | |
(in Thousands) | | TOTAL | | £1 YEAR | | 2-3 YEARS | | 4-5 YEARS | | >5 YEARS |
Long-term debt | | $ | 490,464 | | $ | 207,341 | | $ | 97,225 | | $ | 181,222 | | $ | 4,676 |
Interest payments on long-term debt | | | 61,467 | | | 27,612 | | | 29,134 | | | 4,592 | | | 129 |
Operating lease obligations | | | 26,544 | | | 7,650 | | | 9,168 | | | 4,392 | | | 5,334 |
Manufacturing purchase commitments | | | 56,810 | | | 30,419 | | | 15,055 | | | 11,336 | | | — |
Pension benefit obligations | | | 30,506 | | | 1,590 | | | 8,352 | | | 6,864 | | | 13,700 |
| | | | | | | | | | | | | | | |
Total contractual obligations | | $ | 665,791 | | $ | 274,612 | | $ | 158,934 | | $ | 208,406 | | $ | 23,839 |
| | | | | | | | | | | | | | | |
– 23 –
MANAGEMENT’S DISCUSSION & ANALYSIS OF OPERATIONS & FINANCIAL CONDITION
New Pronouncements
In December 2004, the Financial Accounting Standards Board (“FASB”) issued Statement No. 123 (revised 2004), “Stock Based Compensation.” The statement will require the Company to expense its stock options and restricted stock over the requisite service period based on the fair value at the date of grant. This statement is effective for the Company on January 1, 2006. The Company will adopt the statement using the modified prospective method. The impact of adoption of the revised statement in 2006 is anticipated to reduce net earnings by approximately $1.3 million to $1.7 million (approximately $0.03 per share). The actual impact on net earnings in 2006 will depend on a number of factors, including the amount of the awards granted and the fair value of those awards at the time of the grant.
Off-Balance Sheet Arrangements
The Company had no off-balance sheet arrangements as of December 31, 2005.
Forward-looking Statements
This document contains forward-looking statements that reflect management’s current assumptions and estimates of future economic circumstances, industry conditions, Company performance and financial results. Forward- looking statements include statements in the future tense, statements referring to any period after December 31, 2005, and statements including the terms “expect,” “believe,” “anticipate” and other similar terms that express expectations as to future events or conditions. The Private Securities Litigation Reform Act of 1995 provides a safe harbor for such forward-looking statements. Such forward-looking statements are not guarantees of future performance and involve known and unknown risks, uncertainties and other factors that could cause actual events to differ materially from those expressed in those statements. A variety of factors could cause the Company’s actual results and experience to differ materially from the anticipated results. These factors and assumptions include the pace and nature of new product introductions by the Company’s customers; results of acquired businesses; the Company’s ability to successfully implement its growth strategies; the outcome of the Company’s various productivity-improvement and cost-reduction efforts; changes in costs of raw materials and energy; industry and economic factors related to the Company’s domestic and international business; competition from other suppliers of color and flavors and fragrances; growth or contraction in markets for products in which the Company competes; terminations and other changes in customer relationships; industry acceptance of price increases; currency exchange rate fluctuations; and the matters discussed above including the critical accounting policies described therein. The Company does not undertake to publicly update or revise its forward-looking statements even if experience or future changes make it clear that any projected results expressed or implied therein will not be realized.
– 24 –
| | |
| CONSOLIDATED STATEMENTS OF EARNINGS | | Sensient Technologies Corporation2005 Annual Report |
| | | | | | | | | |
(in thousands except per share amounts) Years ended December 31, | | 2005 | | 2004 | | 2003 |
REVENUE | | $ | 1,023,930 | | $ | 1,047,133 | | $ | 987,209 |
Cost of products sold (includes restructuring charges of $4,340 in 2005 – see Note 11) | | | 731,253 | | | 734,596 | | | 677,414 |
Selling and administrative expenses | | | 189,998 | | | 183,381 | | | 165,835 |
Restructuring and other charges (see Note 11) | | | 8,465 | | | — | | | 6,476 |
| | | | | | | | | |
OPERATING INCOME | | | 94,214 | | | 129,156 | | | 137,484 |
Interest expense | | | 35,737 | | | 31,265 | | | 29,140 |
| | | | | | | | | |
EARNINGS BEFORE INCOME TAXES | | | 58,477 | | | 97,891 | | | 108,344 |
Income taxes | | | 14,282 | | | 23,973 | | | 26,912 |
| | | | | | | | | |
NET EARNINGS | | $ | 44,195 | | $ | 73,918 | | $ | 81,432 |
| | | | | | | | | |
Earnings per share | | | | | | | | | |
Basic | | $ | .95 | | $ | 1.59 | | $ | 1.74 |
Diluted | | $ | .94 | | $ | 1.58 | | $ | 1.73 |
Average common shares outstanding – basic | | | 46,746 | | | 46,562 | | | 46,741 |
Average common shares outstanding – diluted | | | 47,067 | | | 46,877 | | | 47,041 |
See notes to consolidated financial statements.
– 25 –
| | |
| CONSOLIDATED BALANCE SHEETS | | |
| | | | | | | | |
(in thousands except share and per share amounts) December 31, | | 2005 | | | 2004 | |
ASSETS | | | | | | | | |
Current Assets: | | | | | | | | |
Cash and cash equivalents | | $ | 7,068 | | | $ | 2,243 | |
Trade accounts receivable, less allowance for losses of $7,327 and $6,629, respectively | | | 163,724 | | | | 172,912 | |
Inventories | | | 313,513 | | | | 328,191 | |
Prepaid expenses and other current assets | | | 23,188 | | | | 24,886 | |
Deferred income taxes | | | 12,851 | | | | 8,012 | |
| | | | | | | | |
Total current assets | | | 520,344 | | | | 536,244 | |
Other assets | | | 63,384 | | | | 66,352 | |
Intangible assets – at cost, less accumulated amortization of $6,223 and $4,794, respectively | | | 14,964 | | | | 17,904 | |
Goodwill | | | 420,201 | | | | 452,427 | |
Property, Plant and Equipment: | | | | | | | | |
Land | | | 33,351 | | | | 33,203 | |
Buildings | | | 235,802 | | | | 230,488 | |
Machinery and equipment | | | 535,655 | | | | 530,922 | |
Construction in progress | | | 13,779 | | | | 40,446 | |
| | | | | | | | |
| | | 818,587 | | | | 835,059 | |
Less accumulated depreciation | | | (439,207 | ) | | | (419,408 | ) |
| | | | | | | | |
| | | 379,380 | | | | 415,651 | |
| | | | | | | | |
Total assets | | $ | 1,398,273 | | | $ | 1,488,578 | |
| | | | | | | | |
LIABILITIESAND SHAREHOLDERS’ EQUITY | | | | | | | | |
Current Liabilities: | | | | | | | | |
Trade accounts payable | | $ | 77,080 | | | $ | 75,066 | |
Accrued salaries, wages and withholdings from employees | | | 15,249 | | | | 13,591 | |
Other accrued expenses | | | 57,589 | | | | 58,133 | |
Income taxes | | | 21,610 | | | | 18,392 | |
Short-term borrowings | | | 63,218 | | | | 69,774 | |
Current maturities of long-term debt | | | 207,341 | | | | 20,269 | |
| | | | | | | | |
Total current liabilities | | | 442,087 | | | | 255,225 | |
Deferred income taxes | | | 4,881 | | | | 10,470 | |
Other liabilities | | | 3,974 | | | | 4,461 | |
Accrued employee and retiree benefits | | | 41,980 | | | | 34,571 | |
Long-term debt | | | 283,123 | | | | 525,153 | |
Commitments and contingencies | | | — | | | | — | |
Shareholders’ Equity: | | | | | | | | |
Common stock, par value $.10 a share, authorized 100,000,000 shares; issued 53,954,874 shares | | | 5,396 | | | | 5,396 | |
Additional paid-in capital | | | 71,582 | | | | 72,117 | |
Earnings reinvested in the business | | | 736,544 | | | | 720,625 | |
Treasury stock, 7,620,068 and 6,887,161 shares, respectively, at cost | | | (152,727 | ) | | | (140,507 | ) |
Unearned portion of restricted stock | | | (5,965 | ) | | | (5,500 | ) |
Accumulated other comprehensive (loss) income | | | (32,602 | ) | | | 6,567 | |
| | | | | | | | |
| | | 622,228 | | | | 658,698 | |
| | | | | | | | |
Total liabilities and shareholders’ equity | | $ | 1,398,273 | | | $ | 1,488,578 | |
| | | | | | | | |
See notes to consolidated financial statements.
– 26 –
| | |
| CONSOLIDATED STATEMENTS OF CASH FLOWS | | Sensient Technologies Corporation2005 Annual Report |
| | | | | | | | | | | | |
(in thousands) Years ended December 31, | | 2005 | | | 2004 | | | 2003 | |
CASH FLOWSFROM OPERATING ACTIVITIES | | | | | | | | | | | | |
Net earnings | | $ | 44,195 | | | $ | 73,918 | | | $ | 81,432 | |
Adjustments to arrive at net cash provided by operating activities: | | | | | | | | | | | | |
Depreciation and amortization | | | 46,769 | | | | 46,243 | | | | 43,098 | |
Restructuring and other charges | | | 5,390 | | | | — | | | | 6,476 | |
Gain on sale of assets | | | (389 | ) | | | (437 | ) | | | (4,368 | ) |
Changes in operating assets and liabilities (net of effects from acquisition of businesses): | | | | | | | | | | | | |
Trade accounts receivable | | | 8,941 | | | | 3,999 | | | | 1,236 | |
Inventories | | | (616 | ) | | | 1,186 | | | | (31,334 | ) |
Prepaid expenses and other assets | | | (3,460 | ) | | | (7,542 | ) | | | (13,240 | ) |
Accounts payable and other accrued expenses | | | 6,285 | | | | (284 | ) | | | (6,447 | ) |
Accrued salaries, wages and withholdings from employees | | | 2,302 | | | | 108 | | | | (2,407 | ) |
Income taxes | | | 4,050 | | | | 6,306 | | | | (9,270 | ) |
Deferred income taxes | | | (10,105 | ) | | | 4,738 | | | | 10,538 | |
Other liabilities | | | 6,928 | | | | (2,503 | ) | | | (19,171 | ) |
| | | | | | | | | | | | |
Net cash provided by operating activities | | | 110,290 | | | | 125,732 | | | | 56,543 | |
| | | | | | | | | | | | |
CASH FLOWSFROM INVESTING ACTIVITIES | | | | | | | | | | | | |
Acquisition of property, plant and equipment | | | (36,102 | ) | | | (49,845 | ) | | | (74,208 | ) |
Acquisition of businesses – net of cash acquired | | | — | | | | — | | | | (19,307 | ) |
Proceeds from sale of assets | | | 1,101 | | | | 2,016 | | | | 8,223 | |
Decrease in other assets | | | 1,033 | | | | 3,065 | | | | 112 | |
| | | | | | | | | | | | |
Net cash used in investing activities | | | (33,968 | ) | | | (44,764 | ) | | | (85,180 | ) |
| | | | | | | | | | | | |
CASH FLOWSFROM FINANCING ACTIVITIES | | | | | | | | | | | | |
Proceeds from additional borrowings | | | 80,652 | | | | 199,760 | | | | 121,761 | |
Debt and capital lease payments | | | (109,163 | ) | | | (259,420 | ) | | | (52,044 | ) |
Purchase of treasury stock | | | (18,005 | ) | | | — | | | | (17,931 | ) |
Dividends paid | | | (28,276 | ) | | | (28,096 | ) | | | (28,154 | ) |
Proceeds from options exercised and other equity transactions | | | 3,630 | | | | 4,213 | | | | 4,809 | |
| | | | | | | | | | | | |
Net cash (used in) provided by financing activities | | | (71,162 | ) | | | (83,543 | ) | | | 28,441 | |
| | | | | | | | | | | | |
Effect of exchange rate changes on cash and cash equivalents | | | (335 | ) | | | 1,568 | | | | 1,343 | |
| | | | | | | | | | | | |
Net increase (decrease) in cash and cash equivalents | | | 4,825 | | | | (1,007 | ) | | | 1,147 | |
Cash and cash equivalents at beginning of year | | | 2,243 | | | | 3,250 | | | | 2,103 | |
| | | | | | | | | | | | |
Cash and cash equivalents at end of year | | $ | 7,068 | | | $ | 2,243 | | | $ | 3,250 | |
| | | | | | | | | | | | |
Cash paid during the year for: | | | | | | | | | | | | |
Interest | | $ | 34,816 | | | $ | 30,788 | | | $ | 29,544 | |
Income taxes | | | 16,850 | | | | 13,870 | | | | 23,482 | |
Liabilities assumed in acquisitions | | | — | | | | — | | | �� | 992 | |
Capitalized interest | | | 908 | | | | 1,152 | | | | 2,081 | |
| | | | | | | | | | | | |
See notes to consolidated financial statements.
– 27 –
|
| CONSOLIDATED STATEMENTS OF SHAREHOLDERS’ EQUITY |
| | | | | | | |
(in thousands except share and per share amounts) | | COMMON
STOCK | | ADDITIONAL
PAID-IN
CAPITAL | |
BALANCESAT DECEMBER 31, 2002 | | $ | 5,396 | | $ | 72,390 | |
Net earnings | | | | | | | |
Unrealized gain on cash flow hedges, arising during the period, net of tax of $1,809 | | | | | | | |
Reclassification adjustment for cash flow hedges included in net income, net of tax of $ 1,633 | | | | | | | |
Minimum pension liability, net of tax of $52 | | | | | | | |
Foreign currency translation | | | | | | | |
Total comprehensive income | | | | | | | |
Cash dividends paid – $.59 a share | | | | | | | |
Redemption of rights – $.01 a share | | | | | | | |
Stock options exercised | | | | | | (285 | ) |
Benefit plans | | | | | | 216 | |
Restricted stock | | | | | | (127 | ) |
Purchase of treasury stock | | | | | | | |
Other | | | | | | | |
| | | | | | | |
BALANCESAT DECEMBER 31, 2003 | | | 5,396 | | | 72,194 | |
Net earnings | | | | | | | |
Unrealized gain on cash flow hedges, arising during the period, net of tax of $205 | | | | | | | |
Reclassification adjustment for cash flow hedges included in net income, net of tax of $223 | | | | | | | |
Minimum pension liability, net of tax of $418 | | | | | | | |
Foreign currency translation | | | | | | | |
Total comprehensive income | | | | | | | |
Cash dividends paid – $.60 a share | | | | | | | |
Stock options exercised | | | | | | (378 | ) |
Benefit plans | | | | | | (2 | ) |
Restricted stock | | | | | | 302 | |
Other | | | | | | 1 | |
| | | | | | | |
BALANCESAT DECEMBER 31, 2004 | | | 5,396 | | | 72,117 | |
Net earnings | | | | | | | |
Unrealized gain on cash flow hedges, arising during the period, net of tax of $529 | | | | | | | |
Reclassification adjustment for cash flow hedges included in net income, net of tax of $598 | | | | | | | |
Minimum pension liability, net of tax of $2,162 | | | | | | | |
Foreign currency translation | | | | | | | |
Total comprehensive income | | | | | | | |
Cash dividends paid – $.60 a share | | | | | | | |
Stock options exercised | | | | | | (350 | ) |
Benefit plans | | | | | | 39 | |
Restricted stock | | | | | | (223 | ) |
Purchase of treasury stock | | | | | | | |
Other | | | | | | (1 | ) |
| | | | | | | |
BALANCESAT DECEMBER 31, 2005 | | $ | 5,396 | | $ | 71,582 | |
| | | | | | | |
See notes to consolidated financial statements.
– 28 –
| | |
| | Sensient Technologies Corporation 2005 Annual Report |
| | | | | | | | | | | | | | | | | | | |
EARNINGS
REINVESTED IN THE
BUSINESS | | TREASURY STOCK | | | UNEARNED
PORTION OF
RESTRICTED
STOCK | | | ACCUMULATED
OTHER
COMPREHENSIVE
(LOSS) INCOME | | | TOTAL
COMPREHENSIVE
INCOME (LOSS) | |
| | SHARES | | | AMOUNT | | | | |
| $621,525 | | 6,746,164 | | | $ | (137,074 | ) | | $ | (2,951 | ) | | $ | (59,928 | ) | | | | |
| 81,432 | | | | | | | | | | | | | | | | | $ | 81,432 | |
| | | | | | | | | | | | | | 16,330 | | | | 16,330 | |
| | | | | | | | | | | | | | (14,741 | ) | | | (14,741 | ) |
| | | | | | | | | | | | | | (84 | ) | | | (84 | ) |
| | | | | | | | | | | | | | 37,464 | | | | 37,464 | |
| | | | | | | | | | | | | | | | | | | |
| | | | | | | | | | | | | | | | | $ | 120,401 | |
| | | | | | | | | | | | | | | | | | | |
| (27,688) | | | | | | | | | | | | | | | | | | | |
| (466) | | | | | | | | | | | | | | | | | | | |
| | (235,004 | ) | | | 4,781 | | | | | | | | | | | | | |
| | (108,307 | ) | | | 2,201 | | | | | | | | | | | | | |
| | (89,200 | ) | | | 1,821 | | | | (893 | ) | | | | | | | | |
| | 856,000 | | | | (17,931 | ) | | | | | | | | | | | | |
| | 61,128 | | | | (1,270 | ) | | | | | | | | | | | | |
| | | | | | | | | | | | | | | | | | | |
| 674,803 | | 7,230,781 | | | | (147,472 | ) | | | (3,844 | ) | | | (20,959 | ) | | | | |
| 73,918 | | | | | | | | | | | | | | | | | $ | 73,918 | |
| | | | | | | | | | | | | | 1,850 | | | | 1,850 | |
| | | | | | | | | | | | | | (2,005 | ) | | | (2,005 | ) |
| | | | | | | | | | | | | | (1,814 | ) | | | (1,814 | ) |
| | | | | | | | | | | | | | 29,495 | | | | 29,495 | |
| | | | | | | | | | | | | | | | | | | |
| | | | | | | | | | | | | | | | | $ | 101,444 | |
| | | | | | | | | | | | | | | | | | | |
| (28,096) | | | | | | | | | | | | | | | | | | | |
| | (204,927 | ) | | | 4,137 | | | | | | | | | | | | | |
| | (16,693 | ) | | | 340 | | | | | | | | | | | | | |
| | (121,200 | ) | | | 2,472 | | | | (1,656 | ) | | | | | | | | |
| | (800 | ) | | | 16 | | | | | | | | | | | | | |
| | | | | | | | | | | | | | | | | | | |
| 720,625 | | 6,887,161 | | | | (140,507 | ) | | | (5,500 | ) | | | 6,567 | | | | | |
| 44,195 | | | | | | | | | | | | | | | | | $ | 44,195 | |
| | | | | | | | | | | | | | 5,996 | | | | 5,996 | |
| | | | | | | | | | | | | | (5,378 | ) | | | (5,378 | ) |
| | | | | | | | | | | | | | (3,191 | ) | | | (3,191 | ) |
| | | | | | | | | | | | | | (36,596 | ) | | | (36,596 | ) |
| | | | | | | | | | | | | | | | | | | |
| | | | | | | | | | | | | | | | | $ | 5,026 | |
| | | | | | | | | | | | | | | | | | | |
| (28,276) | | | | | | | | | | | | | | | | | | | |
| | (173,534 | ) | | | 3,540 | | | | | | | | | | | | | |
| | (26,000 | ) | | | 530 | | | | | | | | | | | | | |
| | (129,700 | ) | | | 2,620 | | | | (465 | ) | | | | | | | | |
| | 1,062,541 | | | | (18,918 | ) | | | | | | | | | | | | |
| | (400 | ) | | | 8 | | | | | | | | | | | | | |
| | | | | | | | | | | | | | | | | | | | |
| $736,544 | | 7,620,068 | | | $ | (152,727 | ) | | $ | (5,965 | ) | | $ | (32,602 | ) | | | | |
| | | | | | | | | | | | | | | | | | | | |
– 29 –
NOTES TO CONSOLIDATED FINANCIAL STATEMENTS
(in thousands except employee and per share data) Years ended December 31, 2005, 2004 and 2003
| 1. | Summary of Significant Accounting Policies |
PRINCIPLESOF CONSOLIDATIONThe consolidated financial statements include the accounts of Sensient Technologies Corporation and its subsidiaries (the “Company”). All significant intercompany accounts and transactions are eliminated.
USEOF ESTIMATESThe preparation of the consolidated financial statements in conformity with accounting principles generally accepted in the United States of America requires management to make estimates and assumptions that affect reported amounts of assets and liabilities and the disclosure of contingent assets and liabilities at the date of the financial statements and the reported amounts of revenue and expenses during the reporting periods. Actual results could differ from those estimates.
REVENUE RECOGNITION The Company recognizes revenue, net of estimated discounts, allowances and returns, upon shipment of goods to customers, at which time title passes, the customer is obligated to pay the Company, and the Company has no remaining obligations.
COSTOF PRODUCT SOLD Cost of products sold includes materials, labor and overhead expenses incurred in the manufacture of our products. Cost of products sold also includes charges for obsolete and slow moving inventories, as well as costs for quality control, purchasing and receiving costs, inspection costs, warehousing costs, internal transfer costs, other costs of our internal distribution network and costs incurred for shipping and handling. The Company records fees billed to customers for shipping and handling as revenue.
SELLINGAND ADMINISTRATIVE EXPENSESSelling and administrative expenses primarily include the salaries and related costs for executive, finance, accounting, human resources, research and development and legal personnel as well as salaries and related costs of salespersons, and commissions paid to external sales agents.
CASH EQUIVALENTS The Company considers all highly liquid investments with maturities of three months or less at the date of acquisition as cash equivalents.
INVENTORIES Inventories are stated at the lower of cost or market. Market is determined on the basis of estimated realizable values. Cost is determined using the first-in, first-out (“FIFO”) method. Inventories include finished and in-process products totaling $234.1 million and $242.8 million at December 31, 2005 and 2004, respectively, and raw materials and supplies of $79.4 million and $85.4 million at December 31, 2005 and 2004, respectively.
PROPERTY, PLANTAND EQUIPMENT Property, plant and equipment are recorded at cost reduced by accumulated depreciation. Depreciation is provided over the estimated useful life using the straight-line method for financial reporting. The estimated useful lives for buildings ranges from 5 to 35 years. The buildings category consists of building improvements, which have useful lives ranging from 5 to 35 years, and buildings, which have useful lives ranging from 10 to 35 years. Machinery and equipment have useful lives ranging from 3 to 20 years.
GOODWILLAND OTHER INTANGIBLE ASSETSThe carrying value of goodwill and other intangible assets with indefinite lives is evaluated for impairment on an annual basis. The impairment assessment includes comparing the carrying amount of net assets, including goodwill, of each reporting unit to their respective fair value as of the date of the assessment. Fair value was estimated based upon an evaluation of future discounted cash flow as well as the public trading and private transaction valuation multiples for comparable companies. Such determination of fair value yielded no impairment.
The cost of intangible assets with determinable useful lives is amortized on a straight-line basis to reflect the pattern of economic benefits consumed, ranging from 5 to 20 years. These assets include technological know-how, customer relationships, patents, trademarks and non-compete agreements among others.
IMPAIRMENTOF LONG-LIVED ASSETS The Company reviews long-lived assets for impairment whenever events or changes in business circumstances indicate that the carrying amount of the assets may not be fully recoverable. The Company performs undiscounted cash flow analyses to determine if an impairment exists. If an impairment is determined to exist, any related impairment loss is calculated based on discounted future cash flows.
– 30 –
Sensient Technologies Corporation2005Annual Report
FINANCIAL INSTRUMENTS The Company uses derivative financial instruments for the purpose of hedging currency and interest rate exposures which exist as part of ongoing business operations. As a policy, the Company does not engage in speculative or leveraged transactions, nor does the Company hold or issue financial instruments for trading purposes.
Hedge effectiveness is determined by how closely the changes in the fair value of the hedging instrument offset the changes in the fair value or cash flows of the hedged item. Hedge accounting is permitted only if the hedging relationship is expected to be highly effective at the inception of the transaction and on an ongoing basis. Any ineffective portions are to be recognized in earnings immediately.
INTEREST RATE HEDGING The Company is exposed to interest rate risk through its corporate borrowing activities. The objective of the Company’s interest rate risk management activities is to manage the levels of the Company’s fixed and floating interest rate exposure to be consistent with the Company’s preferred mix. The interest rate risk management program may include entering into interest rate swaps, which qualify as fair value hedges, when there is a desire to modify the Company’s exposure to interest rates. Gains or losses on fair value hedges are recognized in earnings, net of gains and losses on the fair value of the hedged instruments.
The Company did not have any interest rate swaps outstanding at December 31, 2005.
CURRENCY RATE HEDGING The primary objectives of the foreign exchange risk management activities are to understand and mitigate the impact of potential foreign exchange fluctuations on the Company’s financial results and its economic well-being. Generally, these risk management transactions involve the use of foreign currency derivatives to protect against exposure resulting from recorded accounts receivable and payable. The Company primarily utilizes forward exchange contracts with maturities of less than 12 months, which qualify as cash flow hedges. These foreign exchange contracts are intended to offset the effect of exchange rate fluctuations on recorded intercompany receivables and payables. Gains and losses on these instruments are deferred in accumulated other comprehensive income (loss) (“OCI”) until the underlying transaction is recognized in earnings.
The Company’s existing cash flow hedges are highly effective. As a result, any current impact on earnings due to cash flow hedge ineffectiveness is immaterial.
NET INVESTMENT HEDGING The Company may enter into foreign-denominated debt to be used as a non-derivative instrument to hedge the Company’s net investment in foreign subsidiaries. The change in the carrying amount of the foreign-denominated debt on the Company’s books, attributable to changes in the spot foreign exchange rate, is a hedge of the net investment in its foreign subsidiaries.
COMMODITY PURCHASES The Company purchases certain commodities in the normal course of business which result in physical delivery of the goods and hence, are excluded from SFAS No. 133, as amended.
TRANSLATIONOF FOREIGN CURRENCIES For all significant foreign operations, the functional currency is the local currency. Assets and liabilities of foreign operations are translated into U.S. dollars at current exchange rates. Revenue and expense accounts are translated into U.S. dollars at average exchange rates prevailing during the year. Adjustments resulting from the translation of assets and liabilities to U.S. dollars are included in OCI as foreign currency translation adjustments. Transaction gains and losses are included in earnings and were not significant during the three-year period ended December 31, 2005.
STOCK-BASED COMPENSATION The Company accounts for its stock-based compensation plans using the intrinsic value-based method in accordance with Accounting Principles Board Opinion No. 25, “Accounting for Stock Issued to Employees.” Stock options are granted at prices equal to the fair market value of the Company’s common stock on the grant dates. Accordingly, the Company did not record any compensation expense with respect to the grant of stock options during the three-year period ended December 31, 2005. If the Company had elected to recognize compensation cost based on the fair value of the options granted at grant date as prescribed by SFAS No. 123, net earnings and earnings per share would have been reduced to the pro-forma amounts indicated below:
– 31 –
NOTES TO CONSOLIDATED FINANCIAL STATEMENTS
(in thousands except employee and per share data) Years ended December 31, 2005, 2004 and 2003
| | | | | | | | | | | | |
(in thousands except per share data) | | 2005 | | | 2004 | | | 2003 | |
Net earnings: | | | | | | | | | | | | |
As reported | | $ | 44,195 | | | $ | 73,918 | | | $ | 81,432 | |
Reported stock compensation expense–net of tax | | | 1,167 | | | | 693 | | | | 493 | |
Less: fair value stock compensation expense–net of tax | | | (3,403 | ) | | | (2,371 | ) | | | (2,442 | ) |
| | | | | | | | | | | | |
Pro forma net earnings | | $ | 41,959 | | | $ | 72,240 | | | $ | 79,483 | |
| | | | | | | | | | | | |
Earnings per common share: | | | | | | | | | | | | |
Basic as reported | | $ | .95 | | | $ | 1.59 | | | $ | 1.74 | |
Less: net impact of fair value stock expense–net of tax | | | (.05 | ) | | | (.04 | ) | | | (.04 | ) |
| | | | | | | | | | | | |
Basic pro forma | | $ | .90 | | | $ | 1.55 | | | $ | 1.70 | |
Diluted as reported | | $ | .94 | | | $ | 1.58 | | | $ | 1.73 | |
Less: net impact of fair value stock expense – net of tax | | | (.05 | ) | | | (.04 | ) | | | (.04 | ) |
| | | | | | | | | | | | |
Diluted pro forma | | $ | .89 | | | $ | 1.54 | | | $ | 1.69 | |
| | | | | | | | | | | | |
The weighted-average fair value per share of options granted was $4.79 in 2005, $4.81 in 2004 and $4.68 in 2003.
The fair value of each option granted was estimated on the date of grant using the Black-Scholes option-pricing model with the following weighted average assumptions:
| | | | | | | | | |
| | | 2005 | | | 2004 | | | 2003 | |
Dividend yield | | 3.1 | % | | 2.8 | % | | 2.9 | % |
Volatility | | 28.3 | % | | 27.3 | % | | 29.0 | % |
Risk-free interest rate | | 4.3 | % | | 3.2 | % | | 3.1 | % |
Expected term (years) | | 5.1 | | | 5.4 | | | 5.5 | |
The pro-forma expense for 2005 includes $1.0 million after-tax compensation expense related to accelerated amortization for retirement eligible participants. Beginning in the first quarter of 2005, stock compensation expense for retirement eligible participants was reported in pro-forma net earnings and recognized over six months. Previously, this expense was recognized over the vesting period, which is three years.
See New Pronouncements below for further discussion of stock-based compensation.
INCOME TAXES The Company accounts for income taxes under SFAS No. 109, “Accounting for Income Taxes.” The Company recognizes a current tax liability or asset for the estimated taxes payable or refundable on tax returns for the current year and a deferred tax liability or asset for the estimated future tax effects attributable to temporary differences and carryforwards. The measurement of current and deferred tax liabilities and assets is based on provisions of enacted tax law. Deferred tax assets are reduced, if necessary, by the amount of any tax benefits for which the utilization of the asset is not likely.
EARNING PER SHARE The difference between basic and diluted earnings per share (“EPS”) is the dilutive effect of stock options and restricted stock. Diluted earnings per share assume that restricted stock has vested and all dilutive stock options, for which the average market price exceeds the exercise price (in-the-money), are exercised. Stock options for which the exercise price exceeds the average market price (out-of-the-money options) have an anti-dilutive effect on EPS, and accordingly, are excluded from the calculation. For the years ended December 31, 2005, 2004 and 2003, options for 1.9 million, 1.2 million and 1.2 million shares were excluded from the diluted EPS calculation because they were anti-dilutive. All earnings per share amounts are presented on a diluted basis unless otherwise noted.
ACCUMULATED OTHER COMPREHENSIVE (LOSS) INCOME OCI is comprised primarily of foreign currency translation, minimum pension liability and unrealized losses on cash flow hedges. The components of OCI at December 31 were:
| | | | | | | | |
(in thousands) | | 2005 | | | 2004 | |
Foreign currency translation | | $ | (27,539 | ) | | $ | 9,057 | |
Minimum pension liability (net of tax) | | | (5,089 | ) | | | (1,898 | ) |
Unrealized gains (losses) on cash flow hedges (net of tax) | | | 26 | | | | (592 | ) |
| | | | | | | | |
Accumulated other comprehensive (loss) income | | $ | (32,602 | ) | | $ | 6,567 | |
| | | | | | | | |
RESEARCHAND DEVELOPMENT Research and development costs are recorded in selling and administrative expenses in the year they are incurred. Research and development costs were $26.4 million, $24.3 million and $22.9 million during the years ended December 31, 2005, 2004 and 2003, respectively.
ADVERTISING Advertising costs are recorded in selling and administrative expenses as they are incurred. Advertising costs were $1.5 million, $1.6 million and $1.7 million during the years ended December 31, 2005, 2004 and 2003, respectively.
ENVIRONMENTAL LIABILITIES The Company records liabilities related to environmental remediation obligations when estimated future expenditures are probable and reasonably estimable. Such accruals are adjusted as further information becomes available or as circumstances change. Estimated
– 32 –
Sensient Technologies Corporation2005Annual Report
future expenditures are discounted to their present value when the timing and amount of future cash flows are fixed and readily determinable. Recoveries of remediation costs from other parties, if any, are recognized as assets when their receipt is assured.
NEW PRONOUNCEMENTS In December 2004, the FASB issued Statement No. 123 (revised 2004), “Stock Based Compensation.” The statement will require the Company to expense its stock options and restricted stock over the requisite service period based on the fair value at the date of grant. This statement is effective for the Company on January 1, 2006. The Company will adopt the statement using the modified prospective method. The impact of adoption of the revised statement in 2006 is anticipated to reduce net earnings by approximately $1.3 million to $1.7 million ($0.03 per share). The actual impact on net earnings in 2006 will depend on a number of factors, including the amount of awards granted and the fair value of those awards at the time of the grant.
RECLASSIFICATIONS Certain amounts related to segment disclosures have been restated to conform to the current year presentation.
There were no acquisitions during 2005 or 2004.
During 2003, the Company acquired two businesses for cash in an aggregate amount of $17.1 million, net of cash acquired. Formulabs Iberica S.A., a manufacturer and marketer of specialty inks, primarily for inkjet applications, was acquired in August 2003. In March 2003, the Company acquired certain assets of Kyowa Koryo Kagaku Kabushiki Kaisha, a Japanese flavor producer. The allocation of the purchase price resulted in intangible assets with determinable useful lives of $2.6 million, amortizable over a weighted average period of 20 years, and goodwill of $9.1 million.
All acquisitions have been accounted for as purchases and, accordingly, their results of operations have been included in the consolidated financial statements since their respective dates of acquisition. The effects of presenting the acquisitions on an unaudited pro-forma basis were not significant to the Company’s financial position or results of operations.
| 3. | Goodwill and Intangible Assets |
The Company does not have any intangible assets other than goodwill that are not subject to amortization. The following table summarized intangible assets with determinable useful lives by major category as of December 31, 2005 and 2004:
| | | | | | | | | | | | | | | | |
| | | WEIGHTED
AVERAGE
AMORTIZATION
YEARS | | 2005 | | | 2004 | |
(in thousands except weighted average amortization years) | | | COST | | ACCUMULATED
AMORTIZATION | | | COST | | ACCUMULATED
AMORTIZATION | |
Technological know-how | | 20.0 | | $ | 7,610 | | $ | (1,951 | ) | | $ | 8,216 | | $ | (1,687 | ) |
Customer relationships | | 20.0 | | | 6,256 | | | (1,076 | ) | | | 6,808 | | | (822 | ) |
Patents, trademarks, non-compete agreements and other | | 18.0 | | | 7,321 | | | (3,196 | ) | | | 7,674 | | | (2,285 | ) |
| | | | | | | | | | | | | | | | |
Total finite-lived intangibles | | 19.3 | | $ | 21,187 | | $ | (6,223 | ) | | $ | 22,698 | | $ | (4,794 | ) |
| | | | | | | | | | | | | | | | |
Amortization of intangible assets was $1.4 million, $1.2 million and $1.0 million in 2005, 2004 and 2003, respectively. Estimated amortization expense each year for the five years subsequent to December 31, 2005, is as follows: 2006, $1.2 million; 2007, $1.2 million; 2008, $1.2 million; 2009, $1.1 million; and 2010, $1.1 million.
The changes in goodwill for the years ended December 31, 2005 and 2004, by reportable business segment were as follows (the balances as of December 31, 2004 and 2003, and the 2004 activity have been restated to reflect the changes in the Company’s segments discussed in Note 10):
| | | | | | | | | | | | | | | | |
(in thousands) | | FLAVORS &
FRAGRANCES | | | COLOR | | | CORPORATE
& OTHER | | | CONSOLIDATED | |
Balance as of December 31, 2003 | | $ | 132,930 | | | $ | 295,439 | | | $ | 553 | | | $ | 428,922 | |
Goodwill of acquired businesses | | | — | | | | 1,070 | | | | — | | | | 1,070 | |
Currency translation impact | | | 7,736 | | | | 14,610 | | | | 89 | | | | 22,435 | |
| | | | | | | | | | | | | | | | |
Balance as of December 31, 2004 | | | 140,666 | | | | 311,119 | | | | 642 | | | | 452,427 | |
Currency translation impact | | | (8,964 | ) | | | (23,252 | ) | | | (10 | ) | | | (32,226 | ) |
| | | | | | | | | | | | | | | | |
Balance as of December 31, 2005 | | $ | 131,702 | | | $ | 287,867 | | | $ | 632 | | | $ | 420,201 | |
| | | | | | | | | | | | | | | | |
– 33 –
NOTES TO CONSOLIDATED FINANCIAL STATEMENTS
(in thousands except employee and per share data) Years ended December 31, 2005, 2004 and 2003
Long-term debt consisted of the following unsecured obligations at December 31:
| | | | | | |
(in thousands) | | 2005 | | 2004 |
6.68% senior notes due through January 2011 | | $ | 12,857 | | $ | 15,000 |
6.77% senior notes due through January 2010 | | | 15,000 | | | 15,000 |
6.60% notes due through April 2009 | | | 149,553 | | | 149,434 |
7.59% senior notes due through December 2008 | | | 12,857 | | | 17,143 |
6.99% senior notes due through December 2007 | | | 30,000 | | | 40,000 |
4.57% senior notes due December 2007 | | | 38,000 | | | 38,000 |
Floating rate Swiss Franc-denominated senior notes due December 2007 | | | 24,803 | | | 28,582 |
5.63% Euro-denominated senior notes due November 2006 | | | 158,694 | | | 181,839 |
5.85% senior notes due November 2006 | | | 30,000 | | | 30,000 |
Various other notes | | | 17,563 | | | 24,774 |
Deferred realized gains on interest rate swaps | | | 1,137 | | | 3,034 |
Fair value of interest rate swaps | | | — | | | 2,616 |
| | | | | | |
| | | 490,464 | | | 545,422 |
Less current maturities | | | 207,341 | | | 20,269 |
| | | | | | |
Total long-term debt | | $ | 283,123 | | $ | 525,153 |
| | | | | | |
The floating rate Swiss Franc-denominated notes had an average coupon rate of 1.67% and 1.40% for the years ended December 31, 2005 and 2004, respectively.
The aggregate amounts of maturities on long-term debt each year for the five years subsequent to December 31, 2005, are as follows: 2006, $207.3 million; 2007, $90.4 million; 2008, $6.9 million; 2009, $163.4 million; and 2010, $17.8 million.
Substantially all of the senior loan agreements contain restrictions concerning interest coverage, borrowings, investments and tangible net worth amounts. Earnings reinvested of $178 million at December 31, 2005, were unrestricted.
On August 18, 2005, the Company amended its unsecured revolving credit facility with a group of seven banks. The amendment increases the aggregate facility from $150 million to $225 million and extends the term to August 2010 from September 2007. The amendment also permits the Company to request an increase in the aggregate facility amount to $300 million subject to the banks’ approval. Interest rates are determined based upon LIBOR plus a margin subject to adjustment on the basis of the rating accorded the Company’s senior debt by S&P and Moody’s. In addition, the Company pays a facility fee on the total amount of the facility and a utilization fee. In addition to customary restrictions, the Company must maintain a minimum fixed charge coverage ratio and may not exceed a stated funded debt to capital ratio. The Company must also maintain a total funded debt to earnings before interest, taxes, depreciation and amortization (EBITDA) ratio. The credit facility will be used for working capital, commercial paper back-up and other general corporate purposes. The Company is in compliance with all requirements as of December 31, 2005.
The Company’s short-term borrowings consisted of the following items at December 31:
| | | | | | |
(in thousands) | | 2005 | | 2004 |
Direct borrowings under the revolver | | $ | — | | $ | 17,637 |
Commercial paper | | | 50,912 | | | 49,779 |
Uncommitted loans | | | 11,375 | | | 1,425 |
Loans of foreign subsidiaries | | | 931 | | | 933 |
| | | | | | |
Total | | $ | 63,218 | | $ | 69,774 |
| | | | | | |
The weighted-average interest rates on short-term borrowings were 4.60% and 2.75% at December 31, 2005 and 2004, respectively.
The Company has $174.1 million available under the revolving credit facility and $43.2 million available under other lines of credit from several banks at December 31, 2005.
| 5. | Financial Instruments and Risk Management |
INTEREST RATE SWAP AGREEMENTS During 2003 and 2002, the Company entered into a series of interest rate swap agreements to manage the level of fixed and floating interest rate debt. In October 2003, the Company settled certain interest rate swaps and the remainder of the interest rate swaps were settled in September 2005. At December 31, 2005, there are no outstanding interest rate swaps. At December 31, 2004, the notional principal amounts of outstanding interest rate swap agreements (accounted for as fair value hedges) were $177.1 million with varying maturities through January 2011. The notional amounts were used to calculate interest payments, which were exchanged over the life of the swap transactions prior to settlement and were equal to the dollar principal exchanged. The fair value of the swaps at December 31, 2004, based on dealer quotes, was an
– 34 –
Sensient Technologies Corporation2005Annual Report
asset of $2.6 million, which was recorded in the other assets line on the consolidated balance sheet.
As a result of the October 2003 settlements, the counterparty paid the Company $4.8 million. As a result of the September 2005 settlements, the Company paid the counterparty $0.5 million. The net realized gains and losses on the swaps have been deferred, classified as a separate component of debt and are being amortized to income as a reduction or increase of interest expense over the remaining term of the debt.
FOREIGN CURRENCY CONTRACTSThe Company uses forward exchange contracts to reduce the effect of fluctuating foreign currencies on short-term foreign currency-denominated intercompany transactions and other known foreign currency exposures. At December 31, 2005 and 2004, the Company had forward exchange contracts (accounted for as cash flow hedges), with maturities of one year or less, of $49.3 million and $96.9 million, respectively. The fair values of these instruments, based on dealer quotes, were an asset of $0.1 million at December 31, 2005, and a liability of $0.7 million at December 31, 2004.
FOREIGN-DENOMINATED DEBTIn December 2002, the Company entered into a 33 million Swiss Franc-denominated note agreement. In November 2001, the Company entered into a 134 million Euro-denominated note agreement. These non-derivative instruments have been designated as partial hedges of the Company’s Swiss Franc and Euro net asset positions.
CONCENTRATIONSOF CREDIT RISK Counterparties to currency exchange and interest rate swap contracts consist of large international financial institutions. The Company continually monitors its positions and the credit ratings of the counterparties involved and limits the amount of credit exposure to any one party. While these counterparties may expose the Company to potential losses due to the credit risk of non-performance, losses are not anticipated. Concentrations of credit risk with respect to trade accounts receivable are limited by the large number of customers, generally short payment terms, and their dispersion across geographic areas.
FAIR VALUES The carrying amount of cash and cash equivalents, trade accounts receivable, accounts payable, accrued expenses and short-term borrowings approximated fair value as of December 31, 2005 and 2004.
The fair value of the Company’s long-term debt, including current maturities, is estimated using discounted cash flows based on the Company’s current incremental borrowing rates for similar types of borrowing arrangements. The carrying value of long-term debt at December 31, 2005 and 2004 was $490.5 million and $545.4 million, respectively. The fair value of long-term debt at December 31, 2005 and 2004 was approximately $483.0 million and $556.6 million, respectively.
The Company has various stock option plans under which employees and directors may be granted options to purchase common stock at 100% of the market price on the day the options are granted. Stock options become exercisable over a three-year vesting period or upon retirement and expire 10 years from the date of grant.
Awarded shares of restricted stock become freely transferable at the earlier of five years from the date of grant or upon retirement after the participant attains age 65. During the period of restriction, the holder of restricted stock has voting rights and is entitled to receive all dividends and other distributions paid with respect to the stock.
Under the 2002 Stock Option Plan, up to 2.4 million shares of common stock are available for employee awards, of which no more than 0.6 million shares may be restricted stock. Under the 1998 Stock Option Plan, up to 2.4 million shares of common stock were available for employee awards, of which no more than 0.6 million shares may be restricted stock. Under the 1994 Stock Option Plan, which expired in January 2004, up to 2.4 million shares of common stock were available for employee awards, of which no more than 0.5 million shares may be restricted stock. The 1994 Plan also authorized the grant of up to 0.8 million stock appreciation rights in connection with stock options. Under the amended 2002 Non-Employee Director Stock Plan, up to 0.09 million shares of common stock are available for director awards of restricted stock. Under the 1999 Non-Employee Director Stock Option Plan, up to 0.25 million shares of common stock are available for director awards.
– 35 –
NOTES TO CONSOLIDATED FINANCIAL STATEMENTS
(in thousands except employee and per share data) Years ended December 31, 2005, 2004 and 2003
The changes in outstanding stock options during the three years ended December 31, 2005, as well as details on exercisable options were as follows:
| | | | | | | | | | | |
(in thousands of shares) | | OUTSTANDING
OPTIONS | | | WEIGHTED-
AVERAGE
PRICE | | EXERCISABLE
OPTIONS | | WEIGHTED-
AVERAGE
PRICE |
Balances at December 31, 2002 | | 2,922 | | | $ | 19.88 | | 1,808 | | $ | 19.46 |
Granted | | 492 | | | | 20.38 | | | | | |
Exercised | | (236 | ) | | | 17.99 | | | | | |
Cancelled | | (157 | ) | | | 21.23 | | | | | |
| | | | | | | | | | | |
Balances at December 31, 2003 | | 3,021 | | | $ | 20.04 | | 2,041 | | $ | 19.76 |
Granted | | 445 | | | | 21.82 | | | | | |
Exercised | | (219 | ) | | | 17.29 | | | | | |
Cancelled | | (144 | ) | | | 20.55 | | | | | |
| | | | | | | | | | | |
Balances at December 31, 2004 | | 3,103 | | | $ | 20.46 | | 2,233 | | $ | 20.10 |
Granted | | 367 | | | | 20.48 | | | | | |
Exercised | | (174 | ) | | | 17.12 | | | | | |
Cancelled | | (65 | ) | | | 21.67 | | | | | |
| | | | | | | | | | | |
Balances at December 31, 2005 | | 3,231 | | | $ | 20.62 | | 2,499 | | $ | 20.54 |
| | | | | | | | | | | |
The following summarizes information concerning outstanding and exercisable stock options at December 31, 2005:
| | | | | | | | | |
| | | RANGE OF EXERCISE PRICE |
(in thousands of shares) | | $15.56-
19.50 | | $19.51-
22.00 | | $22.01-
25.19 |
Number outstanding | | | 1,173 | | | 1,113 | | | 945 |
Weighted-average remaining contractual life, in years | | | 5.8 | | | 5.1 | | | 6.7 |
Weighted-average exercise price | | $ | 18.25 | | $ | 21.05 | | $ | 23.05 |
| | | | | | | | | |
Number exercisable | | | 891 | | | 946 | | | 662 |
Weighted-average exercise price | | $ | 18.08 | | $ | 21.11 | | $ | 23.05 |
| | | | | | | | | |
The closing price of our common stock on December 31, 2005 was $17.90.
The following summarizes information concerning shares available to be granted as future stock options under existing plans:
| | |
(in thousands of shares) | | AVAILABLE |
December 31, 2003 | | 2,544 |
December 31, 2004 | | 1,892 |
December 31, 2005 | | 1,455 |
The Company provides benefits under defined contribution plans including a savings plan and an employee stock ownership plan (“ESOP”). The savings plan covers substantially all domestic salaried and certain non-union hourly employees and provides for matching contributions up to 4% of each employee’s salary. The ESOP covers substantially all domestic employees not covered by a defined benefit plan and provides for contributions based on a percentage of each employee’s compensation as determined by the Board of Directors. Total expense for the Company’s defined contribution plans was $2.9 million, $2.7 million and $2.7 million in 2005, 2004 and 2003, respectively.
Although the Company intends the defined contribution plans mentioned above to be the primary retirement benefit for most employees, the Company also has several defined benefit plans. The funded status of the defined benefit plans was as follows at December 31:
| | | | | | | | |
(in thousands) | | 2005 | | | 2004 | |
Benefit obligation at beginning of year | | $ | 37,386 | | | $ | 34,536 | |
Service cost | | | 1,038 | | | | 923 | |
Interest cost | | | 2,328 | | | | 1,685 | |
Benefits paid | | | (1,924 | ) | | | (1,948 | ) |
Actuarial loss | | | 4,869 | | | | 2,190 | |
| | | | | | | | |
Benefit obligation at end of year | | | 43,697 | | | | 37,386 | |
| | | | | | | | |
Plan assets at beginning of year | | | 11,300 | | | | 10,878 | |
Company contributions | | | 2,143 | | | | 2,081 | |
Benefits paid | | | (1,924 | ) | | | (1,948 | ) |
Actual gain on plan assets | | | 677 | | | | 289 | |
| | | | | | | | |
Plan assets at end of year | | | 12,196 | | | | 11,300 | |
| | | | | | | | |
Funded status | | | (31,501 | ) | | | (26,086 | ) |
Unrecognized prior service cost | | | 13,073 | | | | 14,354 | |
Unrecognized net actuarial loss | | | 9,333 | | | | 4,292 | |
Additional minimum liability | | | (20,642 | ) | | | (16,560 | ) |
| | | | | | | | |
Accrued benefit liability | | $ | (29,737 | ) | | $ | (24,000 | ) |
Accumulated benefit obligation | | $ | (41,933 | ) | | $ | (35,300 | ) |
| | | | | | | | |
– 36 –
Sensient Technologies Corporation2005Annual Report
The additional minimum liability of the Company’s defined benefit plans has been recorded primarily as an increase to Other Assets.
Components of annual benefit cost:
| | | | | | | | | | | | |
(in thousands) | | 2005 | | | 2004 | | | 2003 | |
Service cost | | $ | 1,038 | | | $ | 922 | | | $ | 937 | |
Interest cost | | | 2,328 | | | | 1,685 | | | | 1,633 | |
Expected return on plan assets | | | (813 | ) | | | (333 | ) | | | (254 | ) |
Amortization of prior service cost | | | 1,281 | | | | 1,281 | | | | 1,192 | |
Recognized actuarial loss | | | 186 | | | | 77 | | | | — | |
Settlement expense | | | — | | | | 56 | | | | — | |
| | | | | | | | | | | | |
Defined benefit expense | | $ | 4,020 | | | $ | 3,688 | | | $ | 3,508 | |
| | | | | | | | | | | | |
Weighted-average liability assumptions as of December 31:
| | | | | | |
| | | 2005 | | | 2004__ | |
Discount rate | | 5.50 | % | | 6.00 | % |
Expected return on plan assets | | 7.00 | % | | 8.00 | % |
Rate of compensation increase | | 5.00 | % | | 5.00 | % |
Weighted-average cost assumptions for the year ended December 31:
| | | | | | |
| | | 2005 | | | 2004 | |
Discount rate | | 6.00 | % | | 6.25 | % |
Expected return on plan assets | | 8.00 | % | | 8.00 | % |
Rate of compensation increase | | 5.00 | % | | 5.00 | % |
The aggregate amounts of benefits expected to be paid from defined benefit plans in each of the next five years subsequent to December 31, 2005, which include employees’ expected future service are as follows: 2006, $1.6 million; 2007, $5.4 million; 2008, $2.9 million; 2009, $3.1 million; 2010, $3.8 million and $13.7 million in total for the years 2011 through 2015.
The Company expects to contribute $2.2 million to defined benefit plans in 2006.
| 8. | Other Postretirement Benefits |
During the fourth quarter of 2003, the Company eliminated its subsidy for certain post-retirement programs. As a result of this change in benefits, the Company recognized a onetime, non-cash credit of $13.6 million, which was partially offset by a $0.3 million accrual for claims incurred but not reported, resulting in a net post-retirement credit for 2003 of $13.3 million ($8.2 million after-tax, $0.17 per share), which has been included in the Selling and Administrative Expenses line of the 2003 Statement of Earnings. The $13.3 million postretirement credit was recorded in the following segments: $9.3 million in Corporate & Other, $2.9 million in Flavors & Fragrances and $1.1 million in Color.
Components of net annual benefit cost (credit) were:
| | | | |
(in thousands) | | 2003 | |
Interest cost | | $ | 627 | |
Amortization of prior service credit | | | (651 | ) |
Recognized actuarial loss | | | 163 | |
Termination of benefits | | | (13,629 | ) |
| | | | |
Postretirement income | | $ | (13,490 | ) |
| | | | |
The provision for income taxes was as follows:
| | | | | | | | | | | | |
(in thousands) | | 2005 | | | 2004 | | | 2003 | |
Currently payable (refundable): | | | | | | | | | | | | |
Federal | | $ | 7,999 | | | $ | 8,747 | | | $ | (1,538 | ) |
State | | | (42 | ) | | | 1,355 | | | | 1,246 | |
Foreign | | | 15,377 | | | | 14,171 | | | | 19,028 | |
| | | | | | | | | | | | |
| | | 23,334 | | | | 24,273 | | | | 18,736 | |
| | | | | | | | | | | | |
Deferred (benefit): | | | | | | | | | | | | |
Federal | | | (6,845 | ) | | | (2,939 | ) | | | 10,399 | |
State | | | 566 | | | | (1,229 | ) | | | (565 | ) |
Foreign | | | (2,773 | ) | | | 3,868 | | | | (1,658 | ) |
| | | | | | | | | | | | |
| | | (9,052 | ) | | | (300 | ) | | | 8,176 | |
| | | | | | | | | | | | |
| | $ | 14,282 | | | $ | 23,973 | | | $ | 26,912 | |
| | | | | | | | | | | | |
– 37 –
NOTES TO CONSOLIDATED FINANCIAL STATEMENTS
(in thousands except employee and per share data) Years ended December 31, 2005, 2004 and 2003
The tax effects of temporary differences that give rise to significant portions of deferred tax assets and liabilities consisted of the following:
| | | | | | | | |
(in thousands) | | 2005 | | | 2004 | |
Deferred tax assets: | | | | | | | | |
Benefit plans | | $ | 9,597 | | | $ | 7,989 | |
Liabilities and reserves | | | 12,842 | | | | 6,899 | |
Foreign operating loss carryovers | | | 32,396 | | | | 31,744 | |
Other | | | 19,889 | | | | 13,371 | |
| | | | | | | | |
Gross deferred tax assets | | | 74,724 | | | | 60,003 | |
Valuation allowance | | | (25,983 | ) | | | (18,790 | ) |
| | | | | | | | |
Net deferred tax assets | | | 48,741 | | | | 41,213 | |
| | | | | | | | |
Deferred tax liabilities: | | | | | | | | |
Property, plant and equipment | | | (21,292 | ) | | | (25,163 | ) |
Other assets | | | (6,253 | ) | | | (5,586 | ) |
Other | | | (13,226 | ) | | | (12,922 | ) |
| | | | | | | | |
Total deferred tax liabilities | | | (40,771 | ) | | | (43,671 | ) |
| | | | | | | | |
Net deferred tax assets (liabilities) | | $ | 7,970 | | | $ | (2,458 | ) |
| | | | | | | | |
At December 31, 2005, foreign operating loss carryovers were $109.5 million. Included in the total net operating loss carryovers are losses of $6.7 million that expire through 2020 and $102.8 million that do not have an expiration date.
The effective tax rate differed from the statutory federal income tax rate of 35% as described below:
| | | | | | | | | |
| | | 2005 | | | 2004 | | | 2003 | |
Taxes at statutory rate | | 35.0 | % | | 35.0 | % | | 35.0 | % |
State income taxes, net of federal income tax benefit | | 1.5 | | | 0.8 | | | 1.0 | |
Tax credits | | (2.5 | ) | | (4.6 | ) | | (4.0 | ) |
Foreign tax rate | | 0.1 | | | (2.0 | ) | | 3.7 | |
Foreign sales corporation/extraterritorial income tax benefit | | (2.3 | ) | | (1.6 | ) | | (2.3 | ) |
Resolution of prior years’ issues | | (4.2 | ) | | (0.9 | ) | | (3.1 | ) |
Valuation allowance adjustments | | (1.1 | ) | | (0.3 | ) | | (3.1 | ) |
Other, net | | (2.1 | ) | | (1.9 | ) | | (2.4 | ) |
| | | | | | | | | |
Effective tax rate | | 24.4 | % | | 24.5 | % | | 24.8 | % |
| | | | | | | | | |
The effective tax rates for all years presented were reduced by favorable resolutions of prior years’ tax matters.
Earnings before income taxes were as follows:
| | | | | | | | | |
(in thousands) | | 2005 | | 2004 | | 2003 |
United States | | $ | 13,432 | | $ | 41,263 | | $ | 59,997 |
Foreign | | | 45,045 | | | 56,628 | | | 48,347 |
| | | | | | | | | |
| | $ | 58,477 | | $ | 97,891 | | $ | 108,344 |
| | | | | | | | | |
Domestic income taxes have not been provided on undistributed earnings of foreign subsidiaries which are considered to be permanently invested. If undistributed foreign earnings were to be remitted, foreign tax credits would substantially offset any resulting domestic tax liability.
| 10. | Segment and Geographic Information |
The accounting policies of the segments are the same as those described in the summary of significant accounting policies. The Company evaluates performance based on operating income of the respective business units before restructuring charges, interest expense and income taxes. Total revenue and operating income by business segment and geographic region include both sales to customers, as reported in the Company’s consolidated statements of earnings, and intersegment sales, which are accounted for at prices which approximate market prices and are eliminated in consolidation. Corporate and other revenue consist primarily of flavor, fragrances and color products sold by the Asia Pacific Group.
Assets by business segment and geographic region are those assets used in the Company’s operations in each segment and geographic region. Segment assets reflect the allocation of goodwill to each segment. Corporate and other assets consist primarily of property and investments. Capital expenditures are reported exclusive of acquisitions.
SEGMENT INFORMATION The Company’s operations, except for the Asia Pacific Group, are managed on a products and services basis. The Company determines its operating segments based on information utilized by senior management to allocate resources and assess performance. The Company’s reportable segments consist of Flavors & Fragrances and Color. The Company’s Flavors &
– 38 –
Sensient Technologies Corporation2005Annual Report
Fragrances segment produces flavor and fragrance products that impart a desired taste, texture, aroma or other characteristic to a broad range of consumer and other products. The Color segment produces natural and synthetic color systems for pharmaceuticals, foods and beverages; colors and formulations for cosmetics; and technical colors for industrial applications and digital imaging. The Asia Pacific Group, which is reported in the Corporate and Other segment was realigned during the third quarter of 2005.
As a result, the operations in Japan and China, previously included within the Asia Pacific Group, are now reported as part of the Flavors & Fragrances Group. In addition, the sales of dehydrated flavors products within the Asia Pacific region are now included in the Flavors & Fragrances segment. These changes in reporting segments have been reflected in the results for 2005. Results for 2004 and 2003 have also been restated to reflect this change.
| | | | | | | | | | | | | |
(in thousands) | | FLAVORS &
FRAGRANCES | | COLOR | | CORPORATE
& OTHER | | | CONSOLIDATED |
2003 | | | | | | | | | | | | | |
Revenue from external customers | | $ | 597,876 | | $ | 350,239 | | $ | 39,094 | | | $ | 987,209 |
Intersegment revenue | | | 11,574 | | | 10,438 | | | 681 | | | | 22,693 |
| | | | | | | | | | | | | |
Total revenue | | | 609,450 | | | 360,677 | | | 39,775 | | | | 1,009,902 |
| | | | | | | | | | | | | |
Operating income (loss) | | | 86,675 | | | 71,607 | | | (20,798 | ) | | | 137,484 |
Interest expense | | | — | | | — | | | 29,140 | | | | 29,140 |
| | | | | | | | | | | | | |
Earnings (loss) before income taxes | | | 86,675 | | | 71,607 | | | (49,938 | ) | | | 108,344 |
| | | | | | | | | | | | | |
Assets | | | 710,682 | | | 622,258 | | | 120,588 | | | | 1,453,528 |
Capital expenditures | | | 44,518 | | | 22,993 | | | 6,697 | | | | 74,208 |
Depreciation and amortization | | | 25,349 | | | 12,624 | | | 5,125 | | | | 43,098 |
Restructuring charges | | | — | | | — | | | 6,476 | | | | 6,476 |
| | | | |
2004 | | | | | | | | | | | | | |
Revenue from external customers | | $ | 636,195 | | $ | 372,178 | | $ | 38,760 | | | $ | 1,047,133 |
Intersegment revenue | | | 12,070 | | | 11,620 | | | 1,061 | | | | 24,751 |
| | | | | | | | | | | | | |
Total revenue | | | 648,265 | | | 383,798 | | | 39,821 | | | | 1,071,884 |
| | | | | | | | | | | | | |
Operating income (loss) | | | 84,812 | | | 67,991 | | | (23,647 | ) | | | 129,156 |
Interest expense | | | — | | | — | | | 31,265 | | | | 31,265 |
| | | | | | | | | | | | | |
Earnings (loss) before income taxes | | | 84,812 | | | 67,991 | | | (54,912 | ) | | | 97,891 |
| | | | | | | | | | | | | |
Assets | | | 744,159 | | | 641,344 | | | 103,075 | | | | 1,488,578 |
Capital expenditures | | | 25,770 | | | 19,649 | | | 4,426 | | | | 49,845 |
Depreciation and amortization | | | 27,619 | | | 13,731 | | | 4,893 | | | | 46,243 |
| | | | |
2005 | | | | | | | | | | | | | |
Revenue from external customers | | $ | 657,747 | | $ | 327,447 | | $ | 38,736 | | | $ | 1,023,930 |
Intersegment revenue | | | 12,847 | | | 12,492 | | | 2,790 | | | | 28,129 |
| | | | | | | | | | | | | |
Total revenue | | | 670,594 | | | 339,939 | | | 41,526 | | | | 1,052,059 |
| | | | | | | | | | | | | |
Operating income (loss) | | | 82,473 | | | 54,197 | | | (42,456 | ) | | | 94,214 |
Interest expense | | | — | | | — | | | 35,737 | | | | 35,737 |
| | | | | | | | | | | | | |
Earnings (loss) before income taxes | | | 82,473 | | | 54,197 | | | (78,193 | ) | | | 58,477 |
| | | | | | | | | | | | | |
Assets | | | 699,792 | | | 595,859 | | | 102,622 | | | | 1,398,273 |
Capital expenditures | | | 20,870 | | | 12,447 | | | 2,785 | | | | 36,102 |
Depreciation and amortization | | | 26,686 | | | 14,366 | | | 5,717 | | | | 46,769 |
Restructuring and other charges | | | — | | | — | | | 12,805 | | | | 12,805 |
– 39 –
NOTES TO CONSOLIDATED FINANCIAL STATEMENTS
(in thousands except employee and per share data) Years ended December 31, 2005, 2004 and 2003
GEOGRAPHIC INFORMATION The Company has manufacturing facilities or sales offices in North America, South America, Europe, Asia, Australia and Africa.
| | | | | | | | | |
(in thousands) | | 2005 | | 2004 | | 2003 |
Revenue from external customers: | | | | | | | | | |
North America | | $ | 569,319 | | $ | 566,915 | | $ | 558,953 |
Europe | | | 304,936 | | | 318,007 | | | 286,857 |
Asia Pacific | | | 94,999 | | | 110,735 | | | 86,492 |
Other | | | 54,676 | | | 51,476 | | | 54,907 |
| | | | | | | | | |
Consolidated | | $ | 1,023,930 | | $ | 1,047,133 | | $ | 987,209 |
| | | | | | | | | |
Long-lived assets: | | | | | | | | | |
North America | | $ | 410,202 | | $ | 420,095 | | $ | 431,722 |
Europe | | | 448,462 | | | 510,850 | | | 465,748 |
Asia Pacific | | | 18,995 | | | 21,100 | | | 18,841 |
Other | | | 270 | | | 289 | | | 487 |
| | | | | | | | | |
Consolidated | | $ | 877,929 | | $ | 952,334 | | $ | 916,798 |
| | | | | | | | | |
Sales in the United States, based on the final country of destination of the Company’s products, were $418.7 million, $426.3 million and $436.9 million in 2005, 2004 and 2003, respectively. No other country of destination exceeded 10% of consolidated sales. Total long-lived assets in the United States amounted to $339.4 million, $352.2 million and $366.0 million at December 31, 2005, 2004 and 2003, respectively.
| 11. | Restructuring and Other Charges |
The Company recorded restructuring and other charges of $12.8 million ($9.8 million after tax, or $0.21 per share) in the fourth quarter of 2005 related to a cost reduction plan and an impairment charge to write-down the value of a minority investment as a result of a change in plans for that company by its majority investor.
The Company’s cost reduction plan is intended to improve profitability and mitigate the impact of higher costs within its businesses. The plan also addresses the need to close facilities and reduce headcount in response to lower inkjet ink volumes. The plan will result in the closure of two excess manufacturing facilities, a total reduction in global headcount of approximately 140 employees across all segments and the elimination of three product lines. Activities to relocate production equipment and prepare excess facilities and excess equipment for sale or disposal began in the fourth quarter of 2005 and are anticipated to be completed by the end of the second quarter of 2006. Costs to be incurred in 2006 as a result of this plan are not expected to be significant.
Detail of the restructuring and other charges and the line items in which they were recorded in the Corporate and Other segment is as follows:
| | | | | | | | | |
(in thousands) | | RESTRUCTURING
AND OTHER
CHARGES | | COSTS OF
PRODUCTS
SOLD | | TOTAL |
Employee termination expenses | | $ | 6,402 | | $ | — | | $ | 6,402 |
Long-lived asset impairment charges for excess equipment | | | 492 | | | — | | | 492 |
Write-down of inventory to net realizable value | | | — | | | 4,340 | | | 4,340 |
Contract terminations | | | 461 | | | — | | | 461 |
Write-down of minority investment | | | 558 | | | — | | | 558 |
Other costs, including the dismantling of equipment | | | 552 | | | — | | | 552 |
| | | | | | | | | |
Total | | $ | 8,465 | | $ | 4,340 | | $ | 12,805 |
| | | | | | | | | |
The company recorded restructuring charges of $6.5 million ($4.7 million after-tax, $0.10 per share) in December 2003, related primarily to improving cost efficiency worldwide with emphasis on the Color Group. The $6.5 million in charges includes $4.0 million of cash expenditures for severance and other employee separation costs associated with a workforce reduction of approximately 165 employees and $2.5 million of non-cash costs related to asset impairment charges. The employees were terminated as of December 31, 2003.
The following table summarizes the changes to the accrual for restructuring and other charges:
| | | | | | | | | | | | |
(in thousands) | | EMPLOYEE
SEPARATIONS | | | ASSET-
RELATED
AND OTHERS | | | TOTAL | |
December 2003 charge | | $ | 3,952 | | | $ | 2,524 | | | $ | 6,476 | |
Cash spent | | | (1,184 | ) | | | — | | | | (1,184 | ) |
Reductions of assets | | | — | | | | (2,524 | ) | | | (2,524 | ) |
| | | | | | | | | | | | |
Balances at December 31, 2003 | | | 2,768 | | | | — | | | | 2,768 | |
Cash spent | | | (2,411 | ) | | | — | | | | (2,411 | ) |
| | | | | | | | | | | | |
Balances at December 31, 2004 | | | 357 | | | | — | | | | 357 | |
December 2005 charge | | | 6,402 | | | | 6,403 | | | | 12,805 | |
Cash spent | | | (1,952 | ) | | | (181 | ) | | | (2,133 | ) |
Reductions of assets | | | — | | | | (5,390 | ) | | | (5,390 | ) |
| | | | | | | | | | | | |
Balances at December 31, 2005 | | $ | 4,807 | | | $ | 832 | | | $ | 5,639 | |
| | | | | | | | | | | | |
– 40 –
Sensient Technologies Corporation2005Annual Report
| 12. | Commitments and Contingencies |
LEASES
The Company leases certain facilities and equipment under operating lease arrangements. Aggregate minimum rental commitments at December 31, 2005, for all noncancelable operating leases with an initial lease term greater than one year were as follows for the years ending December 31,
| | | |
| (in thousands) | | |
2006 | | $ | 7,650 |
2007 | | | 5,710 |
2008 | | | 3,458 |
2009 | | | 2,402 |
2010 | | | 1,990 |
Thereafter | | | 5,334 |
| | | |
| | $ | 26,544 |
| | | |
Rent expense totaled $11.4 million, $10.6 million and $9.2 million during the years ended December 31, 2005, 2004 and 2003, respectively.
GUARANTEES
In connection with the sale of substantially all of the Company’s Yeast business on February 23, 2001, the Company provided the buyer with indemnification against certain potential liabilities as is customary in transactions of this nature. The period provided for indemnification against most types of claims has now expired, but for specific types of claims, including but not limited to tax and environmental liabilities, the amount of time provided for indemnification is either five years or the applicable statute of limitations. The maximum amount of the Company’s liability related to certain of these provisions is capped at approximately 35% of the consideration received in the transaction. Liability related to certain matters, including claims relating to pre-closing environmental liabilities, is not capped. In cases where the Company believes it is probable that payments would be required under these provisions, the Company has recognized a liability.
ENVIRONMENT MATTER
The Company is involved in two significant environmental cases, which are described below. The Company is also involved in other site closure and related environmental remediation and compliance activities at manufacturing sites primarily related to a 2001 acquisition for which reserves for environmental matters were established as of the date of purchase. Actions that are legally required or necessary to prepare the sites for sale are currently being performed.
Clean Air Act NOV
On June 24, 2004, the United States Environmental Protection Agency (the “EPA”) issued a Notice of Violation/ Finding of Violation (“NOV”) to Lesaffre Yeast Corporation (“Lesaffre”) for alleged violations of the Wisconsin air emission requirements. The NOV generally alleges that Lesaffre’s Milwaukee, Wisconsin, facility violated air emissions limits for volatile organic compounds during certain periods from 1999 through 2003. Some of these violations allegedly occurred before Lesaffre purchased Red Star Yeast & Products (“Red Star Yeast”) from the Company.
On June 30, 2005, the EPA issued a second NOV to Lesaffre and Sensient which alleged that certain operational changes were made during Sensient’s ownership of the Milwaukee facility without complying with the new source review procedures and without the required air pollution control permit. While the Company’s evaluation is continuing, there appear to be significant legal defenses available to the Company in connection with the alleged violations.
The Company has met with the EPA in an attempt to resolve the NOVs. In September 2005, as a follow up to one of those meetings, the Company submitted information to refute the allegations of the June 30, 2005 NOV and requested that the NOV be withdrawn. The Company is awaiting the EPA’s response to that submission.
In connection with the sale of Red Star Yeast, the Company provided Lesaffre and certain of its affiliates with indemnification against environmental claims attributable to the operation, activities or ownership of Red Star Yeast prior to February 23, 2001, the closing date of the sale. The Company has not received a claim for indemnity from Lesaffre with respect to this matter. In December 2005, Lesaffre closed the Milwaukee plant. The Company informed the EPA of this development.
Superfund Claim
On July 6, 2004, the EPA notified the Company’s Sensient Colors Inc. subsidiary that it may be a potentially responsible party (“PRP”) under the Comprehensive Environmental Response, Compensation and Liability Act (“CERCLA”) for activities at the General Color Company Superfund Site in Camden, New Jersey. The EPA requested reimbursement of $10.9 million in clean-up costs, plus interest. Sensient Colors Inc. advised the EPA that this site had been expressly excluded from the Company’s 1988 stock purchase of H. Kohnstamm & Company, Inc. (now Sensient Colors Inc.). The selling shareholders had retained ownership of and
– 41 –
NOTES TO CONSOLIDATED FINANCIAL STATEMENTS
(in thousands except employee and per share data) Years ended December 31, 2005, 2004 and 2003
liability for the site, and some became owners of General Color Company, which continued to operate there until the mid-1990s. The Company’s legal defense costs are being paid by an insurer with a reservation of coverage rights. Litigation to resolve coverage rights is pending. The Company continues to assess the existence and solvency of other PRPs, additional insurance coverage, the nature of the alleged contamination, and the extent to which the EPA’s activities satisfy the requirements for reimbursement under CERCLA, as well as the legal sufficiency of excluding this site from the 1988 transaction. In a letter to the EPA dated January 31, 2005, the Company outlined legal challenges to the recoverability of certain costs and urged the EPA to pursue General Color Company and related parties. The EPA subsequently informed the Company that it is unwilling to discuss these legal challenges without prior conditions and may refer this matter to the Department of Justice, which would evaluate the referral for potential civil litigation under applicable environmental laws.
As of December 31, 2005, the liabilities related to environmental remediation obligations could range from $1.6 million to $15.8 million. As of December 31, 2005, the Company has accrued $2.6 million for environmental matters, of which $2.2 million is related to the environmental reserves established in connection with the 2001 acquisition discussed above. This accrual represents management’s best estimate of these liabilities. Although costs could be significantly higher, it is the opinion of Company management that the probability that costs in excess of those accrued will have a material adverse impact on the Company’s consolidated financial statements is remote. There can be no assurance, however, that additional environmental matters will not arise in the future. The Company has not recorded any potential recoveries related to these matters, as receipts are not yet assured.
LITIGATION
There are three significant commercial cases pending against the Company, which are disclosed below.
Remmes v. Sensient Flavors Inc. et al.
In June 2004, the Company and certain other flavor manufacturers were sued in Iowa state court by Kevin Remmes, who alleged that while working at American Popcorn Company of Sioux City, Iowa, he was exposed to butter flavoring vapors that caused injury to his lungs and respiratory system. The Company, among others, sold butter flavoring used in the manufacture of microwave popcorn to American Popcorn Company. The suit was removed to the Federal District Court for the Northern District of Iowa, Western Division. The Company believes that plaintiff’s claims are without merit and is vigorously defending this case. A trial date has been set in March 2007. One of the Company’s insurers has acknowledged coverage and is paying defense costs since the deductible has been exceeded.
Fults et al. v. Sensient Flavors Inc. et al.
In August 2005, the Company and certain other flavoring manufacturers were sued in the City of St. Louis, Missouri, Circuit Court by Elizabeth Fults (as administrator for the Estate of Dixie Asbury), Nancy Lee Dudley and Jill Roth, all of whom allege that they suffered damage as a result of work-related exposure to butter flavoring vapors at the Gilster Mary Lee microwave popcorn plant in McBride, Missouri. At present, it is unclear whether and to what extent the Company ever sold butter flavoring products to this facility. The Company intends to file a motion to dismiss and will vigorously defend its interests in this case. A trial date has been set in this matter for May 2007.
Kuiper et al. v. Sensient Flavors Inc. et al.
In late January 2006, the Company and certain other flavor manufacturers were sued in the Federal District Court for the Northern District of Iowa, Western Division, by Ronald Kuiper and his spouse, Conley Kuiper. Mr. Kuiper claims that while working at American Popcorn Company of Sioux City, Iowa, he was exposed to butter flavoring vapors that caused injury to his lungs and respiratory system. Ms. Kuiper’s claim is for loss of consortium. The allegations of this Complaint are virtually identical to those contained in the Remmes Complaint. Plaintiffs’ counsel moved to consolidate the Kuiper case with the Remmes case for discovery purposes; the Court denied the motion on procedural grounds. The Company believes that plaintiffs’ claims are without merit and is vigorously defending this case. A trial date has not yet been set in this matter.
The Company is involved in various other claims and litigation arising in the normal course of business. In the judgment of management, which relies in part on information from Company counsel, the ultimate resolution of these actions will not materially affect the consolidated financial statements of the Company except as described above.
– 42 –
Sensient Technologies Corporation2005Annual Report
MANAGEMENT’S REPORT ON INTERNAL CONTROL OVER FINANCIAL REPORTING
The management of Sensient Technologies Corporation is responsible for establishing and maintaining adequate internal control over financial reporting. It is management’s policy to maintain a control-conscious environment through an effective system of internal accounting controls. These controls are supported by the careful selection of competent and knowledgeable personnel and by the communication of standard accounting and reporting policies and procedures throughout the Company. These controls are designed to provide reasonable assurance regarding the reliability of financial reporting and the preparation of financial statements for external purposes in accordance with generally accepted accounting principles.
Management has assessed the effectiveness of the Company’s internal control over financial reporting as of December 31, 2005. In making its assessment of internal control over financial reporting, management used the criteria set forth by the Committee of Sponsoring Organizations of the Treadway Commission in Internal Control – Integrated Framework. Based on that assessment, management has concluded that the Company’s internal control over financial reporting was effective as of December 31, 2005.
The Company’s independent registered public accounting firm has issued their attestation report on management’s assessment of internal control over financial reporting. This report appears on page 44.
REPORT OF INDEPENDENT REGISTERED PUBLIC ACCOUNTING FIRM
To the Board of Directors and Stockholders of
Sensient Technologies Corporation
Milwaukee, Wisconsin
We have audited the accompanying consolidated balance sheets of Sensient Technologies Corporation and subsidiaries (the “Company”) as of December 31, 2005 and 2004, and the related consolidated statements of income, stockholders’ equity, and cash flows for each of the three years in the period ended December 31, 2005. These financial statements are the responsibility of the Company’s management. Our responsibility is to express an opinion on these financial statements based on our audits.
We conducted our audits in accordance with the standards of the Public Company Accounting Oversight Board (United States). Those standards require that we plan and perform the audit to obtain reasonable assurance about whether the financial statements are free of material misstatement. An audit includes examining, on a test basis, evidence supporting the amounts and disclosures in the financial statements. An audit also includes assessing the accounting principles used and significant estimates made by management, as well as evaluating the overall financial statement presentation. We believe that our audits provide a reasonable basis for our opinion.
In our opinion, such consolidated financial statements present fairly, in all material respects, the financial position of Sensient Technologies Corporation and subsidiaries as of December 31, 2005 and 2004, and the results of their operations and their cash flows for each of the three years in the period ended December 31, 2005, in conformity with accounting principles generally accepted in the United States of America.
We have also audited, in accordance with the standards of the Public Company Accounting Oversight Board (United States), the effectiveness of the Company’s internal control over financial reporting as of December 31, 2005, based on the criteria established in Internal Control—Integrated Framework issued by the Committee of Sponsoring Organizations of the Treadway Commission and our report dated February 17, 2006 expressed an unqualified opinion on management’s assessment of the effectiveness of the Company’s internal control over financial reporting and an unqualified opinion on the effectiveness of the Company’s internal control over financial reporting.
|
|
 |
|
Milwaukee, Wisconsin February 17, 2006 |
– 43 –
REPORT OF INDEPENDENT REGISTERED PUBLIC ACCOUNTING FIRM
ON INTERNAL CONTROL OVER FINANCIAL REPORTING
To the Board of Directors and Stockholders of
Sensient Technologies Corporation
Milwaukee, Wisconsin
We have audited management’s assessment, included in the accompanying Management’s Report on Internal Control Over Financial Reporting, that Sensient Technologies Corporation and subsidiaries (the “Company”) maintained effective internal control over financial reporting as of December 31, 2005, based on criteria established in Internal Control—Integrated Framework issued by the Committee of Sponsoring Organizations of the Treadway Commission. The Company’s management is responsible for maintaining effective internal control over financial reporting and for its assessment of the effectiveness of internal control over financial reporting. Our responsibility is to express an opinion on management’s assessment and an opinion on the effectiveness of the Company’s internal control over financial reporting based on our audit.
We conducted our audit in accordance with the standards of the Public Company Accounting Oversight Board (United States). Those standards require that we plan and perform the audit to obtain reasonable assurance about whether effective internal control over financial reporting was maintained in all material respects. Our audit included obtaining an understanding of internal control over financial reporting, evaluating management’s assessment, testing and evaluating the design and operating effectiveness of internal control, and performing such other procedures as we considered necessary in the circumstances. We believe that our audit provides a reasonable basis for our opinions.
A company’s internal control over financial reporting is a process designed by, or under the supervision of, the company’s principal executive and principal financial officers, or persons performing similar functions, and effected by the company’s board of directors, management, and other personnel to provide reasonable assurance regarding the reliability of financial reporting and the preparation of financial statements for external purposes in accordance with generally accepted accounting principles. A company’s internal control over financial reporting includes those policies and procedures that (1) pertain to the maintenance of records that, in reasonable detail, accurately and fairly reflect the transactions and dispositions of the assets of the company; (2) provide reasonable assurance that transactions are recorded as necessary to permit preparation of financial statements in accordance with generally accepted accounting principles, and that receipts and expenditures of the company are being made only in accordance with authorizations of management and directors of the company; and (3) provide reasonable assurance regarding prevention or timely detection of unauthorized acquisition, use, or disposition of the company’s assets that could have a material effect on the financial statements.
Because of the inherent limitations of internal control over financial reporting, including the possibility of collusion or improper management override of controls, material misstatements due to error or fraud may not be prevented or detected on a timely basis. Also, projections of any evaluation of the effectiveness of the internal control over financial reporting to future periods are subject to the risk that the controls may become inadequate because of changes in conditions, or that the degree of compliance with the policies or procedures may deteriorate.
In our opinion, management’s assessment that the Company maintained effective internal control over financial reporting as of December 31, 2005, is fairly stated, in all material respects, based on the criteria established in Internal Control—Integrated Framework issued by the Committee of Sponsoring Organizations of the Treadway Commission. Also in our opinion, the Company maintained, in all material respects, effective internal control over financial reporting as of December 31, 2005, based on the criteria established in Internal Control—Integrated Framework issued by the Committee of Sponsoring Organizations of the Treadway Commission.
We have also audited, in accordance with the standards of the Public Company Accounting Oversight Board (United States), the consolidated financial statements and financial statement schedules as of and for the year ended December 31, 2005 of the Company and our report dated February 17, 2006 expressed an unqualified opinion on those financial statements and financial statement schedules.
|
|
|
|
Milwaukee, Wisconsin February 17, 2006 |
– 44 –
Sensient Technologies Corporation2005Annual Report
CHANGE IN INDEPENDENT REGISTERED PUBLIC ACCOUNTING FIRM
On February 17, 2006, the Audit Committee notified Deloitte & Touche LLP (“Deloitte”) that upon completion of the 2005 engagement and the filing of the Company’s 2005 Form 10-K, Deloitte would be dismissed as the Company’s independent registered public accounting firm. The engagement was completed and the dismissal occurred shortly before the mailing of this annual report. Deloitte’s reports on the Company’s consolidated financial statements as of and for the fiscal years ended December 31, 2004 and 2005, did not contain any adverse opinion or disclaimer of opinion, nor were they qualified or modified as to uncertainty, audit scope or accounting principle.
During the years ended December 31, 2004 and 2005, and the subsequent period through February 17, 2006, there were no reportable events described in Item 304(a)(1)(v) of Regulation S-K and there were no disagreements with Deloitte on any matter of accounting principles or practices, financial statement disclosure, or auditing scope or procedure, which disagreements, if not resolved to Deloitte’s satisfaction, would have caused Deloitte to make reference thereto in their reports on the financial statements for such years except as described in this paragraph. With respect to 2004 there were disagreements with Deloitte with respect to the impairment of a receivable and the recording of an income tax benefit. The disagreements were resolved and the Company recorded corresponding adjustments prior to finalizing its 2004 audited financial statements. The Audit Committee discussed these matters with Deloitte. Also, the Company reported a material weakness in the Company’s internal controls at December 31, 2004, with respect to inadequate support for management’s estimates regarding the impairment of the receivable, and with respect to the Company’s documentation related to the income tax benefit. The Company determined that the documentation in these regards was not sufficient to support the accounting treatment originally proposed, and described the related weakness in the Company’s internal controls at December 31, 2004. There were no disagreements or reportable events with respect to the 2005 financial statements, and no material weaknesses in internal controls at December 31, 2005, were identified.
On February 17, 2006, the Audit Committee appointed Ernst & Young LLP (“E&Y”) as the Company’s new independent registered public accounting firm, subject to that firm’s acceptance of the appointment and to shareholder ratification. The engagement letter was signed on February 24, 2006. During the fiscal years ended December 31, 2003, 2004 and 2005, and through February 24, 2006, neither the Company nor anyone acting on its behalf consulted with E&Y regarding any of the matters or events described in Items 304(a)(2)(i) and (ii) of Regulation S-K. The Company has authorized Deloitte to respond fully to any inquiries by E&Y regarding matters related to the disagreements described above.
QUARTERLY DATA
| | | | | | | | | | | | | | | |
| | | REVENUE | | GROSS
PROFIT | | NET
EARNINGS | | NET EARNING PER SHARE |
(in thousands except per share amounts) (unaudited) | | | | | BASIC | | DILUTED |
2005 | | | | | | | | | | | | | | | |
First Quarter | | $ | 250,877 | | $ | 74,580 | | $ | 12,831 | | $ | .27 | | $ | .27 |
Second Quarter | | | 263,750 | | | 79,430 | | | 15,863 | | | .34 | | | .34 |
Third Quarter | | | 256,416 | | | 73,046 | | | 14,128 | | | .30 | | | .30 |
Fourth Quarter | | | 252,887 | | | 65,621 | | | 1,373 | | | .03 | | | .03 |
2004 | | | | | | | | | | | | | | | |
First Quarter | | $ | 254,140 | | $ | 74,365 | | $ | 14,960 | | $ | .32 | | $ | .32 |
Second Quarter | | | 263,830 | | | 80,397 | | | 18,249 | | | .39 | | | .39 |
Third Quarter | | | 256,849 | | | 77,562 | | | 21,592 | | | .46 | | | .46 |
Fourth Quarter | | | 272,314 | | | 80,213 | | | 19,117 | | | .41 | | | .41 |
The fourth quarter of 2005 includes restructuring and other charges of $12.8 million pre-tax, $9.8 million after-tax or $0.21 per share (see Note 11).
COMMON STOCK PRICES AND DIVIDENDS
| | | | | | | | | |
| | | MARKET PRICE | | DIVIDENDS
PER SHARE |
| | | HIGH | | LOW | |
2005 | | | | | | | | | |
First Quarter | | $ | 23.97 | | $ | 20.20 | | $ | .15 |
Second Quarter | | | 21.91 | | | 19.55 | | | .15 |
Third Quarter | | | 22.13 | | | 18.04 | | | .15 |
Fourth Quarter | | | 19.66 | | | 16.82 | | | .15 |
2004 | | | | | | | | | |
First Quarter | | $ | 21.12 | | $ | 17.91 | | $ | .15 |
Second Quarter | | | 21.84 | | | 18.28 | | | .15 |
Third Quarter | | | 22.43 | | | 18.95 | | | .15 |
Fourth Quarter | | | 24.25 | | | 20.53 | | | .15 |
– 45 –
FIVE YEAR REVIEW
| | | | | | | |
(in thousands except employee and per share data) Years ended December 31, | | 2005 | |
SUMMARYOF OPERATIONS | | | | | | | |
Revenue | | $ | 1,023,930 | | | 100.0 | % |
Cost of products sold | | | 731,253 | | | 71.4 | |
Selling and administrative expenses | | | 189,998 | | | 18.6 | |
Restructuring and other charges | | | 8,465 | | | .8 | |
| | | | | | | |
Operating income | | | 94,214 | | | 9.2 | |
Interest expense | | | 35,737 | | | 3.5 | |
| | | | | | | |
Earnings from continuing operations before income taxes | | | 58,477 | | | 5.7 | |
Income taxes | | | 14,282 | | | 1.4 | |
| | | | | | | |
Earnings from continuing operations | | | 44,195 | | | 4.3 | |
Earnings from discontinued operations | | | — | | | — | |
Net earnings | | $ | 44,195 | | | 4.3 | % |
| | | | | | | |
Basic earnings per share | | | | | | | |
Continuing operations | | $ | 0.95 | | | | |
Discontinued operations | | | — | | | | |
Net earnings | | $ | 0.95 | | | | |
| | | | | | | |
Diluted earnings per share | | | | | | | |
Continuing operations | | $ | 0.94 | | | | |
Discontinued operations | | | — | | | | |
Net earnings | | $ | 0.94 | | | | |
| | | | | | | |
| | |
OTHER RELATED DATA | | | | | | | |
Dividends per share, declared and paid | | $ | .60 | | | | |
Average common shares outstanding: | | | | | | | |
Basic | | | 46,746 | | | | |
Diluted | | | 47,067 | | | | |
Book value per common share | | $ | 13.43 | | | | |
Price range per common share | | | 16.82-23.97 | | | | |
Share price at December 31 | | | 17.90 | | | | |
Capital expenditures for continuing operations | | | 36,102 | | | | |
Depreciation for continuing operations | | | 43,502 | | | | |
Amortization for continuing operations | | | 3,267 | | | | |
Total assets | | | 1,398,273 | | | | |
Long-term debt | | | 283,123 | | | | |
Total debt | | | 553,682 | | | | |
Shareholders’ equity | | | 622,228 | | | | |
Return on average shareholders’ equity | | | 6.8 | % | | | |
Total debt to total capital | | | 47.1 | % | | | |
Employees | | | 3,518 | | | | |
The 2005 results include restructuring and other charges of $12.8 million ($9.8 million after tax, or $0.21 per share) related to a cost reduction program and an impairment charge (see Note 11). The charges were recorded in cost of products sold ($4.3 million) and in restructuring and other charges ($8.5 million).
The 2003 results include restructuring charges related to a cost reduction plan of $6.5 million (see Note 11) and a $13.3 million credit related to termination of postretirement health care plan benefits included in selling and administrative expenses (see Note 8).
The 2001 results include goodwill amortization, net of tax, of $8.0 million. Due to an accounting change, goodwill is no longer amortized.
– 46 –
Sensient Technologies Corporation2005Annual Report
| | | | | | | | | | | | | | | | | | | | | | | | | | |
| 2004 | | | 2003 | | | 2002 | | | 2001 | |
| $ | 1,047,133 | | | 100.0 | % | | $ | 987,209 | | | 100.0 | % | | $ | 939,886 | | | 100.0 | % | | $ | 816,947 | | | 100.0 | % |
| | 734,596 | | | 70.2 | | | | 677,414 | | | 68.6 | | | | 633,011 | | | 67.3 | | | | 550,331 | | | 67.3 | |
| | 183,381 | | | 17.5 | | | | 165,835 | | | 16.8 | | | | 160,380 | | | 17.1 | | | | 145,126 | | | 17.8 | |
| | — | | | — | | | | 6,476 | | | 0.7 | | | | — | | | — | | | | — | | | — | |
| | | | | | | | | | | | | | | | | | | | | | | | | | | |
| | 129,156 | | | 12.3 | | | | 137,484 | | | 13.9 | | | | 146,495 | | | 15.6 | | | | 121,490 | | | 14.9 | |
| | 31,265 | | | 3.0 | | | | 29,140 | | | 2.9 | | | | 29,523 | | | 3.1 | | | | 31,531 | | | 3.9 | |
| | | | | | | | | | | | | | | | | | | | | | | | | | | |
| | 97,891 | | | 9.3 | | | | 108,344 | | | 11.0 | | | | 116,972 | | | 12.5 | | | | 89,959 | | | 11.0 | |
| | 23,973 | | | 2.2 | | | | 26,912 | | | 2.8 | | | | 36,282 | | | 3.9 | | | | 24,996 | | | 3.0 | |
| | | | | | | | | | | | | | | | | | | | | | | | | | | |
| | 73,918 | | | 7.1 | | | | 81,432 | | | 8.2 | | | | 80,690 | | | 8.6 | | | | 64,963 | | | 8.0 | |
| | — | | | — | | | | — | | | — | | | | — | | | — | | | | 8,639 | | | 1.0 | |
| $ | 73,918 | | | 7.1 | % | | $ | 81,432 | | | 8.2 | % | | $ | 80,690 | | | 8.6 | % | | $ | 73,602 | | | 9.0 | % |
| | | | | | | | | | | | | | | | | | | | | | | | | | | |
| | | | | | | | | | | | | | | | | | | | | | | | | | |
| $ | 1.59 | | | | | | $ | 1.74 | | | | | | $ | 1.70 | | | | | | $ | 1.36 | | | | |
| | — | | | | | | | — | | | | | | | — | | | | | | | .18 | | | | |
| $ | 1.59 | | | | | | $ | 1.74 | | | | | | $ | 1.70 | | | | | | $ | 1.54 | | | | |
| | | | | | | | | | | | | | | | | | | | | | | | | | | |
| | | | | | | | | | | | | | | | | | | | | | | | | | |
| $ | 1.58 | | | | | | $ | 1.73 | | | | | | $ | 1.69 | | | | | | $ | 1.36 | | | | |
| | — | | | | | | | — | | | | | | | — | | | | | | | .18 | | | | |
| $ | 1.58 | | | | | | $ | 1.73 | | | | | | $ | 1.69 | | | | | | $ | 1.54 | | | | |
| | | | | | | | | | | | | | | | | | | | | | | | | | | |
| | | | | | | | | | | | | | | | | | | | | | | | | | |
| | | | | | | | | | | | | | | | | | | | | | | | | | |
| $ | .60 | | | | | | $ | .59 | | | | | | $ | .5375 | | | | | | $ | .53 | | | | |
| | | | | | | | | | | | | | | | | | | | | | | | | | |
| | 46,562 | | | | | | | 46,741 | | | | | | | 47,379 | | | | | | | 47,671 | | | | |
| | 46,877 | | | | | | | 47,041 | | | | | | | 47,788 | | | | | | | 47,926 | | | | |
| $ | 13.99 | | | | | | $ | 12.42 | | | | | | $ | 10.58 | | | | | | $ | 9.09 | | | | |
| | 17.91-24.25 | | | | | | | 17.86-24.26 | | | | | | | 17.95-25.96 | | | | | | | 15.55-23.99 | | | | |
| | 23.99 | | | | | | | 19.77 | | | | | | | 22.47 | | | | | | | 20.81 | | | | |
| | 49,845 | | | | | | | 74,208 | | | | | | | 47,317 | | | | | | | 38,001 | | | | |
| | 43,900 | | | | | | | 40,385 | | | | | | | 38,899 | | | | | | | 37,019 | | | | |
| | 2,343 | | | | | | | 2,713 | | | | | | | 2,391 | | | | | | | 9,271 | | | | |
| | 1,488,578 | | | | | | | 1,453,528 | | | | | | | 1,285,685 | | | | | | | 1,108,893 | | | | |
| | 525,153 | | | | | | | 525,924 | | | | | | | 511,707 | | | | | | | 423,137 | | | | |
| | 615,196 | | | | | | | 654,657 | | | | | | | 558,699 | | | | | | | 491,603 | | | | |
| | 658,698 | | | | | | | 580,118 | | | | | | | 499,358 | | | | | | | 430,816 | | | | |
| | 12.2 | % | | | | | | 15.2 | % | | | | | | 17.3 | % | | | | | | 17.7 | % | | | |
| | 48.3 | % | | | | | | 53.0 | % | | | | | | 52.8 | % | | | | | | 53.3 | % | | | |
| | 3,728 | | | | | | | 3,845 | | | | | | | 3,572 | | | | | | | 3,454 | | | | |
– 47 –
DIRECTORS AND OFFICERS
board of directors
Kenneth P. Manning, 64
Chairman, President and Chief Executive Officer
Sensient Technologies Corporation
Elected Director in 1989 (2, 6)
Michael E. Batten, 65
Chairman and Chief Executive Officer
Twin Disc, Inc.
Elected Director in 1980 (1, 5)
John F. Bergstrom, 59
Chairman and Chief Executive Officer
Bergstrom Corporation
Elected Director in 1994 (2, 3, 5)
Hank Brown, 66
President
University of Colorado
Elected Director in 2004 (1, 4, 5)
Fergus M. Clydesdale, Ph.D., 69
Distinguished Professor and
Head of the Department of Food Science
University of Massachusetts–Amherst
Elected Director in 1998 (3, 4, 6)
James A.D. Croft, 68
Chairman
Bartlodge Limited
Elected Director in 1997 (1, 2, 3)
William V. Hickey, 61
President and Chief Executive Officer
Sealed Air Corporation
Elected Director in 1997 (1, 2, 4, 5)
Peter M. Salmon, 56
President
International Food Network, Inc.
Elected Director in 2005 (6)
Essie Whitelaw, 58
Senior Vice President of Private
Sector Claims Administration
Wisconsin Physician Services
Elected Director in 1993 (3, 4)
committees
| 3 | Compensation and Development Committee |
| 4 | Nominating and Corporate Governance Committee |
| 6 | Scientific Advisory Committee |
elected officers
Kenneth P. Manning, 64
Chairman, President and Chief Executive Officer
With the Company 18 years
Peter Bradley, 46
President – Color Group
With the Company 3 years
Richard Carney, 55
Vice President – Administration
With the Company 24 years
John Collopy, 36
Assistant Treasurer
With the Company 6 years
John L. Hammond, 59
Vice President, Secretary and General Counsel
With the Company 8 years
Richard F. Hobbs, 58
Vice President, Chief Financial Officer
and Treasurer
With the Company 32 years
Richard J. Malin,39
Assistant Controller
With the Company 14 years
Ralph G. Pickles, 59
President – Flavors & Fragrances Group
With the Company 10 years
Stephen J. Rolfs, 41
Vice President, Controller and
Chief Accounting Officer
With the Company 8 years
Ho-Seung Yang, Ph.D., 58
Vice President – Marketing & Technology
With the Company 10 years
appointed officers
Neil G. Cracknell, 44
President, Dehydrated Flavors
With the Company 11 years
Robert L. Menzl, 49
Vice President, Information Technology
With the Company 10 years
Trevor Rahill, 52
Vice President, Flavors
With the Company 15 years
Robert Wilkins, 38
President, Asia Pacific Group
With the Company 2 years
– 48 –
INVESTOR INFORMATION
WORLD HEADQUARTERS
777 East Wisconsin Avenue
Milwaukee, Wisconsin 53202-5304
(414) 271-6755
(800) 558-9892
Fax: (414) 347-4795
E-mail: corporate.communications@sensient-tech.com
Web site: www.sensient-tech.com
TRANSFER AGENT AND REGISTRAR
Wells Fargo Bank Minnesota, N.A.
Shareowner Services
P. O. Box 64854
St. Paul, Minnesota 55164-0854
(800) 468-9716
Web site: www.wellsfargo.com/com/shareowner_services/
COMMON STOCK
Sensient Technologies Corporation Common Stock is traded on the New York Stock Exchange. Ticker symbol: SXT.
There were 3,676 shareholders of record of Common Stock as of January 31, 2006.
ANNUAL MEETING OF SHAREHOLDERS
The Annual Meeting of Shareholders will be held at 2:00 p.m. (CDT) on Thursday, April 27, 2006, at InterContinental Chicago, 505 North Michigan Avenue, Chicago, Illinois.
FORM 10-K
The Company’s annual report filed with the Securities and Exchange Commission on Form 10-K is available without charge from the Company’s Investor Relations Department and on its Web site at www.sensient-tech.com.
DIVIDENDS
Quarterly dividends are typically paid on the first business day of March, June, September and December.
AUTOMATIC DIVIDEND
REINVESTMENT PLAN
The Sensient Technologies Corporation Dividend Reinvestment Plan provides shareholders with a convenient, economical way to increase their ownership of Sensient Technologies Corporation Common Stock. Through the plan, shareholders can automatically reinvest their dividends to acquire additional shares and make supplemental stock purchases without paying fees or commissions. An enrollment form and brochure describing the plan can be obtained by contacting the plan administrator, Wells Fargo Bank Minnesota at (800) 468-9716 or the Company’s Investor Relations Department at (414) 347-3779.
INVESTOR RELATIONS
Communications concerning the transfer of shares, lost certificates, duplicate mailings or change of address should be directed to the transfer agent.
Other shareholder information, such as news releases and information regarding corporate governance, is available on the Company’s Web site: www.sensient-tech.com. Shareholders can also register to receive notification via e-mail when new information is added to the site. The Company’s Web address is provided as an inactive textual reference only, and the contents of the Web site are not incorporated in or otherwise to be regarded as part of this annual report.
Other requests for information should be directed to the Company’s Investor Relations Department at (414) 347-3779.
The Company maintains a direct mailing list for news releases and quarterly reports. If you would like your name added to this list, please contact the Company’s Investor Relations Department.
In accordance with New York Stock Exchange rules and pursuant to Rule 13a-14 under the Securities and Exchange Act of 1934, Kenneth P. Manning, as the Company’s Chief Executive Officer, and Richard F. Hobbs, as the Company’s Chief Financial Officer, have certified the quality of the Company’s public disclosure in an exhibit to the Company’s Annual Report on Form 10-K for the year ended December 31, 2005. As Chief Executive Officer, in 2005 Kenneth P. Manning also has certified compliance with New York Stock Exchange corporate governance listing standards.
| | |
| SENSIENT TECHNOLOGIES CORPORATION | | 777 EAST WISCONSIN AVENUE |
| | MILWAUKEE, WI 53202-5304 |
| | WWW.SENSIENT-TECH.COM |