EXHIBIT 13.1

Sensient Technologies Corporation is a leading global developer, manufacturer and marketer of colors, flavors and fragrances. Sensient uses advanced, proprietary technologies at facilities around the world to develop food and beverage systems, cosmetic and pharmaceutical formulations, inkjet and specialty inks and colors, and other specialty chemicals.
Financial Highlights
in thousands except per share, employee and shareholder data
| | | | | | | | | |
| Years ended December 31, | | 2007 | | 2006 | | % Change | |
results of operations | | | | | | | | | |
| | | |
Revenue | | $ | 1,184,778 | | $ | 1,098,774 | | 7.8 | % |
Operating Income | | | 147,370 | | | 129,277 | | 14.0 | % |
Net Earnings | | | 77,786 | | | 66,425 | | 17.1 | % |
| | | |
per common share | | | | | | | | | |
| | | |
Net Earnings: | | | | | | | | | |
Basic | | $ | 1.66 | | $ | 1.45 | | 14.5 | % |
Diluted | | | 1.65 | | | 1.44 | | 14.6 | % |
Dividends | | | 0.68 | | | 0.61 | | 11.5 | % |
Book Value | | | 17.10 | | | 15.12 | | 13.1 | % |
| | | |
other information | | | | | | | | | |
| | | |
Capital Expenditures | | $ | 41,961 | | $ | 39,314 | | 6.7 | % |
Depreciation and Amortization | | $ | 44,312 | | $ | 43,044 | | 2.9 | % |
Total Debt | | $ | 507,108 | | $ | 532,532 | | (4.8 | )% |
Number of Employees | | | 3,623 | | | 3,582 | | 1.1 | % |
Number of Shareholders of Record | | | 3,309 | | | 3,440 | | (3.8 | )% |
Average Common Shares Outstanding – Basic | | | 46,740 | | | 45,900 | | 1.8 | % |
Average Common Shares Outstanding – Diluted | | | 47,257 | | | 46,204 | | 2.3 | % |
1

2007 Results
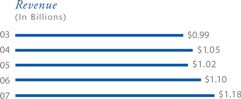
All of Sensient’s operating Groups achieved significant revenue and profit growth in 2007. The Company’s total 2007 revenue reached $1.2 billion, an increase of 7.8% over 2006 and a second consecutive year of record revenue. Net earnings were $77.8 million, an increase of 17.1% over 2006.
Sensient’s strong financial position and cash flow from operating activities have provided the opportunity to pay down debt, invest in R&D and allow our shareholders to share directly in the Company’s success. On July 19, 2007, the Board of Directors voted to increase the quarterly cash dividend on Sensient common stock from 16 cents per share to 18 cents per share, an increase of 12.5%.
For the year, our cash flow increased 6% to $105 million and we reduced total outstanding debt by $25.4 million. We expect to continue strengthening our balance sheet.
The Outcome of a Long-Term Strategy
In 1996, we launched a bold long-term strategy that transformed this Company. We divested commodity businesses, acquired new businesses and technologies and expanded around the globe. This strategy required fortitude, resolve and hard work at all levels of the Company.
It is clear that the Company’s long-term strategy is succeeding. We have a strong product mix, a worldwide customer base and the ability to create innovative systems
2
| | |
| | |
| | Sensient Technologies Corporation 2007 Annual Report |
| | |
used in the production of exceptional consumer products.
In 2007, a growing audience of investors and analysts took notice of our success. Investors recognized the current strength and long-term potential of Sensient and the stock price reached new record highs. It is very gratifying to me that this Company held fast to our strategy, and our investors are now seeing the rewards.
The Value of Technology
In today’s global marketplace, technology, scientific expertise and intellectual property distinguish industry leaders from their competitors. At every Sensient business unit, we make technology a priority, and this enables us to create unique, higher-margin products.
Sensient’s dehydrated flavors technology offers a good example. We create complex, high-performance dehydrated flavor systems that set the standard in the marketplace. Most Sensient dehydrated products begin with proprietary seed lines that produce bacteria-resistant, low-moisture raw materials. The use of satellite imagery and GPS also enhances raw material sourcing and production. Innovative processing, flavor formulation and large-scale production further extend Sensient’s leadership in dehydrated flavors.
The Company’s technologies also play a role in several new and fast-growing food and beverage segments. For instance, in North America and Europe, consumers increasingly want beverages that provide nutrients as well as refreshment. To meet this demand, Sensient is using proprietary extraction, encapsulation and micro-emulsion technologies to produce antioxidants, carotenoids, Omega-3 and other nutrients that can be incorporated into food and beverage systems.
New Products in a Global Marketplace
Sensient has increased revenues and margins in its traditional food and beverage business by using technology to surpass competitors and bring value to our customers. The food and beverage business also provides stability during periods of economic uncertainty.
At the same time, Sensient’s ability to innovate drives growth and creates new opportunities in dynamic non-food markets. We recently developed, patented and are now marketing an innovative powder-to-cream cosmetic application technology. Sensient’s new line of self-dispersing pigments improves the performance of inkjet inks. The Company’s pharmaceutical technologies, including highly purified colors and coatings, provide consistency and improve efficiency for manufacturers around the globe. The Company’s capabilities in fine chemical purification will create a range of new products in the coming years.
All of Sensient’s new products serve a global marketplace. Rapidly growing urban centers in Asia, South America and elsewhere fuel a demand for consumer goods such as personal care and household products, fragrances and cosmetics. We see strong promise in these markets well into the future.
International Corporate Leadership
As part of our transformation, Sensient established an entirely new corporate culture. We are a unified global Company with skilled personnel at more than 70 locations in 30 nations. We draw our executives and management not only from the United States, but also from Europe, Asia, South America and Africa.
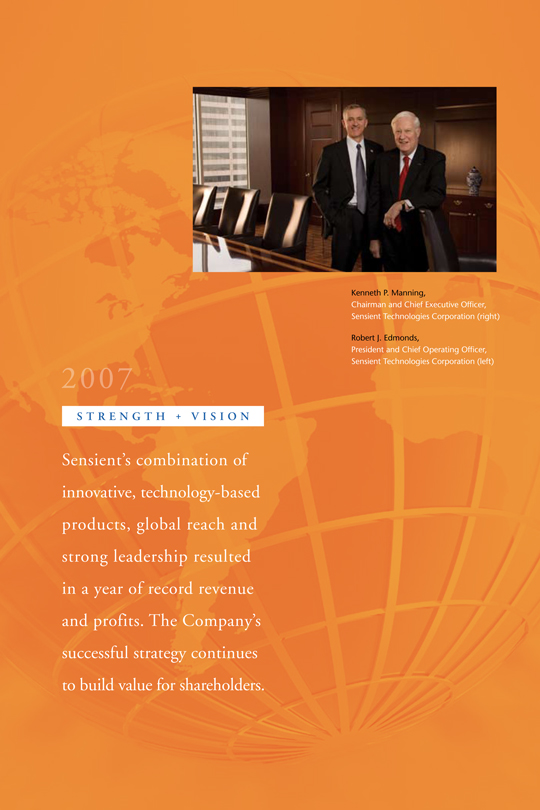
In August 2007, Sensient announced the appointment of Robert J. Edmonds as President and Chief Operating Officer. Rob has extensive international experience. He contributed significantly to the Company’s success as General Manager of Sensient Food Colors, North America, and will continue to do so in his new role.
Sensient has prospered during a decade of change because we established a well-planned growth strategy and stayed the course. Shareholders who also took a long-term view have now seen their foresight rewarded. We will continue to pursue a strategy that emphasizes product development, new technologies and global expansion. I fully expect shareholders to continue reaping the benefits of this Company’s strength and vision.
Sincerely,

Kenneth P. Manning
Chairman and Chief Executive Officer
3
business profile

| | |
strategic advantages | | • Worldwide facilities to meet local and multinational customer needs |
| | • Diverse technologies to supply a wide range of market segments |
| | • Compounding expertise to produce value-added chemical systems |
| | • Exceptional R&D, production and logistics services |
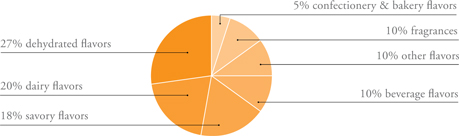
REVENUE BY PRODUCT LINE
4
| | |
| | |
| | Sensient Technologies Corporation 2007 Annual Report |
| | |

| | |
strategic advantages | | • A foundation of core technologies unmatched in the industry |
| | • Broad product mix for applications in food and non-food markets |
| | • The ability to extend product lines and develop entirely new products |
| | • A strong presence in fast-growing, emerging markets worldwide |
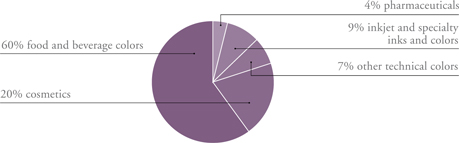
REVENUE BY PRODUCT LINE
5


state-of-the-art dehydrated flavor systems
Complex dehydrated flavor systems from Sensient enable food manufacturers around the world to develop exceptional products that stand out in the marketplace. Sensient conducts intensive research and draws on sophisticated technologies to improve our products and win new business. Today, we use proprietary seed lines, satellite crop imaging, customized agricultural equipment and innovative production technologies to extend our leadership in this market. Sensient’s dehydrated flavor systems are found in soups, sauces, breading, salad dressings and many other foods.
13
next-generation cosmetic applications
Sensient developed, patented and is now commercializing an innovative powder-to-cream cosmetic technology. Using a sophisticated chemical engineering process, Sensient combines high-quality pigments and thickening agents to produce a fine powder that turns creamy when applied. This technology can be used in the manufacture of eye shadow, blush, foundation, face creams and other applications. The stability of the formulation enables manufacturers to incorporate fragrance without affecting performance. The end products provide a pleasant texture, blend smoothly and resist moisture.


Templar® extraction technology
Sensient continues to advance the science of extraction and to uncover new market opportunities for the Company’s high-performance botanical extracts and compounds. At facilities in the United Kingdom, Sensient uses a unique liquid CO2 extraction process that produces exceptionally pure, highly concentrated extracts that improve the performance of fine fragrances, foods and beverages. Sensient’s extraction technology is also used to produce natural antioxidants that supply a growing demand for functional beverages.
15
Financial Review
Table of Contents
| | |
Management’s Discussion & Analysis of Operations & Financial Condition | | 17 |
| |
Consolidated Statements of Earnings | | 25 |
| |
| Consolidated Balance Sheets | | 26 |
| |
| Consolidated Statements of Cash Flows | | 27 |
| |
| Consolidated Statements of Shareholders’ Equity | | 28 |
| |
| Notes to Consolidated Financial Statements | | 30 |
| |
| Management’s Report on Internal Control Over Financial Reporting | | 44 |
| |
| Reports of Independent Registered Public Accounting Firms | | 45 |
| |
| Report of Independent Registered Public Accounting Firm on Internal Control Over Financial Reporting | | 46 |
| |
| Quarterly Data | | 47 |
| |
| Common Stock Prices and Dividends | | 47 |
| |
| Company Stock Performance | | 47 |
| |
| Five Year Review | | 48 |
| |
| Directors & Officers | | 50 |
| |
Investor Information | | inside back cover |
16
| | |
Management’s Discussion & Analysis | | |
| | Sensient Technologies Corporation 2007 Annual Report |
of Operations & Financial Condition | | |
Overview
During 2007, Sensient Technologies Corporation (the “Company”) reported record revenue and operating income. Increases in earnings per share were reported in all four quarters of 2007 from the comparable quarters in 2006. The Flavors & Fragrances Group reported record revenue and operating profit in 2007, and the Color Group reported solid increases in revenue and operating profit. Each group increased operating margin from 2006. The Company also continued to strengthen its financial position in 2007. Cash flows from operating activities increased 6.0% to $105.2 million, which allowed the Company to reduce debt levels. Total debt was reduced by more than $25 million during 2007.
Revenue for 2007 increased 7.8% to $1.2 billion from $1.1 billion in 2006. Sensient’s operating income was $147.4 million in 2007 versus $129.3 million in 2006. The primary factors driving higher operating income include the impact of higher volumes and prices in 2007 and the favorable impact of foreign currency translation. The increase in operating income as a result of these factors was partially offset by higher raw material costs. Additional information on these items is included in Results of Operations. Net earnings in 2007 were $77.8 million versus $66.4 million in 2006. Diluted earnings per share were $1.65 in 2007 compared to $1.44 per share in 2006.
Results of Operations
2007 vs. 2006
The Company’s revenue for 2007 was $1.18 billion, an increase of 7.8% from $1.10 billion reported in 2006. The Flavors & Fragrances Group increased revenue by $50.3 million, or 6.9%, over 2006 to $783.7 million. Revenue for the Color Group increased 7.9% to $377.9 million from $350.2 million reported in 2006. Revenue for the Asia Pacific Group in 2007 increased 23.4%. Approximately one-half of this year’s revenue increase is attributable to increased volumes and prices and the remainder is due to the impact of foreign currency translation. Additional information on Group results can be found in the Segment Information section.
The Company’s gross margin increased 40 basis points to 30.6% in 2007, from 30.2% in 2006. The increase was primarily due to higher selling prices partially offset by higher raw material costs.
Selling and administrative expenses as a percent of revenue decreased to 18.1% in 2007 from 18.5% in 2006. The decrease of 40 basis points was primarily due to a greater percentage increase in revenue than expenses partially offset by higher salaries, wages and employee costs.
Operating income was $147.4 million in 2007 compared to $129.3 million in 2006. The increased operating income was attributable to the volume and pricing improvements partially offset by higher raw material costs discussed above. Changes in foreign exchange rates in 2007 versus 2006 increased operating income by $5.7 million.
Interest expense increased 1.1% to $36.1 million in 2007 from $35.7 million in 2006. The impact of higher interest rates more than offset the benefit of lower average debt outstanding in 2007.
The effective income tax rate was 30.1% and 29.0% in 2007 and 2006, respectively. The effective tax rates for both 2007 and 2006 were reduced by discrete items, primarily including the favorable resolution of prior years’ tax matters and the reduction of the valuation allowance related to the planned use of foreign tax losses. In addition, the 2007 reported rate was increased because of tax rate changes that reduced the future benefit of certain deferred tax assets. These net discrete items reduced the effective tax rate for 2007 and 2006 by 3.0% and 5.2%, respectively. The 2007 rate excluding discrete items decreased 110 basis points in comparison to the rate in 2006.
| | | | | | |
| | | 2007 | | | 2006 | |
Rate excluding discrete items | | 33.1 | % | | 34.2 | % |
Discrete items | | (3.0 | )% | | (5.2 | )% |
| | | | | | |
Reported effective tax rate | | 30.1 | % | | 29.0 | % |
| | | | | | |
The effective tax rate for 2008 is expected to be approximately 33% prior to the recording of any discrete items.
17
| | |
Management’s Discussion & Analysis | | |
| | |
of Operations & Financial Condition continued | | |
Segment Information
The Company determines its operating segments based on information utilized by senior management to allocate resources and assess performance. The Company’s reportable segments consist of the Flavors & Fragrances Group and the Color Group.
Flavors & Fragrances
Revenue for the Flavors & Fragrances Group for the year ended December 31, 2007, increased 6.9% to $783.7 million. The increase of $50.3 million was primarily a result of the favorable impact of currency translation ($25.0 million), increased selling prices ($14.6 million) and higher volumes ($10.7 million). The majority of the increased selling prices occurred in dehydrated and other flavors in North America. Volume increases occurred in certain North American product lines and also in Europe and Asia.
Gross margin was 26.9% in 2007, a 30 basis point increase from the 26.6% gross margin in 2006. This change was primarily a result of the increased selling prices partially offset by higher raw material costs.
Operating income of $117.3 in 2007 was an increase of 12.3% from $104.5 million in 2006. The increase in operating income was primarily due to higher sales in North America ($9.7 million) and Europe ($2.7 million) combined with the impact of foreign currency translation ($2.2 million) partially offset by lower profit in the fragrances market ($1.9 million). The increased profit in North America was primarily due to higher selling prices in dehydrated and other flavors partially offset by higher raw material costs. The increased profit in Europe was primarily attributed to higher selling prices combined with lower costs. The lower profit in fragrances was due to lower selling prices. Operating income as a percent of revenue increased 80 basis points to 15.0% from 14.2% in 2006 primarily for the reasons discussed above.
Color Revenue for the Color Group increased 7.9% to $377.9 million in 2007 from $350.2 million in 2006. The higher revenue was primarily due to increased sales of food and beverage colors in all markets ($14.5 million), increased sales of cosmetic colors ($5.1 million) and the favorable impact of foreign currency translation ($14.2 million). The increased sales of food and beverage colors and cosmetic colors were primarily due to higher volumes. These gains were partially offset by lower volumes in technical colors ($6.0 million) as a result of lower demand for inkjet inks.
Gross margin for the Color Group was 35.6% in 2007, a 30 basis point increase from the Group’s 35.3% gross margin in 2006. Higher volumes combined with cost savings initiatives were the primary factors for the increase, although they were partially offset by higher raw material costs.
Operating income of $67.0 million in 2007 was an increase of 12.7% from $59.4 million in 2006. Operating income in food and beverage colors increased $2.7 million primarily due to the higher volumes. In Cosmetic Colors, higher volumes combined with lower costs increased operating income by $3.7 million. The impact of foreign currency translation increased operating profit by $2.7 million. These increases were partially offset by lower profit in technical colors ($0.9 million). The lower profits in technical colors were primarily due to lower volumes. Operating income as a percent of revenue increased 70 basis points to 17.7% from 17.0% in 2006 primarily due to the reasons described above.
2006 vs. 2005
Revenue for 2006 was $1.10 billion, an increase of 7.3% from $1.02 billion reported in 2005. Revenue for the Flavors & Fragrances Group increased by $62.8 million, or 9.4%, over 2005 to $733.4 million. The Color Group revenue increased 3.0% to $350.2 million from $339.9 million reported in 2005. The Asia Pacific Group 2006 revenue was flat with the prior year. The increase in consolidated revenue was primarily due to increased
18
| | |
| | |
| | Sensient Technologies Corporation 2007 Annual Report |
| | |
volumes and prices, particularly in the Flavors & Fragrances Group, and the favorable impact of foreign currency translation ($9.5 million). Additional information on Group results can be found in the Segment Information section.
The Company’s gross margin increased 160 basis points to 30.2% in 2006, from 28.6% in 2005. The increase was primarily due to higher sales volumes and improved mix (110 basis points) and benefits from the 2005 cost reduction program (20 basis points). Cost of products sold in 2005 also included $4.3 million of restructuring charges, which impacts the comparison of gross margin between 2006 and 2005 (40 basis points). The negative impact of increases in raw material costs in 2006 was offset by increases in selling prices.
Selling and administrative expenses as a percent of revenue decreased to 18.5% in 2006 from 18.6% in 2005. The Company’s cost reduction program and increased sales contributed to a reduction in this ratio of 60 basis points and 140 basis points, respectively. The impact of higher benefit costs and performance-based incentive compensation offset approximately 160 basis points of this reduction. In addition, comparisons between the years were impacted by 40 basis points because of an expense related to an arbitration order recorded in 2005.
Operating income was $129.3 million in 2006 compared to $94.2 million in 2005. The increased operating income was attributable to the volume, pricing and cost improvements outlined above. Changes in foreign exchange rates in 2006 versus 2005 increased operating income by $1.3 million. Operating income in 2005 included restructuring and other charges of $12.8 million.
Interest expense was $35.7 million in both 2006 and 2005. The benefit of lower average debt outstanding in 2006 was offset by higher interest rates.
The effective income tax rate was 29.0% and 24.4% in 2006 and 2005, respectively. The effective tax rates for both 2006 and 2005 were reduced by discrete items, primarily including the favorable resolution of prior years’ tax matters and the reduction of the valuation allowance related to the planned use of foreign tax losses. In addition, the 2005 reported rate was increased because certain costs incurred as part of the 2005 restructuring program did not generate a tax benefit. These net discrete items reduced the effective tax rate for 2006 and 2005 by 5.2% and 5.3%, respectively. The rate excluding discrete items has increased from 2005 to 2006 as a result of a reduction in tax credits and the nondeductibility of certain compensation expense due to IRS regulations.
| | | | | | |
| | | 2006 | | | 2005 | |
Rate excluding discrete items | | 34.2 | % | | 29.7 | % |
Discrete items | | (5.2 | )% | | (5.3 | )% |
| | | | | | |
Reported effective tax rate | | 29.0 | % | | 24.4 | % |
| | | | | | |
Segment Information
Flavors & FragrancesFor the year ended December 31, 2006, revenue for the Flavors & Fragrances segment increased 9.4% to $733.4 million. The increase of $62.8 million was primarily as a result of increased selling prices ($33.6 million), higher volumes ($21.9 million) and the favorable impact of foreign currency translation ($7.1 million). The majority of the increased selling prices and volumes occurred in dehydrated and other flavors in North America. Volume increases also occurred in the fragrance market.
Gross margin was 26.6% in 2006, a 180 basis point increase from the 24.8% gross margin in 2005. This change was primarily a result of the increased sales prices partially offset by higher raw material and energy costs.
Operating income for 2006 increased 26.7% to $104.5 million from $82.5 million in 2005. The increase in operating income was primarily due to the higher volumes and improved pricing for dehydrated and other flavors in North America ($12.0 million) and improved costs and product mix in Europe ($6.2 million). Profit in Latin America also increased ($1.7 million) as a result
19
| | |
Management’s Discussion & Analysis | | |
| | |
of Operations & Financial Condition continued | | |
of improved selling prices and increased volumes. Operating income as a percent of revenue was 14.2%, an increase of 190 basis points from 2005. This change was primarily a result of the reasons provided above.

ColorRevenue for the Color segment increased 3.0% to $350.2 million in 2006 from $339.9 million in 2005. The increase in revenue was primarily due to increased sales of food and beverage colors in all markets ($10.7 million), increased sales of cosmetic colors ($4.8 million) and the favorable impact of foreign currency translation ($1.6 million). The increased sales of food and beverage colors were primarily due to higher volumes partially offset by lower selling prices. The increased sales of cosmetic colors were primarily due to higher volumes. These gains were partially offset by lower revenue in technical colors ($6.6 million).
Gross margin was 35.3% in 2006, a 60 basis point increase from Color’s 34.7% gross margin in 2005. Favorable product mix, higher volumes and benefits from the 2005 cost reduction program were the primary factors for the increase, although they were partially offset by lower prices and higher raw material costs on food and beverage colors and technical colors.
Operating income increased 9.6% in 2006 to $59.4 million from $54.2 million in 2005. Higher sales of food and beverage colors contributed $3.9 million to increased operating profit primarily due to the higher volumes and benefits from the 2005 cost reduction program partially offset by lower selling prices. Higher sales and lower raw material costs increased operating income for cosmetic colors by $3.0 million. These increases were partially offset by lower profit in technical colors ($2.2 million). The lower profits in technical colors were primarily due to lower volumes and unfavorable pricing although they were partially offset by benefits from the 2005 cost reduction program. Operating income as a percent of revenue increased 110 basis points to 17.0% from 15.9% in 2005 primarily due to the reasons described above.
Liquidity and Financial Position
The Company’s financial position remains strong, enabling it to meet cash requirements for operations, capital expansion programs and dividend payments to shareholders. The Company intends to fund working capital requirements, principal and interest payments, acquisitions (if any) and other liabilities with cash provided by operations, to the extent available, and short-term and long-term borrowings under new and existing credit facilities. The Company completed a new $300 million revolving loan agreement in June 2007 which replaced its prior $225 million facility. The new facility matures in June 2012 and is unsecured. There are currently $91.8 million of borrowings under the revolving loan agreement which were used to repay debt that matured in December 2007.
In the Consolidated Statements of Cash Flows, the changes in operating assets and liabilities are presented excluding the effects of changes in foreign currency exchange rates, as these do not reflect actual cash flows. Accordingly, the amounts in the Consolidated Statements of Cash Flows do not agree with changes in the operating assets and liabilities that are presented in the Consolidated Balance Sheets.
The Company’s ratio of debt to total capital improved to 38.4% at December 31, 2007, compared to 43.1% and 47.1% at December 31, 2006 and 2005, respectively. The improvement resulted from a reduction in debt and an increase in shareholders’ equity. Debt was reduced by $25.4 million since December 31, 2006, and by $46.6 million since December 31, 2005, primarily due to strong net cash provided by operating activities. The 2007 increase in shareholders’ equity of $110.3 million was primarily due to net earnings and changes in other comprehensive income, partially offset by dividends paid.
Net cash provided by operating activities was $105.2 million in 2007, $99.2 million in 2006 and $110.3 million in 2005. Operating cash flow provided the primary
20
| | |
| | |
| | Sensient Technologies Corporation 2007 Annual Report |
| | |
source of funds to finance operating needs, capital expenditures, share repurchases and shareholder dividends, and to reduce net borrowings. The increase in net cash provided by operating activities in 2007 was primarily due to an increase in net earnings.
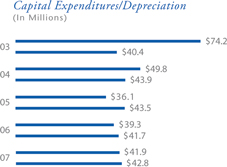
Net cash used in investing activities was $39.2 million in 2007, $33.8 million in 2006 and $34.0 million in 2005. Cash proceeds from the sale of assets were $2.3 million in 2007, $3.3 million in 2006 and $1.1 million in 2005. Capital expenditures were $42.0 million in 2007, $39.3 million in 2006 and $36.1 million in 2005.
Net cash used in financing activities was $61.4 million in 2007, $68.7 million in 2006 and $71.2 million in 2005. The Company had net reductions in debt of $44.8 million in 2007, $43.5 million in 2006 and $28.5 million in 2005. In 2007, 2006 and 2005, the Company’s net cash provided by operating activities was more than adequate to finance capital expenditures, share repurchases and dividend payments. The Company maintains debt levels it considers prudent based on its cash flows, interest coverage and percentage of total debt to total capital.
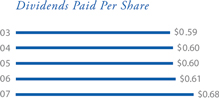
The Company has paid uninterrupted quarterly cash dividends since commencing public trading in its stock in 1962. The Company increased its quarterly dividend per share in the third quarter of 2007 to $0.18 per share from $0.16 per share. Dividends paid per share were $0.68 in 2007, $0.61 in 2006 and $0.60 in 2005. Total dividends paid were $32.0 million, $28.3 million and $28.3 million in 2007, 2006 and 2005, respectively.
With the exception of the increase in raw material costs discussed above, the impact of inflation on both the Company’s financial position and its results of operations has been minimal and is not expected to adversely affect 2008 results.
Issuer Purchases of Equity Securities
During 2007, 2006 and 2005, the Company repurchased 0.05 million, 0.2 million and 1.1 million shares, respectively, of Company stock at a total cost of $1.3 million, $3.6 million and $18.9 million, respectively. On April 27, 2001, the Board approved a share repurchase program under which the Company is authorized to repurchase up to 5.0 million shares of Company stock in addition to amounts remaining from prior Board authorizations. As of December 31, 2007, 3.0 million shares were available to be repurchased under existing authorizations. The Company’s share repurchase program has no expiration date.
Critical Accounting Policies
In preparing the financial statements in accordance with accounting principles generally accepted in the U.S., management is required to make estimates and assumptions that have an impact on the asset, liability, revenue and expense amounts reported. These estimates can also affect supplemental information disclosures of the Company, including information about contingencies, risk and financial condition. The Company believes, given current facts and circumstances, that its estimates and assumptions are reasonable, adhere to accounting principles generally accepted in the U.S. and are consistently applied. Inherent in the nature of an estimate or assumption is the fact that actual results may differ from estimates and estimates may vary as new facts and circumstances arise. The Company makes routine estimates and judgments in determining the net realizable value of accounts receivable, inventories, property, plant and equipment, and prepaid expenses. Management believes the Company’s most critical accounting estimates and assumptions are in the following areas:
21
| | |
Notes to Consolidated Financial Statements continued | | |
| | |
Years ended December 31, 2007, 2006 and 2005 | | |

Revenue RecognitionThe Company recognizes revenue (net of estimated discounts, allowances and returns) when title passes, the customer is obligated to pay the Company, and the Company has no remaining obligations. Such recognition typically corresponds with the shipment of goods.
Goodwill ValuationThe Company reviews the carrying value of goodwill annually utilizing several valuation methodologies, including a discounted cash flow model. Changes in estimates of future cash flows caused by items such as unforeseen events or changes in market conditions could negatively affect the reporting segments’ fair value and result in an impairment charge. However, the current fair values of the reporting segments are significantly in excess of carrying values. The Company estimates that a 100 basis point increase in its weighted average cost of capital would not result in impairment. Accordingly, management believes that only significant changes in its cash flow assumptions would result in impairment.
Income TaxesThe Company estimates its income tax expense in each of the taxing jurisdictions in which it operates. The Company is subject to a tax audit in each of these jurisdictions, which could result in changes to the estimated tax expense. The amount of these changes would vary by jurisdiction and would be recorded when probable and estimable. These changes could impact the Company’s financial statements. Management has recorded valuation allowances to reduce its deferred tax assets to the amount that is more likely than not to be realized. In doing so, management has considered future taxable income and ongoing tax planning strategies in assessing the need for the valuation allowance. An adjustment to the recorded valuation allowance as a result of changes in facts or circumstances could result in a significant change in the Company’s tax expense. The Company does not provide for deferred taxes on unremitted earnings of foreign subsidiaries which are considered to be permanently invested.
Commitments and ContingenciesThe Company is subject to litigation and other legal proceedings arising in the ordinary course of its businesses or arising under provisions related to the protection of the environment. Estimating liabilities and costs associated with these matters requires the judgment of management, who rely in part on information from Company counsel. When it is probable that the Company has incurred a liability associated with claims or pending or threatened litigation matters and the Company’s exposure is reasonably estimable, the Company records a charge against earnings. The estimate of any exposure to the Company may change as further facts and circumstances become known.
Market Risk Factors
The Company is exposed to market risks, including changes in interest rates, currency exchange rates and commodity prices. To manage the volatility relating to these exposures on a consolidated basis, the Company nets the exposures to take advantage of natural offsets. The Company also enters into various derivative transactions for some of the remaining exposures pursuant to the Company’s policies covering hedging practices. The financial impacts of these hedging instruments are offset by corresponding changes in the underlying exposures being hedged.
The Company does not hold or issue derivative financial instruments for trading purposes. Note 1 and Note 4 to the Consolidated Financial Statements include a discussion of the Company’s accounting policies for financial instruments.
A key part of the Company’s strategy is to expand into new geographic markets. Because the Company manufactures and sells its products throughout the world, it is exposed to movements in foreign currency exchange rates. The major foreign currency exposures involve the markets in Western Europe, Mexico and Canada. The primary purpose of the Company’s foreign currency hedging activities is to protect against the volatility associated with foreign currency sales, purchases of materials and other assets and liabilities created during the normal
21
| | |
| | |
| | Sensient Technologies Corporation 2007 Annual Report |
| | |
course of business. The Company generally utilizes foreign exchange contracts with durations of less than 12 months that qualify as cash flow hedges under Statement of Financial Accounting Standards (“SFAS”) No. 133,Accounting for Derivative Instruments and Hedging Activities, as amended. At December 31, 2007 and 2006, the fair values of these instruments, based on dealer quotes, were an asset of $0.1 million and a liability of $0.4 million, respectively. At December 31, 2007 and 2006, the potential gain or loss in the fair value of the Company’s outstanding foreign exchange contracts, assuming a hypothetical 10% fluctuation in the currencies of such contracts, would be approximately $5.0 million and $8.7 million, respectively. However, any change in the value of the contracts, real or hypothetical, would be significantly offset by a corresponding change in the value of the underlying hedged items. In addition, this hypothetical calculation assumes that each exchange rate would change in the same direction relative to the U.S. dollar.
The Company has certain debt denominated in Swiss Francs, Euros and British Pounds. These non-derivative debt instruments act as partial hedges of the Company’s Swiss Franc, Euro and British Pound net asset positions. The potential increase or decrease in the annual U.S. dollar interest expense of the Company’s outstanding foreign currency-denominated debt, assuming a hypothetical 10% fluctuation in the currencies of such debt, would be approximately $1.0 million and $0.7 million at December 31, 2007 and 2006, respectively. However, any change in interest expense from fluctuations in currency, real or hypothetical, would be significantly offset by a corresponding change in the value of the foreign income before interest. In addition, this hypothetical calculation assumes that each exchange rate would change in the same direction relative to the U.S. dollar.
The Company manages its debt structure and interest rate risk through the use of fixed rate and floating rate debt and through the use of derivatives. The Company’s primary exposure is to interest rates in the U.S. and Western Europe. At December 31, 2007 and 2006, the potential increase or decrease in annual interest expense, assuming a hypothetical 10% fluctuation in interest rates of floating rate debt, would be approximately $0.8 million and $0.7 million, respectively.
The Company is the purchaser of certain commodities, such as corn, sugar, soybean meal and fruits. The Company generally purchases these commodities based upon market prices that are established with the vendor as part of the purchase process. In general, the Company does not use commodity financial instruments to hedge commodity prices due to a high correlation between the commodity cost and the ultimate selling price of the Company’s products. On occasion, the Company may enter into non-cancelable forward purchase contracts, as deemed appropriate, to reduce the effect of price fluctuations on future manufacturing requirements.
Contractual Obligations
The Company is subject to certain contractual obligations, including long-term debt, operating leases, manufacturing purchases and pension benefit obligations. The Company has unrecognized tax benefits of $10.6 million as of December 31, 2007. However, the Company cannot make a reasonably reliable estimate of the period of potential cash settlement of the liabilities and, therefore, has not included unrecognized tax liabilities in the following table of significant contractual obligations as of December 31, 2007.
Payments due by period
| | | | | | | | | | | | | | | |
(in thousands) | | Total | | 1 year | | 2-3 years | | 4-5 years | | > 5 years |
Long-term debt | | $ | 449,621 | | $ | 6,949 | | $ | 177,797 | | $ | 209,338 | | $ | 55,537 |
Interest payments on long-term debt | | | 87,436 | | | 27,504 | | | 35,093 | | | 21,258 | | | 3,581 |
Operating lease obligations | | | 23,948 | | | 7,791 | | | 8,810 | | | 3,395 | | | 3,952 |
Manufacturing purchase commitments | | | 54,187 | | | 33,737 | | | 13,800 | | | 6,650 | | | — |
Pension benefit obligations | | | 45,184 | | | 3,885 | | | 22,281 | | | 5,911 | | | 13,107 |
| | | | | | | | | | | | | | | |
Total contractual obligations | | $ | 660,376 | | $ | 79,866 | | $ | 257,781 | | $ | 246,552 | | $ | 76,177 |
| | | | | | | | | | | | | | | |
23
| | |
Notes to Consolidated Financial Statements continued | | |
| | |
Years ended December 31, 2007, 2006 and 2005 | | |
New Pronouncements
On December 31, 2006, the Company adopted SFAS No. 158,Employers’ Accounting for Defined Benefit Pension and Other Postretirement Plans. This statement requires the Company to recognize the over-funded or under-funded status of a defined benefit postretirement plan as an asset or liability in the balance sheet and to recognize changes in that funded status in the year in which the changes occur through comprehensive income. Additionally, SFAS No. 158 requires the Company to measure the funded status of a plan as of the date of its fiscal year end, which has been the Company’s historical practice. See Note 6 for additional information.
In the first quarter of 2007, the Company adopted Financial Accounting Standards Board (“FASB”) Interpretation No. 48 (“FIN 48”),Accounting for Uncertainty in Income Taxes. This interpretation prescribes a recognition threshold and measurement attribute for the financial statement recognition and measurement of a tax position taken or expected to be taken in a tax return. As a result of adoption, the Company recorded a charge of $2.3 million to the January 1, 2007 balance of retained earnings. See Note 7 for additional information.
In September 2006, the FASB issued SFAS No. 157,Fair Value Measurements. This statement defines fair value, establishes a framework for measuring fair value and expands disclosures about fair value measurements. It also establishes a fair value hierarchy that prioritizes information used in developing assumptions when pricing an asset or liability. SFAS No. 157 will be effective for the Company beginning January 1, 2008. The Company does not believe this statement will have a material effect on its financial statements and related disclosures.
In February 2007, the FASB issued SFAS No. 159,The Fair Value Option for Financial Assets and Financial Liabilities. SFAS No. 159 permits companies to choose to measure many financial instruments and certain other items at fair value. This statement is effective for the Company beginning January 1, 2008. The Company does not believe SFAS No. 159 will have a material effect on its financial statements and related disclosures.
In December 2007, the FASB issued SFAS No. 141(R),Business Combinations.This statement applies to acquisitions by the Company after January 1, 2009. The Company is currently evaluating the impact of this statement.
Off-Balance Sheet Arrangements
The Company had no off-balance sheet arrangements as of December 31, 2007.
Forward-looking Statements
This document contains forward-looking statements that reflect management’s current assumptions and estimates of future economic circumstances, industry conditions, Company performance and financial results. Forward-looking statements include statements in the future tense, statements referring to any period after December 31, 2007, and statements including the terms “expect,” “believe,” “anticipate” and other similar terms that express expectations as to future events or conditions. The Private Securities Litigation Reform Act of 1995 provides a safe harbor for such forward-looking statements. Such forward-looking statements are not guarantees of future performance and involve known and unknown risks, uncertainties and other factors that could cause actual events to differ materially from those expressed in those statements. A variety of factors could cause the Company’s actual results and experience to differ materially from the anticipated results. These factors and assumptions include the pace and nature of new product introductions by the Company’s customers; the Company’s ability to successfully implement its growth strategies; the outcome of the Company’s various productivity-improvement and cost-reduction efforts; changes in costs of raw materials and energy; industry and economic factors related to the Company’s domestic and international business; competition from other suppliers of colors, flavors and fragrances; growth or contraction in markets for products in which the Company competes; terminations and other changes in customer relationships; industry acceptance of price increases; currency exchange rate fluctuations; and the matters discussed above including the critical accounting policies described therein. The Company does not undertake to publicly update or revise its forward-looking statements even if experience or future changes make it clear that any projected results expressed or implied therein will not be realized.
24
| | |
Consolidated Statements | | |
| | Sensient Technologies Corporation 2007 Annual Report |
of Earnings | | |
| | | | | | | | | |
(in thousands except per share amounts) Years ended December 31, | | 2007 | | 2006 | | 2005 |
Revenue | | $ | 1,184,778 | | $ | 1,098,774 | | $ | 1,023,930 |
Cost of products sold (includes restructuring charges of $ 4,340 in 2005 – see Note 9) | | | 822,479 | | | 766,506 | | | 731,253 |
Selling and administrative expenses | | | 214,929 | | | 202,991 | | | 189,998 |
Restructuring and other charges (see Note 9) | | | — | | | — | | | 8,465 |
| | | | | | | | | |
Operating Income | | | 147,370 | | | 129,277 | | | 94,214 |
Interest expense | | | 36,127 | | | 35,748 | | | 35,737 |
| | | | | | | | | |
Earnings Before Income Taxes | | | 111,243 | | | 93,529 | | | 58,477 |
Income taxes | | | 33,457 | | | 27,104 | | | 14,282 |
| | | | | | | | | |
Net Earnings | | $ | 77,786 | | $ | 66,425 | | $ | 44,195 |
| | | | | | | | | |
Earnings per share | | | | | | | | | |
Basic | | $ | 1.66 | | $ | 1.45 | | $ | 0.95 |
Diluted | | $ | 1.65 | | $ | 1.44 | | $ | 0.94 |
Average common shares outstanding – basic | | | 46,740 | | | 45,900 | | | 46,746 |
Average common shares outstanding – diluted | | | 47,257 | | | 46,204 | | | 47,067 |
See notes to consolidated financial statements.
25
| | |
Consolidated | | |
| | Sensient Technologies Corporation 2007 Annual Report |
Balance Sheets | | |
| | | | | | | | |
(in thousands except share and per share amounts) December 31, | | 2007 | | | 2006 | |
| Assets | | | | | | | | |
Current Assets: | | | | | | | | |
Cash and cash equivalents | | $ | 10,522 | | | $ | 5,035 | |
Trade accounts receivable, less allowance for losses of $ 4,242 and $7,671, respectively | | | 196,458 | | | | 178,307 | |
Inventories | | | 361,534 | | | | 333,070 | |
Prepaid expenses and other current assets | | | 29,705 | | | | 25,356 | |
Deferred income taxes | | | 11,825 | | | | 9,934 | |
| | | | | | | | |
Total current assets | | | 610,044 | | | | 551,702 | |
Other assets | | | 44,404 | | | | 44,059 | |
Intangible assets – at cost, less accumulated amortization of $ 9,501 and $7,656, respectively | | | 14,789 | | | | 14,507 | |
Goodwill | | | 476,611 | | | | 449,194 | |
Deferred income taxes | | | — | | | | 3,149 | |
| | | | | | | | |
Property, Plant and Equipment: | | | | | | | | |
Land | | | 46,013 | | | | 39,762 | |
Buildings | | | 259,830 | | | | 243,734 | |
Machinery and equipment | | | 612,265 | | | | 567,057 | |
Construction in progress | | | 30,335 | | | | 20,225 | |
| | | | | | | | |
| | | 948,443 | | | | 870,778 | |
Less accumulated depreciation | | | (530,109 | ) | | | (479,322 | ) |
| | | | | | | | |
| | | 418,334 | | | | 391,456 | |
| | | | | | | | |
Total assets | | $ | 1,564,182 | | | $ | 1,454,067 | |
| | | | | | | | |
| | |
| Liabilities and Shareholders’ Equity | | | | | | | | |
Current Liabilities: | | | | | | | | |
Trade accounts payable | | $ | 88,812 | | | $ | 80,916 | |
Accrued salaries, wages and withholdings from employees | | | 23,684 | | | | 24,539 | |
Other accrued expenses | | | 56,948 | | | | 49,620 | |
Income taxes | | | 2,342 | | | | 14,309 | |
Short-term borrowings | | | 57,487 | | | | 91,226 | |
Current maturities of long-term debt | | | — | | | | — | |
| | | | | | | | |
Total current liabilities | | | 229,273 | | | | 260,610 | |
Deferred income taxes | | | 12,548 | | | | — | |
Other liabilities | | | 14,122 | | | | 4,090 | |
Accrued employee and retiree benefits | | | 44,197 | | | | 43,957 | |
Long-term debt | | | 449,621 | | | | 441,306 | |
Commitments and contingencies (See Note 10) | | | | | | | | |
Shareholders’ Equity: | | | | | | | | |
Common stock, par value $0.10 a share, authorized 100,000,000 shares; issued 53,954,874 shares | | | 5,396 | | | | 5,396 | |
Additional paid-in capital | | | 75,233 | | | | 70,420 | |
Earnings reinvested in the business | | | 818,180 | | | | 774,677 | |
Treasury stock, 6,603,650 and 7,385,249 shares, respectively, at cost | | | (132,358 | ) | | | (147,662 | ) |
Accumulated other comprehensive income | | | 47,970 | | | | 1,273 | |
| | | | | | | | |
| | | 814,421 | | | | 704,104 | |
| | | | | | | | |
Total liabilities and shareholders’ equity | | $ | 1,564,182 | | | $ | 1,454,067 | |
| | | | | | | | |
See notes to consolidated financial statements.
26
| | |
Consolidated Statements | | |
| | Sensient Technologies Corporation 2007 Annual Report |
of Cash Flows | | |
| | | | | | | | | | | | |
(in thousands) Years ended December 31, | | 2007 | | | 2006 | | | 2005 | |
| Cash Flows from Operating Activities | | | | | | | | | | | | |
Net earnings | | $ | 77,786 | | | $ | 66,425 | | | $ | 44,195 | |
Adjustments to arrive at net cash provided by operating activities: | | | | | | | | | | | | |
Depreciation and amortization | | | 44,312 | | | | 43,044 | | | | 44,859 | |
Share-based compensation | | | 4,731 | | | | 5,035 | | | | 1,910 | |
Restructuring and other charges | | | — | | | | — | | | | 5,390 | |
(Gain) loss on assets | | | (467 | ) | | | 795 | | | | (389 | ) |
Deferred income taxes | | | 9,381 | | | | (278 | ) | | | (10,105 | ) |
Changes in operating assets and liabilities: | | | | | | | | | | | | |
Trade accounts receivable | | | (6,152 | ) | | | (5,104 | ) | | | 8,941 | |
Inventories | | | (15,299 | ) | | | (7,537 | ) | | | (616 | ) |
Prepaid expenses and other assets | | | (5,115 | ) | | | (3,998 | ) | | | (3,460 | ) |
Accounts payable and other accrued expenses | | | 4,217 | | | | (5,066 | ) | | | 6,285 | |
Accrued salaries, wages and withholdings from employees | | | (1,753 | ) | | | 8,458 | | | | 2,302 | |
Income taxes | | | (8,876 | ) | | | (8,125 | ) | | | 4,050 | |
Other liabilities | | | 2,440 | | | | 5,568 | | | | 6,928 | |
| | | | | | | | | | | | |
Net cash provided by operating activities | | | 105,205 | | | | 99,217 | | | | 110,290 | |
| | | | | | | | | | | | |
| | | |
| Cash Flows from Investing Activities | | | | | | | | | | | | |
Acquisition of property, plant and equipment | | | (41,961 | ) | | | (39,314 | ) | | | (36,102 | ) |
Proceeds from sale of assets | | | 2,291 | | | | 3,321 | | | | 1,101 | |
Other investing activity | | | 451 | | | | 2,152 | | | | 1,033 | |
| | | | | | | | | | | | |
Net cash used in investing activities | | | (39,219 | ) | | | (33,841 | ) | | | (33,968 | ) |
| | | | | | | | | | | | |
| | | |
| Cash Flows from Financing Activities | | | | | | | | | | | | |
Proceeds from additional borrowings | | | 136,859 | | | | 247,483 | | | | 80,652 | |
Debt payments | | | (181,680 | ) | | | (290,992 | ) | | | (109,163 | ) |
Purchase of treasury stock | | | (1,267 | ) | | | (4,563 | ) | | | (18,005 | ) |
Dividends paid | | | (32,017 | ) | | | (28,292 | ) | | | (28,276 | ) |
Proceeds from options exercised and other equity transactions | | | 16,693 | | | | 7,681 | | | | 3,630 | |
| | | | | | | | | | | | |
Net cash used in financing activities | | | (61,412 | ) | | | (68,683 | ) | | | (71,162 | ) |
| | | | | | | | | | | | |
Effect of exchange rate changes on cash and cash equivalents | | | 913 | | | | 1,274 | | | | (335 | ) |
| | | | | | | | | | | | |
Net increase (decrease) in cash and cash equivalents | | | 5,487 | | | | (2,033 | ) | | | 4,825 | |
Cash and cash equivalents at beginning of year | | | 5,035 | | | | 7,068 | | | | 2,243 | |
| | | | | | | | | | | | |
Cash and cash equivalents at end of year | | $ | 10,522 | | | $ | 5,035 | | | $ | 7,068 | |
| | | | | | | | | | | | |
Cash paid during the year for: | | | | | | | | | | | | |
Interest | | $ | 36,070 | | | $ | 35,988 | | | $ | 34,816 | |
Income taxes | | | 29,735 | | | | 30,885 | | | | 16,850 | |
Capitalized interest | �� | | 1,493 | | | | 1,018 | | | | 908 | |
See notes to consolidated financial statements.
27
| | |
Consolidated Statements | | |
| | |
of Shareholders’ Equity | | |
| | | | | | | |
(in thousands except share and per share amounts) | | Common
Stock | | Additional
Paid-in
Capital | |
Balances at December 31, 2004 | | $ | 5,396 | | $ | 72,117 | |
Net earnings | | | | | | | |
Unrealized gain on cash flow hedges, arising during the period, net of tax of $529 | | | | | | | |
Reclassification adjustment for cash flow hedges included in net income, net of tax of $598 | | | | | | | |
Minimum pension liability, net of tax of $2,162 | | | | | | | |
Foreign currency translation | | | | | | | |
Total comprehensive income | | | | | | | |
Cash dividends paid – $0.60 a share | | | | | | | |
Stock options exercised | | | | | | (350 | ) |
Benefit plans | | | | | | 39 | |
Nonvested stock | | | | | | (223 | ) |
Purchase of treasury stock | | | | | | | |
Other | | | | | | (1 | ) |
| | | | | | | |
| | |
Balances at December 31, 2005 | | | 5,396 | | | 71,582 | |
Net earnings | | | | | | | |
Unrealized loss on cash flow hedges, arising during the period, net of tax of $ 13 | | | | | | | |
Reclassification adjustment for cash flow hedges included in net income, net of tax of $2 | | | | | | | |
Minimum pension liability, net of tax of $ 904 | | | | | | | |
Foreign currency translation | | | | | | | |
Total comprehensive income | | | | | | | |
Cash dividends paid – $0.61 a share | | | | | | | |
Adjustment to initially apply Statement of Financial Accounting Standards No. 158, net of tax of $4,944 (See Note 6) | | | | | | | |
Share-based compensation | | | | | | 5,035 | |
Reclassification of unearned portion of nonvested stock (See Note 5) | | | | | | (5,965 | ) |
Stock options exercised | | | | | | (192 | ) |
Benefit plans | | | | | | (93 | ) |
Purchase of treasury stock | | | | | | | |
Other | | | | | | 53 | |
| | | | | | | |
| | |
Balances at December 31, 2006 | | | 5,396 | | | 70,420 | |
Net earnings | | | | | | | |
Unrealized loss on cash flow hedges, arising during the period, net of tax of $209 | | | | | | | |
Reclassification adjustment for cash flow hedges included in net income, net of tax of $228 | | | | | | | |
Pension adjustment, net of tax of $138 | | | | | | | |
Foreign currency translation | | | | | | | |
Total comprehensive income | | | | | | | |
Cash dividends paid – $0.68 a share | | | | | | | |
Adjustment to initially apply Financial Accounting Standards Interpretation No. 48 (See Note 7) | | | | | | | |
Share-based compensation | | | | | | 5,183 | |
Stock options exercised | | | | | | 1,931 | |
Nonvested stock issued upon vesting | | | | | | (2,845 | ) |
Benefit plans | | | | | | 175 | |
Purchase of treasury stock | | | | | | | |
Other | | | | | | 369 | |
| | | | | | | |
| | |
| Balances at December 31, 2007 | | $ | 5,396 | | $ | 75,233 | |
| | | | | | | |
See notes to consolidated financial statements.
28
| | |
| | |
| | Sensient Technologies Corporation 2007 Annual Report |
| | |
| | | | | | | | | | | | | | | | | | | | | |
Earnings
Reinvested in | | | Treasury Stock | | | Unearned
Portion of
Nonvested | | | Accumulated
Other
Comprehensive | | | Total
Comprehensive | |
the Business | | | Shares | | | Amount | | | Stock | | | Income (Loss) | | | Income (Loss) | |
| $ | 720,625 | | | 6,887,161 | | | $ | (140,507 | ) | | $ | (5,500 | ) | | $ | 6,567 | | | | | |
| | 44,195 | | | | | | | | | | | | | | | | | | $ | 44,195 | |
| | | | | | | | | | | | | | | | 5,996 | | | | 5,996 | |
| | | | | | | | | | | | | | | | (5,378 | ) | | | (5,378 | ) |
| | | | | | | | | | | | | | | | (3,191 | ) | | | (3,191 | ) |
| | | | | | | | | | | | | | | | (36,596 | ) | | | (36,596 | ) |
| | | | | | | | | | | | | | | | | | | | | |
| | | | | | | | | | | | | | | | | | | $ | 5,026 | |
| | | | | | | | | | | | | | | | | | | | | |
| | (28,276 | ) | | | | | | | | | | | | | | | | | | | |
| | | | (173,534 | ) | | | 3,540 | | | | | | | | | | | | | |
| | | | (26,000 | ) | | | 530 | | | | | | | | | | | | | |
| | | | (129,700 | ) | | | 2,620 | | | | (465 | ) | | | | | | | | |
| | | | 1,062,541 | | | | (18,918 | ) | | | | | | | | | | | | |
| | | | (400 | ) | | | 8 | | | | | | | | | | | | | |
| | | | | | | | | | | | | | | | | | | | | | |
| | 736,544 | | | 7,620,068 | | | | (152,727 | ) | | | (5,965 | ) | | | (32,602 | ) | | | | |
| | 66,425 | | | | | | | | | | | | | | | | | | $ | 66,425 | |
| | | | | | | | | | | | | | | | (90 | ) | | | (90 | ) |
| | | | | | | | | | | | | | | | (11 | ) | | | (11 | ) |
| | | | | | | | | | | | | | | | 1,679 | | | | 1,679 | |
| | | | | | | | | | | | | | | | 40,074 | | | | 40,074 | |
| | | | | | | | | | | | | | | | | | | | | |
| | | | | | | | | | | | | | | | | | | $ | 108,077 | |
| | | | | | | | | | | | | | | | | | | | | |
| | (28,292 | ) | | | | | | | | | | | | | | | | | | | |
| | | | | | | | | | | | | | | | (7,777 | ) | | | | |
| | | | | | | | | | | | | | | | | | | | | |
| | | | | | | | | | | | 5,965 | | | | | | | | | |
| | | | (387,728 | ) | | | 7,753 | | | | | | | | | | | | | |
| | | | (43,420 | ) | | | 868 | | | | | | | | | | | | | |
| | | | 200,949 | | | | (3,649 | ) | | | | | | | | | | | | |
| | | | (4,620 | ) | | | 93 | | | | | | | | | | | | | |
| | | | | | | | | | | | | | | | | | | | | | |
| | 774,677 | | | 7,385,249 | | | | (147,662 | ) | | | — | | | | 1,273 | | | | | |
| | 77,786 | | | | | | | | | | | | | | | | | | $ | 77,786 | |
| | | | | | | | | | | | | | | | (1,462 | ) | | | (1,462 | ) |
| | | | | | | | | | | | | | | | 1,596 | | | | 1,596 | |
| | | | | | | | | | | | | | | | (212 | ) | | | (212 | ) |
| | | | | | | | | | | | | | | | 46,775 | | | | 46,775 | |
| | | | | | | | | | | | | | | | | | | | | |
| | | | | | | | | | | | | | | | | | | $ | 124,483 | |
| | | | | | | | | | | | | | | | | | | | | |
| | (32,017 | ) | | | | | | | | | | | | | | | | | | | |
| | (2,266 | ) | | | | | | | | | | | | | | | | | | | |
| | | | 22,600 | | | | (452 | ) | | | | | | | | | | | | |
| | | | (676,229 | ) | | | 13,522 | | | | | | | | | | | | | |
| | | | (142,100 | ) | | | 2,845 | | | | | | | | | | | | | |
| | | | (32,992 | ) | | | 660 | | | | | | | | | | | | | |
| | | | 47,100 | | | | (1,267 | ) | | | | | | | | | | | | |
| | | | 22 | | | | (4 | ) | | | | | | | | | | | | |
| | | | | | | | | | | | | | | | | | | | | | |
| $ | 818,180 | | | 6,603,650 | | | $ | (132,358 | ) | | $ | — | | | $ | 47,970 | | | | | |
| | | | | | | | | | | | | | | | | | | | | | |
29
| | |
Notes to Consolidated Financial Statements | | |
| | |
Years ended December 31, 2007, 2006 and 2005 | | |
1
Summary of Significant Accounting Policies
Principles of Consolidation and Basis of PresentationThe consolidated financial statements include the accounts of Sensient Technologies Corporation and its subsidiaries (the “Company”). All significant intercompany accounts and transactions are eliminated.
Sensient Technologies Corporation is a leading global manufacturer and marketer of colors, flavors and fragrances. The Company uses advanced technologies at facilities around the world to develop specialty food and beverage systems, cosmetic and pharmaceutical systems, inkjet and specialty inks and colors, display imaging chemicals and other specialty chemicals. The Company’s reportable segments consist of the Flavors & Fragrances and Color Groups, which are managed on a products and services basis. The Asia Pacific Group, which is managed on a geographic basis, is included in Corporate and Other.
Use of EstimatesThe preparation of the consolidated financial statements in conformity with accounting principles generally accepted in the United States of America requires management to make estimates and assumptions that affect reported amounts of assets and liabilities and the disclosure of contingent assets and liabilities at the date of the financial statements and the reported amounts of revenue and expenses during the reporting periods. Actual results could differ from those estimates.
Revenue RecognitionThe Company recognizes revenue (net of estimated discounts, allowances and returns) when title passes, the customer is obligated to pay the Company and the Company has no remaining obligations. Such recognition typically corresponds with the shipment of goods.
Cost of Products Sold Cost of products sold includes materials, labor and overhead expenses incurred in the manufacture of our products. Cost of products sold also includes charges for obsolete and slow moving inventories, as well as costs for quality control, purchasing and receiving costs, inspection costs, warehousing costs, internal transfer costs, other costs of our internal distribution network and costs incurred for shipping and handling. The Company records fees billed to customers for shipping and handling as revenue.
Selling and Administrative Expenses Selling and administrative expenses primarily include the salaries and related costs for executive, finance, accounting, human resources, research and development and legal personnel as well as salaries and related costs of salespersons and commissions paid to external sales agents.
Cash EquivalentsThe Company considers all highly liquid investments with maturities of three months or less at the date of acquisition as cash equivalents.
Accounts ReceivableReceivables are recorded at their face amount, less an allowance for doubtful accounts. The allowance for doubtful accounts is based on customer-specific analysis and general matters such as current assessments of past due balances and economic conditions. Specific accounts are written off against the allowance for doubtful accounts when it is deemed that the receivable is no longer collectible.
InventoriesInventories are stated at the lower of cost or market. Market is determined on the basis of estimated realizable values. Cost is determined using the first-in, first-out (“FIFO”) method with the exception of certain locations of the Flavors & Fragrances Group where cost is determined using a weighted average method. Inventories include finished and in-process products totaling $266.3 million and $235.9 million at December 31, 2007 and 2006, respectively, and raw materials and supplies of $95.2 million and $97.2 million at December 31, 2007 and 2006, respectively.
Property, Plant and EquipmentProperty, plant and equipment are recorded at cost reduced by accumulated depreciation. Depreciation is provided over the estimated useful life of the related asset using the straight-line method for financial reporting. The estimated useful lives for buildings range from 5 to 35 years. Machinery and equipment have useful lives ranging from 3 to 20 years. Interest costs on significant projects constructed or developed for the Company’s own use are capitalized as part of the asset.
Goodwill and Other Intangible Assets The carrying value of goodwill and other intangible assets with indefinite lives is evaluated for impairment on an annual basis or when an indicator of impairment occurs. The impairment assessment includes comparing the carrying amount of net assets, including goodwill, of each reporting unit to their respective fair value as of the date of the assessment. Fair value was estimated based upon an evaluation of the reporting unit’s estimated future discounted cash flow as well as the public trading and private transaction valuation multiples for comparable companies. Such determination of fair value yielded no impairment in either 2007 or 2006.
The cost of intangible assets with determinable useful lives is amortized on a straight-line basis to reflect the pattern of economic benefits consumed, ranging from 5 to 20 years. These assets include technological know how, customer relationships, patents, trademarks and non-compete agreements among others.
Impairment of Long-lived Assets The Company reviews long-lived assets for impairment whenever events or changes in business circumstances indicate that the carrying amount of the assets may not be fully recoverable. The Company performs undiscounted cash flow analyses to determine if potential impairment exists. If impairment is determined to exist, any related impairment loss is calculated based on the difference between fair value and carrying value.
30
| | |
| | |
| | Sensient Technologies Corporation 2007 Annual Report |
| | |
Financial Instruments The Company may use derivative financial instruments for the purpose of hedging currency and interest rate exposures which exist as part of ongoing business operations. As a policy, the Company does not engage in speculative or leveraged transactions, nor does the Company hold or issue financial instruments for trading purposes.
Hedge effectiveness is determined by how closely the changes in the fair value of the hedging instrument offset the changes in the fair value or cash flows of the hedged item. Hedge accounting is permitted only if the hedging relationship is expected to be highly effective at the inception of the transaction and on an ongoing basis. Any ineffective portions are recognized in earnings immediately.
Interest Rate Hedging The Company is exposed to interest rate risk through its corporate borrowing activities. The objective of the Company’s interest rate risk management activities is to manage the levels of the Company’s fixed and floating interest rate exposure to be consistent with the Company’s preferred mix. The interest rate risk management program may include entering into interest rate swaps, which qualify as fair value hedges, when there is a desire to modify the Company’s exposure to interest rates. Gains or losses on fair value hedges are recognized in earnings, net of gains and losses on the fair value of the hedged instruments.
Currency Rate HedgingThe primary objectives of the foreign exchange risk management activities are to understand and mitigate the impact of potential foreign exchange fluctuations on the Company’s financial results and its economic well-being. Generally, these risk management transactions involve the use of foreign currency derivatives to protect against exposure resulting from recorded accounts receivable and payable. The Company primarily utilizes forward exchange contracts with maturities of less than 12 months, which qualify as cash flow hedges. These foreign exchange contracts are intended to offset the effect of exchange rate fluctuations on recorded intercompany receivables and payables. Gains and losses on these instruments are deferred in accumulated other comprehensive income (“OCI”) until the underlying transaction is recognized in earnings.
The Company’s existing cash flow hedges are highly effective. As a result, any current impact on earnings due to cash flow hedge ineffectiveness is immaterial.
Net Investments Hedging The Company may enter into foreign-denominated debt to be used as a non-derivative instrument to hedge the Company’s net investment in foreign subsidiaries. The change in the carrying amount of the foreign-denominated debt on the Company’s books, attributable to changes in the spot foreign exchange rate, is a hedge of the net investment in its foreign subsidiaries. Changes in the fair value of debt designated as a net investment hedge are recorded in foreign currency translation in OCI.
Commodity Purchases The Company purchases certain commodities in the normal course of business which result in physical delivery of the goods and hence, are excluded from Statement of Financial Accounting Standards (“SFAS”) No. 133,Accounting for Derivative Instruments and Hedging Activities, as amended.
Translation of Foreign Currencies For all significant foreign operations, the functional currency is the local currency. Assets and liabilities of foreign operations are translated into U.S. dollars at current exchange rates. Revenue and expense accounts are translated into U.S. dollars at average exchange rates prevailing during the year. Adjustments resulting from the translation of assets and liabilities to U.S. dollars are included in OCI as foreign currency translation adjustments. Transaction gains and losses that occur as a result of transactions denominated in non-functional currencies are included in earnings and were not significant during the three-year period ended December 31, 2007.
Share-Based CompensationOn January 1, 2006, the Company adopted SFAS No. 123(R),Share-Based Payment, using the modified prospective application transition method. Share-based compensation expense is recognized on a straight line basis over the vesting period of each award recipient. See Note 5,Share-Based Compensation, for additional information. Prior to 2006, the Company accounted for its share-based compensation plans using the intrinsic value-based method in accordance with Accounting Principles Board Opinion No. 25,Accounting for Stock Issued to Employees.
Income TaxesThe Company accounts for income taxes under SFAS No. 109,Accounting for Income Taxes. The Company recognizes a current tax liability or asset for the estimated taxes payable or refundable on tax returns for the current year and a deferred tax liability or asset for the estimated future tax effects attributable to temporary differences and carryforwards. The measurement of current and deferred tax liabilities and assets is based on provisions of enacted tax law. Deferred tax assets are reduced, if necessary, by the amount of any tax benefits for which the utilization of the asset is not likely. On January 1, 2007, the Company adopted Financial Accounting Standards Board (“FASB”) Interpretation No. 48 (“FIN 48”),Accounting for Uncertainty in Income Taxes. This interpretation prescribes the minimum recognition threshold which a tax position is required to meet before being recognized in the financial statements. FIN 48 also provides guidance on the measurement, classification and derecognition of tax positions. See Note 7,Income Taxes, for additional information.
31
| | |
Notes to Consolidated Financial Statements continued | | |
| | |
Years ended December 31, 2007, 2006 and 2005 | | |
Earnings Per Share Basic earnings per share (“EPS”) of common stock is computed by dividing net earnings by the weighted-average number of common shares outstanding during the period. The difference between basic and diluted EPS is the dilutive effect of stock options and nonvested stock. Diluted EPS assumes that nonvested stock has vested and all dilutive stock options, for which the average market price exceeds the exercise price (in-the-money), are exercised. Stock options for which the exercise price exceeds the average market price (out-of-the-money options) have an anti-dilutive effect on EPS, and accordingly, are excluded from the calculation. Weighted-average common shares for computation of EPS were:
| | | | | | |
(in thousands) | | 2007 | | 2006 | | 2005 |
Basic weighted-average shares outstanding | | 46,740 | | 45,900 | | 46,746 |
Diluted weighted-average shares outstanding | | 47,257 | | 46,204 | | 47,067 |
For the years ended December 31, 2006 and 2005, options for 1.8 million and 1.9 million shares, respectively, with weighted-average exercise prices of $21.65 and $21.79, respectively, were excluded from the diluted EPS calculation because their exercise prices were greater than the average market price of the common stock and their inclusion in the calculation would have been anti-dilutive. For 2007, no options were excluded from the diluted EPS calculation on that basis. All earnings per share amounts are presented on a diluted basis unless otherwise noted.
Accumulated Other Comprehensive Income Accumulated OCI is comprised primarily of foreign currency translation, minimum pension liability and unrealized gains (losses) on cash flow hedges. The components of OCI at December 31 were:
| | | | | | | | |
(in thousands) | | 2007 | | | 2006 | |
Foreign currency translation | | $ | 59,310 | | | $ | 12,535 | |
Minimum pension liability (net of tax) | | | (11,399 | ) | | | (11,187 | ) |
Unrealized gains (losses) on cash flow hedges (net of tax) | | | 59 | | | | (75 | ) |
| | | | | | | | |
Accumulated other comprehensive income | | $ | 47,970 | | | $ | 1,273 | |
| | | | | | | | |
Research and Development Research and development costs are recorded in selling and administrative expenses in the year they are incurred. Research and development costs were $25.7 million, $24.8 million and $26.4 million during the years ended December 31, 2007, 2006 and 2005, respectively.
AdvertisingAdvertising costs are recorded in selling and administrative expenses as they are incurred. Advertising costs were $1.6 million, $1.2 million and $1.5 million during the years ended December 31, 2007, 2006 and 2005, respectively.
Environmental LiabilitiesThe Company records liabilities related to environmental remediation obligations when estimated future expenditures are probable and reasonably estimable. Such accruals are adjusted as further information becomes available or as circumstances change. Estimated future expenditures are discounted to their present value when the timing and amount of future cash flows are fixed and readily determinable. Recoveries of remediation costs from other parties, if any, are recognized as assets when their receipt is assured.
New PronouncementsOn December 31, 2006, the Company adopted SFAS No. 158,Employers’ Accounting for Defined Benefit Pension and Other Postretirement Plans. This statement requires the Company to recognize the overfunded or underfunded status of its defined benefit postretirement plan as an asset or liability in the balance sheet and to recognize changes in that funded status in the year in which the changes occur through other comprehensive income. See Note 6, Retirement Plans, for additional information.
The Company adopted FASB Interpretation No. 48 (“FIN 48”),Accounting for Uncertainty in Income Taxes,on January 1, 2007. This interpretation prescribes a recognition threshold and measurement attribute for the financial statement recognition and measurement of a tax position taken or expected to be taken in a tax return. See Note 7,Income Taxes, for additional information.
In September 2006, the FASB issued SFAS No. 157,Fair Value Measurements. This statement defines fair value, establishes a framework for measuring fair value and expands disclosures about fair value measurements. It also establishes a fair value hierarchy that prioritizes information used in developing assumptions when pricing an asset or liability. SFAS No. 157 will be effective for the Company beginning January 1, 2008. The Company does not believe this statement will have a material effect on its financial statements and related disclosures.
In February 2007, the FASB issued SFAS No. 159,The Fair Value Option for Financial Assets and Financial Liabilities. SFAS No. 159 permits companies to choose to measure many financial instruments and certain other items at fair value. This statement is effective for the Company beginning January 1, 2008. The Company does not believe SFAS No. 159 will have a material effect on its financial statements and related disclosures.
In December 2007, the FASB issued SFAS No. 141(R),Business Combinations. This statement applies to acquisitions by the Company after January 1, 2009. The Company is currently evaluating the impact of this statement.
32
| | |
| | |
| | Sensient Technologies Corporation 2007 Annual Report |
| | |
2
Goodwill and Intangible Assets
At December 31, 2007 and 2006, the Company does not have any intangible assets other than goodwill that are not subject to amortization. The following table summarizes intangible assets with determinable useful lives by major category as of December 31, 2007 and 2006:
| | | | | | | | | | | | | | | | |
(in thousands except weighted average amortization years) | | Weighted
Average
Amortization
Years | | 2007 | | | 2006 | |
| | | Cost | | Accumulated
Amortization | | | Cost | | Accumulated
Amortization | |
Technological know-how | | 20.0 | | $ | 8,362 | | $ | (2,873 | ) | | $ | 7,979 | | $ | (2,391 | ) |
Customer relationships | | 20.0 | | | 7,068 | | | (1,901 | ) | | | 6,626 | | | (1,464 | ) |
Patents, trademarks, non-compete agreements and other | | 17.0 | | | 8,860 | | | (4,727 | ) | | | 7,558 | | | (3,801 | ) |
| | | | | | | | | | | | | | | | |
Total finite-lived intangibles | | 18.9 | | $ | 24,290 | | $ | (9,501 | ) | | $ | 22,163 | | $ | (7,656 | ) |
| | | | | | | | | | | | | | | | |
Amortization of intangible assets was $1.5 million, $1.4 million and $1.4 million in 2007, 2006 and 2005, respectively. Estimated amortization expense each year for the five years subsequent to December 31, 2007, is as follows: 2008, $1.7 million; 2009, $1.3 million; 2010, $1.3 million; 2011, $1.3 million; and 2012, $1.3 million. The changes in goodwill for the years ended December 31, 2007 and 2006, by reportable business segment, were as follows:
| | | | | | | | | | | | |
(in thousands) | | Flavors &
Fragrances | | Color | | Corporate
& Other | | Consolidated |
Balance as of December 31, 2005 | | $ | 131,702 | | $ | 287,867 | | $ | 632 | | $ | 420,201 |
Currency translation impact | | | 8,297 | | | 20,683 | | | 13 | | | 28,993 |
| | | | | | | | | | | | |
Balance as of December 31, 2006 | | | 139,999 | | | 308,550 | | | 645 | | | 449,194 |
Currency translation impact | | | 10,453 | | | 16,957 | | | 7 | | | 27,417 |
| | | | | | | | | | | | |
Balance as of December 31, 2007 | | $ | 150,452 | | $ | 325,507 | | $ | 652 | | $ | 476,611 |
| | | | | | | | | | | | |
3
Debt
Long-term debt consisted of the following unsecured obligations at December 31:
| | | | | | | |
(in thousands) | | 2007 | | | 2006 |
5.85% Euro-denominated senior notes due November 2013 | | $ | 28,226 | | | $ | 25,525 |
7.31% senior notes due November 2013 | | | 25,000 | | | | 25,000 |
5.78% Euro-denominated senior notes due November 2011 | | | 56,452 | | | | 51,049 |
7.17% senior notes due November 2011 | | | 30,000 | | | | 30,000 |
Floating rate Euro-denominated senior notes due November 2011 | | | 28,226 | | | | 25,525 |
6.68% senior notes due through January 2011 | | | 8,571 | | | | 10,714 |
6.77% senior notes due through January 2010 | | | 15,000 | | | | 15,000 |
6.60% notes due through April 2009 | | | 149,817 | | | | 149,681 |
7.59% senior notes due through December 2008 | | | 4,286 | | | | 8,571 |
6.99% senior notes due through December 2007 | | | — | | | | 20,000 |
4.57% senior notes due December 2007 | | | — | | | | 38,000 |
Floating rate Swiss Franc-denominated senior notes due December 2007 | | | — | | | | 26,732 |
Long-term revolving loan agreement | | | 91,788 | | | | — |
Various other notes | | | 12,398 | | | | 15,432 |
Deferred realized gains (losses) on interest rate swaps | | | (143 | ) | | | 77 |
| | | | | | | |
| | | 449,621 | | | | 441,306 |
Less current maturities | | | — | | | | — |
| | | | | | | |
Total long-term debt | | $ | 449,621 | | | $ | 441,306 |
| | | | | | | |
33
|
Notes to Consolidated Financial Statements continued |
|
Years ended December 31, 2007, 2006 and 2005 |
The floating rate long-term Euro-denominated notes had average coupon rates of 6.16% and 5.52% for the years ended December 31, 2007 and 2006, respectively. The borrowings under the long-term revolving loan agreement had an average interest rate of 4.91% for the year ended December 31, 2007. The floating rate Swiss Franc-denominated notes, repaid in December 2007, had average coupon rates of 3.35% and 2.30% for the years ended December 31, 2007 and 2006, respectively.
The aggregate amounts of maturities on long-term debt each year for the five years subsequent to December 31, 2007, are as follows: 2008, $6.9 million; 2009, $159.9 million; 2010, $17.9 million; 2011, $117.2 million; 2012, $92.1 million.
The Company has approximately $6.9 million of long-term debt that matures in 2008. It is the Company’s intention to refinance these maturities under the long-term revolving loan agreement and, accordingly, that maturing debt has been classified as long-term debt in the Consolidated Balance Sheet.
Included in the various other notes in the table above are $6.9 million of notes maturing in 2009 that may be redeemed, in whole or in part, at any time prior to maturity at the option of the note-holders. This debt has been classified as long-term debt in the Consolidated Balance Sheet because it can be refinanced with proceeds drawn under the Company’s long-term revolving loan agreement.
Substantially all of the senior loan agreements contain restrictions concerning interest coverage, borrowings, investments and tangible net worth amounts. The Company is in compliance with all of these restrictions at December 31, 2007.
On June 15, 2007, the Company completed a new $300 million revolving credit facility with a group of eight banks. The new facility, which replaced the Company’s $225 million facility, matures in June 2012 and is unsecured. The agreement also permits the Company to request an increase in the aggregate facility amount to $375 million subject to the banks’ approval. Interest rates on borrowings with three days notice are determined based upon LIBOR plus a margin subject to adjustment based on the Company’s debt to EBITDA ratio, as defined, or the rating accorded the Company’s senior debt by Standards & Poor’s and Moody’s, whichever is more favorable to the Company. Without the three days notice, interest is based on the higher of the prime rate or the federal funds rate plus 0.50%. A facility fee is payable on the total amount of the commitment. The facility was used to refinance approximately $90 million of notes that matured in December 2007 and for general corporate purposes. The direct borrowings under the revolving loan agreement at December 31, 2007, have been classified as long-term debt in the Consolidated Balance Sheet as it is the Company’s intent that it will be outstanding for at least 12 months.
The Company’s short-term borrowings consisted of the following items at December 31:
| | | | | | |
(in thousands) | | 2007 | | 2006 |
Direct borrowings under the revolving loan agreement | | $ | — | | $ | 59,406 |
Commercial paper | | | 11,125 | | | 9,950 |
Uncommitted loans | | | 43,960 | | | 18,050 |
Loans of foreign subsidiaries | | | 2,402 | | | 3,820 |
| | | | | | |
Total | | $ | 57,487 | | $ | 91,226 |
| | | | | | |
The weighted-average interest rates on short-term borrowings were 5.09% and 5.06% at December 31, 2007 and 2006, respectively.
The Company has $197.1 million available under the revolving credit facility and $58.8 million available under other lines of credit from several banks at December 31, 2007.
The Company has stand-by letters of credit outstanding of $8.0 million and $9.7 million as of December 31, 2007 and 2006, respectively.
4
Financial Instruments and Risk Management
Foreign Currency ContractsThe Company uses forward exchange contracts to reduce the effect of fluctuating foreign currencies on short-term foreign currency-denominated intercompany transactions and other known foreign currency exposures. At December 31, 2007 and 2006, the Company had forward exchange contracts (accounted for as cash flow hedges), with maturities of one year or less, of $119.5 million and $96.2 million, respectively. The fair values of these instruments, based on dealer quotes, were an asset of $0.1 million at December 31, 2007, which will be reclassified into earnings in 2008. The fair value of these instruments at December 31, 2006, was a liability of $0.4 million.
Foreign-denominated DebtIn November 2006, the Company entered into a 77 million Euro-denominated note agreement. The Company has 3.8 million Euros and 32.0 million Swiss Francs outstanding under the long-term revolving loan agreement at December 31, 2007. These non-derivative instruments have been designated as partial hedges of the Company’s Swiss Franc and Euro net asset positions. Losses of $17.5 million and $20.1 million have been recorded in foreign currency translation in OCI for the years ended December 31, 2007 and 2006, respectively.
Concentrations of Credit RiskCounterparties to currency exchange and interest rate swap contracts consist of large international financial institutions. While these counterparties may expose the Company to potential losses due to the credit risk of non-performance, losses are not anticipated. Concentrations of credit risk with respect to trade accounts receivable are limited by the
34
| | |
| | |
| | Sensient Technologies Corporation 2007 Annual Report |
| | |
large number of customers, generally short payment terms and their dispersion across geographic areas.
Fair Values The carrying amount of cash and cash equivalents, trade accounts receivable, accounts payable, accrued expenses and short-term borrowings approximated fair value as of December 31, 2007 and 2006.
The fair value of the Company’s long-term debt, including current maturities, is estimated using discounted cash flows based on the Company’s current incremental borrowing rates for similar types of borrowing arrangements. The carrying value of long-term debt at December 31, 2007 and 2006 was $449.6 million and $441.3 million, respectively. The fair value of long-term debt at December 31, 2007 and 2006 was approximately $439.5 million and $429.8 million, respectively.
5
Share-Based Compensation
The Company adopted SFAS No. 123(R),Share-Based Payment, on January 1, 2006. SFAS No. 123(R) requires stock-based compensation to be expensed over the vesting period of the awards based on the grant-date fair value. The Company elected to adopt using the modified prospective transition method which did not result in the restatement of previously issued financial statements. Under the provisions of SFAS No. 123(R), expense is recognized on all awards granted or modified after the date of adoption and unvested awards at the date of adoption.
Prior to January 1, 2006, the Company accounted for stock-based compensation in accordance with Accounting Principles Board Opinion (“APB”) No. 25,Accounting for Stock Issued to Employees. Accordingly, no compensation expense had been recognized for stock options because all options granted had an exercise price equal to the market value of the underlying stock on the grant date.
The Company has various stock plans under which employees and directors may be granted nonvested stock, non-qualified stock options or incentive stock options. Upon vesting, the stock options allow the participant to purchase common stock at 100% of the market price on the day the options were granted. Under the 2007 Restricted Stock Plan, up to 1.5 million shares of nonvested stock were available for employee awards. Under the 2002 Stock Option Plan, up to 2.4 million shares of common stock were available for employee awards, of which no more than 0.6 million shares may be nonvested stock. Under the 1998 Stock Option Plan, which expired in January 2008 except for outstanding options, up to 2.4 million shares of common stock were available for employee awards, of which no more than 0.6 million shares may be nonvested stock. Under the 1994 Stock Option Plan, which expired in January 2004, except for outstanding options, up to 2.4 million shares of common stock were available for employee awards, of which no more than 0.5 million shares could be non-vested stock. Under the amended 2002 Non-Employee Director Stock Plan, up to 0.09 million shares of common stock were available for director awards of nonvested stock. Under the 1999 Non-Employee Director Stock Option Plan, up to 0.25 million shares of common stock were available for director awards.
As of December 31, 2007, there were 2.8 million shares available to be granted as future stock options and non-vested stock under existing stock plans. Of the shares available, 1.8 million may be awarded as nonvested stock. Stock options become exercisable over a three-year vesting period, or earlier upon retirement, and expire 10 years from the date of grant. Expense for stock options is recognized on a straight-line basis over three years from the date of grant or over the period from the date of grant until the participant is retirement-eligible, whichever is less. Treasury shares are issued for nonvested stock awards and for the exercise of stock options.
The Company estimated the fair value of stock options using the Black-Scholes option pricing model. The weighted-average fair value per share of options granted was $5.81 in 2007, $4.76 in 2006 and $4.79 in 2005. Significant assumptions used in estimating the fair value of awards granted are as follows:
| | | | | | | | | |
| | | 2007 | | | 2006 | | | 2005 | |
Dividend yield | | 2.7 | % | | 3.1 | % | | 3.1 | % |
Volatility | | 26.0 | % | | 27.0 | % | | 28.3 | % |
Risk-free interest rate | | 4.8 | % | | 4.8 | % | | 4.3 | % |
Expected term (years) | | 5.0 | | | 5.2 | | | 5.1 | |
The Company’s stock plans also provide for the awarding of nonvested stock. Expense for shares of nonvested stock is recognized over five years from the date of grant or during the period from the date of grant until the participant attains age 65, whichever is less. During the period of restriction, the holder of nonvested stock has voting rights and is entitled to receive all dividends and other distributions paid with respect to the stock.
Total pre-tax share-based compensation recognized in the Consolidated Statements of Earnings was $4.7 million, $5.0 million and $1.9 million in 2007, 2006 and 2005, respectively. Tax related benefits of $0.5 million, $0.8 million and $0.7 million were also recognized in 2007, 2006 and 2005, respectively. Amounts recorded in 2005 represent expenses related to the amortization of non-vested stock awards. Cash received from the exercise of stock options was $14.1 million, $7.0 million and $3.0 million for 2007, 2006 and 2005, respectively, and is reflected in cash flows from financing activities in the Consolidated Statements of Cash Flows.
As a result of adopting SFAS No. 123(R) on January 1, 2006, the Company’s earnings before income taxes for the years ended December 31, 2007 and 2006 were $0.8 million and $1.2 million lower, respectively, and net earnings were $0.6 million and $0.9 million lower,
35
|
Notes to Consolidated Financial Statements continued |
|
Years ended December 31, 2007, 2006 and 2005 |
respectively, than if the Company had continued to account for stock-based compensation under APB No. 25. Both basic and diluted earnings per share for 2007 and 2006, were $0.01 and $0.02 lower, respectively, than if the Company had continued to account for stock-based compensation under APB No. 25.
SFAS No. 123(R) requires the cash flows from the excess tax benefits the Company realizes on the exercise of stock options to be presented as cash flows from financing activities in the Consolidated Statements of Cash Flows. The excess tax benefits on the exercise of stock options for the years ended December 31, 2007 and 2006, presented as cash flows from financing activities, were not material. The excess tax benefits on the exercise of stock options for the year ended December 31, 2005, presented as cash flows from operating activities, were not material.
The following table illustrates the pro forma effect on net earnings and earnings per share if the Company had applied the fair value recognition provisions of SFAS No. 123 to stock-based employee compensation for 2005:
| | | | |
(in thousands except per share information) | | 2005 | |
Net earnings, as reported | | $ | 44,195 | |
Add: reported stock compensation expense – net of tax | | | 1,167 | |
Less: fair value of stock compensation expense – net of tax | | | (3,403 | ) |
| | | | |
Pro forma net earnings | | $ | 41,959 | |
| | | | |
Earnings per share | | | | |
Basic as reported | | $ | 0.95 | |
Basic pro forma | | $ | 0.90 | |
Diluted as reported | | $ | 0.94 | |
Diluted pro forma | | $ | 0.89 | |
The pro forma expense for 2005 included $1.0 million after-tax compensation expense for stock options related to accelerated amortization for retirement eligible participants, as the Company’s stock compensation plans provide for full vesting of option awards at retirement. Beginning in the first quarter of 2005, stock compensation expense for retirement eligible participants was reported in pro forma net earnings over the lesser of three years or until the participant achieves early retirement age. Previously, this expense was recognized over the vesting period, which was three years.
The Company had previously and will continue to expense awards for nonvested stock based on the fair value of the Company’s common stock at the date of grant. As a result of adopting SFAS No. 123(R), unearned compensation previously recorded in equity was reclassified to additional paid-in capital as of January 1, 2006.
The following table summarizes the transactions involving the stock option plans:
| | | | | | | | | | | |
(in thousands except exercise price and life) | | Options | | | Weighted-
Average
Exercise
Price | | Weighted-
Average
Remaining
Life (Years) | | Aggregate
Intrinsic
Value |
Outstanding at | | | | | | | | | | | |
December 31, 2004 | | 3,103 | | | $ | 20.46 | | 6.2 | | $ | 10,964 |
Granted | | 367 | | | | 20.48 | | | | | |
Exercised | | (174 | ) | | | 17.12 | | | | | |
Cancelled | | (65 | ) | | | 21.67 | | | | | |
| | | | | | | | | | | |
Outstanding at | | | | | | | | | | | |
December 31, 2005 | | 3,231 | | | | 20.62 | | 5.8 | | | 376 |
Granted | | 136 | | | | 20.39 | | | | | |
Exercised | | (388 | ) | | | 18.05 | | | | | |
Cancelled | | (130 | ) | | | 20.63 | | | | | |
| | | | | | | | | | | |
Outstanding at | | | | | | | | | | | |
December 31, 2006 | | 2,849 | | | | 20.96 | | 5.5 | | | 10,380 |
Granted | | 112 | | | | 24.66 | | | | | |
Exercised | | (677 | ) | | | 21.06 | | | | | |
Cancelled | | (56 | ) | | | 21.76 | | | | | |
| | | | | | | | | | | |
Outstanding at December 31, 2007 | | 2,228 | | | $ | 21.10 | | 5.3 | | $ | 16,008 |
| | | | | | | | | | | |
Exercisable at December 31, 2007 | | 1,934 | | | $ | 20.98 | | 4.8 | | $ | 14,127 |
| | | | | | | | | | | |
The aggregate intrinsic values of stock options exercised during 2007, 2006 and 2005, were $4.2 million, $1.6 million and $0.6 million, respectively.
As of December 31, 2007, total remaining unearned compensation, net of expected forfeitures, related to unvested stock options was $0.6 million, which will be amortized over the weighted-average remaining service period of 1.8 years.
The following table summarizes information concerning outstanding and exercisable stock options at December 31, 2007:
| | | | | | | | | |
| | | Range of Exercise Price |
(in thousands except life and exercise price) | | $18.00-
19.99 | | $20.00-
23.09 | | $23.10-
26.12 |
Options outstanding | | | 910 | | | 823 | | | 495 |
Weighted-average remaining contractual life, in years | | | 5.5 | | | 4.9 | | | 5.7 |
Weighted-average exercise price | | $ | 18.81 | | $ | 22.09 | | $ | 23.64 |
| | | | | | | | | |
| | | |
Options exercisable | | | 794 | | | 768 | | | 372 |
Weighted-average exercise price | | $ | 18.81 | | $ | 22.07 | | $ | 23.33 |
| | | | | | | | | |
The closing stock price of Sensient common stock at December 31, 2007 was $28.28.
36
| | |
| | |
| | Sensient Technologies Corporation 2007 Annual Report |
| | |
The following table summarizes the nonvested stock activity:
| | | | | | | | | |
(in thousands except fair value) | | Shares | | | Grant Date
Weighted-
Average
Fair Value | | Aggregate
Intrinsic
Value |
Outstanding at December 31, 2004 | | 360 | | | $ | 21.11 | | $ | 8,632 |
Granted | | 142 | | | | 18.65 | | | |
Vested | | (33 | ) | | | 21.89 | | | |
Cancelled | | (13 | ) | | | 22.23 | | | |
| | | | | | | | | |
Outstanding at December 31, 2005 | | 456 | | | | 20.26 | | | 8,164 |
Granted | | 172 | | | | 24.01 | | | |
Vested | | (77 | ) | | | 18.72 | | | |
| | | | | | | | | |
Outstanding at December 31, 2006 | | 551 | | | | 21.64 | | | 13,564 |
Granted | | 240 | | | | 29.01 | | | |
Vested | | (309 | ) | | | 23.63 | | | |
Cancelled | | (31 | ) | | | 21.47 | | | |
| | | | | | | | | |
Outstanding at December 31, 2007 | | 451 | | | $ | 24.22 | | $ | 12,764 |
| | | | | | | | | |
The total fair value of shares vested during 2007, 2006 and 2005, was $8.0 million, $1.4 million and $0.7 million, respectively.
The fair value of the nonvested shares at the date of grant is amortized over the vesting period but not exceeding age 65 of the participant. As of December 31, 2007, total remaining unearned compensation, net of expected forfeitures, related to nonvested stock was $7.0 million, which will be amortized over the weighted-average remaining service period of 3.4 years.
6
Retirement Plans
The Company provides benefits under defined contribution plans including a savings plan and an employee stock ownership plan (“ESOP”). The savings plan covers substantially all domestic salaried and certain non-union hourly employees and provides for matching contributions up to 4% of each employee’s salary. The ESOP covers substantially all domestic employees not covered by a defined benefit plan and provides for contributions based on a percentage of each employee’s compensation as determined by the Board of Directors. Total expense for the Company’s defined contribution plans was $3.6 million, $3.2 million and $2.9 million in 2007, 2006 and 2005, respectively.
Although the Company intends the defined contribution plans mentioned above to be the primary retirement benefit for most employees, the Company also has several defined benefit plans. On December 31, 2006, the Company adopted SFAS No. 158,Employers’ Accounting for Defined Benefit Pension and Other Postretirement Plans. The funded status of the defined benefit plans was as follows at December 31:
| | | | | | | | |
(in thousands) | | 2007 | | | 2006 | |
Benefit obligation at beginning of year | | $ | 48,210 | | | $ | 49,633 | |
Service cost | | | 1,564 | | | | 1,091 | |
Interest cost | | | 2,851 | | | | 2,446 | |
Foreign currency exchange rate changes | | | 1,250 | | | | 1,491 | |
Benefits paid | | | (2,644 | ) | | | (4,822 | ) |
Actuarial loss (gain) | | | 2,110 | | | | (1,629 | ) |
| | | | | | | | |
Benefit obligation at end of year | | | 53,341 | | | | 48,210 | |
| | | | | | | | |
Plan assets at beginning of year | | | 17,978 | | | | 18,132 | |
Company contributions | | | 3,932 | | | | 2,483 | |
Foreign currency exchange rate changes | | | 1,147 | | | | 1,049 | |
Benefits paid | | | (2,644 | ) | | | (4,822 | ) |
Actual gain on plan assets | | | 824 | | | | 1,136 | |
| | | | | | | | |
Plan assets at end of year | | | 21,237 | | | | 17,978 | |
| | | | | | | | |
Funded status | | $ | (32,104 | ) | | $ | (30,232 | ) |
| | | | | | | | |
Accumulated benefit obligation | | $ | 51,524 | | | $ | 40,074 | |
| | | | | | | | |
Amounts recognized in the Consolidated Balance Sheets at December 31:
| | | | | | | | | | | | |
(in thousands) | | | | | 2007 | | | 2006 | |
Accrued employee and retiree benefits | | | | | | $ | (34,277 | ) | | $ | (30,702 | ) |
Prepaid expenses and other current assets | | | | | | | 2,173 | | | | 470 | |
| | | | | | | | | | | | |
Net liability | | | | | | $ | (32,104 | ) | | $ | (30,232 | ) |
| | | | | | | | | | | | |
| | | |
Components of annual benefit cost: | | | | | | | | | | | | |
| | | |
(in thousands) | | 2007 | | | 2006 | | | 2005 | |
Service cost | | $ | 1,564 | | | $ | 1,091 | | | $ | 1,038 | |
Interest cost | | | 2,851 | | | | 2,446 | | | | 2,328 | |
Expected return on plan assets | | | (1,120 | ) | | | (895 | ) | | | (813 | ) |
Amortization of prior service cost | | | 1,950 | | | | 1,935 | | | | 1,281 | |
Recognized actuarial loss | | | 216 | | | | 308 | | | | 186 | |
Settlement expense | | | — | | | | 1,036 | | | | — | |
| | | | | | | | | | | | |
Defined benefit expense | | $ | 5,461 | | | $ | 5,921 | | | $ | 4,020 | |
| | | | | | | | | | | | |
37
|
Notes to Consolidated Financial Statements continued |
|
Years ended December 31, 2007, 2006 and 2005 |
Weighted-average liability assumptions as of December 31:
| | | | | | |
| | | 2007 | | | 2006 | |
Discount rate | | 6.00 | % | | 5.75 | % |
Expected return on plan assets | | 5.98 | % | | 6.00 | % |
Rate of compensation increase | | 4.28 | % | | 4.00 | % |
| | | | | | |
| | |
Weighted-average cost assumptions for the year ended December 31: | | | | | | |
| | |
| | | 2007 | | | 2006 | |
Discount rate | | 5.75 | % | | 5.50 | % |
Expected return on plan assets | | 6.00 | % | | 6.00 | % |
Rate of compensation increase | | 4.00 | % | | 4.00 | % |
The aggregate amounts of benefits expected to be paid from defined benefit plans in each of the next five years subsequent to December 31, 2007, which include employees’ expected future service are as follows: 2008, $3.9 million; 2009, $8.8 million; 2010, $13.5 million; 2011, $2.0 million; 2012, $3.9 million; and $13.1 million in total for the years 2013 through 2017.
The Company expects to contribute $8.9 million to defined benefit plans in 2008.
The incremental effect of applying SFAS No. 158 on individual line items in the Company’s balance sheet at December 31, 2006 was as follows:
| | | | | | | | | | |
| | | Before | | | | | After |
(in thousands) | | Application | | Adjustments | | | Application |
Other assets | | $ | 54,602 | | $ | (10,543 | ) | | $ | 44,059 |
Deferred income taxes (asset) | | | — | | | 3,149 | | | | 3,149 |
Accrued employee and retiree benefits | | | 41,779 | | | 2,178 | | | | 43,957 |
Deferred income taxes (liability) | | | 1,795 | | | (1,795 | ) | | | — |
Accumulated other comprehensive income | | | 9,050 | | | (7,777 | ) | | | 1,273 |
| | | | | | | | | | |
Amounts recognized in accumulated other comprehensive income in accordance with SFAS No. 158 were as follows:
| | | | | | |
(in thousands) | | 2007 | | 2006 |
Prior service cost | | $ | 9,408 | | $ | 11,138 |
Unrecognized net actuarial loss | | | 8,773 | | | 6,656 |
| | | | | | |
The estimated prior service cost and actuarial loss for the defined benefit plans that will be amortized from accumulated other comprehensive income into periodic benefit cost during 2008 are $2.0 million and $0.2 million, respectively.
7
Income Taxes
The provision for income taxes was as follows:
| | | | | | | | | | | |
(in thousands) | | 2007 | | 2006 | | | 2005 | |
Currently payable (refundable): | | | | | | | | | | | |
Federal | | $ | 1,945 | | $ | 11,595 | | | $ | 7,999 | |
State | | | 1,087 | | | (230 | ) | | | (42 | ) |
Foreign | | | 21,044 | | | 16,017 | | | | 15,377 | |
| | | | | | | | | | | |
| | | 24,076 | | | 27,382 | | | | 23,334 | |
| | | | | | | | | | | |
Deferred (benefit) expense: | | | | | | | | | | | |
Federal | | | 4,400 | | | (952 | ) | | | (6,845 | ) |
State | | | 47 | | | (637 | ) | | | 566 | |
Foreign | | | 4,934 | | | 1,311 | | | | (2,773 | ) |
| | | | | | | | | | | |
| | | 9,381 | | | (278 | ) | | | (9,052 | ) |
| | | | | | | | | | | |
Income taxes | | $ | 33,457 | | $ | 27,104 | | | $ | 14,282 | |
| | | | | | | | | | | |
The tax effects of temporary differences that give rise to significant portions of deferred tax assets and liabilities consisted of the following:
| | | | | | | | |
(in thousands) | | 2007 | | | 2006 | |
Deferred tax assets: | | | | | | | | |
Benefit plans | | $ | 11,475 | | | $ | 13,042 | |
Liabilities and reserves | | | 5,096 | | | | 8,174 | |
Foreign operating loss carryovers | | | 30,254 | | | | 36,578 | |
Other | | | 18,600 | | | | 23,688 | |
| | | | | | | | |
Gross deferred tax assets | | | 65,425 | | | | 81,482 | |
Valuation allowance | | | (26,256 | ) | | | (32,857 | ) |
| | | | | | | | |
Deferred tax assets | | | 39,169 | | | | 48,625 | |
| | | | | | | | |
Deferred tax liabilities: | | | | | | | | |
Property, plant and equipment | | | (19,918 | ) | | | (18,836 | ) |
Other assets | | | (4,494 | ) | | | (4,634 | ) |
Other | | | (15,480 | ) | | | (12,072 | ) |
| | | | | | | | |
Deferred tax liabilities | | | (39,892 | ) | | | (35,542 | ) |
| | | | | | | | |
Net deferred tax (liabilities) assets | | $ | (723 | ) | | $ | 13,083 | |
| | | | | | | | |
At December 31, 2007, foreign operating loss carryovers were $115.2 million. Included in the foreign operating loss carryovers are losses of $6.0 million that expire through 2022 and $109.2 million that do not have an expiration date. At December 31, 2007, state operating loss carryovers were $116.7 million, all of which expire through 2022.
38
The effective tax rate differed from the statutory federal income tax rate of 35% as described below:
| | | | | | | | | | | | |
| | | 2007 | | | 2006 | | | 2005 | |
Taxes at statutory rate | | | 35.0 | % | | | 35.0 | % | | | 35.0 | % |
State income taxes, net of federal income tax benefit | | | 0.7 | | | | 0.2 | | | | 1.5 | |
Tax credits | | | (0.3 | ) | | | (0.7 | ) | | | (2.8 | ) |
Taxes on foreign earnings | | | (0.1 | ) | | | (4.5 | ) | | | (0.8 | ) |
Foreign sales corporation/ extraterritorial income tax benefit | | | 0.0 | | | | (0.7 | ) | | | (2.3 | ) |
Resolution of prior years’ tax matters | | | (5.3 | ) | | | (5.9 | ) | | | (4.2 | ) |
Valuation allowance adjustments | | | (0.9 | ) | | | 0.8 | | | | (1.1 | ) |
Other, net | | | 1.0 | | | | 4.8 | | | | (0.9 | ) |
| | | | | | | | | | | | |
Effective tax rate | | | 30.1 | % | | | 29.0 | % | | | 24.4 | % |
| | | | | | | | | | | | |
| | | |
| Earnings before income taxes were as follows: | | | | | | | | | | | | |
| | | |
(in thousands) | | 2007 | | | 2006 | | | 2005 | |
United States | | $ | 22,470 | | | $ | 18,686 | | | $ | 13,432 | |
Foreign | | | 88,773 | | | | 74,843 | | | | 45,045 | |
| | | | | | | | | | | | |
Total | | $ | 111,243 | | | $ | 93,529 | | | $ | 58,477 | |
| | | | | | | | | | | | |
Federal and state income taxes are provided on international subsidiary income distributed to or taxable in the U.S. during the year. At December 31, 2007, federal and state taxes have not been provided for approximately $265.3 million of unremitted earnings of the foreign subsidiaries that are considered to be permanently invested or that would be offset by foreign tax credits generated upon distribution. Determination of the deferred tax liability on such earnings, if the Company chose to remit those earnings, is not practicable.
On January 1, 2007, the Company adopted FIN 48,Accounting for Uncertainty in Income Taxes. This interpretation prescribes the minimum recognition threshold which a tax position is required to meet before being recognized in the financial statements. FIN 48 also provides guidance on the measurement, classification and derecognition of tax positions. As a result of the adoption of FIN 48, the Company recognized an increase in the liability for unrecognized tax benefits of approximately $2.3 million, which was accounted for as a reduction to the January 1, 2007 balance of retained earnings.
A reconciliation of the change in the liability for unrecognized tax benefits from January 1, 2007 to December 31, 2007 is as follows:
| | | | |
(in thousands) | | 2007 | |
Balance at beginning of year | | $ | 13,945 | |
Increases for tax positions taken in the current year | | | 989 | |
Increases for tax positions taken in prior years | | | 1,326 | |
Decreases for tax positions taken in prior years | | | (553 | ) |
Decreases related to settlements with tax authorities | | | (320 | ) |
Decreases as a result of lapse of the applicable statutes of limitations | | | (5,315 | ) |
Foreign currency exchange rate changes | | | 570 | |
| | | | |
Balance at the end of year | | $ | 10,642 | |
| | | | |
The amount of the unrecognized tax benefits that would affect the effective tax rate, if recognized, was approximately $8.0 million. The Company recognizes interest and penalties related to the unrecognized tax benefits in income tax expense. Approximately $1.9 million of accrued interest and penalties is reported as an income tax liability at December 31, 2007. The liability for unrecognized tax benefits relates to multiple jurisdictions and is reported in Other Liabilities on the consolidated condensed balance sheet at December 31, 2007.
The Company believes that it is reasonably possible that the total amount of unrecognized tax benefits as of December 31, 2007, will decrease by approximately $2.4 million during 2008. The potential decrease relates to various tax matters for which the statute of limitations may expire in 2008. The amount that is ultimately recognized in the financial statements will be dependent upon various factors including potential increases or decreases to unrecognized tax benefits as a result of examinations, settlements and other unanticipated items that may occur during the year. With limited exceptions, the Company is no longer subject to federal, state and local, or non-U.S. income tax examinations by tax authorities for years before 2002.
8
Segment and Geographic Information
The accounting policies of the segments are the same as those described in the summary of significant accounting policies. The Company evaluates performance based on operating income of the respective business units before restructuring charges, interest expense and income taxes. Total revenue and operating income by business segment and geographic region include both sales to customers, as reported in the Company’s Consolidated Statements of Earnings, and intersegment sales, which are accounted for at prices which approximate market prices and are eliminated in
39
| | |
Notes to Consolidated Financial Statements continued | | |
| | |
Years ended December 31, 2007, 2006 and 2005 | | |
consolidation. Corporate and other revenue consists primarily of flavor, fragrances and color products sold by the Asia Pacific Group.
Assets by business segment and geographic region are those assets used in the Company’s operations in each segment and geographic region. Segment assets reflect the allocation of goodwill to each segment. Corporate and other assets consist primarily of property and investments.
Segment Information The Company’s operations, except for the Asia Pacific Group, are managed on a products and services basis. The Company determines its operating segments based on information utilized by senior management to allocate resources and assess performance. The Company’s reportable segments consist of Flavors & Fragrances and Color. The Company’s Flavors & Fragrances segment produces flavor and fragrance products that impart a desired taste, texture, aroma or other characteristic to a broad range of consumer and other products. The Color segment produces natural and synthetic color systems for pharmaceuticals, foods and beverages; colors and formulations for cosmetics; and technical colors for industrial applications and digital imaging. The Corporate and Other segment includes the Asia Pacific Group.
| | | | | | | | | | | | | |
(in thousands) | | Flavors &
Fragrances | | Colors | | Corporate
& Other | | | Consolidated |
2007 | | | | | | | | | | | | | |
Revenue from external customers | | $ | 768,946 | | $ | 365,825 | | $ | 50,007 | | | $ | 1,184,778 |
Intersegment revenue | | | 14,771 | | | 12,039 | | | 973 | | | | 27,783 |
| | | | | | | | | | | | | |
Total revenue | | | 783,717 | | | 377,864 | | | 50,980 | | | | 1,212,561 |
| | | | | | | | | | | | | |
Operating income (loss) | | | 117,299 | | | 66,950 | | | (36,879 | ) | | | 147,370 |
Interest expense | | | — | | | — | | | 36,127 | | | | 36,127 |
| | | | | | | | | | | | | |
Earnings (loss) before income taxes | | | 117,299 | | | 66,950 | | | (73,006 | ) | | | 111,243 |
| | | | | | | | | | | | | |
Assets | | | 817,775 | | | 653,116 | | | 93,291 | | | | 1,564,182 |
Capital expenditures | | | 29,239 | | | 9,723 | | | 2,999 | | | | 41,961 |
Depreciation and amortization | | | 26,957 | | | 13,001 | | | 4,354 | | | | 44,312 |
| | | | |
2006 | | | | | | | | | | | | | |
Revenue from external customers | | $ | 719,747 | | $ | 339,004 | | $ | 40,023 | | | $ | 1,098,774 |
Intersegment revenue | | | 13,674 | | | 11,170 | | | 1,278 | | | | 26,122 |
| | | | | | | | | | | | | |
Total revenue | | | 733,421 | | | 350,174 | | | 41,301 | | | | 1,124,896 |
| | | | | | | | | | | | | |
Operating income (loss) | | | 104,457 | | | 59,384 | | | (34,564 | ) | | | 129,277 |
Interest expense | | | — | | | — | | | 35,748 | | | | 35,748 |
| | | | | | | | | | | | | |
Earnings (loss) before income taxes | | | 104,457 | | | 59,384 | | | (70,312 | ) | | | 93,529 |
| | | | | | | | | | | | | |
Assets | | | 747,283 | | | 620,423 | | | 86,361 | | | | 1,454,067 |
Capital expenditures | | | 28,034 | | | 6,368 | | | 4,912 | | | | 39,314 |
Depreciation and amortization | | | 26,581 | | | 12,561 | | | 3,902 | | | | 43,044 |
| | | | |
2005 | | | | | | | | | | | | | |
Revenue from external customers | | $ | 657,747 | | $ | 327,447 | | $ | 38,736 | | | $ | 1,023,930 |
Intersegment revenue | | | 12,847 | | | 12,492 | | | 2,790 | | | | 28,129 |
| | | | | | | | | | | | | |
Total revenue | | | 670,594 | | | 339,939 | | | 41,526 | | | | 1,052,059 |
| | | | | | | | | | | | | |
Operating income (loss) | | | 82,473 | | | 54,197 | | | (42,456 | ) | | | 94,214 |
Interest expense | | | — | | | — | | | 35,737 | | | | 35,737 |
| | | | | | | | | | | | | |
Earnings (loss) before income taxes | | | 82,473 | | | 54,197 | | | (78,193 | ) | | | 58,477 |
| | | | | | | | | | | | | |
Assets | | | 699,792 | | | 595,859 | | | 102,622 | | | | 1,398,273 |
Capital expenditures | | | 20,870 | | | 12,447 | | | 2,785 | | | | 36,102 |
Depreciation and amortization | | | 26,686 | | | 14,366 | | | 3,807 | | | | 44,859 |
Restructuring and other charges | | | — | | | — | | | 12,805 | | | | 12,805 |
39
| | |
| | |
| | Sensient Technologies Corporation 2007 Annual Report |
| | |
Geographic Information The Company has manufacturing facilities or sales offices in North America, South America, Europe, Asia, Australia and Africa.
| | | | | | | | | |
(in thousands) | | 2007 | | 2006 | | 2005 |
Revenue from external customers: | | | | | | | | | |
North America | | $ | 644,463 | | $ | 623,282 | | $ | 569,319 |
Europe | | | 353,539 | | | 320,632 | | | 304,936 |
Asia Pacific | | | 112,226 | | | 93,960 | | | 94,999 |
Other | | | 74,550 | | | 60,900 | | | 54,676 |
| | | | | | | | | |
Consolidated | | $ | 1,184,778 | | $ | 1,098,774 | | $ | 1,023,930 |
| | | | | | | | | |
Long-lived assets: | | | | | | | | | |
North America | | $ | 410,292 | | $ | 393,384 | | $ | 410,202 |
Europe | | | 521,085 | | | 485,844 | | | 448,462 |
Asia Pacific | | | 22,287 | | | 19,644 | | | 18,995 |
Other | | | 474 | | | 344 | | | 270 |
| | | | | | | | | |
Consolidated | | $ | 954,138 | | $ | 899,216 | | $ | 877,929 |
| | | | | | | | | |
Sales in the United States, based on the final country of destination of the Company’s products, were $476.4 million, $463.0 million and $418.7 million in 2007, 2006 and 2005, respectively. No other country of destination exceeded 10% of consolidated sales. Total long-lived assets in the United States amounted to $312.1 million, $314.7 million and $339.4 million at December 31, 2007, 2006 and 2005, respectively.
9
Restructuring and Other Charges
In the fourth quarter of 2005, the Company recorded restructuring and other charges of $12.8 million ($9.8 million after tax, or $0.21 per share) related to a cost reduction plan and an impairment charge to write-down the value of a minority investment as a result of a change in plans for that company by its majority investor. Of the charges, $4.3 million was included in cost of products sold. The charges were all reported in the Corporate and Other segment.
The Company’s 2005 cost reduction plan was intended to improve profitability and mitigate the impact of higher costs within its businesses. The plan also addressed the need to close facilities and reduce headcount in response to lower inkjet ink volumes. The plan resulted in the closure of two excess manufacturing facilities, a total reduction in global headcount of approximately 140 employees across all segments and the elimination of three product lines. Activities to relocate production equipment and prepare excess facilities and excess equipment for sale or disposal began in the fourth quarter of 2005 and were completed in the second quarter of 2006. All remaining payments were in 2007.
The table below summarizes the changes to the accrual for restructuring and other charges. The balance at December 31, 2004, relates to various cost reduction programs initiated by the Company prior to December 31, 2004.
| | | | | | | | | | | | |
(in thousands) | | Employee
Separations | | | Asset-
Related
and Other | | | Total | |
Balances at December 31, 2004 | | $ | 357 | | | $ | — | | | $ | 357 | |
December 2005 charge | | | 6,402 | | | | 6,403 | | | | 12,805 | |
Cash spent | | | (1,952 | ) | | | (181 | ) | | | (2,133 | ) |
Reductions of assets | | | — | | | | (5,390 | ) | | | (5,390 | ) |
| | | | | | | | | | | | |
Balances at December 31, 2005 | | | 4,807 | | | | 832 | | | | 5,639 | |
Cash spent | | | (4,132 | ) | | | (713 | ) | | | (4,845 | ) |
| | | | | | | | | | | | |
Balances at December 31, 2006 | | | 675 | | | | 119 | | | | 794 | |
Cash spent | | | (675 | ) | | | (119 | ) | | | (794 | ) |
| | | | | | | | | | | | |
Balances at December 31, 2007 | | $ | –– | | | $ | –– | | | $ | –– | |
| | | | | | | | | | | | |
10
Commitments and Contingencies
LEASES
The Company leases certain facilities and equipment under operating lease arrangements. Aggregate minimum rental commitments at December 31, 2007, for all noncancelable operating leases with an initial lease term greater than one year for the years ending December 31 were as follows:
| | | |
(in thousands) | | |
2008 | | $ | 7,791 |
2009 | | | 5,071 |
2010 | | | 3,739 |
2011 | | | 2,117 |
2012 | | | 1,278 |
Thereafter | | | 3,952 |
| | | |
| | $ | 23,948 |
| | | |
Rent expense totaled $11.6 million, $10.6 million and $11.4 million during the years ended December 31, 2007, 2006 and 2005, respectively.
41
|
Notes to Consolidated Financial Statements continued |
|
Years ended December 31, 2007, 2006 and 2005 |
ENVIRONMENTAL MATTERS
The Company is involved in various significant environmental matters, which are described below. The Company is also involved in other site closure and related environmental remediation and compliance activities at manufacturing sites primarily related to a 2001 acquisition by the Company for which reserves for environmental matters were established as of the date of purchase. Actions that are legally required or necessary to prepare the sites for sale are substantially complete.
Superfund Claim
On July 6, 2004, the EPA notified the Company’s Sensient Colors Inc. subsidiary that it may be a potentially responsible party (“PRP”) under the Comprehensive Environmental Response, Compensation and Liability Act (“CERCLA”) for activities at the General Color Company Superfund Site in Camden, New Jersey (the “Site”). The EPA requested reimbursement of $10.9 million in clean-up costs, plus interest. Sensient Colors Inc. advised the EPA that the Site had been expressly excluded from the Company’s 1988 stock purchase of H. Kohnstamm & Company, Inc. (now Sensient Colors). The selling shareholders had retained ownership of and liability for the Site, and some became owners of General Color Company, which continued to operate there until the mid-1990s. In a letter to the EPA dated January 31, 2005, the Company outlined legal challenges to the recoverability of certain costs and urged the EPA to pursue General Color Company and related parties. The EPA subsequently informed Sensient Colors Inc. that it was unwilling to discuss these legal challenges without prior conditions. In 2006, the EPA issued a news release stating that a private developer, Westfield Acres Urban Renewal Association II, LP, pursuant to an agreement with the EPA, began redevelopment efforts at the site (construction of affordable housing) by demolishing buildings thereon. Thereafter, the EPA removed allegedly contaminated soil from the locations where the buildings once stood. Documents received pursuant to a Freedom of Information Act request indicate that the EPA incurred additional alleged response costs of approximately $4 million.
On March 16, 2007, the United States filed a complaint in the U.S. District Court in New Jersey against Sensient Colors Inc. claiming “over $16 million” in response costs allegedly incurred and to be incurred by the EPA pursuant to CERCLA. On May 21, 2007, Sensient Colors Inc. filed a motion to dismiss the complaint. The motion was fully briefed in anticipation of a July 6, 2007 motion return date. On October 30, 2007, the Court issued a memorandum opinion and order denying the motion. Sensient Colors Inc. filed a timely answer to the complaint and a third-party complaint against the current owner and former owner and operator of the site. More recently, the United States moved to dismiss Sensient Colors Inc.’s affirmative defenses. Sensient Colors Inc. has opposed the motion and awaits the Court’s determination. The Court has ordered that requests for written discovery be served by March 17, 2008, with responses to be served by May 2, 2008. The deadline for completion of all discovery is currently set for October 31, 2008. A case management conference has been scheduled for June 12, 2008. Sensient Colors Inc. intends to vigorously defend its interests in the litigation. It is evaluating, among other things, the pursuit of additional PRPs and additional challenges to the EPA’s right to recover its claimed response costs. The Company’s legal defense costs are being paid, in part, by an insurer with a reservation of coverage rights. Litigation to resolve coverage rights is pending.
Pleasant Gardens Realty Corp. v. H. Kohnstamm & Co., et al.
The owner of Pleasant Gardens (“Property”), an apartment complex adjacent to the General Color Superfund Site, filed a complaint in New Jersey state court in November 2003 against H. Kohnstamm & Co. (now Sensient Colors Inc.), the Company, General Color Company, and unknown defendants. Plaintiff seeks to hold defendants liable, in an unspecified amount, for damages related to the alleged contamination of the Property. Plaintiff voluntarily dismissed the Company without prejudice. Sensient Colors Inc. filed an answer denying liability and asserting affirmative defenses. Limited discovery has occurred. In November 2006, the Camden Redevelopment Agency (“Agency”) filed condemnation litigation against plaintiff (and other purported interested parties) to take the Property. Sensient Colors Inc. is not a party to the condemnation litigation. In advance of its filing, the Agency notified plaintiff that its appraiser had assessed the fair market value of the Property at $7.7 million and that its environmental consultant had estimated the costs for environmental cleanup, purportedly to meet requirements of the New Jersey Department of Environmental Protection (“DEP”), at $7.5 million. Sensient Colors Inc. and plaintiff have pursued a reduction in the scope and cost of the Agency’s proposed environmental cleanup in meetings with the DEP, the Agency and another party involved in the condemnation, the New Jersey Schools Construction Corporation (“NJSCC”). On March 29, 2007, plaintiff
42
| | |
| | |
| | Sensient Technologies Corporation 2007 Annual Report |
| | |
filed an amended complaint naming the Agency, the NJSCC and the DEP as additional defendants in furtherance of this effort. On April 20, 2007, Sensient Colors Inc. filed its answer to the amended complaint, including cross claims against these newly added parties. The Agency, the DEP and the New Jersey Schools Development Authority (“NJSDA”) (which replaced the NJSCC as a state agency effective August 7, 2007) each filed answers, cross-claims and counter-claims; Sensient Colors Inc. has responded to all three cross-claims. Fact discovery is on-going. A case management conference has been scheduled for March 3, 2008 to establish a schedule for, among other things, expert discovery. To the extent that there is a reduction in the condemnation value of the Property due to the Agency’s remediation of contamination for which Sensient Colors Inc. is allegedly responsible, such reduction may become a part of the damages claimed by plaintiff.
As of December 31, 2007, the liabilities related to environmental matters were estimated to be between $0.8 million and $27.6 million. As of December 31, 2007, the Company has accrued $1.8 million, which is all related to the environmental reserves established in connection with the 2001 acquisition discussed above. This accrual represents management’s best estimate of these liabilities; however, the actual liabilities may be above the levels reserved or estimated, in which case the Company would need to take charges or establish reserves in later periods. Also, the Company has not been able to make a reasonable estimate of the liabilities, if any, related to some of the environmental matters discussed above. The Company has not recorded any potential insurance recoveries related to these liabilities, as receipts are not yet assured. There can be no assurance that additional environmental matters will not arise in the future.
COMMERCIAL LITIGATION
The following are significant commercial cases involving the Company.
Kuiper et al. v. Sensient Flavors Inc. et al.
In late January 2006, the Company’s subsidiary, Sensient Flavors Inc., certain other flavor manufacturers, a flavor industry trade association and its management company were sued in the Federal District Court for the Northern District of Iowa, Western Division, by Ronald Kuiper and his spouse, Conley Kuiper. Mr. Kuiper claims that while working at the American Popcorn Company in Sioux City, Iowa, he was exposed to butter flavoring vapors that caused injury to his respiratory system. Ms. Kuiper’s claim is for loss of consortium. The allegations of this complaint are virtually identical to those contained in another complaint that was filed against Sensient Flavors Inc., involving another worker at the same facility. That lawsuit was ultimately dismissed and Sensient Flavors Inc. paid nothing to the plaintiff. In late October of 2007, Sensient settled the Kuipers’ claim for a confidential amount with Sensient making no admission of liability.
Gill et al. v. Sensient Flavors Inc. et al.
On August 2, 2007, the Company’s subsidiary, Sensient Flavors Inc., certain other flavor manufacturers, certain manufacturers of the chemical diacetyl, and a flavor industry trade association were sued in the Marion County State Court in Indianapolis, Indiana, by Sarah Gill, Judy and Wayne Hults, Shelly Moore, Matthew Niebauer, Terry Reynolds, and Betty and Paul Stapleton. Plaintiffs Gill, Judy Hults, Moore, Niebauer, Reynolds and Betty Stapleton claim that while working at the Weaver Popcorn Company of Van Buren, Indiana, they were exposed to vapors from butter flavoring and other products that contain the chemical diacetyl. They allege that this exposure caused injury to their respiratory systems. Wayne Hults and Paul Stapleton’s claims are for loss of consortium. The allegations of this complaint are virtually identical to those contained in other complaints that have been filed against Sensient Flavors Inc., in other jurisdictions over the use of diacetyl in butter flavoring for microwave popcorn. The defendants, including Sensient Flavors Inc., removed the matter to Federal Court and filed motions for dismissal. An analysis of its sales records by Sensient Flavors Inc. reveals that it did not sell any diacetyl containing products to the Weaver Popcorn facility. By order dated January 15, 2008, the District Court dismissed Sensient Flavors Inc. from the case, without prejudice.
The Company is involved in various other claims and litigation arising in the normal course of business. In the judgment of management, which relies in part on information from Company counsel, the ultimate resolution of these actions will not materially affect the consolidated financial statements of the Company except as described above.
43
| | |
Management’s Report on Internal Control | | |
| | |
Over Financial Reporting | | |
The management of Sensient Technologies Corporation is responsible for establishing and maintaining adequate internal control over financial reporting. It is management’s policy to maintain a control-conscious environment through an effective system of internal accounting controls. These controls are supported by the careful selection of competent and knowledgeable personnel and by the communication of standard accounting and reporting policies and procedures throughout the Company. These controls are designed to provide reasonable assurance regarding the reliability of financial reporting and the preparation of financial statements for external purposes in accordance with generally accepted accounting principles.
Management has assessed the effectiveness of the Company’s internal control over financial reporting as of December 31, 2007. In making its assessment of internal control over financial reporting, management used the criteria set forth by the Committee of Sponsoring Organizations of the Treadway Commission in Internal Control – Integrated Framework. Based on that assessment, management has concluded that the Company’s internal control over financial reporting was effective as of December 31, 2007.
The Company’s independent registered public accounting firm has issued their report on the Company’s internal control over financial reporting. This report appears on page 46.
44
| | |
Reports of Independent Registered | | |
| | Sensient Technologies Corporation 2007 Annual Report |
Public Accounting Firms | | |
To the Board of Directors and Shareholders of
Sensient Technologies Corporation
Milwaukee, Wisconsin
We have audited the accompanying consolidated balance sheets of Sensient Technologies Corporation and subsidiaries (the “Company”) as of December 31, 2007 and 2006, and the related consolidated statements of earnings, shareholders’ equity, and cash flows for the years then ended. These financial statements are the responsibility of the Company’s management. Our responsibility is to express an opinion on these financial statements based on our audits.
We conducted our audits in accordance with the standards of the Public Company Accounting Oversight Board (United States). Those standards require that we plan and perform the audit to obtain reasonable assurance about whether the financial statements are free of material misstatement. An audit includes examining, on a test basis, evidence supporting the amounts and disclosures in the financial statements. An audit also includes assessing the accounting principles used and significant estimates made by management, as well as evaluating the overall financial statement presentation. We believe that our audits provide a reasonable basis for our opinion.
In our opinion, the financial statements referred to above present fairly, in all material respects, the consolidated financial position of Sensient Technologies Corporation and subsidiaries at December 31, 2007 and 2006, and the consolidated results of their operations and their cash flows for the years then ended, in conformity with U.S. generally accepted accounting principles.
As discussed in Note 1 to the consolidated financial statements, on January 1, 2007, the Company changed its method of accounting for uncertain tax positions. During 2006, the Company changed its method for accounting for share-based payments. On December 31, 2006, the Company changed its method of accounting for defined benefit pension plans.
We have also audited, in accordance with the standards of the Public Company Accounting Oversight Board (United States), the Company’s internal control over financial reporting as of December 31, 2007, based on criteria established in Internal Control – Integrated Framework issued by the Committee of Sponsoring Organizations of the Treadway Commission (the COSO criteria) and our report dated February 13, 2008 expressed an unqualified opinion thereon.

Milwaukee, Wisconsin
February 13, 2008
To the Board of Directors and Shareholders of Sensient Technologies Corporation
Milwaukee, Wisconsin
We have audited the accompanying consolidated statements of earnings, shareholders’ equity, and cash flows of Sensient Technologies Corporation and subsidiaries (the “Company”) for the year ended December 31, 2005. These financial statements are the responsibility of the Company’s management. Our responsibility is to express an opinion on these financial statements based on our audit.
We conducted our audit in accordance with the standards of the Public Company Accounting Oversight Board (United States). Those standards require that we plan and perform the audit to obtain reasonable assurance about whether the financial statements are free of material misstatement. An audit includes examining, on a test basis, evidence supporting the amounts and disclosures in the financial statements. An audit also includes assessing the accounting principles used and significant estimates made by management, as well as evaluating the overall financial statement presentation. We believe that our audit provides a reasonable basis for our opinion.
In our opinion, such consolidated financial statements present fairly, in all material respects, the results of operations and cash flows of Sensient Technologies Corporation and subsidiaries for the year ended December 31, 2005, in conformity with accounting principles generally accepted in the United States of America.

Milwaukee, Wisconsin
February 17, 2006
45
|
Report of Independent Registered Public Accounting Firm |
|
on Internal Control Over Financial Reporting |
To the Board of Directors and Shareholders of
Sensient Technologies Corporation
Milwaukee, Wisconsin
We have audited Sensient Technologies Corporation’s (the “Company”) internal control over financial reporting as of December 31, 2007, based on criteria established in Internal Control—Integrated Framework issued by the Committee of Sponsoring Organizations of the Treadway Commission (the COSO criteria). The Company’s management is responsible for maintaining effective internal control over financial reporting, and for its assessment of the effectiveness of internal control over financial reporting included in the accompanying Management’s Report on Internal Control Over Financial Reporting. Our responsibility is to express an opinion on the Company’s internal control over financial reporting based on our audit.
We conducted our audit in accordance with the standards of the Public Company Accounting Oversight Board (United States). Those standards require that we plan and perform the audit to obtain reasonable assurance about whether effective internal control over financial reporting was maintained in all material respects. Our audit included obtaining an understanding of internal control over financial reporting, assessing the risk that a material weakness exists, testing and evaluating the design and operating effectiveness of internal control based on the assessed risk, and performing such other procedures as we considered necessary in the circumstances. We believe that our audit provides a reasonable basis for our opinion.
A company’s internal control over financial reporting is a process designed to provide reasonable assurance regarding the reliability of financial reporting and the preparation of financial statements for external purposes in accordance with generally accepted accounting principles. A company’s internal control over financial reporting includes those policies and procedures that (1) pertain to the maintenance of records that, in reasonable detail, accurately and fairly reflect the transactions and dispositions of the assets of the company; (2) provide reasonable assurance that transactions are recorded as necessary to permit preparation of financial statements in accordance with generally accepted accounting principles, and that receipts and expenditures of the company are being made only in accordance with authorizations of management and directors of the company; and (3) provide reasonable assurance regarding prevention or timely detection of unauthorized acquisition, use, or disposition of the company’s assets that could have a material effect on the financial statements.
Because of its inherent limitations, internal control over financial reporting may not prevent or detect misstatements. Also, projections of any evaluation of effectiveness to future periods are subject to the risk that controls may become inadequate because of changes in conditions, or that the degree of compliance with the policies or procedures may deteriorate.
In our opinion, Sensient Technologies Corporation maintained, in all material respects, effective internal control over financial reporting as of December 31, 2007, based on the COSO criteria.
We also have audited, in accordance with the standards of the Public Company Accounting Oversight Board (United States), the consolidated financial statements as of and for the years ended December 31, 2007 and 2006 of the Company and our report dated February 13, 2008 expressed an unqualified opinion thereon.
Milwaukee, Wisconsin
February 13, 2008
46
| | |
| | |
| | Sensient Technologies Corporation 2007 Annual Report |
| | |
| | | | | | | | | | | | | | | |
| Quarterly Data | | | | Gross | | Net | | Net Earnings Per Share |
(in thousands except per share amounts) (unaudited) | | Revenue | | Profit | | Earnings | | Basic | | Diluted |
2007 | | | | | | | | | | | | | | | |
First Quarter | | $ | 285,268 | | $ | 86,148 | | $ | 17,346 | | $ | 0.37 | | $ | 0.37 |
Second Quarter | | | 304,310 | | | 94,476 | | | 21,233 | | | 0.46 | | | 0.45 |
Third Quarter | | | 294,311 | | | 88,985 | | | 20,783 | | | 0.44 | | | 0.44 |
Fourth Quarter | | | 300,889 | | | 92,690 | | | 18,424 | | | 0.39 | | | 0.39 |
2006 | | | | | | | | | | | | | | | |
First Quarter | | $ | 262,924 | | $ | 79,439 | | $ | 15,618 | | $ | 0.34 | | $ | 0.34 |
Second Quarter | | | 282,212 | | | 85,501 | | | 18,463 | | | 0.40 | | | 0.40 |
Third Quarter | | | 280,878 | | | 83,604 | | | 16,977 | | | 0.37 | | | 0.37 |
Fourth Quarter | | | 272,760 | | | 83,724 | | | 15,367 | | | 0.33 | | | 0.33 |
| | | | | | | | | |
| | | Market Price | | Dividends |
Common Stock Prices and Dividends | | High | | Low | | Per Share |
2007 | | | | | | | | | |
First Quarter | | $ | 26.13 | | $ | 23.81 | | $ | 0.16 |
Second Quarter | | | 30.34 | | | 25.05 | | | 0.16 |
Third Quarter | | | 28.99 | | | 23.66 | | | 0.18 |
Fourth Quarter | | | 31.99 | | | 26.48 | | | 0.18 |
2006 | | | | | | | | | |
First Quarter | | $ | 19.38 | | $ | 16.92 | | $ | 0.15 |
Second Quarter | | | 21.19 | | | 17.66 | | | 0.15 |
Third Quarter | | | 22.99 | | | 19.05 | | | 0.15 |
Fourth Quarter | | | 25.33 | | | 19.32 | | | 0.16 |
| | |
Company Stock Performance This graph compares the cumulative total shareholder return for the Company’s common stock over the last five years to the total returns on the Standard & Poor’s Midcap Specialty Chemicals Index (the “S&P Midcap Specialty Chemicals Index”), the Standard & Poor’s Midcap Food Products Index (the “S&P Food Products Index”) and the Standard & Poor’s 500 Stock Index (the “S&P 500 Index”). The graph assumes a $100 investment made on December 31, 2002 and reinvestment of dividends. The stock performance shown on the graph is not necessarily indicative of future price performance. | | 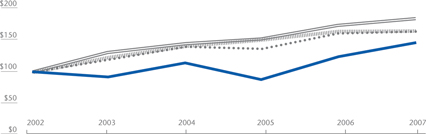 |
| | | | | | | | | | | | | | | | | | | | |
 | | Sensient Technologies Corporation | | $ | 100 | | $ | 91 | | $ | 113 | | $ | 87 | | $ | 123 | | $ | 145 |
| | S&P Midcap Specialty Chemicals Index | | | 100 | | | 117 | | | 140 | | | 135 | | | 159 | | | 163 |
| | S&P Food Products Index | | | 100 | | | 121 | | | 139 | | | 150 | | | 161 | | | 162 |
| | S&P 500 Index | | | 100 | | | 129 | | | 143 | | | 150 | | | 173 | | | 183 |
47
Five Year Review
| | | | | | | |
(in thousands except employee and per share data) Years ended December 31, | | 2007 | |
Summary of Operations | | | | | | | |
Revenue | | $ | 1,184,778 | | | 100.0 | % |
Cost of products sold | | | 822,479 | | | 69.5 | |
Selling and administrative expenses | | | 214,929 | | | 18.1 | |
Restructuring and other charges | | | — | | | — | |
| | | | | | | |
Operating income | | | 147,370 | | | 12.4 | |
Interest expense | | | 36,127 | | | 3.0 | |
| | | | | | | |
Earnings before income taxes | | | 111,243 | | | 9.4 | |
Income taxes | | | 33,457 | | | 2.8 | |
| | | | | | | |
Net earnings | | $ | 77,786 | | | 6.6 | % |
| | | | | | | |
Earnings per share: | | | | | | | |
Basic | | $ | 1.66 | | | | |
Diluted | | $ | 1.65 | | | | |
Other Related Data | | | | | | | |
Dividends per share, declared and paid | | $ | 0.68 | | | | |
Average common shares outstanding: | | | | | | | |
Basic | | | 46,740 | | | | |
Diluted | | | 47,257 | | | | |
Book value per common share | | $ | 17.10 | | | | |
Price range per common share | | | 23.66- 31.99 | | | | |
Share price at December 31 | | | 28.28 | | | | |
Capital expenditures | | | 41,961 | | | | |
Depreciation | | | 42,849 | | | | |
Amortization | | | 1,463 | | | | |
Total assets | | | 1,564,182 | | | | |
Long-term debt | | | 449,621 | | | | |
Total debt | | | 507,108 | | | | |
Shareholders’ equity | | | 814,421 | | | | |
Return on average shareholders’ equity | | | 10.2 | % | | | |
Total debt to total capital | | | 38.4 | % | | | |
Employees | | | 3,623 | | | | |
The 2005 results include restructuring and other charges of $12.8 million ($9.8 million after tax, or $0.21 per share) related to a cost reduction program and an impairment charge (see Note 9). The charges were recorded in cost of products sold ($4.3 million) and in restructuring and other charges ($8.5 million).
The 2003 results include restructuring charges related to a cost reduction plan of $6.5 million and a $13.3 million credit related to termination of postretirement health care plan benefits included in selling and administrative expenses.
48
| | |
| | |
| | Sensient Technologies Corporation 2007 Annual Report |
| | |
| | | | | | | | | | | | | | | | | | | | | | | | | | |
| 2006 | | | 2005 | | | 2004 | | | 2003 | |
| | | | | | | | | | | | | | | | | | | | | | | | | | |
| $ | 1,098,774 | | | 100.0 | % | | $ | 1,023,930 | | | 100.0 | % | | $ | 1,047,133 | | | 100.0 | % | | $ | 987,209 | | | 100.0 | % |
| | 766,506 | | | 69.7 | | | | 731,253 | | | 71.4 | | | | 734,596 | | | 70.2 | | | | 677,414 | | | 68.6 | |
| | 202,991 | | | 18.5 | | | | 189,998 | | | 18.6 | | | | 183,381 | | | 17.5 | | | | 165,835 | | | 16.8 | |
| | — | | | — | | | | 8,465 | | | 0.8 | | | | — | | | — | | | | 6,476 | | | 0.7 | |
| | | | | | | | | | | | | | | | | | | | | | | | | | | |
| | 129,277 | | | 11.8 | | | | 94,214 | | | 9.2 | | | | 129,156 | | | 12.3 | | | | 137,484 | | | 13.9 | |
| | 35,748 | | | 3.3 | | | | 35,737 | | | 3.5 | | | | 31,265 | | | 3.0 | | | | 29,140 | | | 2.9 | |
| | | | | | | | | | | | | | | | | | | | | | | | | | | |
| | 93,529 | | | 8.5 | | | | 58,477 | | | 5.7 | | | | 97,891 | | | 9.3 | | | | 108,344 | | | 11.0 | |
| | 27,104 | | | 2.5 | | | | 14,282 | | | 1.4 | | | | 23,973 | | | 2.2 | | | | 26,912 | | | 2.8 | |
| | | | | | | | | | | | | | | | | | | | | | | | | | | |
| | $66,425 | | | 6.0 | % | | $ | 44,195 | | | 4.3 | % | | $ | 73,918 | | | 7.1 | % | | $ | 81,432 | | | 8.2 | % |
| | | | | | | | | | | | | | | | | | | | | | | | | | | |
| | | | | | | | | | | | | | | | | | | | | | | | | | |
| $ | 1.45 | | | | | | $ | 0.95 | | | | | | $ | 1.59 | | | | | | $ | 1.74 | | | | |
| $ | 1.44 | | | | | | $ | 0.94 | | | | | | $ | 1.58 | | | | | | $ | 1.73 | | | | |
| | | | | | | | | | | | | | | | | | | | | | | | | | |
| $ | 0.61 | | | | | | $ | 0.60 | | | | | | $ | 0.60 | | | | | | $ | 0.59 | | | | |
| | | | | | | | | | | | | | | | | | | | | | | | | | |
| | 45,900 | | | | | | | 46,746 | | | | | | | 46,562 | | | | | | | 46,741 | | | | |
| | 46,204 | | | | | | | 47,067 | | | | | | | 46,877 | | | | | | | 47,041 | | | | |
| $ | 15.12 | | | | | | $ | 13.43 | | | | | | $ | 13.99 | | | | | | $ | 12.42 | | | | |
| | 16.92-25.33 | | | | | | | 16.82-23.97 | | | | | | | 17.91-24.25 | | | | | | | 17.86-24.26 | | | | |
| | 24.60 | | | | | | | 17.90 | | | | | | | 23.99 | | | | | | | 19.77 | | | | |
| | 39,314 | | | | | | | 36,102 | | | | | | | 49,845 | | | | | | | 74,208 | | | | |
| | 41,658 | | | | | | | 43,502 | | | | | | | 43,900 | | | | | | | 40,385 | | | | |
| | 1,386 | | | | | | | 1,357 | | | | | | | 1,240 | | | | | | | 1,077 | | | | |
| | 1,454,067 | | | | | | | 1,398,273 | | | | | | | 1,488,578 | | | | | | | 1,453,528 | | | | |
| | 441,306 | | | | | | | 283,123 | | | | | | | 525,153 | | | | | | | 525,924 | | | | |
| | 532,532 | | | | | | | 553,682 | | | | | | | 615,196 | | | | | | | 654,657 | | | | |
| | 704,104 | | | | | | | 622,228 | | | | | | | 658,698 | | | | | | | 580,118 | | | | |
| | 9.9 | % | | | | | | 6.8 | % | | | | | | 12.2 | % | | | | | | 15.2 | % | | | |
| | 43.1 | % | | | | | | 47.1 | % | | | | | | 48.3 | % | | | | | | 53.0 | % | | | |
| | 3,582 | | | | | | | 3,518 | | | | | | | 3,728 | | | | | | | 3,845 | | | | |
49
| | | | |
Board of Directors Kenneth P. Manning, 66 Chairman and Chief Executive Officer Sensient Technologies Corporation Elected Director in 1989 (2, 6) Hank Brown, 68 President University of Colorado Elected Director in 2004 (1, 4, 5) Fergus M. Clydesdale, Ph.D., 71 Distinguished Professor and Head of the Department of Food Science University of Massachusetts – Amherst Elected Director in 1998 (2, 3, 4, 6) James A.D. Croft, 70 Chairman Bartlodge Limited Elected Director in 1997 (1, 2, 3, 6) William V. Hickey, 63 President and Chief Executive Officer Sealed Air Corporation Elected Director in 1997 (1, 2, 4, 5) Peter M. Salmon, 58 President International Food Network, Inc. Elected Director in 2005 (5, 6) Elaine R. Wedral, Ph.D., 63 Retired, President Nestle’s Research and Development Worldwide Food Service Systems Elected Director in 2006 (5, 6) Essie Whitelaw, 60 Senior Vice President of Private Sector Claims Administration Wisconsin Physician Services Elected Director in 1993 (3, 4) Committees 1 Audit Committee 2 Executive Committee 3 Compensation and Development Committee 4 Nominating and Corporate Governance Committee 5 Finance Committee 6 Scientific Advisory Committee | | Elected Officers Kenneth P. Manning, 66 Chairman and Chief Executive Officer With the Company 20 years Peter Bradley, 48 President, Color Group With the Company 5 years James J. Clarke, 58 Assistant Secretary and Assistant General Counsel With the Company 4 years John F. Collopy, 38 Vice President and Treasurer With the Company 8 years Neil G. Cracknell, 46 President, Flavors & Fragrances Group With the Company 13 years Robert J. Edmonds, 51 President and Chief Operating Officer With the Company 3 years John L. Hammond, 61 Vice President, Secretary and General Counsel With the Company 10 years Richard F. Hobbs, 60 Vice President and Chief Financial Officer With the Company 34 years Richard J. Malin, 41 Assistant Controller With the Company 16 years Douglas S. Pepper, 54 Vice President, Administration With the Company 2 years Stephen J. Rolfs, 43 Vice President, Controller and Chief Accounting Officer With the Company 10 years Appointed Officers Douglas L. Arnold, 44 Vice President, Administrative Services With the Company 10 years Gordon E. Hering, Ph.D., 51 Vice President, Marketing & Technology With the Company 14 years Jeffrey T. Makal, 44 Vice President, Taxation With the Company 11 years Robert L. Menzl, 51 Vice President, Information Technology With the Company 12 years Ralph G. Pickles, 61 Vice President, Special Assistant to Chairman With the Company 12 years Robert Wilkins, 51 President, Asia Pacific Group With the Company 4 years | | |
50
World Headquarters
777 East Wisconsin Avenue
Milwaukee, Wisconsin 53202-5304
(414) 271-6755
(800) 558-9892
Fax: (414) 347-4795
E-mail: corporate.communications@sensient-tech.com
Web site: www.sensient-tech.com
Transfer Agent and Registrar
Wells Fargo Bank Minnesota, N.A.
Shareowner Services
P. O. Box 64854
St. Paul, Minnesota 55164-0854
(800) 468-9716
Web site: www.wellsfargo.com/com/shareowner_services/
Common Stock
Sensient Technologies Corporation Common Stock is traded on the New York Stock Exchange. Ticker symbol: SXT.
There were 3,297 shareholders of record of Common Stock as of January 31, 2008.
Annual Meeting of Shareholders
The Annual Meeting of Shareholders will be held at 2:00 p.m. (CDT) on Thursday, April 24, 2008, at The Ritz-Carlton Chicago, 160 East Pearson Street, Chicago, Illinois.
Annual Report and Proxy Statement
The Company’s annual report and proxy statement are available online at www.sensient-tech.com/financial/ annualreport_and_proxy.htm.
Form 10-K
The Company’s annual report filed with the Securities and Exchange Commission on Form 10-K is available without charge from the Company’s Investor Relations Department and on its Web site at www.sensient-tech.com.
Dividends
Quarterly dividends are typically paid on the first business day of March, June, September and December.
Automatic Dividend Reinvestment Plan
The Sensient Technologies Corporation Dividend Reinvestment Plan provides shareholders with a convenient, economical way to increase their ownership of Sensient Technologies Corporation Common Stock. Through the plan, shareholders can automatically reinvest their dividends to acquire additional shares and make supplemental stock purchases without paying fees or commissions. An enrollment form and brochure describing the plan can be obtained by contacting the plan administrator, Wells Fargo Bank Minnesota at (800) 468-9716 or the Company’s Investor Relations Department at (414) 347-3779.
Investor Relations
Communications concerning the transfer of shares, lost certificates, duplicate mailings or change of address should be directed to the transfer agent.
Other shareholder information, such as news releases and information regarding corporate governance, is available on the Company’s Web site: www.sensient-tech.com. Shareholders can also register to receive notification via e-mail when new information is added to the site. The Company’s Web address is provided as an inactive textual reference only, and the contents of the Web site are not incorporated in or otherwise to be regarded as part of this annual report.
Other requests for information should be directed to the Company’s Investor Relations Department at (414) 347-3779.
The Company maintains a direct mailing list for news releases and quarterly reports. If you would like your name added to this list, please contact the Company’s Investor Relations Department.
In accordance with New York Stock Exchange rules and pursuant to Rule 13a-14 under the Securities and Exchange Act of 1934, Kenneth P. Manning, as the Company’s Chief Executive Officer, and Richard F. Hobbs, as the Company’s Chief Financial Officer, have certified the quality of the Company’s public disclosure in an exhibit to the Company’s Annual Report on Form 10-K for the year ended December 31, 2007. As Chief Executive Officer, in 2007 Kenneth P. Manning also has certified compliance with New York Stock Exchange corporate governance listing standards.