
Resource Center: 1-800-732-6643
Exhibit 99.1
Contact: Pete Bakel
202-752-2034
Date: May 9, 2013
Fannie Mae Reports Pre-Tax Income of $8.1 Billion for First Quarter 2013
Release of Valuation Allowance on Deferred Tax Assets
Adds $50.6 Billion to Quarterly Net Income
Company Reported Net Income of $58.7 Billion for the First Quarter of 2013
| • | Strong credit results and increased revenue resulted in pre-tax income of $8.1 billion for the first quarter, the largest quarterly pre-tax income in the company’s history. |
| • | Improvement in Fannie Mae’s financial results, the strong credit profile of the company’s new book of business, and other factors enabled the company to release $50.6 billion valuation allowance on deferred tax assets. |
| • | Based on net worth of $62.4 billion at March 31, 2013, the company’s dividend obligation to Treasury will be $59.4 billion by June 30, 2013. After the June payment, we will have paid an aggregate of $95.0 billion in cash dividends to Treasury since conservatorship began. Senior preferred stock outstanding and held by Treasury remained $117.1 billion at March 31, 2013, as dividend payments do not offset prior Treasury draws. |
| • | Fannie Mae has funded the mortgage market with approximately $3.5 trillion in liquidity since 2009, enabling families to buy, refinance, or rent a home. |
WASHINGTON, DC - Fannie Mae (FNMA/OTC) reported pre-tax income of $8.1 billion for the first quarter of 2013, compared with pre-tax income of $2.7 billion in the first quarter of 2012 and pre-tax income of $7.6 billion in the fourth quarter of 2012. Fannie Mae’s pre-tax income for the first quarter of 2013 was the largest quarterly pre-tax income in the company’s history. The improvement in the company’s results in the first quarter of 2013 compared with the first quarter of 2012 was due primarily to strong credit results driven by an increase in home prices, including higher average sales prices on Fannie Mae-owned properties, a decline in the number of delinquent loans, and the company’s resolution agreement with Bank of America. Including Fannie Mae’s release of the valuation allowance on its deferred tax assets, the company reported quarterly net income of $58.7 billion for the first quarter of 2013. Fannie Mae reported comprehensive income of $59.3 billion in the first quarter of 2013, compared with comprehensive income of $3.1 billion for the first quarter of 2012.
As a result of actions to strengthen its financial performance and continued improvement in the housing market, Fannie Mae’s financial results have improved significantly over the past five quarters. Based on analysis of all relevant factors, Fannie Mae determined that the release of the valuation allowance on its deferred tax assets was appropriate under generally accepted accounting principles (“GAAP”), which resulted in a benefit for federal income taxes of $50.6 billion. The release of the valuation allowance in

| First Quarter 2013 Results | 1 | |
addition to operating income and comprehensive income for the first quarter of 2013 will result in a dividend payment to taxpayers of $59.4 billion in the second quarter of 2013.
DEFERRED TAX ASSET VALUATION ALLOWANCE
Each quarter, Fannie Mae evaluates the recoverability of its deferred tax assets, weighing a complex set of factors. The company is required to establish or maintain a valuation allowance for these assets if it determines that it is more likely than not that some or all of the deferred tax assets will not be realized. Fannie Mae established a valuation allowance against its deferred tax assets in 2008.
After evaluating the recoverability of Fannie Mae’s deferred tax assets, as of March 31, 2013, the company determined that the factors in favor of releasing the allowance outweighed the factors in favor of maintaining it under GAAP. Therefore, Fannie Mae released its valuation allowance as of March 31, 2013, except for amounts that will be released against income before federal income taxes for the remainder of the year.
The release of the valuation allowance resulted in the recognition of $50.6 billion as a benefit for federal income taxes. The company reported net income of $58.7 billion for the first quarter of 2013, which includes the impact of the release of the deferred tax asset valuation allowance and quarterly pre-tax income of $8.1 billion. Fannie Mae will pay Treasury $59.4 billion in dividends in the second quarter of 2013, which reflects the company’s net worth as of March 31, 2013 less the $3.0 billion capital reserve applicable in 2013 under the terms of the senior preferred stock purchase agreement. The company expects to remain profitable for the foreseeable future. As of June 30, 2013, Fannie Mae will have paid $95 billion in dividends to Treasury under the senior preferred stock purchase agreement. Senior preferred stock outstanding and held by Treasury remained $117.1 billion as of March 31, 2013, as dividend payments do not offset prior Treasury draws.
The release of the valuation allowance on the company’s deferred tax assets does not include $491 million related to the valuation allowance that pertains to our capital loss carryforwards, which the company believes will expire unused. The company expects that the remaining valuation allowance not related to capital loss carryforwards will be reduced against income before federal income taxes throughout the remaining quarters of 2013 until that amount is reduced to zero as of December 31, 2013. The timing of the reduction of this remaining valuation allowance will be determined by the timing of the company’s estimated income for 2013. Income before federal income taxes recorded for the remainder of 2013 may be greater or less than our current estimate. If income before federal income taxes recorded for the remainder of 2013 is greater than the company’s current estimate, the company will recognize a provision for federal income taxes in subsequent periods of 2013. Conversely, if income before federal income taxes recorded for the remainder of 2013 is lower than the company’s current estimate, the company will recognize an additional benefit for income taxes in subsequent periods of 2013. Starting in 2014, Fannie Mae expects that its effective tax rate will approach the statutory tax rate.
For information on the release of the deferred tax asset valuation allowance, please refer to the company’s quarterly report on Form 10-Q for the quarter ended March 31, 2013 (“First Quarter 2013 Form 10-Q”).
| First Quarter 2013 Results | 2 | |
RESOLUTION AGREEMENT WITH BANK OF AMERICA
Fannie Mae’s pre-tax income for the first quarter of 2013 was impacted by its resolution agreement with Bank of America related to repurchase requests. This agreement led to the recognition of approximately $800 million in pre-tax income for the first quarter of 2013. In addition, the company expects to recognize pre-tax income in future periods relating to a separate resolution agreement with Bank of America on compensatory fees.
Repurchase Request Resolution Agreement: On January 6, 2013, Fannie Mae entered into a resolution agreement with affiliates of Bank of America Corporation to resolve certain repurchase requests arising from breaches of selling representations and warranties. The resolution agreement resolved the company’s outstanding and expected future repurchase requests arising from breaches of selling representations and warranties on specified single-family loans delivered to Fannie Mae by Bank of America and Countrywide that were originated between January 1, 2000 and December 31, 2008. The resolution agreement included, among other things, the following components:
| • | Bank of America made a cash payment to Fannie Mae of $3.6 billion in January 2013 related to repurchase requests; |
| • | Bank of America repurchased approximately 29,500 loans from Fannie Mae in January 2013 for an aggregate repurchase price of $6.6 billion, subject to a reconciliation process; and |
| • | Bank of America made an initial cash payment of $518 million in January 2013 related to mortgage insurance claims. |
The resolution agreement addressed $11.3 billion of unpaid principal balance, or 97 percent, of Fannie Mae’s outstanding repurchase requests made to Bank of America as of December 31, 2012. Accordingly, the amount of Fannie Mae’s outstanding repurchase requests to Bank of America decreased substantially in the first quarter of 2013 to 10 percent of the company’s total repurchase requests outstanding as of March 31, 2013, compared with 73 percent of Fannie Mae’s total repurchase requests outstanding as of December 31, 2012.
For information on the resolution agreement with Bank of America, please refer to the company’s annual report on Form 10-K for the year ended December 31, 2012.
ABOUT FANNIE MAE’S CONSERVATORSHIP
Fannie Mae has operated under the conservatorship of the Federal Housing Finance Agency (“FHFA”) since September 6, 2008. Fannie Mae has not received funds from Treasury since the first quarter of 2012. The funding the company has received under the senior preferred stock purchase agreement with the U.S. Treasury has provided the company with the capital and liquidity needed to maintain its ability to fulfill its mission of providing liquidity and support to the nation’s housing finance markets and to avoid a trigger of mandatory receivership under the Federal Housing Finance Regulatory Reform Act of 2008. For periods through March 31, 2013, Fannie Mae has requested cumulative draws totaling $116.1 billion. Under the senior preferred stock purchase agreement, the payment of dividends cannot be used to offset prior Treasury draws. Accordingly, while Fannie Mae has paid $35.6 billion in dividends to Treasury through March 31, 2013, Treasury still maintains a liquidation preference of $117.1 billion on the company’s senior preferred stock.
In August 2012, the terms governing the company’s dividend obligations on the senior preferred stock were amended. The amended senior preferred stock purchase agreement does not allow the company to
| First Quarter 2013 Results | 3 | |
build a capital reserve. Beginning in 2013, the required senior preferred stock dividends each quarter equal the amount, if any, by which the company’s net worth as of the end of the preceding quarter exceeds an applicable capital reserve amount. The applicable capital reserve amount is $3.0 billion for each quarter of 2013 and will be reduced by $600 million annually until it reaches zero in 2018.
The amount of remaining funding available to Fannie Mae under the senior preferred stock purchase agreement with Treasury is currently $117.6 billion.
Fannie Mae is not permitted to redeem the senior preferred stock prior to the termination of Treasury’s funding commitment under the senior preferred stock purchase agreement. The limited circumstances under which Treasury’s funding commitment will terminate are described in “Business—Conservatorship and Treasury Agreements” in the company’s annual report on Form 10-K for the year ended December 31, 2012.
PROVIDING LIQUIDITY AND SUPPORT TO THE MARKET
Fannie Mae provided approximately $3.5 trillion in liquidity to the mortgage market from January 1, 2009 through March 31, 2013 through its purchases and guarantees of loans, which enabled borrowers to complete 10.6 million mortgage refinancings and 2.9 million home purchases, and provided financing for 1.8 million units of multifamily housing.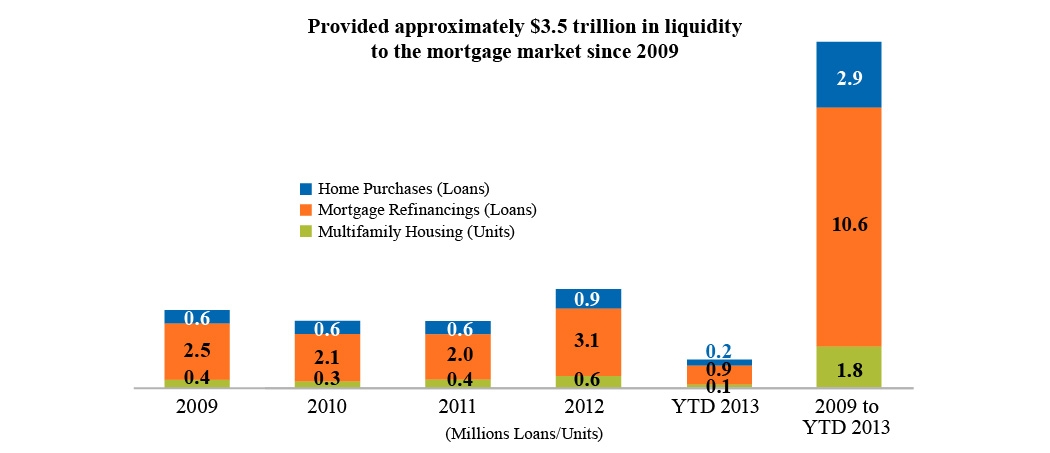
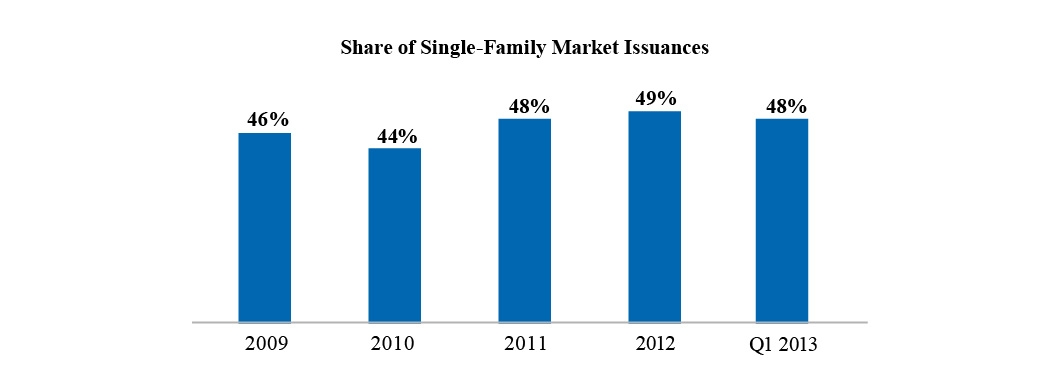
The company remained the largest single issuer of single-family mortgage-related securities in the secondary market in the first quarter of 2013, with an estimated market share of new single-family mortgage-related securities issuances of 48 percent, compared with 48 percent in the fourth quarter of 2012 and 51 percent in the first quarter of 2012.
| First Quarter 2013 Results | 4 | |
Fannie Mae also remained a constant source of liquidity in the multifamily market. As of December 31, 2012 (the latest date for which information is available), the company owned or guaranteed approximately 22 percent of the total outstanding debt on multifamily properties.
HELPING TO BUILD A NEW HOUSING FINANCE SYSTEM
In addition to continuing to provide liquidity and support to the mortgage market, Fannie Mae has devoted significant resources toward helping to build a new housing finance system for the future, primarily through pursuing the strategic goals identified by its conservator, FHFA. These strategic goals are: build a new infrastructure for the secondary mortgage market; gradually contract the company’s dominant presence in the marketplace while simplifying and shrinking its operations; and maintain foreclosure prevention activities and credit availability for new and refinanced mortgages.
CREDIT QUALITY
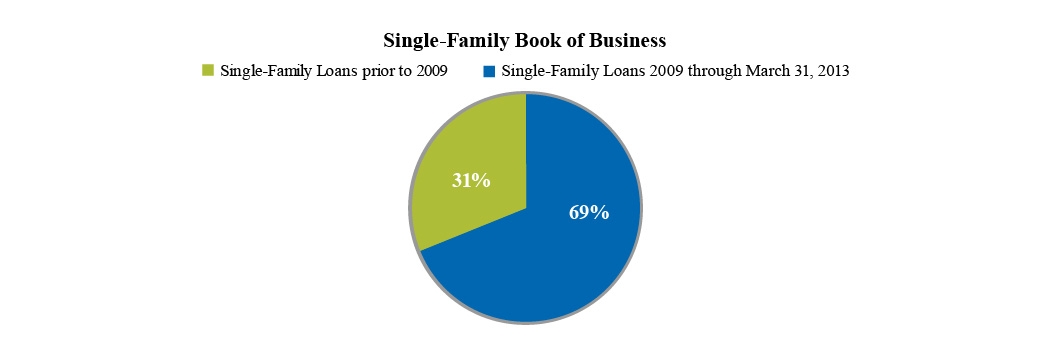
New Single-Family Book of Business: While making it possible for families to purchase, refinance, or rent a home, Fannie Mae is setting responsible credit standards to protect homeowners as well as taxpayers. Since 2009, Fannie Mae has seen the effect of the actions it took, beginning in 2008, to significantly strengthen its underwriting and eligibility standards and change its pricing to promote sustainable homeownership and stability in the housing market. As of March 31, 2013, 69 percent of Fannie Mae’s single-family guaranty book of business consisted of loans it had purchased or guaranteed since the beginning of 2009. While Fannie Mae does not yet know how the single-family loans the company has acquired since January 1, 2009 will ultimately perform, given their strong credit risk profile and based on their performance so far, the company expects that these loans, in the aggregate, will be profitable over their lifetime, meaning the company’s fee income on these loans will exceed the company’s credit losses and administrative costs for them.
| First Quarter 2013 Results | 5 | |
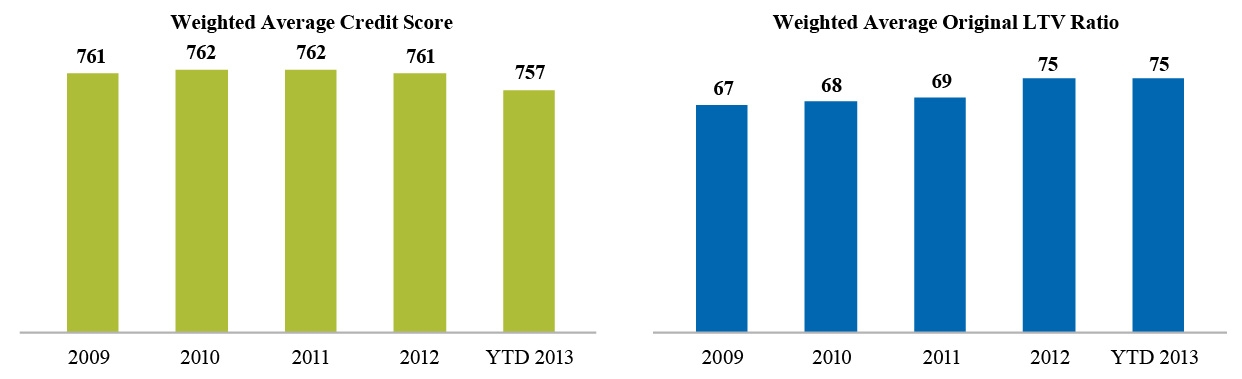
Single-family conventional loans acquired by Fannie Mae during the first quarter of 2013 had a weighted average borrower FICO credit score at origination of 757 and an average original loan-to-value (“LTV”) ratio of 75 percent. The average original LTV ratio for the company’s acquisitions increased for the full year of 2012 and for the first quarter of 2013 as compared to the applicable prior year period because the company acquired more loans with higher LTV ratios in these periods than in the prior periods as changes to the Home Affordable Refinance Program (“HARP”) were implemented.
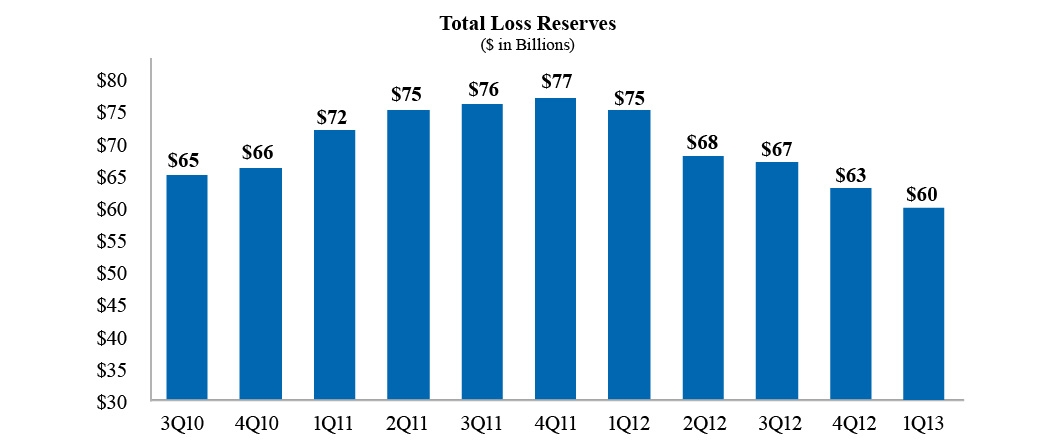
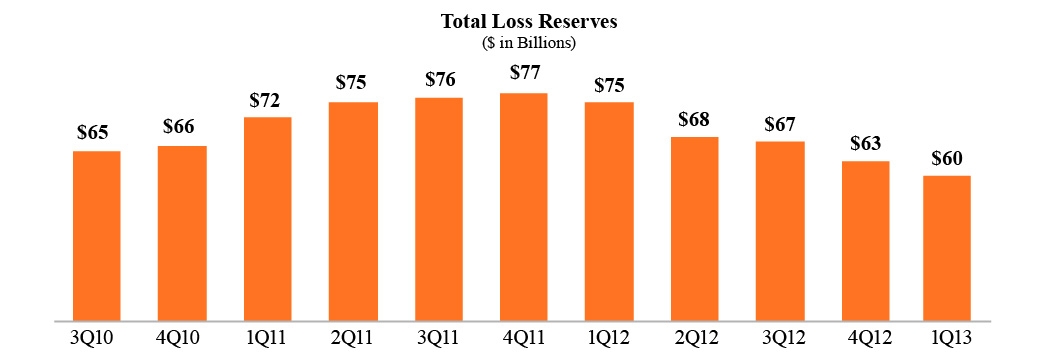
Loss Reserves: The company’s total loss reserves decreased to $60.2 billion as of March 31, 2013 from $62.6 billion as of December 31, 2012. The company’s total loss reserves peaked at $76.9 billion as of December 31, 2011.
| First Quarter 2013 Results | 6 | |
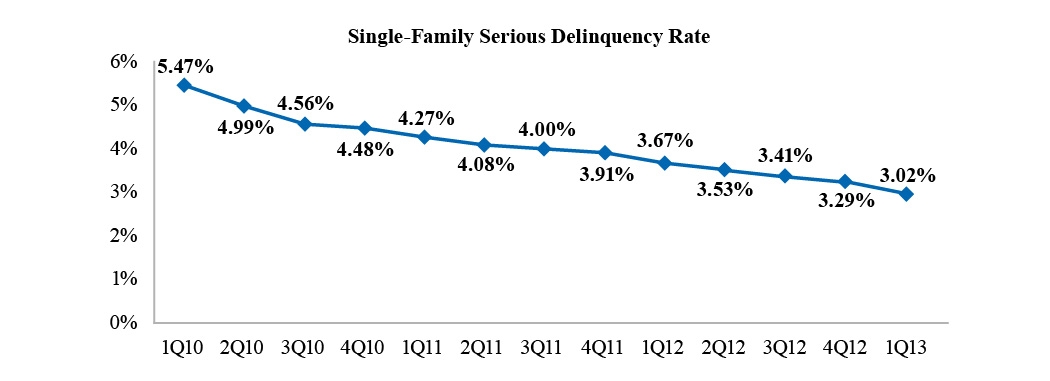
Fannie Mae’s single-family serious delinquency rate has declined each quarter since the first quarter of 2010, and was 3.02 percent as of March 31, 2013, compared with 5.47 percent as of March 31, 2010. This decrease is primarily the result of home retention solutions, foreclosure alternatives, and completed foreclosures, as well as the company’s acquisition of loans with stronger credit profiles since the beginning of 2009.
HOME RETENTION SOLUTIONS AND FORECLOSURE ALTERNATIVES
To reduce the credit losses Fannie Mae ultimately incurs on its legacy book of business, the company has been focusing its efforts on several strategies, including reducing defaults by offering home retention solutions, such as loan modifications. Fannie Mae completed more than 43,000 loan modifications during the first quarter of 2013, bringing the total number of loan modifications the company has completed since January 1, 2009 to approximately 922,000.
Fannie Mae views foreclosure as a last resort. For homeowners and communities in need, the company offers alternatives to foreclosure. These solutions have enabled 1.3 million homeowners to avoid
| First Quarter 2013 Results | 7 | |
foreclosure since 2009. In dealing with homeowners in distress, the company first seeks home retention solutions, which enable borrowers to stay in their homes, before turning to foreclosure alternatives. When there is no viable home retention solution or foreclosure alternative that can be applied, the company seeks to move to foreclosure expeditiously in an effort to minimize prolonged delinquencies that can hurt local home values and destabilize communities.

| For the Three Months Ended | For the Year Ended December 31 | ||||||||||||||||||||||||||||
| March 31, 2013 | 2012 | 2011 | 2010 | ||||||||||||||||||||||||||
| Unpaid Principal Balance | Number of Loans | Unpaid Principal Balance | Number of Loans | Unpaid Principal Balance | Number of Loans | Unpaid Principal Balance | Number of Loans | ||||||||||||||||||||||
| (Dollars in millions) | |||||||||||||||||||||||||||||
| Home retention strategies: | |||||||||||||||||||||||||||||
| Modifications | $ | 7,917 | 43,153 | $ | 30,640 | 163,412 | $ | 42,793 | 213,340 | $ | 82,826 | 403,506 | |||||||||||||||||
| Repayment plans and forbearances completed | 575 | 4,482 | 3,298 | 23,329 | 5,042 | 35,318 | 4,385 | 31,579 | |||||||||||||||||||||
| HomeSaver Advance first-lien loans | — | — | — | — | — | — | 688 | 5,191 | |||||||||||||||||||||
| Total home retention strategies | 8,492 | 47,635 | 33,938 | 186,741 | 47,835 | 248,658 | 87,899 | 440,276 | |||||||||||||||||||||
| Foreclosure alternatives: | |||||||||||||||||||||||||||||
| Short sales | 2,593 | 12,139 | 15,916 | 73,528 | 15,412 | 70,275 | 15,899 | 69,634 | |||||||||||||||||||||
| Deeds-in-lieu of foreclosure | 660 | 3,987 | 2,590 | 15,204 | 1,679 | 9,558 | 1,053 | 5,757 | |||||||||||||||||||||
| Total foreclosure alternatives | 3,253 | 16,126 | 18,506 | 88,732 | 17,091 | 79,833 | 16,952 | — | 75,391 | ||||||||||||||||||||
| Total loan workouts | $ | 11,745 | 63,761 | $ | 52,444 | 275,473 | $ | 64,926 | 328,491 | $ | 104,851 | 515,667 | |||||||||||||||||
| Loan workouts as a percentage of single-family guaranty book of business | 1.66 | % | 1.46 | % | 1.85 | % | 1.57 | % | 2.29 | % | 1.85 | % | 3.66 | % | 2.87 | % | |||||||||||||
REFINANCING INITIATIVES
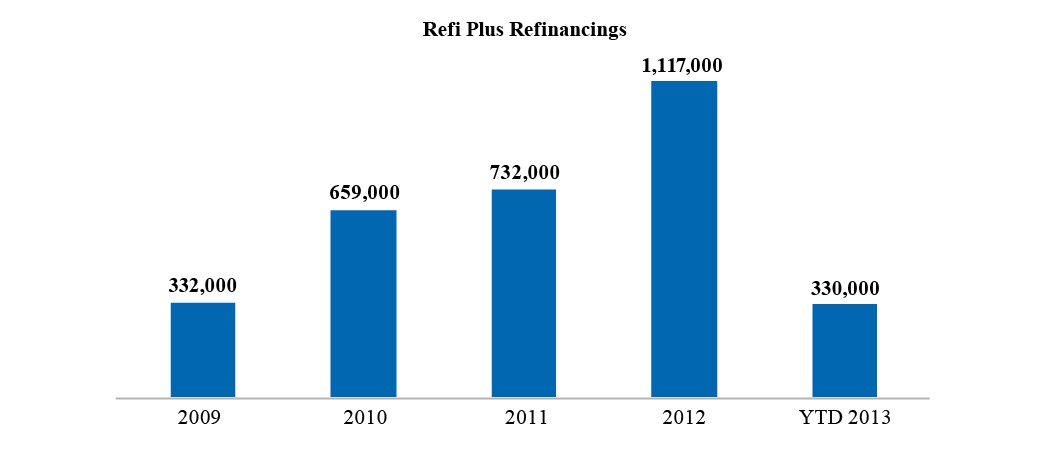
Through the company’s Refi Plus™ initiative, which offers refinancing flexibility to eligible Fannie Mae borrowers and includes HARP, the company acquired approximately 330,000 loans in the first quarter of 2013. Some borrowers’ monthly payments increased as they took advantage of the ability to refinance through Refi Plus to reduce the term of their loan, to switch from an adjustable-rate mortgage to a fixed-rate mortgage, or to switch from an interest-only mortgage to a fully amortizing mortgage. Even taking these into account, refinancings delivered to Fannie Mae through Refi Plus in the first quarter of 2013 reduced borrowers’ monthly mortgage payments by an average of $246.
| First Quarter 2013 Results | 8 | |
FORECLOSURES AND REO
Fannie Mae acquired 38,717 single-family REO properties, primarily through foreclosure, in the first quarter of 2013, compared with 41,112 in the fourth quarter of 2012. As of March 31, 2013, the company’s inventory of single-family REO properties was 101,449, compared with 105,666 as of December 31, 2012. The carrying value of the company’s single-family REO was $9.3 billion as of March 31, 2013.
The company’s single-family foreclosure rate was 0.89 percent for the first quarter of 2013. This reflects the annualized total number of single-family properties acquired through foreclosure or deeds-in-lieu of foreclosure as a percentage of the total number of loans in Fannie Mae’s single-family guaranty book of business.

| For the Three Months Ended March 31, | |||||||||
| 2013 | 2012 | ||||||||
| Single-family foreclosed properties (number of properties): | |||||||||
| Beginning of period inventory of single-family foreclosed properties (REO) | 105,666 | 118,528 | |||||||
| Total properties acquired through foreclosure | 38,717 | 47,700 | |||||||
| Dispositions of REO | (42,934 | ) | (52,071 | ) | |||||
| End of period inventory of single-family foreclosed properties (REO) | 101,449 | 114,157 | |||||||
| Carrying value of single-family foreclosed properties (dollars in millions) | $ | 9,263 | $ | 9,721 | |||||
| Single-family foreclosure rate | 0.89 | % | 1.07 | % | |||||
Fannie Mae’s financial data for the first quarter of 2013 are available in the accompanying Appendix; however, investors and interested parties should read the company’s First Quarter 2013 Form 10-Q, which was filed today with the Securities and Exchange Commission and is available on Fannie Mae’s Web site, www.fanniemae.com. The company provides further discussion of its financial results and condition,
| First Quarter 2013 Results | 9 | |
credit performance, fair value balance sheets, and other matters in its First Quarter 2013 Form 10-Q. Additional information about the company’s credit performance, the characteristics of its guaranty book of business, its foreclosure-prevention efforts, and other measures is contained in the “2013 First Quarter Credit Supplement” at www.fanniemae.com.
# # #
In this release and the accompanying Appendix, the company has presented a number of estimates, forecasts, expectations, and other forward-looking statements regarding the company’s future financial results, including its profitability; the company’s future loss reserves; the profitability of its loans; its future dividend payments to Treasury; the timing of the release of the company’s remaining valuation allowance on its deferred tax assets not related to capital loss carryforwards; the company’s inability to use its capital loss carryforwards before they expire; the company’s future effective tax rate; the company’s recognition of income in future periods relating to the Bank of America resolution agreement on compensatory fees; the impact of the company’s actions to reduce credit losses; and the future fair value of the company’s trading securities and derivatives. These estimates, forecasts, expectations, and statements are forward looking statements based on the company’s current assumptions regarding numerous factors, including future home prices and the future performance of its loans. Actual results, and future projections, could be materially different from what is set forth in the forward-looking statements as a result of home price changes, interest rate changes, unemployment rates, other macroeconomic and housing market variables, government policy, credit availability, borrower behavior, including increases in the number of underwater borrowers who strategically default on their mortgage loan, the volume of loans it modifies, the nature, volume and effectiveness of its loss mitigation strategies and activities, management of its real estate owned inventory and pursuit of contractual remedies, changes in the fair value of its assets and liabilities, impairments of its assets, future legislative or regulatory requirements that have a significant impact on the company’s business such as a requirement that the company implement a principal forgiveness program, future updates to the company’s models relating to loss reserves, including the assumptions used by these models, changes in generally accepted accounting principles, changes to the company’s accounting policies, failures by its mortgage seller-servicers to fulfill their repurchase obligations to it, effects from activities the company takes to support the mortgage market and help borrowers, the conservatorship and its effect on the company’s business, the investment by Treasury and its effect on the company’s business, the uncertainty of our future, our future guaranty fee pricing, challenges we face in retaining and hiring qualified employees, the deteriorated credit performance of many loans in our guaranty book of business, a decrease in our credit ratings, defaults by one or more institutional counterparties, operational control weaknesses, changes in the structure and regulation of the financial services industry, limitations on the company’s ability to access the debt markets, disruptions in the housing, credit, and stock markets, government investigations and litigation, the performance of the company’s servicers, conditions in the foreclosure environment, natural or other disasters, and many other factors, including those discussed in the “Risk Factors” section of and elsewhere in the company’s annual report on Form 10-K for the year ended December 31, 2012 and the company’s quarterly report on Form 10-Q for the quarter ended March 31, 2013, and elsewhere in this release.
Fannie Mae provides Web site addresses in its news releases solely for readers’ information. Other content or information appearing on these Web sites is not part of this release.
Fannie Mae enables people to buy, refinance, or rent a home.
Visit us at www.fanniemae.com/progress
Follow us on Twitter: http://twitter.com/FannieMae
| First Quarter 2013 Results | 10 | |
APPENDIX
SUMMARY OF FIRST QUARTER 2013 RESULTS
Fannie Mae reported pre-tax income of $8.1 billion and net income of $58.7 billion for the first quarter of 2013, compared with net income of $7.6 billion for the fourth quarter of 2012 and $2.7 billion for the first quarter of 2012.

| (Dollars in millions) | 1Q13 | 4Q12 | Variance | 1Q13 | 1Q12 | Variance | ||||||||||||||||||
| Net interest income | $ | 6,304 | $ | 5,559 | $ | 745 | $ | 6,304 | $ | 5,197 | $ | 1,107 | ||||||||||||
| Fee and other income | 568 | 339 | 229 | 568 | 375 | 193 | ||||||||||||||||||
| Net revenues | 6,872 | 5,898 | 974 | $ | 6,872 | 5,572 | 1,300 | |||||||||||||||||
| Investment gains, net | 118 | 106 | 12 | 118 | 116 | 2 | ||||||||||||||||||
| Fair value gains, net | 834 | 209 | 625 | 834 | 283 | 551 | ||||||||||||||||||
| Administrative expenses | (641 | ) | (648 | ) | 7 | (641 | ) | (564 | ) | (77 | ) | |||||||||||||
| Credit-related income (expenses) | ||||||||||||||||||||||||
| Benefit (provision) for credit losses | 957 | 1,890 | (933 | ) | 957 | (2,000 | ) | 2,957 | ||||||||||||||||
| Foreclosed property income (expense) | 260 | 475 | (215 | ) | 260 | (339 | ) | 599 | ||||||||||||||||
| Total credit-related income (expenses) | 1,217 | 2,365 | (1,148 | ) | 1,217 | (2,339 | ) | 3,556 | ||||||||||||||||
Other non-interest expenses(1) | (286 | ) | (360 | ) | 74 | (286 | ) | (350 | ) | 64 | ||||||||||||||
| Net gains (losses) and income (expenses) | 1,242 | 1,672 | (430 | ) | 1,242 | (2,854 | ) | 4,096 | ||||||||||||||||
| Income before federal income taxes | 8,114 | 7,570 | 544 | 8,114 | 2,718 | 5,396 | ||||||||||||||||||
| Benefit for federal income taxes | 50,571 | — | 50,571 | 50,571 | — | 50,571 | ||||||||||||||||||
| Net income | 58,685 | 7,570 | 51,115 | 58,685 | 2,718 | 55,967 | ||||||||||||||||||
| Less: Net loss attributable to noncontrolling interest | — | — | — | — | 1 | (1 | ) | |||||||||||||||||
| Net income attributable to Fannie Mae | $ | 58,685 | $ | 7,570 | $ | 51,115 | $ | 58,685 | $ | 2,719 | $ | 55,966 | ||||||||||||
| Total comprehensive income attributable to Fannie Mae | $ | 59,339 | $ | 7,753 | $ | 51,586 | $ | 59,339 | $ | 3,081 | $ | 56,258 | ||||||||||||
| Preferred stock dividends | $ | (4,224 | ) | $ | (2,928 | ) | $ | (1,296 | ) | $ | (4,224 | ) | $ | (2,817 | ) | $ | (1,407 | ) | ||||||
(1) Consists of net other-than-temporary impairments, debt extinguishment losses, net and other expenses.
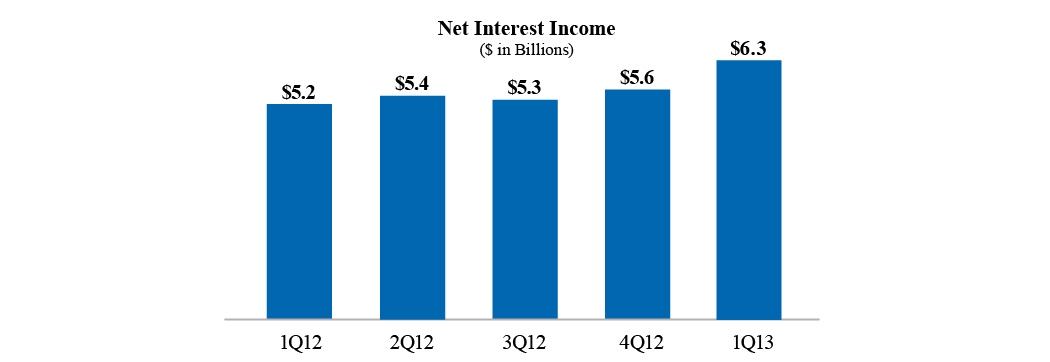
Net revenues were $6.9 billion for the first quarter of 2013, compared with $5.9 billion for the fourth quarter of 2012. Net interest income was $6.3 billion, compared with $5.6 billion for the fourth quarter of 2012. The increase in net interest income compared with the fourth quarter of 2012 was driven by the recognition of $518 million of unamortized cost basis adjustments related to loans repurchased by Bank of America under the January 6, 2013 resolution agreement. In addition, net interest income increased due to increased income on guaranty fees and accelerated amortization income driven by the high volume of prepayments. The increase was partially offset by lower net interest income from portfolio assets due to a decline in the company’s retained portfolio.
| First Quarter 2013 Results | 11 | |
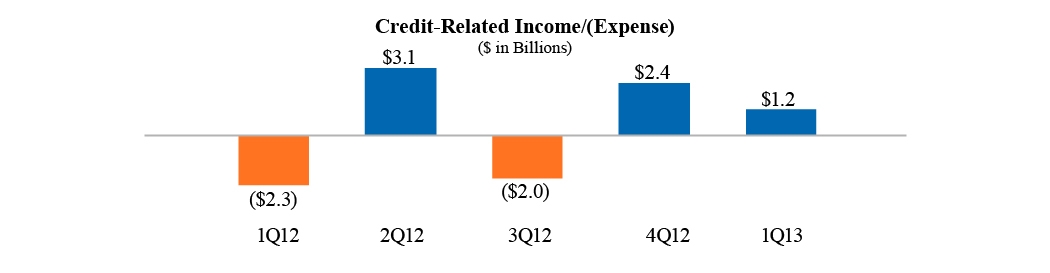
Credit-related income, which consists of recognition of a benefit for credit losses and foreclosed property income, was $1.2 billion in the first quarter of 2013, compared with $2.4 billion in credit-related income in the fourth quarter of 2012. The company recorded credit-related income in the first quarter of 2013 and full year of 2012 due largely to an increase in home prices.
Credit losses, which the company defines as net charge-offs plus foreclosed property expense, excluding the effect of certain fair-value losses, were $1.5 billion in the first quarter of 2013, compared with $2.2 billion in the fourth quarter of 2012. Credit losses were down in the first quarter of 2013 compared with the fourth quarter of 2012 due primarily to improved sales prices on Fannie Mae-owned properties, a decrease in volume of foreclosure and short sale activity, and the resolution agreement with Bank of America, which contributed to an increase in the amount of recoveries on previously charged-off loans.

| First Quarter 2013 Results | 12 | |
Total loss reserves, which reflect the company’s estimate of the probable losses the company has incurred in its guaranty book of business, including concessions it granted borrowers upon modification of their loans, were $60.2 billion as of March 31, 2013, compared with $62.6 billion as of December 31, 2012. The total loss reserve coverage to total nonperforming loans was 25 percent as of March 31, 2013 and as of December 31, 2012.
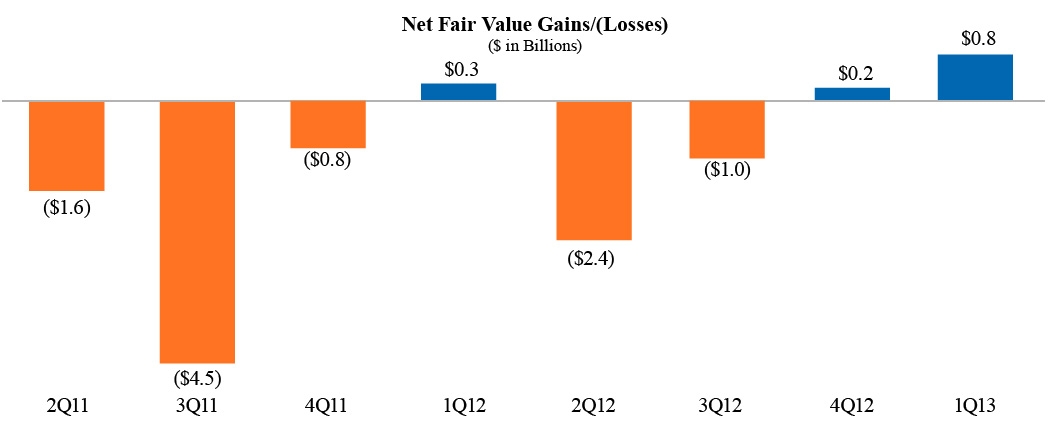
Net fair value gains were $834 million in the first quarter of 2013, compared with $209 million in the fourth quarter of 2012. The company recorded fair value gains in the first quarter of 2013 due to derivative gains because interest rates increased in the first quarter of 2013 and due to fair value gains on our trading securities due to improved prices on our private-label securities. The estimated fair value of the company’s trading securities and derivatives may fluctuate substantially from period to period because of changes in interest rates, credit spreads, and interest rate volatility, as well as activity related to these financial instruments.
| First Quarter 2013 Results | 13 | |
BUSINESS SEGMENT RESULTS
The business groups running Fannie Mae’s three reporting segments – its Single-Family business, its Multifamily business, and its Capital Markets group – engage in complementary business activities in pursuing the company’s mission of providing liquidity, stability, and affordability to the U.S. housing market. The company’s Single-Family and Multifamily businesses work with Fannie Mae’s lender customers, who deliver mortgage loans that the company purchases and securitizes into Fannie Mae MBS. The Capital Markets group manages the company’s investment activity in mortgage-related assets and other interest-earning non-mortgage investments, funding investments in mortgage-related assets primarily with proceeds received from the issuance of Fannie Mae debt securities in the domestic and international capital markets. The Capital Markets group also provides liquidity to the mortgage market through short-term financing and other activities.
Single-Family business had net income of $34.9 billion in the first quarter of 2013, compared with $4.0 billion in the fourth quarter of 2012. The increase in net income in the first quarter of 2013 compared with the fourth quarter of 2012 was due primarily to the release of the company’s valuation allowance against its deferred tax assets. Single-family business had pre-tax income of $3.3 billion, compared with $4.0 billion in the fourth quarter of 2012. The decrease in pre-tax income in the first quarter of 2013 compared with the fourth quarter of 2012 was due primarily to lower credit-related income. The Single-Family guaranty book of business was $2.84 trillion as of March 31, 2013, compared with $2.83 trillion as of December 31, 2012. Single-Family guaranty fee income was $2.4 billion in the first quarter of 2013 and $2.3 billion in the fourth quarter of 2012.
Multifamily had net income of $8.5 billion in the first quarter of 2013, compared with $447 million in the fourth quarter of 2012. The increase in net income in the first quarter of 2013 compared with the fourth quarter of 2012 was due primarily to the release of the company’s valuation allowance against its deferred tax assets. Multifamily had pre-tax income of $511 million, compared with $447 million in the fourth quarter of 2012. The increase in pre-tax income in the first quarter of 2013 compared with the fourth quarter of 2012 was due primarily to improvement in credit-related income. The Multifamily guaranty book of business was $205.4 billion as of March 31, 2013, compared with $206.2 billion as of December 31, 2012. Multifamily recorded credit-related income of $183 million in the first quarter of 2013, compared with credit-related expense of $54 million in the fourth quarter of 2012. Multifamily guaranty fee income was $291 million for the first quarter of 2013 and $280 million for the fourth quarter of 2012.
Capital Markets group had net income of $15.9 billion in the first quarter of 2013, compared with $4.3 billion in the fourth quarter of 2012. The increase in net income in the first quarter of 2013 compared with the fourth quarter of 2012 was due primarily to the release of the company’s valuation allowance against its deferred tax assets. Capital Markets had pre-tax income of $4.9 billion, compared with $4.3 billion in the fourth quarter of 2012. The increase in pre-tax income in the first quarter of 2013 compared with the fourth quarter of 2012 was due primarily to an increase in fair value gains. Capital Markets’ net interest income for the first quarter of 2013 was $2.7 billion, compared with $3.0 billion for the fourth quarter of 2012. Fair value gains for the first quarter of 2013 were $875 million, compared with $211 million in the fourth quarter of 2012. The Capital Markets retained mortgage portfolio balance decreased to $597.8 billion as of March 31, 2013, compared with $633.1 billion as of December 31, 2012, resulting from purchases of $81.7 billion, liquidations of $41.8 billion, and sales of $75.2 billion during the quarter.
| First Quarter 2013 Results | 14 | |

| (Dollars in millions) | 1Q13 | 4Q12 | Variance | 1Q13 | 1Q12 | Variance | ||||||||||||||||||
| Single-Family Segment: | ||||||||||||||||||||||||
| Guaranty fee income | $ | 2,375 | $ | 2,256 | $ | 119 | $ | 2,375 | $ | 1,911 | $ | 464 | ||||||||||||
| Credit-related income (expenses) | 1,034 | 2,419 | (1,385 | ) | 1,034 | (2,385 | ) | 3,419 | ||||||||||||||||
| Other | (88 | ) | (649 | ) | 561 | (88 | ) | (794 | ) | 706 | ||||||||||||||
| Income (loss) before federal income taxes | 3,321 | 4,026 | (705 | ) | 3,321 | (1,268 | ) | 4,589 | ||||||||||||||||
| Benefit for federal income taxes | 31,578 | — | 31,578 | 31,578 | — | 31,578 | ||||||||||||||||||
| Net income (loss) | $ | 34,899 | $ | 4,026 | $ | 30,873 | $ | 34,899 | $ | (1,268 | ) | $ | 36,167 | |||||||||||
| Multifamily Segment: | ||||||||||||||||||||||||
| Guaranty fee income | $ | 291 | $ | 280 | $ | 11 | $ | 291 | $ | 243 | $ | 48 | ||||||||||||
| Credit-related income (expenses) | 183 | (54 | ) | 237 | 183 | 46 | 137 | |||||||||||||||||
| Other | 37 | 221 | (184 | ) | 37 | (10 | ) | 47 | ||||||||||||||||
| Income before federal income taxes | 511 | 447 | 64 | 511 | 279 | 232 | ||||||||||||||||||
| Benefit for federal income taxes | 7,988 | — | 7,988 | 7,988 | — | 7,988 | ||||||||||||||||||
| Net income | $ | 8,499 | $ | 447 | $ | 8,052 | $ | 8,499 | $ | 279 | $ | 8,220 | ||||||||||||
| Capital Markets Segment: | ||||||||||||||||||||||||
| Net interest income | $ | 2,742 | $ | 3,010 | $ | (268 | ) | $ | 2,742 | $ | 3,541 | $ | (799 | ) | ||||||||||
| Investment gains, net | 1,349 | 1,551 | (202 | ) | 1,349 | 1,007 | 342 | |||||||||||||||||
| Fair value gains, net | 875 | 211 | 664 | 875 | 170 | 705 | ||||||||||||||||||
| Other | (86 | ) | (470 | ) | 384 | (86 | ) | (414 | ) | 328 | ||||||||||||||
| Income before federal income taxes | 4,880 | 4,302 | 578 | 4,880 | 4,304 | 576 | ||||||||||||||||||
| Benefit for federal income taxes | 11,005 | — | 11,005 | 11,005 | — | 11,005 | ||||||||||||||||||
| Net income | $ | 15,885 | $ | 4,302 | $ | 11,583 | $ | 15,885 | $ | 4,304 | $ | 11,581 | ||||||||||||
| First Quarter 2013 Results | 15 | |
ANNEX I
FANNIE MAE
(In conservatorship)
Condensed Consolidated Balance Sheets — (Unaudited)
(Dollars in millions, except share amounts)
| As of | |||||||||||
| March 31, 2013 | December 31, 2012 | ||||||||||
| ASSETS | |||||||||||
| Cash and cash equivalents | $ | 23,413 | $ | 21,117 | |||||||
| Restricted cash (includes $51,847 and $61,976, respectively, related to consolidated trusts) | 57,231 | 67,919 | |||||||||
| Federal funds sold and securities purchased under agreements to resell or similar arrangements | 79,350 | 32,500 | |||||||||
| Investments in securities: | |||||||||||
| Trading, at fair value | 52,391 | 40,695 | |||||||||
| Available-for-sale, at fair value (includes $762 and $935, respectively, related to consolidated trusts) | 60,329 | 63,181 | |||||||||
| Total investments in securities | 112,720 | 103,876 | |||||||||
| Mortgage loans: | |||||||||||
| Loans held for sale, at lower of cost or fair value (includes $104 and $72, respectively, related to consolidated trusts) | 455 | 464 | |||||||||
| Loans held for investment, at amortized cost: | |||||||||||
| Of Fannie Mae | 336,585 | 355,544 | |||||||||
| Of consolidated trusts (includes $12,602 and $10,800, respectively, at fair value and loans pledged as collateral that may be sold or repledged of $859 and $943, respectively) | 2,678,057 | 2,652,193 | |||||||||
| Total loans held for investment | 3,014,642 | 3,007,737 | |||||||||
| Allowance for loan losses | (56,461 | ) | (58,795 | ) | |||||||
| Total loans held for investment, net of allowance | 2,958,181 | 2,948,942 | |||||||||
| Total mortgage loans | 2,958,636 | 2,949,406 | |||||||||
| Accrued interest receivable, net (includes $7,801 and $7,567, respectively, related to consolidated trusts) | 9,160 | 9,176 | |||||||||
| Acquired property, net | 10,149 | 10,489 | |||||||||
| Deferred tax asset, net | 49,738 | — | |||||||||
| Other assets (includes cash pledged as collateral of $1,289 and $1,222, respectively) | 20,278 | 27,939 | |||||||||
| Total assets | $ | 3,320,675 | $ | 3,222,422 | |||||||
| LIABILITIES AND EQUITY | |||||||||||
| Liabilities: | |||||||||||
| Accrued interest payable (includes $8,435 and $8,645, respectively, related to consolidated trusts) | $ | 11,163 | $ | 11,303 | |||||||
| Federal funds purchased and securities sold under agreements to repurchase | 218 | — | |||||||||
| Debt: | |||||||||||
| Of Fannie Mae (includes $770 and $793, respectively, at fair value) | 630,260 | 615,864 | |||||||||
| Of consolidated trusts (includes $13,345 and $11,647, respectively, at fair value) | 2,602,283 | 2,573,653 | |||||||||
| Other liabilities (includes $406 and $1,059, respectively, related to consolidated trusts) | 14,383 | 14,378 | |||||||||
| Total liabilities | 3,258,307 | 3,215,198 | |||||||||
| Commitments and contingencies (Note 17) | — | — | |||||||||
| Fannie Mae stockholders’ equity: | |||||||||||
| Senior preferred stock, 1,000,000 shares issued and outstanding | 117,149 | 117,149 | |||||||||
| Preferred stock, 700,000,000 shares are authorized—555,374,922 shares issued and outstanding, respectively | 19,130 | 19,130 | |||||||||
| Common stock, no par value, no maximum authorization—1,308,762,703 shares issued, respectively, 1,158,077,970 shares outstanding, respectively | 687 | 687 | |||||||||
| Accumulated deficit | (68,276 | ) | (122,766 | ) | |||||||
| Accumulated other comprehensive income | 1,038 | 384 | |||||||||
| Treasury stock, at cost, 150,684,733 shares, respectively | (7,401 | ) | (7,401 | ) | |||||||
| Total Fannie Mae stockholders’ equity | 62,327 | 7,183 | |||||||||
| Noncontrolling interest | 41 | 41 | |||||||||
| Total equity (See Note 1: Impact of U.S. Government Support and Earnings (Loss) per Share for information on our dividend obligation to Treasury) | 62,368 | 7,224 | |||||||||
| Total liabilities and equity | $ | 3,320,675 | $ | 3,222,422 | |||||||
See Notes to Condensed Consolidated Financial Statements
| First Quarter 2013 Results | 16 | |
FANNIE MAE
(In conservatorship)
Condensed Consolidated Statements of Operations and Comprehensive Income — (Unaudited)
(Dollars and shares in millions, except per share amounts)
| For the Three Months Ended March 31, | |||||||||||||
| 2013 | 2012 | ||||||||||||
| Interest income: | |||||||||||||
| Trading securities | $ | 226 | $ | 449 | |||||||||
| Available-for-sale securities | 673 | 727 | |||||||||||
| Mortgage loans (includes $25,394 and $29,001, respectively, related to consolidated trusts) | 29,224 | 32,570 | |||||||||||
| Other | 57 | 38 | |||||||||||
| Total interest income | 30,180 | 33,784 | |||||||||||
| Interest expense: | |||||||||||||
| Short-term debt | 43 | 42 | |||||||||||
| Long-term debt (includes $21,158 and $25,360, respectively, related to consolidated trusts) | 23,833 | 28,545 | |||||||||||
| Total interest expense | 23,876 | 28,587 | |||||||||||
| Net interest income | 6,304 | 5,197 | |||||||||||
| Benefit (provision) for credit losses | 957 | (2,000 | ) | ||||||||||
| Net interest income after benefit (provision) for credit losses | 7,261 | 3,197 | |||||||||||
| Investment gains, net | 118 | 116 | |||||||||||
| Net other-than-temporary impairments | (9 | ) | (64 | ) | |||||||||
| Fair value gains, net | 834 | 283 | |||||||||||
| Debt extinguishment losses, net | (23 | ) | (34 | ) | |||||||||
| Fee and other income | 568 | 375 | |||||||||||
| Non-interest income | 1,488 | 676 | |||||||||||
| Administrative expenses: | |||||||||||||
| Salaries and employee benefits | 317 | 306 | |||||||||||
| Professional services | 223 | 168 | |||||||||||
| Occupancy expenses | 46 | 43 | |||||||||||
| Other administrative expenses | 55 | 47 | |||||||||||
| Total administrative expenses | 641 | 564 | |||||||||||
| Foreclosed property (income) expense | (260 | ) | 339 | ||||||||||
| Other expenses | 254 | 252 | |||||||||||
| Total expenses | 635 | 1,155 | |||||||||||
| Income before federal income taxes | 8,114 | 2,718 | |||||||||||
| Benefit for federal income taxes | 50,571 | — | |||||||||||
| Net income | 58,685 | 2,718 | |||||||||||
| Other comprehensive income: | |||||||||||||
| Changes in unrealized gains on available-for-sale securities, net of reclassification adjustments and taxes | 648 | 355 | |||||||||||
| Other | 6 | 7 | |||||||||||
| Total other comprehensive income | 654 | 362 | |||||||||||
| Total comprehensive income | 59,339 | 3,080 | |||||||||||
| Less: Comprehensive (income) loss attributable to noncontrolling interest | — | 1 | |||||||||||
| Total comprehensive income attributable to Fannie Mae | $ | 59,339 | $ | 3,081 | |||||||||
| Net income | $ | 58,685 | $ | 2,718 | |||||||||
| Less: Net loss attributable to noncontrolling interest | — | 1 | |||||||||||
| Net income attributable to Fannie Mae | $ | 58,685 | $ | 2,719 | |||||||||
| Dividends distributed or available for distribution to senior preferred stockholder | (59,368 | ) | (2,817 | ) | |||||||||
| Net loss attributable to common stockholders (Note 11) | $ | (683 | ) | $ | (98 | ) | |||||||
| Loss per share—Basic and Diluted | $ | (0.12 | ) | $ | (0.02 | ) | |||||||
| Weighted-average common shares outstanding—Basic and Diluted | 5,762 | 5,761 | |||||||||||
See Notes to Condensed Consolidated Financial Statements
| First Quarter 2013 Results | 17 | |
FANNIE MAE
(In conservatorship)
Condensed Consolidated Statements of Cash Flows— (Unaudited)
(Dollars in millions)
| For the Three Months Ended March 31, | |||||||
| 2013 | 2012 | ||||||
| Net cash used in operating activities | $ | (6,420 | ) | $ | (114 | ) | |
| Cash flows provided by investing activities: | |||||||
| Purchases of trading securities held for investment | (2,021 | ) | (226 | ) | |||
| Proceeds from maturities and paydowns of trading securities held for investment | 659 | 756 | |||||
| Proceeds from sales of trading securities held for investment | 781 | 413 | |||||
| Purchases of available-for-sale securities | — | (9 | ) | ||||
| Proceeds from maturities and paydowns of available-for-sale securities | 2,689 | 2,929 | |||||
| Proceeds from sales of available-for-sale securities | 270 | 401 | |||||
| Purchases of loans held for investment | (60,504 | ) | (38,276 | ) | |||
| Proceeds from repayments of loans held for investment of Fannie Mae | 18,470 | 6,856 | |||||
| Proceeds from repayments of loans held for investment of consolidated trusts | 201,345 | 174,954 | |||||
| Net change in restricted cash | 10,688 | (5,124 | ) | ||||
| Advances to lenders | (38,471 | ) | (26,131 | ) | |||
| Proceeds from disposition of acquired property and preforeclosure sales | 13,057 | 10,195 | |||||
| Net change in federal funds sold and securities purchased under agreements to resell or similar agreements | (46,850 | ) | 31,000 | ||||
| Other, net | 7 | (208 | ) | ||||
| Net cash provided by investing activities | 100,120 | 157,530 | |||||
| Cash flows used in financing activities: | |||||||
| Proceeds from issuance of debt of Fannie Mae | 155,561 | 167,848 | |||||
| Payments to redeem debt of Fannie Mae | (141,422 | ) | (214,701 | ) | |||
| Proceeds from issuance of debt of consolidated trusts | 122,408 | 80,933 | |||||
| Payments to redeem debt of consolidated trusts | (223,943 | ) | (188,730 | ) | |||
| Payments of cash dividends on senior preferred stock to Treasury | (4,224 | ) | (2,819 | ) | |||
| Proceeds from senior preferred stock purchase agreement with Treasury | — | 4,571 | |||||
| Other, net | 216 | (8 | ) | ||||
| Net cash used in financing activities | (91,404 | ) | (152,906 | ) | |||
| Net increase in cash and cash equivalents | 2,296 | 4,510 | |||||
| Cash and cash equivalents at beginning of period | 21,117 | 17,539 | |||||
| Cash and cash equivalents at end of period | $ | 23,413 | $ | 22,049 | |||
| Cash paid during the period for interest | $ | 27,824 | $ | 30,590 | |||
See Notes to Condensed Consolidated Financial Statements
| First Quarter 2013 Results | 18 | |