Resource Center: 1-800-732-6643 Exhibit 99.1
Contact: Pete Bakel
202-752-2034
Date: August 7, 2014
Fannie Mae Reports Net Income of $3.7 Billion and Comprehensive Income of $3.7 Billion for Second Quarter 2014
| |
| • | Fannie Mae reported net income of $3.7 billion and comprehensive income of $3.7 billion for the second quarter of 2014. |
| |
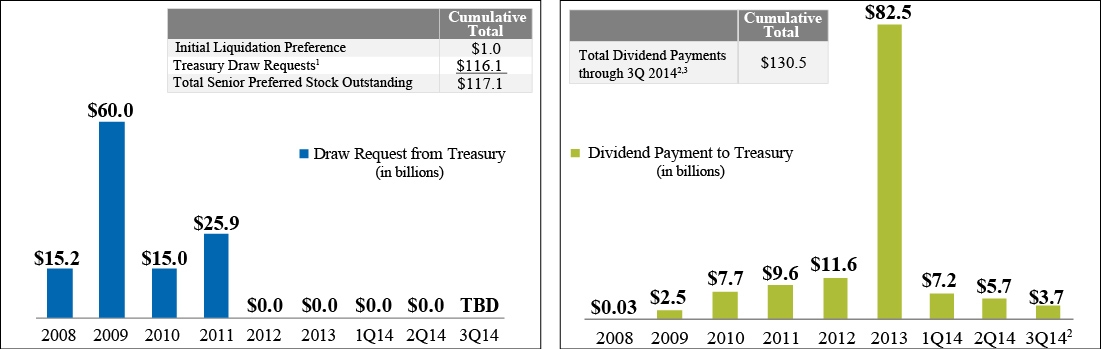
| • | Fannie Mae expects to pay Treasury $3.7 billion in dividends in September 2014. With the expected September dividend payment, Fannie Mae will have paid a total of $130.5 billion in dividends to Treasury in comparison to $116.1 billion in draw requests since 2008. Dividend payments do not offset prior Treasury draws. |
| |
| • | Fannie Mae has funded the mortgage market with more than $4.2 trillion in liquidity since 2009, including approximately $96 billion in liquidity in the second quarter of 2014, enabling families to buy, refinance, or rent a home. |
| |
| • | Fannie Mae has helped distressed families retain their homes or avoid foreclosure through more than 1.6 million workout solutions since 2009, including more than 43,000 in the second quarter of 2014. |
WASHINGTON, DC — Fannie Mae (FNMA/OTC) reported net income of $3.7 billion for the second quarter of 2014 and comprehensive income of $3.7 billion. The company reported a positive net worth of $6.1 billion as of June 30, 2014 and expects to pay $3.7 billion to Treasury in September 2014 as a dividend on the senior preferred stock.
Fannie Mae reported a strong second quarter of 2014. The company’s net income of $3.7 billion and comprehensive income of $3.7 billion for the second quarter of 2014 compares to net income of $5.3 billion and comprehensive income of $5.7 billion for the first quarter of 2014. Net income in the second quarter of 2014 declined compared with the first quarter of 2014, due primarily to a decline in the amount of income recognized by the company from settlement agreements related to private-label mortgage-related securities sold to Fannie Mae. This decline was partially offset by an increase in the company’s benefit for credit losses due primarily to higher home prices in the second quarter of 2014.
Fannie Mae’s federal income tax rate was 32.3 percent in the second quarter of 2014, resulting in a provision for federal income taxes of $1.8 billion in the second quarter of 2014.
|
| | |
| Second Quarter 2014 Results | | 1 |
SUMMARY OF SECOND QUARTER 2014 RESULTS

|
| | | | | | | | | | | | | | | | | | | | | | | | |
| (Dollars in millions) | | 2Q14 | | 1Q14 | | Variance | | 2Q14 | | 2Q13 | | Variance |
| Net interest income | | $ | 4,904 |
| | $ | 4,738 |
| | $ | 166 |
| | $ | 4,904 |
| | $ | 5,667 |
| | $ | (763 | ) |
| Fee and other income | | 383 |
| | 4,355 |
| | (3,972 | ) | | 383 |
| | 485 |
| | (102 | ) |
| Net revenues | | 5,287 |
| | 9,093 |
| | (3,806 | ) | | 5,287 |
| | 6,152 |
| | (865 | ) |
| Investment gains, net | | 506 |
| | 146 |
| | 360 |
| | 506 |
| | 290 |
| | 216 |
|
| Fair value (losses) gains, net | | (934 | ) | | (1,190 | ) | | 256 |
| | (934 | ) | | 829 |
| | (1,763 | ) |
| Administrative expenses | | (697 | ) | | (672 | ) | | (25 | ) | | (697 | ) | | (626 | ) | | (71 | ) |
| Credit-related income | | | | | | | | | | | | |
| Benefit for credit losses | | 1,639 |
| | 774 |
| | 865 |
| | 1,639 |
| | 5,383 |
| | (3,744 | ) |
| Foreclosed property income | | 214 |
| | 262 |
| | (48 | ) | | 214 |
| | 332 |
| | (118 | ) |
| Total credit-related income | | 1,853 |
| | 1,036 |
| | 817 |
| | 1,853 |
| | 5,715 |
| | (3,862 | ) |
Other non-interest expenses(1) | | (596 | ) | | (504 | ) | | (92 | ) | | (596 | ) | | (280 | ) | | (316 | ) |
| Net gains (losses) and income (expenses) | | 132 |
| | (1,184 | ) | | 1,316 |
| | 132 |
| | 5,928 |
| | (5,796 | ) |
| Income before federal income taxes | | 5,419 |
| | 7,909 |
| | (2,490 | ) | | 5,419 |
| | 12,080 |
| | (6,661 | ) |
| Provision for federal income taxes | | (1,752 | ) | | (2,584 | ) | | 832 |
| | (1,752 | ) | | (1,985 | ) | | 233 |
|
| Net income | | 3,667 |
| | 5,325 |
| | (1,658 | ) | | 3,667 |
| | 10,095 |
| | (6,428 | ) |
| Less: Net income attributable to noncontrolling interest | | (1 | ) | | — |
| | (1 | ) | | (1 | ) | | (11 | ) | | 10 |
|
| Net income attributable to Fannie Mae | | $ | 3,666 |
| | $ | 5,325 |
| | $ | (1,659 | ) | | $ | 3,666 |
| | $ | 10,084 |
| | $ | (6,418 | ) |
| Total comprehensive income attributable to Fannie Mae | | $ | 3,711 |
| | $ | 5,697 |
| | $ | (1,986 | ) | | $ | 3,711 |
| | $ | 10,250 |
| | $ | (6,539 | ) |
| Dividends distributed or available for distribution to senior preferred stockholder | | $ | (3,712 | ) | | $ | (5,692 | ) | | $ | 1,980 |
| | $ | (3,712 | ) | | $ | (10,243 | ) | | $ | 6,531 |
|
(1) Consists of net other-than-temporary impairments, debt extinguishments gains (losses), net, TCCA fees and other expenses, net.
Net Revenues, which consists of net interest income and fee and other income, were $5.3 billion for the second quarter of 2014, compared with $9.1 billion for the first quarter of 2014. The decline in net revenues was driven primarily by a decline in fee and other income. Fee and other income was $383 million for the second quarter of 2014, compared with $4.4 billion for the first quarter of 2014. The decrease was due primarily to a decline in the amount of income recognized by the company from settlement agreements related to private-label mortgage-related securities sold to Fannie Mae.
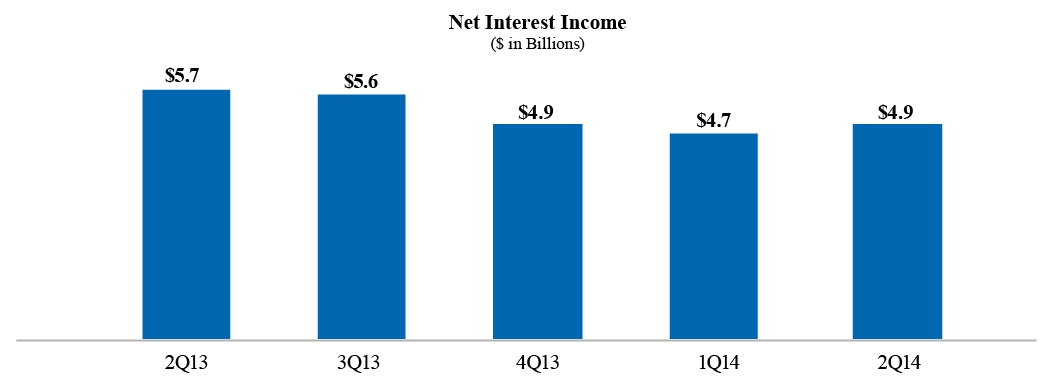
Net interest income, which includes guaranty fee revenue, was $4.9 billion for the second quarter of 2014, compared with $4.7 billion for the first quarter of 2014. The increase in net interest income compared with the first quarter of 2014 was due primarily to lower interest expense on funding debt, partially offset by a decline in the company’s retained mortgage portfolio. As a result of both the shrinking of the retained mortgage portfolio and the impact of guaranty fee increases, an increasing portion of Fannie Mae’s revenues in recent years has been derived from guaranty fees rather than from interest income earned on the company’s retained mortgage portfolio assets. The company recognizes almost all of its guaranty fee revenue in net interest income and the percentage of net interest income derived from guaranty fees on loans underlying Fannie Mae MBS increased to approximately half in the first half of 2014, compared with approximately one-third in the first half of 2013. The company expects that guaranty fees will continue to account for an increasing portion of its revenues.
|
| | |
| Second Quarter 2014 Results | | 2 |
Credit-Related Income, which consists of a benefit for credit losses and foreclosed property income, was $1.9 billion in the second quarter of 2014, compared with $1.0 billion in the first quarter of 2014. The increase in credit-related income was due primarily to an increase in home prices in the second quarter of 2014.
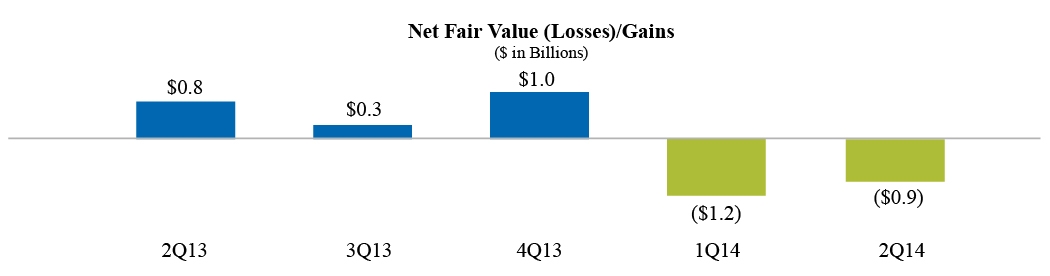
Net Fair Value Losses were $934 million in the second quarter of 2014, compared with $1.2 billion in the first quarter of 2014. Second quarter 2014 fair value losses were driven primarily by losses on risk management derivatives as a result of a decrease in interest rates. The estimated fair value of the company’s derivatives and securities may fluctuate substantially from period to period because of changes in interest rates, credit spreads, and interest rate volatility, as well as activity related to these financial instruments.
|
| | |
| Second Quarter 2014 Results | | 3 |
SUMMARY OF SECOND QUARTER 2014 BUSINESS SEGMENT RESULTS
The business groups running Fannie Mae’s three reporting segments – its Single-Family business, its Multifamily business, and its Capital Markets group – engage in complementary business activities in pursuing the company’s mission of providing liquidity, stability, and affordability to the U.S. housing market.

|
| | | | | | | | | | | | | | | | | | | | | | | | |
| (Dollars in millions) | | 2Q14 | | 1Q14 | | Variance | | 2Q14 | | 2Q13 | | Variance |
| Single-Family Segment: | | | | | | | | | | | | |
| Guaranty fee income | | $ | 2,893 |
| | $ | 2,870 |
| | $ | 23 |
| | $ | 2,893 |
| | $ | 2,544 |
| | $ | 349 |
|
| Credit-related income | | 1,781 |
| | 1,002 |
| | 779 |
| | 1,781 |
| | 5,681 |
| | (3,900 | ) |
| Other | | (847 | ) | | (836 | ) | | (11 | ) | | (847 | ) | | (677 | ) | | (170 | ) |
| Income before federal income taxes | | 3,827 |
| | 3,036 |
| | 791 |
| | 3,827 |
| | 7,548 |
| | (3,721 | ) |
| Provision for federal income taxes | | (1,133 | ) | | (927 | ) | | (206 | ) | | (1,133 | ) | | (1,050 | ) | | (83 | ) |
| Net income | | $ | 2,694 |
| | $ | 2,109 |
| | $ | 585 |
| | $ | 2,694 |
| | $ | 6,498 |
| | $ | (3,804 | ) |
| Multifamily Segment: | | | | | | | | | | | | |
| Guaranty fee income | | $ | 317 |
| | $ | 311 |
| | $ | 6 |
| | $ | 317 |
| | $ | 300 |
| | $ | 17 |
|
| Credit-related income | | 72 |
| | 34 |
| | 38 |
| | 72 |
| | 34 |
| | 38 |
|
| Other | | (4 | ) | | (24 | ) | | 20 |
| | (4 | ) | | 62 |
| | (66 | ) |
| Income before federal income taxes | | 385 |
| | 321 |
| | 64 |
| | 385 |
| | 396 |
| | (11 | ) |
| (Provision) benefit for federal income taxes | | (9 | ) | | 9 |
| | (18 | ) | | (9 | ) | | (10 | ) | | 1 |
|
| Net income | | $ | 376 |
| | $ | 330 |
| | $ | 46 |
| | $ | 376 |
| | $ | 386 |
| | $ | (10 | ) |
| Capital Markets Segment: | | | | | | | | | | | | |
| Net interest income | | $ | 1,917 |
| | $ | 1,830 |
| | $ | 87 |
| | $ | 1,917 |
| | $ | 2,680 |
| | $ | (763 | ) |
| Investment gains, net | | 1,648 |
| | 1,336 |
| | 312 |
| | 1,648 |
| | 898 |
| | 750 |
|
| Fair value (losses) gains, net | | (1,098 | ) | | (1,337 | ) | | 239 |
| | (1,098 | ) | | 841 |
| | (1,939 | ) |
| Other | | (308 | ) | | 3,672 |
| | (3,980 | ) | | (308 | ) | | (179 | ) | | (129 | ) |
| Income before federal income taxes | | 2,159 |
| | 5,501 |
| | (3,342 | ) | | 2,159 |
| | 4,240 |
| | (2,081 | ) |
| Provision for federal income taxes | | (610 | ) | | (1,666 | ) | | 1,056 |
| | (610 | ) | | (925 | ) | | 315 |
|
| Net income | | $ | 1,549 |
| | $ | 3,835 |
| | $ | (2,286 | ) | | $ | 1,549 |
| | $ | 3,315 |
| | $ | (1,766 | ) |
|
| | |
| Second Quarter 2014 Results | | 4 |
Single-Family Business
| |
| • | Single-Family net income was $2.7 billion in the second quarter of 2014, compared with $2.1 billion in the first quarter of 2014. Net income in the second quarter of 2014 was driven primarily by guaranty fee income and credit-related income. |
| |
| • | Single-Family guaranty fee income was $2.9 billion for both the second quarter of 2014 and the first quarter of 2014. The Single-Family guaranty book of business was relatively flat at $2.86 trillion as of June 30, 2014, compared with $2.88 trillion as of March 31, 2014. |
| |
| • | Single-Family credit-related income was $1.8 billion in the second quarter of 2014, compared with $1.0 billion in the first quarter of 2014. The increase was driven primarily by an increase in home prices in the second quarter of 2014. |
Multifamily Business
| |
| • | Multifamily net income was $376 million in the second quarter of 2014, compared with $330 million in the first quarter of 2014. Net income in the second quarter of 2014 was driven primarily by guaranty fee income. |
| |
| • | Multifamily guaranty fee income was $317 million for the second quarter of 2014, compared with $311 million for the first quarter of 2014. |
| |
| • | Multifamily credit-related income was $72 million for the second quarter of 2014, compared with $34 million for the first quarter of 2014. |
| |
| • | The Multifamily guaranty book of business was $197.6 billion as of June 30, 2014, compared with $199.0 billion as of March 31, 2014. |
Capital Markets
| |
| • | Capital Markets net income was $1.5 billion in the second quarter of 2014, compared with $3.8 billion in the first quarter of 2014. Net income in the second quarter of 2014 was driven primarily by net interest income and net investment gains, partially offset by net fair value losses. Capital Markets net income in the second quarter of 2014 declined compared with the first quarter of 2014 due primarily to a decline in the amount of income recognized by the company from settlement agreements related to private-label mortgage-related securities sold to Fannie Mae. |
| |
| • | Capital Markets net interest income was $1.9 billion for the second quarter of 2014, compared with $1.8 billion for the first quarter of 2014. |
| |
| • | Capital Markets net investment gains were $1.6 billion in the second quarter of 2014, compared with $1.3 billion in the first quarter of 2014. |
| |
| • | Capital Markets net fair value losses were $1.1 billion in the second quarter of 2014, compared with $1.3 billion in the first quarter of 2014. |
| |
| • | Capital Markets retained mortgage portfolio balance decreased to $452.8 billion as of June 30, 2014, compared with $467.7 billion as of March 31, 2014, resulting from purchases of $40.9 billion and liquidations and sales of $55.8 billion during the second quarter of 2014. |
|
| | |
| Second Quarter 2014 Results | | 5 |
HELPING TO BUILD A SUSTAINABLE HOUSING FINANCE SYSTEM
In addition to continuing to provide liquidity and support to the mortgage market, Fannie Mae has devoted significant resources toward helping to build a sustainable housing finance system for the future, primarily through pursuing the strategic goals identified by its conservator, the Federal Housing Finance Agency (“FHFA”). These strategic goals are: maintain in a safe and sound manner foreclosure prevention activities and credit availability for new and refinanced mortgages to foster liquid, efficient, competitive, and resilient national housing finance markets; reduce taxpayer risk through increasing the role of private capital in the mortgage market; and build a new single-family securitization infrastructure for use by the Enterprises and adaptable for use by other participants in the secondary market in the future.
ABOUT FANNIE MAE’S CONSERVATORSHIP
Fannie Mae has operated under the conservatorship of FHFA since September 6, 2008. Fannie Mae has not received funds from Treasury since the first quarter of 2012. The funding the company has received under its senior preferred stock purchase agreement with Treasury has provided the company with the capital and liquidity needed to fulfill its mission of providing liquidity and support to the nation’s housing finance markets and to avoid a trigger of mandatory receivership under the Federal Housing Finance Regulatory Reform Act of 2008. For periods through June 30, 2014, Fannie Mae has requested cumulative draws totaling $116.1 billion and paid $126.8 billion in dividends to Treasury. Under the senior preferred stock purchase agreement, the payment of dividends does not offset prior draws. As a result, Treasury maintains a liquidation preference of $117.1 billion on the company’s senior preferred stock.
Treasury Draws and Dividend Payments
| |
(1) | Treasury draw requests are shown in the period for which requested and do not include the initial $1.0 billion liquidation preference of Fannie Mae’s senior preferred stock, for which Fannie Mae did not receive any cash proceeds. The payment of dividends does not offset prior Treasury draws. |
| |
(2) | Fannie Mae expects to pay a dividend for the third quarter of 2014 calculated based on the company’s net worth of $6.1 billion as of June 30, 2014 less a capital reserve amount of $2.4 billion. |
| |
(3) | Amounts may not sum due to rounding. |
In August 2012, the terms governing the company’s dividend obligations on the senior preferred stock were amended. The amended senior preferred stock purchase agreement does not allow the company to build a capital reserve. Beginning in 2013, the required senior preferred stock dividends each quarter equal the amount, if any, by which the company’s net worth as of the end of the immediately preceding fiscal quarter exceeds an applicable capital reserve amount. The capital reserve amount is $2.4 billion for each quarter of 2014 and will be reduced by $600 million each year until it reaches zero in 2018.
|
| | |
| Second Quarter 2014 Results | | 6 |
The amount of remaining funding available to Fannie Mae under the senior preferred stock purchase agreement with Treasury is currently $117.6 billion.
Fannie Mae is not permitted to redeem the senior preferred stock prior to the termination of Treasury’s funding commitment under the senior preferred stock purchase agreement. The limited circumstances under which Treasury’s funding commitment will terminate are described in “Business—Conservatorship and Treasury Agreements” in the company’s annual report on Form 10-K for the year ended December 31, 2013.
CREDIT QUALITY
While continuing to make it possible for families to purchase, refinance, or rent a home, Fannie Mae has established responsible credit standards. Since 2009, Fannie Mae has seen the effect of the actions it took, beginning in 2008, to significantly strengthen its underwriting and eligibility standards and change its pricing to promote sustainable homeownership and stability in the housing market. Single-family conventional loans acquired by Fannie Mae in the first six months of 2014 had a weighted average borrower FICO credit score at origination of 743 and a weighted average original loan-to-value ratio of 77 percent.
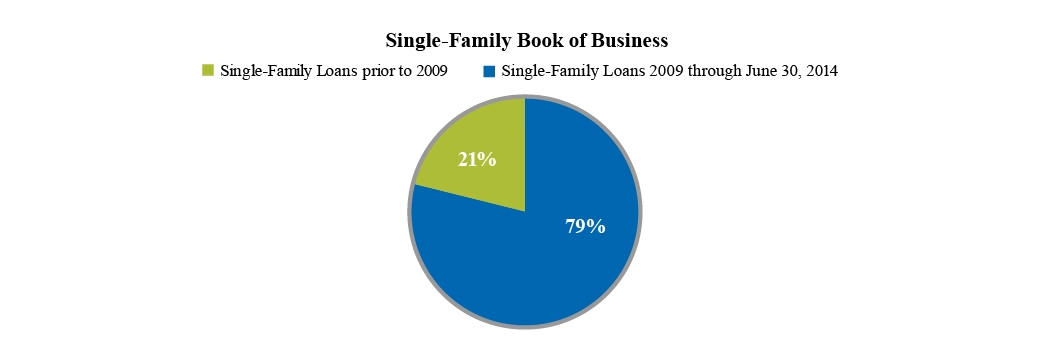
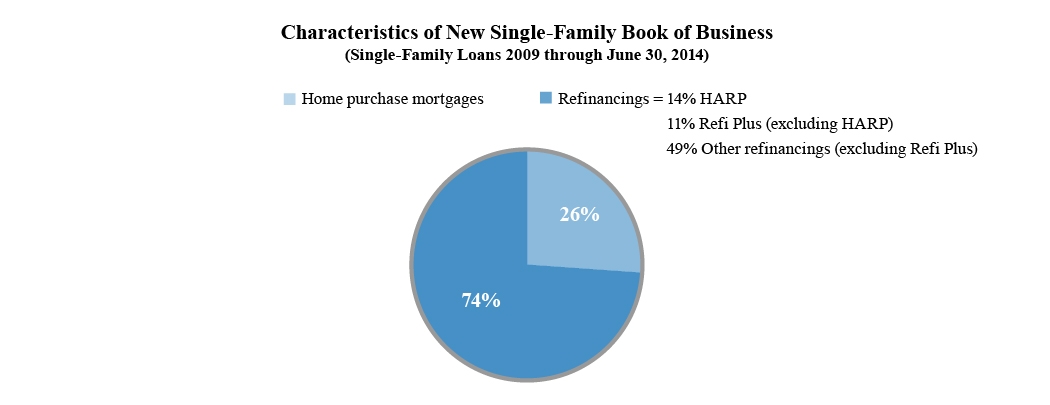
As of June 30, 2014, 79 percent of Fannie Mae’s single-family conventional guaranty book of business consisted of loans it had purchased or guaranteed since the beginning of 2009.
Fannie Mae’s new book of business (loans purchased or guaranteed since 2009) was comprised of 26 percent of home purchase mortgages and 74 percent of loan refinancings as of June 30, 2014. Refinancings included 14 percent of loans acquired through the Home Affordable Refinance Program (“HARP®”), 11 percent of loans through Fannie Mae’s Refi PlusTM initiative (excluding HARP), and 49 percent other refinancings (excluding Refi Plus refinancings). Our Refi Plus initiative, which started in April 2009 and includes HARP, provides expanded refinance opportunities for eligible Fannie Mae borrowers, and may involve the refinance of existing Fannie Mae loans with high loan-to-value ratios, including loans with loan-to-value ratios in excess of 100 percent.
|
| | |
| Second Quarter 2014 Results | | 7 |
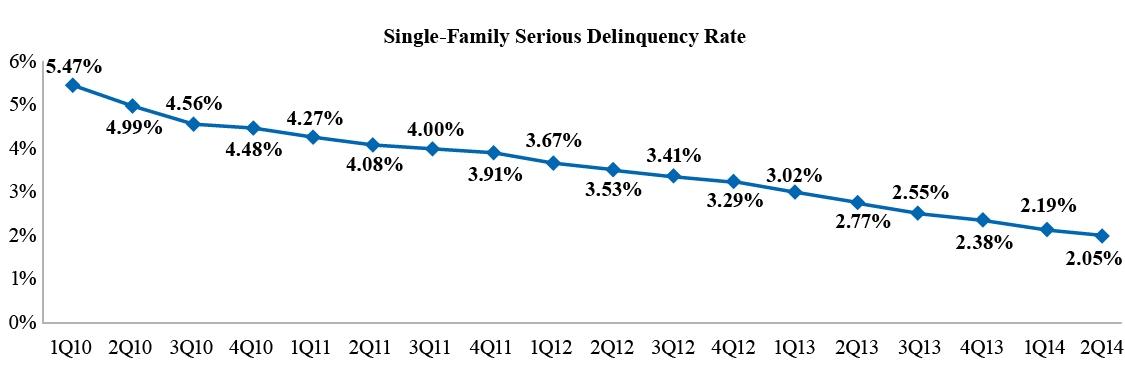
Fannie Mae’s single-family serious delinquency rate has declined each quarter since the first quarter of 2010, and was 2.05 percent as of June 30, 2014, compared with 5.47 percent as of March 31, 2010. This decrease is the result of home retention solutions, foreclosure alternatives, and completed foreclosures, as well as the company’s acquisition of loans with stronger credit profiles since the beginning of 2009.
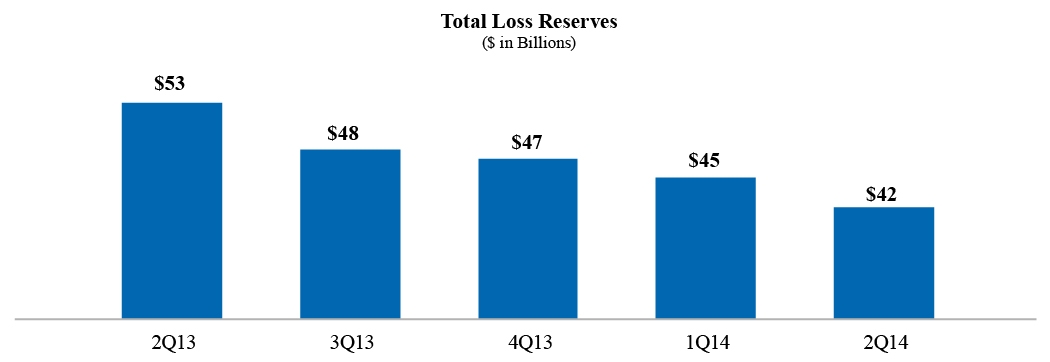
Total Loss Reserves, which reflect the company’s estimate of the probable losses the company has incurred in its guaranty book of business, including concessions it granted borrowers upon modification of their loans, were $42.1 billion as of June 30, 2014, compared with $45.3 billion as of March 31, 2014. The total loss reserve coverage to total nonaccrual loans was 59 percent as of June 30, 2014, compared with 60 percent as of March 31, 2014.
|
| | |
| Second Quarter 2014 Results | | 8 |
PROVIDING LIQUIDITY AND SUPPORT TO THE MARKET
Liquidity
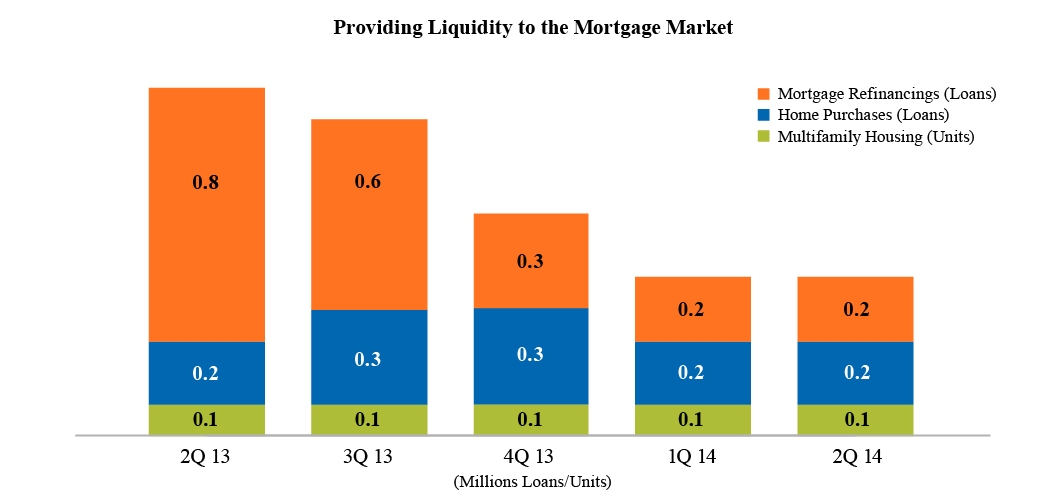
Fannie Mae has provided more than $4.2 trillion in liquidity to the mortgage market since January 1, 2009, including approximately $96 billion in liquidity in the second quarter of 2014, through its purchases and guarantees of loans, which resulted in:
| |
| • | 12.8 million mortgage refinancings, including approximately 212,000 in the second quarter of 2014 |
| |
| • | 4.1 million home purchases, including approximately 215,000 in the second quarter of 2014 |
| |
| • | 2.3 million units of multifamily housing, including approximately 93,000 in the second quarter of 2014 |
The company expects that refinancings will continue to constitute a smaller portion of its single-family business volume in 2014 than in 2013.
|
| | |
| Second Quarter 2014 Results | | 9 |
The company remained the largest single issuer of single-family mortgage-related securities in the secondary market in the second quarter of 2014, with an estimated market share of new single-family mortgage-related securities issuances of 39 percent in the second quarter of 2014, compared with 41 percent in the first quarter of 2014 and 45 percent in the second quarter of 2013.
Fannie Mae also remained a continuous source of liquidity in the multifamily market. As of March 31, 2014 (the latest date for which information is available), the company owned or guaranteed approximately 20 percent of the outstanding debt on multifamily properties.
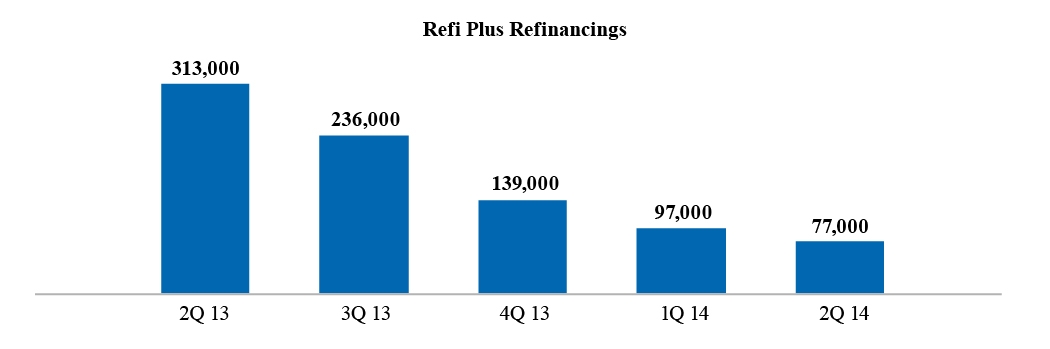
Refinancing Initiatives
Through the company’s Refi Plus initiative, which offers refinancing flexibility to eligible Fannie Mae borrowers and includes HARP, the company acquired approximately 77,000 loans in the second quarter of 2014. Some borrowers’ monthly payments increased as they took advantage of the ability to refinance through Refi Plus to reduce the term of their loan, to switch from an adjustable-rate mortgage to a fixed-rate mortgage, or to switch from an interest-only mortgage to a fully amortizing mortgage. Even taking these into account, refinancings delivered to Fannie Mae through Refi Plus in the second quarter of 2014 reduced borrowers’ monthly mortgage payments by an average of $150. The volume of Refi Plus refinancings continued to decrease through the second quarter of 2014 due primarily to an increase in interest rates since the first half of 2013.
Home Retention Solutions and Foreclosure Alternatives
To reduce the credit losses Fannie Mae ultimately incurs on its legacy book of business, the company has been focusing its efforts on several strategies, including reducing defaults by offering home retention solutions, such as loan modifications.
|
| | |
| Second Quarter 2014 Results | | 10 |
|
| | | | | | | | | | | | | |
| | For the Six Months Ended June 30, |
| | 2014 | | 2013 |
| | Unpaid Principal Balance | | Number of Loans | | Unpaid Principal Balance | | Number of Loans |
| | (Dollars in millions) |
| Home retention strategies: | | | | | | | |
| Modifications | $ | 11,584 |
| | 68,054 |
| | $ | 15,130 |
| | 83,511 |
|
| Repayment plans and forbearances completed | 511 |
| | 3,884 |
| | 1,030 |
| | 7,906 |
|
| Total home retention strategies | 12,095 |
| | 71,938 |
| | 16,160 |
| | 91,417 |
|
| Foreclosure alternatives: | | | | | | | |
| Short sales | 2,760 |
| | 13,347 |
| | 5,452 |
| | 25,642 |
|
| Deeds-in-lieu of foreclosure | 996 |
| | 6,296 |
| | 1,352 |
| | 8,194 |
|
| Total foreclosure alternatives | 3,756 |
| | 19,643 |
| | 6,804 |
| | 33,836 |
|
| Total loan workouts | $ | 15,851 |
| | 91,581 |
| | $ | 22,964 |
| | 125,253 |
|
| Loan workouts as a percentage of single-family guaranty book of business | 1.11 | % | | 1.05 | % | | 1.62 | % | | 1.43 | % |
Fannie Mae views foreclosure as a last resort. For homeowners and communities in need, the company offers alternatives to foreclosure. In dealing with homeowners in distress, the company first seeks home retention solutions, which enable borrowers to stay in their homes, before turning to foreclosure alternatives.
| |
| • | Fannie Mae provided more than 43,000 loan workouts during the second quarter of 2014 enabling borrowers to avoid foreclosure and contributing to the more than 1.6 million loan workouts completed from the beginning of 2009 through June 30, 2014. |
| |
| • | Fannie Mae completed more than 32,000 loan modifications during the second quarter of 2014, bringing the total number of loan modifications the company has completed since January 1, 2009 to more than 1.1 million. |
FORECLOSURES AND REO
When there is no viable home retention solution or foreclosure alternative that can be applied, the company seeks to move to foreclosure expeditiously in an effort to minimize prolonged delinquencies that can hurt local home values and destabilize communities.
|
| | | | | | | | |
| | For the Six Months Ended June 30, |
| | 2014 | | 2013 | |
| Single-family foreclosed properties (number of properties): | | | | |
| Beginning of period inventory of single-family foreclosed properties (REO) | 103,229 |
| | 105,666 |
| |
| Total properties acquired through foreclosure | 63,574 |
| | 74,823 |
| |
| Dispositions of REO | (70,007 | ) | | (83,569 | ) | |
| End of period inventory of single-family foreclosed properties (REO) | 96,796 |
| | 96,920 |
| |
| Carrying value of single-family foreclosed properties (dollars in millions) | $ | 10,347 |
| | $ | 9,075 |
| |
| Single-family foreclosure rate | 0.73 |
| % | 0.86 |
| % |
|
| | |
| Second Quarter 2014 Results | | 11 |
| |
| • | Fannie Mae acquired 31,678 single-family REO properties, primarily through foreclosure, in the second quarter of 2014, compared with 31,896 in the first quarter of 2014. |
| |
| • | As of June 30, 2014, the company’s inventory of single-family REO properties was 96,796, compared with 102,398 as of March 31, 2014. The carrying value of the company’s single-family REO was $10.3 billion as of June 30, 2014. |
| |
| • | The company’s single-family foreclosure rate was 0.73 percent for the first six months of 2014. This reflects the annualized total number of single-family properties acquired through foreclosure or deeds-in-lieu of foreclosure as a percentage of the total number of loans in Fannie Mae’s single-family guaranty book of business. |
Fannie Mae’s financial statements for the second quarter of 2014 are available in the accompanying Annex; however, investors and interested parties should read the company’s quarterly report on Form 10-Q for the quarter ended June 30, 2014 (the “Second Quarter 2014 Form 10-Q”), which was filed today with the Securities and Exchange Commission and is available on Fannie Mae’s Web site, www.fanniemae.com. The company provides further discussion of its financial results and condition, credit performance, fair value balance sheets, and other matters in its Second Quarter 2014 Form 10-Q. Additional information about the company’s credit performance, the characteristics of its guaranty book of business, its foreclosure-prevention efforts, and other measures is contained in the “2014 Second Quarter Credit Supplement” at www.fanniemae.com.
# # #
In this release, the company has presented a number of estimates, forecasts, expectations, and other forward-looking statements, including statements regarding the company’s future dividend payments to Treasury; the future sources of its revenues; the portion of its future business volume that will consist of refinancings; the impact of the company’s actions to reduce credit losses; and the future fair value of the company’s securities and derivatives. These estimates, forecasts, expectations, and statements are forward looking statements based on the company’s current assumptions regarding numerous factors, including future home prices and the future performance of its loans. Actual results and future projections could be materially different from what is set forth in the forward-looking statements as a result of home price changes, interest rate changes, unemployment rates, other macroeconomic and housing market variables, the company’s future serious delinquency rates, government policy, credit availability, borrower behavior, including increases in the number of underwater borrowers who strategically default on their mortgage loan, the volume of loans it modifies, the nature, volume and effectiveness of its loss mitigation strategies and activities, significant changes in modification and foreclosure activity, management of its real estate owned inventory and pursuit of contractual remedies, changes in the fair value of its assets and liabilities, impairments of its assets, future legislative or regulatory requirements that have a significant impact on the company’s business such as a requirement that the company implement a principal forgiveness program or the enactment of housing finance reform legislation, future updates to the company’s models relating to loss reserves, including the assumptions used by these models, changes in generally accepted accounting principles, changes to the company’s accounting policies, whether the company’s counterparties meet their obligations in full, effects from activities the company takes to support the mortgage market and help borrowers, the company’s future objectives and activities in support of those objectives, including actions the company may take to reach additional underserved creditworthy borrowers, actions the company may be required to take by FHFA, as its conservator or as its regulator, such as changes in the types of business the company does, the conservatorship and its effect on the company’s business, the investment by Treasury and its effect on the company’s business, the uncertainty of the company’s future, the company’s future guaranty fee pricing and the impact of that pricing on the company’s competitive environment, challenges the company faces in retaining and hiring qualified employees, the deteriorated credit performance of many loans in the company’s guaranty book of business, a decrease in the company’s credit ratings, defaults by one or more institutional counterparties, resolution or settlement agreements the company may enter into with its counterparties, operational control weaknesses, changes in the fiscal and monetary policies of the Federal Reserve, including the effect of the tapering of its program of purchasing mortgage-related securities and any future sales of such securities, changes in the structure and regulation of the financial services industry, the company’s ability to access the debt markets, disruptions in the housing, credit, and stock markets, government investigations and litigation, the performance of the company’s servicers, conditions in the foreclosure environment, natural or other disasters, and many other factors, including those discussed in the “Risk Factors” section of and elsewhere in the company’s annual report on Form 10-K for the year ended December 31, 2013 and the company’s quarterly report on Form 10-Q for the quarter ended June 30, 2014, and elsewhere in this release.
Fannie Mae provides Web site addresses in its news releases solely for readers’ information. Other content or information appearing on these Web sites is not part of this release.
Fannie Mae enables people to buy, refinance, or rent a home.
Visit us at www.fanniemae.com/progress
Follow us on Twitter: http://twitter.com/FannieMae
|
| | |
| Second Quarter 2014 Results | | 12 |
ANNEX
FANNIE MAE
(In conservatorship)
Condensed Consolidated Balance Sheets — (Unaudited)
(Dollars in millions, except share amounts)
|
| | | | | | | | | | | |
| | As of |
| | June 30, | | December 31, |
| | 2014 | | 2013 |
| ASSETS |
| Cash and cash equivalents | | $ | 20,847 |
| | | | $ | 19,228 |
| |
| Restricted cash (includes $25,401 and $23,982, respectively, related to consolidated trusts) | | 29,587 |
| | | | 28,995 |
| |
| Federal funds sold and securities purchased under agreements to resell or similar arrangements | | 16,700 |
| | | | 38,975 |
| |
| Investments in securities: | | | | | | | |
| Trading, at fair value | | 26,630 |
| | | | 30,768 |
| |
| Available-for-sale, at fair value (includes $561 and $998, respectively, related to consolidated trusts) | | 34,026 |
| | | | 38,171 |
| |
| Total investments in securities | | 60,656 |
| | | | 68,939 |
| |
| Mortgage loans: | | | | | | | |
| Loans held for sale, at lower of cost or fair value (includes $25 and $31, respectively, related to consolidated trusts) | | 625 |
| | | | 380 |
| |
| Loans held for investment, at amortized cost: | | | | | | | |
| Of Fannie Mae | | 284,609 |
| | | | 300,159 |
| |
| Of consolidated trusts (includes $15,116 and $14,268, respectively, at fair value and loans pledged as collateral that may be sold or repledged of $389 and $442, respectively) | | 2,758,619 |
| | | | 2,769,547 |
| |
| Total loans held for investment | | 3,043,228 |
| | | | 3,069,706 |
| |
| Allowance for loan losses | | (39,067 | ) | | | | (43,846 | ) | |
| Total loans held for investment, net of allowance | | 3,004,161 |
| | | | 3,025,860 |
| |
| Total mortgage loans | | 3,004,786 |
| | | | 3,026,240 |
| |
| Accrued interest receivable, net (includes $7,470 and $7,271, respectively, related to consolidated trusts) | | 8,472 |
| | | | 8,319 |
| |
| Acquired property, net | | 11,560 |
| | | | 11,621 |
| |
| Deferred tax assets, net | | 44,809 |
| | | | 47,560 |
| |
| Other assets (includes cash pledged as collateral of $1,821 and $1,590, respectively) | | 21,400 |
| | | | 20,231 |
| |
| Total assets | | $ | 3,218,817 |
| | | | $ | 3,270,108 |
| |
| LIABILITIES AND EQUITY |
| Liabilities: | | | | | | | |
| Accrued interest payable (includes $8,213 and $8,276, respectively, related to consolidated trusts) | | $ | 10,203 |
| | | | $ | 10,553 |
| |
| Debt: | | | | | | | |
| Of Fannie Mae (includes $3,432 and $1,308, respectively, at fair value) | | 477,535 |
| | | | 529,434 |
| |
| Of consolidated trusts (includes $16,420 and $14,976, respectively, at fair value) | | 2,712,010 |
| | | | 2,705,089 |
| |
| Other liabilities (includes $453 and $488, respectively, related to consolidated trusts) | | 12,957 |
| | | | 15,441 |
| |
| Total liabilities | | 3,212,705 |
| | | | 3,260,517 |
| |
| Commitments and contingencies | | — |
| | | | — |
| |
| Fannie Mae stockholders’ equity: | | | | | | | |
| Senior preferred stock, 1,000,000 shares issued and outstanding | | 117,149 |
| | | | 117,149 |
| |
| Preferred stock, 700,000,000 shares are authorized—555,374,922 shares issued and outstanding | | 19,130 |
| | | | 19,130 |
| |
| Common stock, no par value, no maximum authorization—1,308,762,703 shares issued and 1,158,080,657 shares outstanding | | 687 |
| | | | 687 |
| |
| Accumulated deficit | | (125,123 | ) | | | | (121,227 | ) | |
| Accumulated other comprehensive income | | 1,620 |
| | | | 1,203 |
| |
| Treasury stock, at cost, 150,682,046 shares | | (7,401 | ) | | | | (7,401 | ) | |
| Total Fannie Mae stockholders’ equity | | 6,062 |
| | | | 9,541 |
| |
| Noncontrolling interest | | 50 |
| | | | 50 |
| |
| Total equity | | 6,112 |
| | | | 9,591 |
| |
| Total liabilities and equity | | $ | 3,218,817 |
| | | | $ | 3,270,108 |
| |
See Notes to Condensed Consolidated Financial Statements in the Second Quarter 2014 Form 10-Q
|
| | |
| Second Quarter 2014 Results | | 13 |
FANNIE MAE
(In conservatorship)
Condensed Consolidated Statements of Operations and Comprehensive Income — (Unaudited)
(Dollars and shares in millions, except per share amounts)
|
| | | | | | | | | | | | | | | | | | | | |
| | | For the Three Months | | | For the Six Months | |
| | | Ended June 30, | | | Ended June 30, | |
| | | 2014 | | | 2013 | | | 2014 | | | 2013 | |
| Interest income: | | | | | | | | | | | | |
| Trading securities | | $ | 143 |
| | | $ | 222 |
| | | $ | 270 |
| | | $ | 448 |
| |
| Available-for-sale securities | | 414 |
| | | 651 |
| | | 854 |
| | | 1,324 |
| |
| Mortgage loans (includes $25,533 and $24,847, respectively, for the three months ended and $51,487 and $50,241, respectively, for the six months ended related to consolidated trusts) | | 28,165 |
| | | 28,056 |
| | | 56,753 |
| | | 57,280 |
| |
| Other | | 24 |
| | | 49 |
| | | 48 |
| | | 106 |
| |
| Total interest income | | 28,746 |
| | | 28,978 |
| | | 57,925 |
| | | 59,158 |
| |
| Interest expense: | | | | | | | | | | | | |
| Short-term debt | | 21 |
| | | 37 |
| | | 41 |
| | | 80 |
| |
| Long-term debt (includes $21,692 and $20,722, respectively, for the three months ended and $43,768 and $41,880, respectively, for the six months ended related to consolidated trusts) | | 23,821 |
| | | 23,274 |
| | | 48,242 |
| | | 47,107 |
| |
| Total interest expense | | 23,842 |
| | | 23,311 |
| | | 48,283 |
| | | 47,187 |
| |
| Net interest income | | 4,904 |
| | | 5,667 |
| | | 9,642 |
| | | 11,971 |
| |
| Benefit for credit losses | | 1,639 |
| | | 5,383 |
| | | 2,413 |
| | | 6,340 |
| |
| Net interest income after benefit for credit losses | | 6,543 |
| | | 11,050 |
| | | 12,055 |
| | | 18,311 |
| |
| Investment gains, net | | 506 |
| | | 290 |
| | | 652 |
| | | 408 |
| |
| Net other-than-temporary impairments | | (23 | ) | | | (6 | ) | | | (74 | ) | | | (15 | ) | |
| Fair value (losses) gains, net | | (934 | ) | | | 829 |
| | | (2,124 | ) | | | 1,663 |
| |
| Debt extinguishment gains, net | | 38 |
| | | 27 |
| | | 38 |
| | | 4 |
| |
| Fee and other income | | 383 |
| | | 485 |
| | | 4,738 |
| | | 1,053 |
| |
| Non-interest (loss) income | | (30 | ) | | | 1,625 |
| | | 3,230 |
| | | 3,113 |
| |
| Administrative expenses: | | | | | | | | | | | | |
| Salaries and employee benefits | | 319 |
| | | 304 |
| | | 644 |
| | | 621 |
| |
| Professional services | | 275 |
| | | 219 |
| | | 517 |
| | | 442 |
| |
| Occupancy expenses | | 47 |
| | | 47 |
| | | 97 |
| | | 93 |
| |
| Other administrative expenses | | 56 |
| | | 56 |
| | | 111 |
| | | 111 |
| |
| Total administrative expenses | | 697 |
| | | 626 |
| | | 1,369 |
| | | 1,267 |
| |
| Foreclosed property income | | (214 | ) | | | (332 | ) | | | (476 | ) | | | (592 | ) | |
| Temporary Payroll Tax Cut Continuation Act of 2011 (“TCCA”) fees | | 335 |
| | | 233 |
| | | 657 |
| | | 419 |
| |
| Other expenses, net | | 276 |
| | | 68 |
| | | 407 |
| | | 136 |
| |
| Total expenses | | 1,094 |
| | | 595 |
| | | 1,957 |
| | | 1,230 |
| |
| Income before federal income taxes | | 5,419 |
| | | 12,080 |
| | | 13,328 |
| | | 20,194 |
| |
| (Provision) benefit for federal income taxes | | (1,752 | ) | | | (1,985 | ) | | | (4,336 | ) | | | 48,586 |
| |
| Net income | | 3,667 |
| | | 10,095 |
| | | 8,992 |
| | | 68,780 |
| |
| Other comprehensive income: | | | | | | | | | | | | |
| Changes in unrealized gains on available-for-sale securities, net of reclassification adjustments and taxes | | 45 |
| | | 17 |
| | | 417 |
| | | 665 |
| |
| Other | | — |
| | | 149 |
| | | — |
| | | 155 |
| |
| Total other comprehensive income | | 45 |
| | | 166 |
| | | 417 |
| | | 820 |
| |
| Total comprehensive income | | 3,712 |
| | | 10,261 |
| | | 9,409 |
| | | 69,600 |
| |
| Less: Comprehensive income attributable to noncontrolling interest | | (1 | ) | | | (11 | ) | | | (1 | ) | | | (11 | ) | |
| Total comprehensive income attributable to Fannie Mae | | $ | 3,711 |
| | | $ | 10,250 |
| | | $ | 9,408 |
| | | $ | 69,589 |
| |
| Net income | | $ | 3,667 |
| | | $ | 10,095 |
| | | $ | 8,992 |
| | | $ | 68,780 |
| |
| Less: Net income attributable to noncontrolling interest | | (1 | ) | | | (11 | ) | | | (1 | ) | | | (11 | ) | |
| Net income attributable to Fannie Mae | | 3,666 |
| | | 10,084 |
| | | 8,991 |
| | | 68,769 |
| |
| Dividends distributed or available for distribution to senior preferred stockholder | | (3,712 | ) | | | (10,243 | ) | | | (9,404 | ) | | | (69,611 | ) | |
| Net loss attributable to common stockholders | | $ | (46 | ) | | | $ | (159 | ) | | | $ | (413 | ) | | | $ | (842 | ) | |
| Loss per share: basic and diluted | | $ | (0.01 | ) | | | $ | (0.03 | ) | | | $ | (0.07 | ) | | | $ | (0.15 | ) | |
| Weighted-average common shares outstanding: basic and diluted | | 5,762 |
| | | 5,762 |
| | | 5,762 |
| | | 5,762 |
| |
See Notes to Condensed Consolidated Financial Statements in the Second Quarter 2014 Form 10-Q
|
| | |
| Second Quarter 2014 Results | | 14 |
FANNIE MAE
(In conservatorship)
Condensed Consolidated Statements of Cash Flows— (Unaudited)
(Dollars in millions)
|
| | | | | | | |
| | For the Six Months Ended June 30, |
| | 2014 | | 2013 |
| Net cash provided by operating activities | $ | 3,420 |
| | $ | 4,802 |
|
| Cash flows provided by investing activities: | | | |
| Purchases of trading securities held for investment | — |
| | (3,985 | ) |
| Proceeds from maturities and paydowns of trading securities held for investment | 681 |
| | 1,293 |
|
| Proceeds from sales of trading securities held for investment | 1,188 |
| | 4,469 |
|
| Proceeds from maturities and paydowns of available-for-sale securities | 3,022 |
| | 5,861 |
|
| Proceeds from sales of available-for-sale securities | 1,740 |
| | 2,021 |
|
| Purchases of loans held for investment | (55,843 | ) | | (119,122 | ) |
| Proceeds from repayments and sales of loans acquired as held for investment of Fannie Mae | 12,840 |
| | 28,762 |
|
| Proceeds from repayments and sales of loans acquired as held for investment of consolidated trusts | 177,527 |
| | 394,972 |
|
| Net change in restricted cash | (592 | ) | | 13,989 |
|
| Advances to lenders | (42,545 | ) | | (76,435 | ) |
| Proceeds from disposition of acquired property and preforeclosure sales | 13,471 |
| | 22,466 |
|
| Net change in federal funds sold and securities purchased under agreements to resell or similar arrangements | 22,275 |
| | (5,300 | ) |
| Other, net | (349 | ) | | 170 |
|
| Net cash provided by investing activities | 133,415 |
| | 269,161 |
|
| Cash flows used in financing activities: | | | |
| Proceeds from issuance of debt of Fannie Mae | 165,337 |
| | 248,901 |
|
| Payments to redeem debt of Fannie Mae | (217,988 | ) | | (261,959 | ) |
| Proceeds from issuance of debt of consolidated trusts | 113,448 |
| | 235,835 |
|
| Payments to redeem debt of consolidated trusts | (183,124 | ) | | (429,545 | ) |
| Payments of cash dividends on senior preferred stock to Treasury | (12,882 | ) | | (63,592 | ) |
| Other, net | (7 | ) | | (2 | ) |
| Net cash used in financing activities | (135,216 | ) | | (270,362 | ) |
| Net increase in cash and cash equivalents | 1,619 |
| | 3,601 |
|
| Cash and cash equivalents at beginning of period | 19,228 |
| | 21,117 |
|
| Cash and cash equivalents at end of period | $ | 20,847 |
| | $ | 24,718 |
|
| Cash paid during the period for: | | | |
| Interest | $ | 53,594 |
| | $ | 55,455 |
|
| Income taxes | 2,475 |
| | 1,016 |
|
See Notes to Condensed Consolidated Financial Statements in the Second Quarter 2014 Form 10-Q
|
| | |
| Second Quarter 2014 Results | | 15 |