Contact: Pete Bakel Resource Center: 1-800-732-6643
202-752-2034 Exhibit 99.1
Date: August 1, 2019
Fannie Mae Reports Net Income of $3.4 Billion and
Comprehensive Income of $3.4 Billion for Second Quarter 2019
|
| | | |
| | Second Quarter 2019 Results | | |
| | | | |
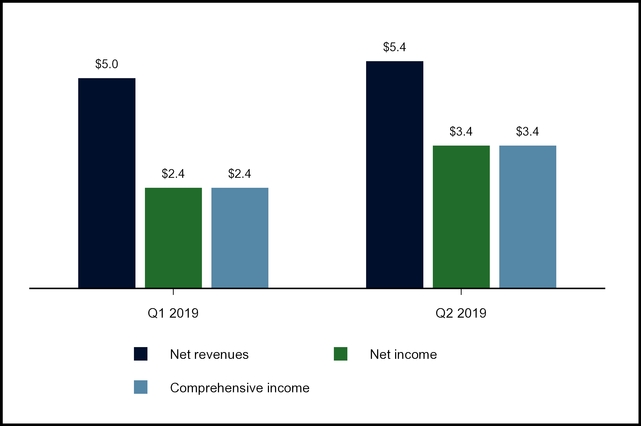
| Ÿ | Fannie Mae reported net income of $3.4 billion and comprehensive income of $3.4 billion for the second quarter of 2019, reflecting the strength of the company’s underlying business fundamentals. This compares to net income of $2.4 billion and comprehensive income of $2.4 billion for the first quarter of 2019. | | “Fannie Mae’s results continue to show the strength of our business model and our ability to generate solid returns.
“We are sharpening our focus on capital management through the lens of FHFA’s proposed capital framework.
“We continue to work with industry stakeholders to identify and enable new solutions to our country’s housing challenges and increase the supply of housing.
“And we will continue to improve the company in order to deliver value, liquidity, and stability to the housing finance system.”
Hugh R. Frater, Chief Executive Officer
|
| | | |
| Ÿ | Fannie Mae expects to pay a $3.4 billion dividend to Treasury by September 30, 2019. Through the second quarter of 2019, the company has paid $181.4 billion in dividends to Treasury. | |
| | | |
| | Business Highlights | |
| | | |
| Ÿ | Fannie Mae provided $213.1 billion in liquidity to the single-family mortgage market in the first half of 2019 and was the largest issuer of single-family mortgage-related securities in the secondary market. More than 56% of the single-family mortgage loans the company acquired in the first half of 2019 were affordable to families earning at or below 120% of the area median income, providing support for both affordable and workforce housing. The company’s estimated market share of new single-family mortgage-related securities issuances was 35% for the second quarter of 2019. | |
| |
| |
| Ÿ | Fannie Mae has transferred a portion of the credit risk on single-family mortgages with an unpaid principal balance of more than $1.7 trillion since 2013, measured at the time of the transactions, including $148 billion in the first half of 2019. As of June 30, 2019, $1.2 trillion in single-family mortgages or approximately 42% of the loans in the company’s single-family conventional guaranty book of business, measured by unpaid principal balance, were covered by a credit risk transfer transaction. | |
| | | |
| Ÿ | Fannie Mae provided $34.1 billion in multifamily financing in the first half of 2019, which supported 354,000 units of multifamily housing. Approximately 90% of the multifamily units the company financed were affordable to families earning at or below 120% of the area median income, providing support for both affordable and workforce housing. Through the second quarter of 2019, Fannie Mae continued to be one of the largest issuers of Green bonds in the world, issuing $6.8 billion in Green bonds in the first half of 2019 and over $58 billion since inception of the program. | |
| | | |
| Ÿ | Fannie Mae continued to share credit risk with lenders on nearly 100% of the company’s new multifamily business volume, primarily through its Delegated Underwriting and Servicing (DUS®) program. To complement the company’s lender loss sharing program through DUS, the company has completed five multifamily Credit Insurance Risk Transfer™ (CIRT™) transactions to date. As of June 30, 2019, $48 billion in multifamily mortgages or 15% of the loans in the company’s multifamily guaranty book of business, measured by unpaid principal balance, were covered by a CIRT transaction. | | |

|
| | |
| Second Quarter 2019 Results | 1 |
WASHINGTON, DC — Fannie Mae (FNMA/OTCQB) reported net income of $3.4 billion and comprehensive income of $3.4 billion for the second quarter of 2019. The company reported a net worth of $6.4 billion as of June 30, 2019. As a result, Fannie Mae expects to pay a $3.4 billion dividend to Treasury by September 30, 2019.
SUMMARY OF FANNIE MAE’S FINANCIAL PERFORMANCE
Condensed Consolidated Results
(Dollars in billions)
Fannie Mae’s net income of $3.4 billion for the second quarter of 2019 compares with net income of $2.4 billion for the first quarter of 2019. The increase in net income in the second quarter of 2019 was driven primarily by increases in credit-related income, net interest income, and investment gains during the quarter.
|
| | |
| Second Quarter 2019 Results | 2 |
|
|
| Summary of Financial Results |
|
| | | | | | | | | | | | | | | | | | | | | | | | |
| (Dollars in millions) | | 2Q19 | | 1Q19 | | Variance | | 2Q19 | | 2Q18 | | Variance |
| Net interest income | | $ | 5,150 |
| | $ | 4,733 |
| | $ | 417 |
| | $ | 5,150 |
| | $ | 5,377 |
| | $ | (227 | ) |
| Fee and other income | | 246 |
| | 227 |
| | 19 |
| | 246 |
| | 239 |
| | 7 |
|
| Net revenues | | 5,396 |
| | 4,960 |
| | 436 |
| | 5,396 |
| | 5,616 |
| | (220 | ) |
| Investment gains, net | | 461 |
| | 133 |
| | 328 |
| | 461 |
| | 277 |
| | 184 |
|
| Fair value gains (losses), net | | (754 | ) | | (831 | ) | | 77 |
| | (754 | ) | | 229 |
| | (983 | ) |
| Administrative expenses | | (744 | ) | | (744 | ) | | — |
| | (744 | ) | | (755 | ) | | 11 |
|
| Credit-related income | | | | | |
| | | | | | |
| Benefit for credit losses | | 1,225 |
| | 650 |
| | 575 |
| | 1,225 |
| | 1,296 |
| | (71 | ) |
| Foreclosed property expense | | (128 | ) | | (140 | ) | | 12 |
| | (128 | ) | | (139 | ) | | 11 |
|
| Total credit-related income | | 1,097 |
| | 510 |
| | 587 |
| | 1,097 |
| | 1,157 |
| | (60 | ) |
| Temporary Payroll Tax Cut Continuation Act of 2011 (TCCA) fees | | (600 | ) | | (593 | ) | | (7 | ) | | (600 | ) | | (565 | ) | | (35 | ) |
| Other expenses, net | | (535 | ) | | (408 | ) | | (127 | ) | | (535 | ) | | (366 | ) | | (169 | ) |
| Income before federal income taxes | | 4,321 |
| | 3,027 |
| | 1,294 |
| | 4,321 |
| | 5,593 |
| | (1,272 | ) |
| Provision for federal income taxes | | (889 | ) | | (627 | ) | | (262 | ) | | (889 | ) | | (1,136 | ) | | 247 |
|
| Net income | | $ | 3,432 |
| | $ | 2,400 |
| | $ | 1,032 |
| | $ | 3,432 |
| | $ | 4,457 |
| | $ | (1,025 | ) |
| Total comprehensive income | | $ | 3,365 |
| | $ | 2,361 |
| | $ | 1,004 |
| | $ | 3,365 |
| | $ | 4,459 |
| | $ | (1,094 | ) |
Net revenues, which consist of net interest income and fee and other income, were $5.4 billion for the second quarter of 2019, compared with $5.0 billion for the first quarter of 2019.
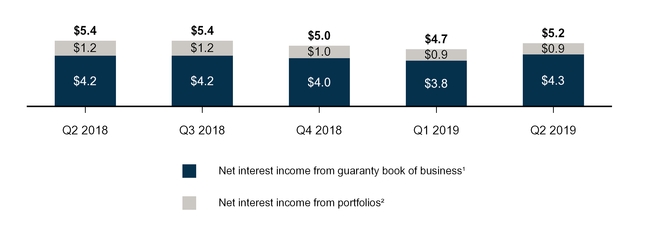
Net interest income was $5.2 billion for the second quarter of 2019, compared with $4.7 billion for the first quarter of 2019. The increase in net interest income for the second quarter of 2019 was due primarily to higher amortization income from the company’s guaranty book of business driven by an increase in mortgage prepayment activity in the second quarter of 2019 due to the declining interest rate environment.
Fannie Mae’s net interest income is derived from two primary sources: guaranty fees the company receives for managing the credit risk on loans underlying Fannie Mae MBS held by third parties; and the difference between interest income earned on the assets in the company’s retained mortgage portfolio and its other investments portfolio (collectively, its portfolios) and the interest expense associated with the debt that funds those assets. More than 80 percent of Fannie Mae’s net interest income in the second quarter of 2019 was derived from the loans underlying Fannie Mae MBS in consolidated trusts, which primarily generate income through guaranty fees. Guaranty fees consist of two primary components: base guaranty fees that the company receives over the life of the loan; and amortization income, which consists of upfront fees that the company receives at the time of loan acquisition primarily related to single-family loan-level pricing adjustments and other fees received from lenders; these fees are amortized into net interest income as cost basis adjustments over the contractual life of the loan.
|
| | |
| Second Quarter 2019 Results | 3 |
Net Interest Income
(Dollars in billions)
| |
(1) | Includes revenues generated by the 10 basis point guaranty fee increase the company implemented pursuant to the TCCA, the incremental revenue from which is remitted to Treasury and not retained by us. |
| |
(2) | Includes interest income from assets held in the company’s retained mortgage portfolio and other investments portfolio, as well as other assets used to generate lender liquidity. Also includes interest expense on the company’s outstanding Connecticut Avenue Securities®. |
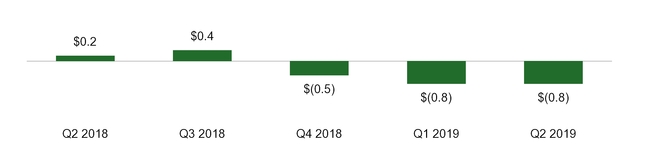
Net fair value losses were $754 million in the second quarter of 2019, compared with $831 million in the first quarter of 2019. Net fair value losses in the second quarter of 2019 were driven primarily by:
| |
| • | losses on commitments to sell mortgage-related securities as a result of increases in the prices of securities as interest rates decreased during the commitment periods; |
| |
| • | net interest expense accruals on risk management derivatives combined with decreases in the fair value of pay-fixed risk management derivatives due to declines in longer-term swap rates during the second quarter of 2019, which were partially offset by increases in the fair value of the company’s receive-fixed risk management derivatives; and |
| |
| • | increases in the fair value of long-term debt of consolidated trusts resulting in fair value losses driven by a decline in interest rates during the second quarter of 2019. |
The estimated fair value of the company’s derivatives, trading securities, and other financial instruments carried at fair value may fluctuate substantially from period to period because of changes in interest rates, the yield curve, mortgage and credit spreads, implied volatility, and activity related to these financial instruments. While the estimated fair value of the company’s derivatives that serve to mitigate certain risk exposures may fluctuate, some of the financial instruments that generate these exposures are not recorded at fair value in the company’s condensed consolidated financial statements. The company is developing capabilities to implement hedge accounting to reduce interest rate volatility in its consolidated statements of operations and comprehensive income.
Net Fair Value Gains (Losses)
(Dollars in billions)
|
| | |
| Second Quarter 2019 Results | 4 |
Credit-related income consists of a benefit or provision for credit losses and foreclosed property expense. Credit-related income was $1.1 billion in the second quarter of 2019, compared with $510 million in the first quarter of 2019. The increase in credit-related income in the second quarter of 2019 was driven primarily by the redesignation of reperforming single-family mortgage loans from held-for-investment to held-for-sale and higher actual and forecasted home prices compared with the first quarter of 2019.
Fannie Mae’s credit-related income or expense can vary substantially from period to period based on a number of factors such as changes in actual and expected home prices, fluctuations in interest rates, borrower payment behavior, the overall size of the company’s allowance, events such as natural disasters, the types and volume of its loss mitigation activities, the volume of foreclosures completed, and redesignations of loans from held-for-investment to held-for-sale. In addition, the company’s credit-related income or expense and its loss reserves can be impacted by updates to the models, assumptions, and data used in determining its allowance for loan losses.
While the redesignation of certain reperforming and nonperforming single-family loans from held-for-investment to held-for-sale has been a significant driver of credit-related income in recent periods, the company may see a reduced impact from this activity in the future to the extent the population of loans it is considering for redesignation declines. Further, Fannie Mae’s implementation of ASU 2016-13, Financial Instruments—Credit Losses (Topic 326), Measurement of Credit Losses on Financial Instruments (the CECL standard) on January 1, 2020 will likely introduce additional volatility in the company’s results as credit-related income or expense will include expected lifetime losses on the company’s loans and other financial instruments subject to the standard and thus become more sensitive to fluctuations in the factors detailed above.
Credit-Related Income
(Dollars in billions)
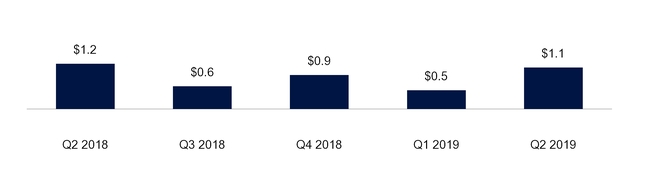
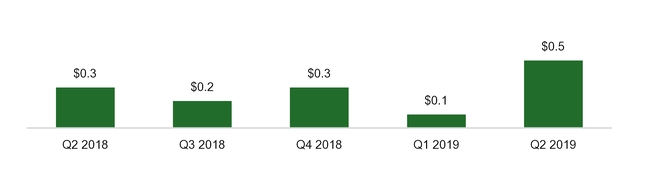
Investment gains were $461 million in the second quarter of 2019, compared with $133 million in the first quarter of 2019. The increase in investment gains was driven primarily by sales of single-family loans and available-for-sale securities in the second quarter of 2019.
Investment Gains
(Dollars in billions)
|
| | |
| Second Quarter 2019 Results | 5 |
FINANCIAL PERFORMANCE OUTLOOK
Fannie Mae’s long-term financial performance will depend on many factors, including:
| |
| • | the size of and its share of the U.S. mortgage market, which in turn will depend upon such factors as population growth, household formation, and home price appreciation; and |
| |
| • | actions by FHFA, the Administration, and Congress relating to its business and housing finance reform, including the capital requirements that will be applicable to the company, its ongoing financial obligations to Treasury, and its competitive environment. |
While Fannie Mae expects to remain profitable on an annual basis for the foreseeable future, certain factors could result in significant volatility in the company’s financial results from quarter to quarter or year to year. Fannie Mae expects quarterly volatility in its financial results due to a number of factors, particularly changes in market conditions that result in fluctuations in the estimated fair value of derivatives and other financial instruments that it marks to market through its earnings. Other factors that may result in volatility in the company’s quarterly financial results include factors that affect its loss reserves, such as redesignations of loans from held for investment to held for sale, changes in interest rates, home prices or accounting standards, or events such as natural disasters, and other factors, as the company discusses in “Risk Factors” and “Consolidated Results of Operations” in its 2018 Form 10-K and in its Second Quarter 2019 Form 10-Q. Further, Fannie Mae’s implementation on January 1, 2020 of the CECL standard will likely introduce additional volatility in the company’s results as credit-related income or expense will include expected lifetime losses on the company’s loans and other financial instruments subject to the standard and thus become more sensitive to fluctuations in these factors.
The potential for significant volatility in the company’s financial results could result in a net loss in a future quarter. Fannie Mae is permitted to retain up to $3.0 billion in capital reserves as a buffer in the event of a net loss in a future quarter. However, any net loss the company experiences in the future could be greater than the amount of its capital reserves, which would result in a net worth deficit for that quarter. For example, the company currently estimates that its implementation of the CECL standard will result in a reduction in the company’s retained earnings in the first quarter of 2020 of up to $4 billion on an after-tax basis, which could result in a net worth deficit for that quarter. As described further in “Note 1, Summary of Significant Accounting Policies—New Accounting Guidance,” this estimate is based on a number of assumptions and the company is still assessing the impact of various implementation issues relating to the CECL standard, as well as recently proposed accounting guidance relating to the standard. The resolution of these items may reduce CECL’s impact on its retained earnings upon adoption. Whether the company’s implementation of the CECL standard will result in a net worth deficit will depend on a number of factors, including the composition of the company’s book of business, its expectations of future economic conditions, its results of operations for the second half of 2019 and the first quarter of 2020, and the resolution of the issues described above. If the company experiences a net worth deficit in a future quarter, it will be required to draw funds from Treasury under its senior preferred stock purchase agreement with Treasury to avoid being placed into receivership. See “Risk Factors” in the company’s 2018 Form 10-K for a discussion of the risks associated with the limitations on its ability to rebuild its capital reserves, including factors that could result in a net loss or net worth deficit in a future quarter.
|
| | |
| Second Quarter 2019 Results | 6 |
PROVIDING LIQUIDITY AND SUPPORT TO THE MARKET
Fannie Mae provided $247.2 billion in liquidity to the mortgage market in the first half of 2019. Through its purchases and guarantees of mortgage loans in the first half of 2019, Fannie Mae acquired approximately 870,000 single-family mortgage loans. Fannie Mae also financed approximately 354,000 units of multifamily housing in the first half of 2019.
Fannie Mae Provided $247.2 Billion in Liquidity in the First Half of 2019
|
| | | | | |
| | $34.1B | | 354K
Multifamily Rental Units |
| |
| |
| | | | | | |
| | $135.5B | | 546K
Single-Family Home Purchases |
| |
| |
| | | | | | |
| | $77.6B | | 324K
Single-Family Refinancings |
| |
| |
| | | | | | |
| | Unpaid Principal Balance | | Units |
SUMMARY OF SECOND QUARTER 2019 BUSINESS SEGMENT RESULTS
Fannie Mae’s two reportable business segments—Single-Family and Multifamily—engage in complementary business activities to provide liquidity, access to credit, and affordability in all U.S. housing markets at all times, while effectively managing risk. Fannie Mae is pursuing four strategic objectives: advancing a sustainable and reliable business model with low risk to the housing finance system and taxpayers; providing great service to its customers and partners, enabling them to serve the needs of American households more effectively; supporting and sustainably increasing access to credit and affordable housing; and building a simple, efficient, innovative, and continuously improving company.
Single-Family Business |
| | | | | | | | | | | | | | | | | | | | | | | | |
| (Dollars in millions) | | 2Q19 | | 1Q19 | | Variance | | 2Q19 | | 2Q18 | | Variance |
| Single-Family Segment: | | | | | | | | | | | | |
| Net interest income | | $ | 4,419 |
| | $ | 4,039 |
| | $ | 380 |
| | $ | 4,419 |
| | $ | 4,723 |
| | $ | (304 | ) |
| Fee and other income | | 88 |
| | 106 |
| | (18 | ) | | 88 |
| | 69 |
| | 19 |
|
| Net revenues | | 4,507 |
| | 4,145 |
| | 362 |
| | 4,507 |
| | 4,792 |
| | (285 | ) |
| Investment gains, net | | 417 |
| | 94 |
| | 323 |
| | 417 |
| | 252 |
| | 165 |
|
| Fair value gains (losses), net | | (758 | ) | | (887 | ) | | 129 |
| | (758 | ) | | 278 |
| | (1,036 | ) |
| Administrative expenses | | (634 | ) | | (631 | ) | | (3 | ) | | (634 | ) | | (649 | ) | | 15 |
|
| Credit-related income | | 1,126 |
| | 518 |
| | 608 |
| | 1,126 |
| | 1,159 |
| | (33 | ) |
| TCCA fees | | (600 | ) | | (593 | ) | | (7 | ) | | (600 | ) | | (565 | ) | | (35 | ) |
| Other expenses, net | | (418 | ) | | (337 | ) | | (81 | ) | | (418 | ) | | (270 | ) | | (148 | ) |
| Income before federal income taxes | | 3,640 |
| | 2,309 |
| | 1,331 |
| | 3,640 |
| | 4,997 |
| | (1,357 | ) |
| Provision for federal income taxes | | (769 | ) | | (484 | ) | | (285 | ) | | (769 | ) | | (1,044 | ) | | 275 |
|
| Net income | | $ | 2,871 |
| | $ | 1,825 |
| | $ | 1,046 |
| | $ | 2,871 |
| | $ | 3,953 |
| | $ | (1,082 | ) |
|
| | |
| Second Quarter 2019 Results | 7 |
Financial Results
| |
| • | Single-Family net income was $2.9 billion in the second quarter of 2019, compared with $1.8 billion in the first quarter of 2019. The increase in net income in the second quarter of 2019 was driven primarily by: |
| |
| ◦ | an increase in credit-related income driven primarily by the redesignation of reperforming single-family mortgage loans from held-for-investment to held-for-sale and higher actual and forecasted home prices compared with the first quarter of 2019, |
| |
| ◦ | higher net interest income due primarily to higher amortization income from the company’s guaranty book of business driven by an increase in mortgage prepayment activity in the second quarter of 2019 due to a lower interest rate environment during the quarter, and |
| |
| ◦ | an increase in investment gains driven primarily by sales of single-family loans and available-for-sale securities in the second quarter of 2019. |
Business Highlights
| |
| • | The single-family conventional guaranty book of business remained relatively flat in the second quarter of 2019, while the average charged guaranty fee, net of Temporary Payroll Tax Cut Continuation Act of 2011 (TCCA) fees, on the single-family conventional guaranty book in the second quarter increased slightly from the prior quarter to 43.4 basis points. |
| |
| • | Fannie Mae’s Single-Family business provided $128 billion in liquidity to the mortgage market in the second quarter of 2019. Through its purchases and guarantees of mortgage loans in the second quarter of 2019, the company acquired approximately 514,000 mortgage loans, comprised of 317,000 home purchase loans and 197,000 refinancings. |
| |
| • | The single-family serious delinquency rate was 0.70% as of June 30, 2019, a decrease from 0.76% as of December 31, 2018. |
Multifamily Business |
| | | | | | | | | | | | | | | | | | | | | | | | |
| (Dollars in millions) | | 2Q19 | | 1Q19 | | Variance | | 2Q19 | | 2Q18 | | Variance |
| Multifamily Segment: | | | | | | | | | | | | |
| Net interest income | | $ | 731 |
| | $ | 694 |
| | $ | 37 |
| | $ | 731 |
| | $ | 654 |
| | $ | 77 |
|
| Fee and other income | | 158 |
| | 121 |
| | 37 |
| | 158 |
| | 170 |
| | (12 | ) |
| Net revenues | | 889 |
| | 815 |
| | 74 |
| | 889 |
| | 824 |
| | 65 |
|
| Fair value gains (losses), net | | 4 |
| | 56 |
| | (52 | ) | | 4 |
| | (49 | ) | | 53 |
|
| Administrative expenses | | (110 | ) | | (113 | ) | | 3 |
| | (110 | ) | | (106 | ) | | (4 | ) |
| Credit-related expense | | (29 | ) | | (8 | ) | | (21 | ) | | (29 | ) | | (2 | ) | | (27 | ) |
| Other expenses | | (73 | ) | | (32 | ) | | (41 | ) | | (73 | ) | | (71 | ) | | (2 | ) |
| Income before federal income taxes | | 681 |
| | 718 |
| | (37 | ) | | 681 |
| | 596 |
| | 85 |
|
| Provision for federal income taxes | | (120 | ) | | (143 | ) | | 23 |
| | (120 | ) | | (92 | ) | | (28 | ) |
| Net income | | $ | 561 |
| | $ | 575 |
| | $ | (14 | ) | | $ | 561 |
| | $ | 504 |
| | $ | 57 |
|
Financial Results
| |
| • | Multifamily net income was $561 million in the second quarter of 2019, compared with $575 million in the first quarter of 2019. Net income for the second quarter of 2019 was driven by guaranty fee revenue as the multifamily guaranty book continued to grow, partially offset by lower average charged guaranty fees. |
Business Highlights
| |
| • | The multifamily guaranty book of business reached over $320 billion in the second quarter of 2019, while the average charged guaranty fee on the multifamily book decreased slightly from the prior quarter to 73.3 basis points as of June 30, 2019. |
| |
| • | New multifamily business volume was relatively flat at $17.2 billion in the second quarter of 2019, compared with $16.9 billion in the first quarter of 2019. The Federal Housing Finance Agency’s (FHFA) 2019 conservatorship scorecard includes an objective to maintain the dollar volume of new multifamily business |
|
| | |
| Second Quarter 2019 Results | 8 |
at or below $35 billion, excluding certain targeted affordable and underserved market business segments. Approximately 56%, or $19.2 billion, of the company’s multifamily business volume in the first half of 2019 counted toward FHFA’s 2019 multifamily volume cap.
| |
| • | Fannie Mae’s multifamily financing in the second quarter of 2019 supported 183,000 units of multifamily housing. More than 90% of the multifamily units the company financed in the second quarter of 2019 were affordable to families earning at or below 120% of the area median income, providing support for both affordable and workforce housing. |
| |
| • | The multifamily serious delinquency rate was 0.05% as of June 30, 2019, a decrease from 0.06% as of December 31, 2018. |
CREDIT RISK TRANSFER TRANSACTIONS
Fannie Mae continues to innovate and improve its credit risk transfer programs, expanding the types of loans covered and promoting the continued growth of the credit risk transfer market. For single-family mortgages, this includes Fannie Mae’s benchmark Connecticut Avenue Securities® (CAS) REMIC™ transactions and its Credit Insurance Risk Transfer (CIRT) transactions. In these transactions, the company transfers to investors a portion of the credit risk associated with losses on a reference pool of mortgage loans and in exchange pays investors a premium that effectively reduces the guaranty fee income the company retains on the loans.
The CAS REMIC enhancement in November 2018 to the company’s CAS program was designed to promote the continued growth of the market by expanding the potential investor base for these securities and limiting investor exposure to Fannie Mae counterparty risk, without disrupting the to-be-announced (TBA) MBS market. The structure also aligns the timing of the company’s recognition of provisions for credit losses with the related recovery from CAS REMIC transactions, which differs from the company’s previous CAS structures. Fannie Mae updated the following terms of its July 2019 CAS REMIC transaction compared to its prior CAS REMIC transactions: extended the term from 12.5 years to 20 years; shortened the call option from 10 years to 7 years; and retained a smaller first-loss position (that is, investors purchased a larger portion of the risk that the company refers to as the first-loss tranche). These updates were primarily designed to further reduce the amount of capital the company would be required to hold for the associated loans in the reference pool under FHFA’s proposed capital framework. Fannie Mae currently expects that its future CAS REMIC transactions will contain similar terms.
During the first half of 2019, the company transferred a portion of the mortgage credit risk on single-family mortgages with an unpaid principal balance of $148 billion at the time of the transactions. As of June 30, 2019, approximately 42% of the loans in the company’s single-family conventional guaranty book of business, measured by unpaid principal balance, were included in a reference pool for a credit risk transfer transaction.
Fannie Mae continued to transfer a portion of the credit risk on multifamily mortgages, and nearly 100% of the company’s new multifamily business volume in the first half of 2019 had lender risk-sharing, primarily through the company’s Delegated Underwriting and Servicing (DUS®) program. To complement the company’s lender loss sharing program through DUS, Fannie Mae also transfers a portion of the mortgage credit risk on multifamily loans in its multifamily guaranty book of business to insurers and reinsurers through multifamily CIRT transactions.
SINGLE SECURITY INITIATIVE AND COMMON SECURITIZATION PLATFORM
On June 3, 2019, Fannie Mae and Freddie Mac began issuing single-family uniform mortgage-backed securities (UMBS™). Fannie Mae also began using the common securitization platform operated by Common Securitization Solutions, LLC (CSS) to perform certain aspects of the securitization process for its single-family Fannie Mae MBS issuances beginning in May 2019. This represents the final implementation of the Single Security Initiative that Fannie Mae, Freddie Mac, and FHFA have been working on since 2014. The objective of the Single Security Initiative is to enhance the overall liquidity of Fannie Mae and Freddie Mac mortgage-backed securities eligible for trading in the TBA market by supporting their fungibility without regard to which company is the issuer. The Single Security Initiative and the common securitization platform represent significant changes for the mortgage market and for Fannie Mae’s securitization operations and business.
|
| | |
| Second Quarter 2019 Results | 9 |
Mortgage loans backing UMBS are limited to fixed-rate mortgage loans eligible for financing through the TBA market. Fannie Mae continues to issue some types of Fannie Mae MBS that are not TBA-eligible and therefore are not issued as UMBS, such as single-family Fannie Mae MBS backed by adjustable-rate mortgages and all multifamily Fannie Mae MBS.
The Single Security Initiative has increased Fannie Mae’s credit risk exposure and operational risk exposure to Freddie Mac, and its risk exposure to Freddie Mac is expected to increase as the company issues more structured securities backed by Freddie Mac securities going forward. With implementation of the Single Security Initiative, Fannie Mae now issues structured securities backed by Fannie Mae MBS, Freddie Mac securities, or both. Fannie Mae’s inclusion of Freddie Mac securities as collateral for the structured securities that the company issues increases its counterparty credit risk exposure to Freddie Mac. In the event Freddie Mac were to fail (for credit or operational reasons) to make a payment on a payment date on Freddie Mac securities that Fannie Mae had resecuritized in a Fannie Mae-issued structured security, Fannie Mae would be responsible for making the entire payment on the Freddie Mac securities included in that structured security in order to make payments on any of its outstanding single-family Fannie Mae MBS to be paid on that payment date. Accordingly, as the amount of structured securities Fannie Mae issues that are backed by Freddie Mac securities grows, if Freddie Mac were to fail to meet its obligations to Fannie Mae under the terms of these securities, it could have a material adverse effect on Fannie Mae’s earnings and financial condition. Fannie Mae believes the risk of default by Freddie Mac is negligible because of the funding commitment available to Freddie Mac through its senior preferred stock purchase agreement with Treasury. As described in Fannie Mae’s Second Quarter 2019 Form 10-Q in “Single Security Initiative & Common Securitization Platform,” in June 2019, Fannie Mae and Freddie Mac entered into an indemnification agreement pursuant to which Freddie Mac has agreed to indemnify Fannie Mae for losses caused by its failure to meet its payment and certain other obligations relating to the Freddie Mac securities that Fannie Mae has resecuritized into Fannie Mae-issued structured securities.
As of June 30, 2019, approximately $7.7 billion in Freddie Mac securities were backing Fannie Mae-issued structured securities. Fannie Mae had no such transactions or activity in 2018. See “Single Security Initiative & Common Securitization Platform” and “Risk Factors” in the company’s Second Quarter 2019 Form 10-Q for more information on the Single Security Initiative and the risks associated with the Single Security Initiative.
|
| | |
| Second Quarter 2019 Results | 10 |
ABOUT FANNIE MAE’S CONSERVATORSHIP AND AGREEMENTS WITH TREASURY
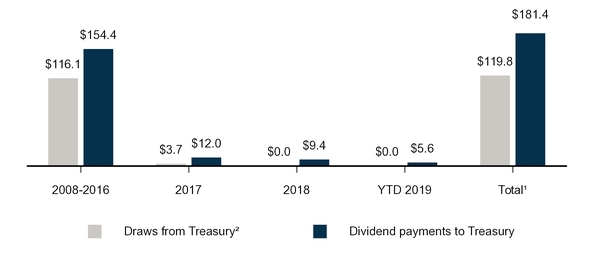
Fannie Mae has operated under the conservatorship of FHFA since September 6, 2008. Treasury has made a commitment under a senior preferred stock purchase agreement to provide funding to Fannie Mae under certain circumstances if the company has a net worth deficit. Pursuant to this agreement and the senior preferred stock the company issued to Treasury in 2008, the conservator has declared and directed Fannie Mae to pay dividends to Treasury on a quarterly basis for every dividend period for which dividends were payable since the company entered conservatorship in 2008.
The chart below shows all of the funds Fannie Mae has drawn from Treasury pursuant to the senior preferred stock purchase agreement, as well as all of the dividends the company has paid to Treasury on the senior preferred stock.
Treasury Draws and Dividend Payments: 2008 - Q2 2019
(Dollars in billions)
| |
(1) | Under the terms of the senior preferred stock purchase agreement, dividend payments we make to Treasury do not offset our prior draws of funds from Treasury. Amounts may not sum due to rounding. |
| |
(2) | Treasury draws are shown in the period for which requested, not when the funds were received by us. Draw requests have been funded in the quarter following a net worth deficit. |
Fannie Mae expects to pay Treasury a third quarter 2019 dividend of $3.4 billion by September 30, 2019. The terms of the senior preferred stock currently provide for dividends each quarter in the amount, if any, by which the company’s net worth as of the end of the prior quarter exceeds a $3.0 billion capital reserve amount.
As of the date of this filing, the maximum amount of remaining funding under the agreement is $113.9 billion. If the company were to draw additional funds from Treasury under the agreement with respect to a future period, the amount of remaining funding under the agreement would be reduced by the amount of its draw. Dividend payments the company makes to Treasury do not restore or increase the amount of funding available to it under the agreement. For a description of the terms of the senior preferred stock purchase agreement and the senior preferred stock, see “Conservatorship, Treasury Agreements and Housing Finance Reform—Treasury Agreements” in the company’s 2018 Form 10-K.
Although Treasury owns Fannie Mae’s senior preferred stock and a warrant to purchase 79.9% of the company’s common stock and has made a commitment under the senior preferred stock purchase agreement to provide the company with funds to maintain a positive net worth under specified conditions, the U.S. government does not guarantee the company’s securities or other obligations.
—
|
| | |
| Second Quarter 2019 Results | 11 |
Fannie Mae’s financial statements for the second quarter of 2019 are available in the accompanying Annex; however, investors and interested parties should read the company’s quarterly report on Form 10-Q for the quarter ended June 30, 2019 (Second Quarter 2019 Form 10-Q), which was filed today with the Securities and Exchange Commission and is available on Fannie Mae’s website, www.fanniemae.com. The company provides further discussion of its financial results and condition, credit performance, and other matters in its Second Quarter 2019 Form 10-Q. Additional information about the company’s financial and credit performance is contained in the Fannie Mae Quarterly Financial Supplement Q2 2019 at www.fanniemae.com.
# # #
In this release, the company has presented a number of estimates, forecasts, expectations, and other forward-looking statements, including statements regarding: the company’s business plans and strategies, and the impact of these plans and strategies; the company’s future profitability, financial condition and financial performance, and the factors that will affect them; volatility in the company’s future results, factors that may affect that volatility, and efforts the company may make to address volatility; the company’s dividend payments to Treasury; the company’s expectations regarding the impact of the Single Security Initiative, as well as the company’s beliefs regarding the risk of default by Freddie Mac; the company’s plans relating to and the effects of the company’s credit risk transfer transactions; and the impact of accounting guidance and accounting changes on the company’s business or financial results, including the impact of the CECL standard. These estimates, forecasts, expectations, and statements are forward-looking statements based on the company’s current assumptions regarding numerous factors. Actual results, and future projections, could be materially different from what is set forth in the forward-looking statements as a result of: the uncertainty of the company’s future; future legislative or regulatory requirements or changes that have a significant impact on the company’s business, such as the enactment of housing finance reform legislation, including all or any portion of the to-be-developed Treasury Housing Reform Plan; home price changes; interest rate and credit spread changes; macroeconomic factors such as U.S. gross domestic product, unemployment rates, personal income, and the volume of mortgage originations; the size and the company’s share of the U.S. mortgage market and the factors that affect them, including population growth and household formation; the company’s future serious delinquency rates; the company’s and its competitors’ future guaranty fee pricing and the impact of that pricing on the company’s guaranty fee revenues and competitive environment; credit availability; changes in borrower behavior; the effectiveness of its loss mitigation strategies; significant changes in modification and foreclosure activity; the volume and pace of future nonperforming and reperforming loan sales and their impact on the company’s results and serious delinquency rates; the effectiveness of its management of its real estate owned inventory and pursuit of contractual remedies; changes in the fair value of its assets and liabilities; the company’s reliance on CSS and the common securitization platform for the operation of many of its securitization activities; the stability and adequacy of the systems and infrastructure that impact the company’s operations, including the company’s and those of CSS, its other counterparties and other third parties on which the business relies; actions by FHFA, Treasury, the Department of Housing and Urban Development or other regulators that affect the company’s business; the size, composition and quality of the company’s guaranty book of business and retained mortgage portfolio; the competitive landscape in which the company operates, including the impact of legislative or other developments on levels of competition in its industry and other factors affecting its market share; the life of the loans in the company’s guaranty book of business; the company’s reliance on and future updates it makes to its models, including the assumptions used by these models; changes in generally accepted accounting principles; changes to the company’s accounting policies; effects from activities the company takes to support the mortgage market and help borrowers; the company’s future objectives and activities in support of those objectives, including actions the company may take to reach additional underserved creditworthy borrowers; actions the company may be required to take by FHFA, in its role as the company’s conservator or as its regulator, such as changes in the type of business the company does; limitations on the company’s business imposed by FHFA, in its role as the company’s conservator or as its regulator; the conservatorship, including any changes to or termination (by receivership or otherwise) of the conservatorship and its effect on the company’s business; the investment by Treasury and its effect on the company’s business; challenges the company faces in retaining and hiring qualified executives and other employees; the deteriorated credit performance of many loans in the company’s guaranty book of business; a decrease in the company’s credit ratings; defaults by one or more institutional counterparties; resolution or settlement agreements the company may enter into with its counterparties; operational control weaknesses; changes in the fiscal and monetary policies of the Federal Reserve; changes in the structure and regulation of the financial services industry; the company’s ability to access the debt markets; changes in the demand for Fannie Mae MBS; disruptions or instability in the housing and credit markets; uncertainties relating to the potential phasing out of LIBOR, or other market changes that could impact the loans the company owns or guarantees or its MBS; the company’s need to rely on third parties to fully achieve some of its corporate objectives; the company’s reliance on mortgage servicers; domestic and global political risks and uncertainties; natural disasters, environmental disasters, terrorist attacks, pandemics, or other major disruptive events; cyber attacks or other information security breaches or threats; and many other factors, including those discussed in the “Risk Factors” and “Forward-Looking Statements” sections of and elsewhere in the company’s 2018 Form 10-K, Second Quarter 2019 Form 10-Q, and elsewhere in this release.
Fannie Mae provides website addresses in its news releases solely for readers’ information. Other content or information appearing on these websites is not part of this release.
Fannie Mae helps make the 30-year fixed-rate mortgage and affordable rental housing possible for millions of Americans. We partner with lenders to create housing opportunities for families across the country. We are driving positive changes in housing finance to make the home buying process easier, while reducing costs and risk. To learn more, visit fanniemae.com and follow us on twitter.com/fanniemae.
|
| | |
| Second Quarter 2019 Results | 12 |
ANNEX
FANNIE MAE
(In conservatorship)
Condensed Consolidated Balance Sheets — (Unaudited)
(Dollars in millions)
|
| | | | | | | | | | | |
| | As of |
| | June 30, 2019 | | December 31, 2018 |
| | |
| ASSETS |
| Cash and cash equivalents | | $ | 30,791 |
| | | | $ | 25,557 |
| |
| Restricted cash (includes $24,765 and $17,849, respectively, related to consolidated trusts) | | 30,179 |
| | | | 23,866 |
| |
| Federal funds sold and securities purchased under agreements to resell or similar arrangements | | 19,562 |
| | | | 32,938 |
| |
| Investments in securities: | | | | | | | |
| Trading, at fair value (includes $2,775 and $3,061, respectively, pledged as collateral) | | 42,866 |
| | | | 41,867 |
| |
| Available-for-sale, at fair value | | 2,761 |
| | | | 3,429 |
| |
| Total investments in securities | | 45,627 |
| | | | 45,296 |
| |
| Mortgage loans: | | | | | | | |
| Loans held for sale, at lower of cost or fair value | | 11,220 |
| | | | 7,701 |
| |
| Loans held for investment, at amortized cost: | | | | | | | |
| Of Fannie Mae | | 105,580 |
| | | | 113,039 |
| |
| Of consolidated trusts | | 3,167,914 |
| | | | 3,142,858 |
| |
| Total loans held for investment (includes $8,479 and $8,922, respectively, at fair value) | | 3,273,494 |
| | | | 3,255,897 |
| |
| Allowance for loan losses | | (11,482 | ) | | | | (14,203 | ) | |
| Total loans held for investment, net of allowance | | 3,262,012 |
| | | | 3,241,694 |
| |
| Total mortgage loans | | 3,273,232 |
| | | | 3,249,395 |
| |
| Deferred tax assets, net | | 12,521 |
| | | | 13,188 |
| |
| Accrued interest receivable, net (includes $8,543 and $7,928, respectively, related to consolidated trusts) | | 9,089 |
| | | | 8,490 |
| |
| Acquired property, net | | 2,398 |
| | | | 2,584 |
| |
| Other assets | | 19,888 |
| | | | 17,004 |
| |
| Total assets | | $ | 3,443,287 |
| | | | $ | 3,418,318 |
| |
| LIABILITIES AND EQUITY |
| Liabilities: | | | | | | | |
| Accrued interest payable (includes $9,277 and $9,133, respectively, related to consolidated trusts) | | $ | 10,342 |
| | | | $ | 10,211 |
| |
| Debt: | | | | | | | |
| Of Fannie Mae (includes $6,370 and $6,826, respectively, at fair value) | | 216,814 |
| | | | 232,074 |
| |
| Of consolidated trusts (includes $22,771 and $23,753, respectively, at fair value) | | 3,199,765 |
| | | | 3,159,846 |
| |
| Other liabilities (includes $369 and $356, respectively, related to consolidated trusts) | | 10,001 |
| | | | 9,947 |
| |
| Total liabilities | | 3,436,922 |
| | | | 3,412,078 |
| |
| Commitments and contingencies (Note 13) | | — |
| | | | — |
| |
| Fannie Mae stockholders’ equity: | | | | | | | |
| Senior preferred stock, 1,000,000 shares issued and outstanding | | 120,836 |
| | | | 120,836 |
| |
| Preferred stock, 700,000,000 shares are authorized—555,374,922 shares issued and outstanding | | 19,130 |
| | | | 19,130 |
| |
| Common stock, no par value, no maximum authorization—1,308,762,703 shares issued and 1,158,087,567 shares outstanding | | 687 |
| | | | 687 |
| |
| Accumulated deficit | | (127,104 | ) | | | | (127,335 | ) | |
| Accumulated other comprehensive income | | 216 |
| | | | 322 |
| |
| Treasury stock, at cost, 150,675,136 shares | | (7,400 | ) | | | | (7,400 | ) | |
| Total stockholders’ equity (See Note 1: Senior Preferred Stock Purchase Agreement and Senior Preferred Stock for information on our dividend obligation to Treasury) | | 6,365 |
| | | | 6,240 |
| |
| Total liabilities and equity | | $ | 3,443,287 |
| | | | $ | 3,418,318 |
| |
See Notes to Condensed Consolidated Financial Statements in the Second Quarter 2019 Form 10-Q
|
| | |
| Second Quarter 2019 Results | 13 |
FANNIE MAE
(In conservatorship)
Condensed Consolidated Statements of Operations and Comprehensive Income — (Unaudited)
(Dollars in millions, except per share amounts)
|
| | | | | | | | | | | | | | | | | | | | | | | |
| | For the Three Months Ended June 30, | | For the Six Months Ended June 30, |
| | |
| | 2019 | | 2018 | | 2019 | | 2018 |
| Interest income: | | | | | | | | | | | | | | | |
| Trading securities | | $ | 432 |
| | | | $ | 318 |
| | | | $ | 859 |
| | | | $ | 554 |
| |
| Available-for-sale securities | | 45 |
| | | | 50 |
| | | | 98 |
| | | | 121 |
| |
| Mortgage loans (includes $28,102 and $26,521, respectively, for the three months ended and $56,547 and $52,819, respectively, for the six months ended related to consolidated trusts) | | 29,379 |
| | | | 28,307 |
| | | | 59,147 |
| | | | 56,341 |
| |
Federal funds sold and securities purchased under agreements to resell or similar arrangements
| | 257 |
| | | | 149 |
| | | | 520 |
| | | | 291 |
| |
| Other | | 41 |
| | | | 33 |
| | | | 73 |
| | | | 64 |
| |
| Total interest income | | 30,154 |
| | | | 28,857 |
| | | | 60,697 |
| | | | 57,371 |
| |
| Interest expense: | | | | | | | | | | | | | | | |
| Short-term debt | | (119 | ) | | | | (110 | ) | | | | (244 | ) | | | | (217 | ) | |
| Long-term debt (includes $23,407 and $21,896, respectively, for the three months ended and $47,596 and $43,611, respectively, for the six months ended related to consolidated trusts) | | (24,885 | ) | | | | (23,370 | ) | | | | (50,570 | ) | | | | (46,545 | ) | |
| Total interest expense | | (25,004 | ) | | | | (23,480 | ) | | | | (50,814 | ) | | | | (46,762 | ) | |
| Net interest income | | 5,150 |
| | | | 5,377 |
| | | | 9,883 |
| | | | 10,609 |
| |
| Benefit for credit losses | | 1,225 |
| | | | 1,296 |
| | | | 1,875 |
| | | | 1,513 |
| |
| Net interest income after benefit for credit losses | | 6,375 |
| | | | 6,673 |
| | | | 11,758 |
| | | | 12,122 |
| |
| Investment gains, net | | 461 |
| | | | 277 |
| | | | 594 |
| | | | 527 |
| |
| Fair value gains (losses), net | | (754 | ) | | | | 229 |
| | | | (1,585 | ) | | | | 1,274 |
| |
| Fee and other income | | 246 |
| | | | 239 |
| | | | 473 |
| | | | 559 |
| |
| Non-interest income (loss) | | (47 | ) | | | | 745 |
| | | | (518 | ) | | | | 2,360 |
| |
| Administrative expenses: | | | | | | | | | | | | | | | |
| Salaries and employee benefits | | (376 | ) | | | | (365 | ) | | | | (762 | ) | | | | (746 | ) | |
| Professional services | | (233 | ) | | | | (254 | ) | | | | (458 | ) | | | | (497 | ) | |
| Other administrative expenses | | (135 | ) | | | | (136 | ) | | | | (268 | ) | | | | (262 | ) | |
| Total administrative expenses | | (744 | ) | | | | (755 | ) | | | | (1,488 | ) | | | | (1,505 | ) | |
| Foreclosed property expense | | (128 | ) | | | | (139 | ) | | | | (268 | ) | | | | (301 | ) | |
| Temporary Payroll Tax Cut Continuation Act of 2011 (“TCCA”) fees | | (600 | ) | | | | (565 | ) | | | | (1,193 | ) | | | | (1,122 | ) | |
| Other expenses, net | | (535 | ) | | | | (366 | ) | | | | (943 | ) | | | | (569 | ) | |
| Total expenses | | (2,007 | ) | | | | (1,825 | ) | | | | (3,892 | ) | | | | (3,497 | ) | |
| Income before federal income taxes | | 4,321 |
| | | | 5,593 |
| | | | 7,348 |
| | | | 10,985 |
| |
| Provision for federal income taxes | | (889 | ) | | | | (1,136 | ) | | | | (1,516 | ) | | | | (2,267 | ) | |
| Net income | | 3,432 |
| | | | 4,457 |
| | | | 5,832 |
| | | | 8,718 |
| |
| Other comprehensive income (loss): | | | | | | | | | | | | | | | |
| Changes in unrealized gains on available-for-sale securities, net of reclassification adjustments and taxes | | (65 | ) | | | | 4 |
| | | | (101 | ) | | | | (316 | ) | |
| Other, net of taxes | | (2 | ) | | | | (2 | ) | | | | (5 | ) | | | | (5 | ) | |
| Total other comprehensive income (loss) | | (67 | ) | | | | 2 |
| | | | (106 | ) | | | | (321 | ) | |
| Total comprehensive income | | $ | 3,365 |
| | | | $ | 4,459 |
| | | | $ | 5,726 |
| | | | $ | 8,397 |
| |
| Net income | | $ | 3,432 |
| | | | $ | 4,457 |
| | | | $ | 5,832 |
| | | | $ | 8,718 |
| |
| Dividends distributed or available for distribution to senior preferred stockholder | | (3,365 | ) | | | | (4,459 | ) | | | | (5,726 | ) | | | | (5,397 | ) | |
| Net income (loss) attributable to common stockholders | | $ | 67 |
| | | | $ | (2 | ) | | | | $ | 106 |
| | | | $ | 3,321 |
| |
| Earnings per share: | | | | | | | | | | | | | | | |
| Basic | | $ | 0.01 |
| | | | $ | 0.00 |
| | | | $ | 0.02 |
| | | | $ | 0.58 |
| |
| Diluted | | 0.01 |
| | | | 0.00 |
| | | | 0.02 |
| | | | 0.56 |
| |
| Weighted-average common shares outstanding: | | | | | | | | | | | | | | | |
| Basic | | 5,762 |
| | | | 5,762 |
| | | | 5,762 |
| | | | 5,762 |
| |
| Diluted | | 5,893 |
| | | | 5,762 |
| | | | 5,893 |
| | | | 5,893 |
| |
See Notes to Condensed Consolidated Financial Statements in the Second Quarter 2019 Form 10-Q
|
| | |
| Second Quarter 2019 Results | 14 |
FANNIE MAE
(In conservatorship)
Condensed Consolidated Statements of Cash Flows — (Unaudited)
(Dollars in millions)
|
| | | | | | | | | | | |
| | For the Six Months Ended June 30, |
| | 2019 | | 2018 |
| Net cash provided by (used in) operating activities | | $ | 2,180 |
| | | | $ | (1,675 | ) | |
| Cash flows provided by investing activities: | | | | | | | |
| Proceeds from maturities and paydowns of trading securities held for investment | | 28 |
| | | | 141 |
| |
| Proceeds from sales of trading securities held for investment | | 49 |
| | | | 96 |
| |
| Proceeds from maturities and paydowns of available-for-sale securities | | 268 |
| | | | 417 |
| |
| Proceeds from sales of available-for-sale securities | | 376 |
| | | | 672 |
| |
| Purchases of loans held for investment | | (90,612 | ) | | | | (86,615 | ) | |
| Proceeds from repayments of loans acquired as held for investment of Fannie Mae | | 5,557 |
| | | | 7,945 |
| |
| Proceeds from sales of loans acquired as held for investment of Fannie Mae | | 5,821 |
| | | | 2,555 |
| |
| Proceeds from repayments and sales of loans acquired as held for investment of consolidated trusts | | 211,956 |
| | | | 202,923 |
| |
| Advances to lenders | | (54,440 | ) | | | | (55,151 | ) | |
| Proceeds from disposition of acquired property and preforeclosure sales | | 3,870 |
| | | | 4,848 |
| |
| Net change in federal funds sold and securities purchased under agreements to resell or similar arrangements | | 13,376 |
| | | | 3,170 |
| |
| Other, net | | (743 | ) | | | | (495 | ) | |
| Net cash provided by investing activities | | 95,506 |
| | | | 80,506 |
| |
| Cash flows used in financing activities: | | | | | | | |
| Proceeds from issuance of debt of Fannie Mae | | 374,284 |
| | | | 473,373 |
| |
| Payments to redeem debt of Fannie Mae | | (389,779 | ) | | | | (499,674 | ) | |
| Proceeds from issuance of debt of consolidated trusts | | 158,970 |
| | | | 172,507 |
| |
| Payments to redeem debt of consolidated trusts | | (224,145 | ) | | | | (239,297 | ) | |
| Payments of cash dividends on senior preferred stock to Treasury | | (5,601 | ) | | | | (938 | ) | |
| Proceeds from senior preferred stock purchase agreement with Treasury | | — |
| | | | 3,687 |
| |
| Other, net | | 132 |
| | | | (20 | ) | |
| Net cash used in financing activities | | (86,139 | ) | | | | (90,362 | ) | |
| Net increase (decrease) in cash, cash equivalents and restricted cash | | 11,547 |
| | | | (11,531 | ) | |
| Cash, cash equivalents and restricted cash at beginning of period | | 49,423 |
| | | | 60,260 |
| |
| Cash, cash equivalents and restricted cash at end of period | | $ | 60,970 |
| | | | $ | 48,729 |
| |
| Cash paid during the period for: | | | | | | | |
| Interest | | $ | 57,637 |
| | | | $ | 54,408 |
| |
| Income taxes | | 700 |
| | | | 460 |
| |
See Notes to Condensed Consolidated Financial Statements in the Second Quarter 2019 Form 10-Q
|
| | |
| Second Quarter 2019 Results | 15 |
FANNIE MAE
(In conservatorship)
Condensed Consolidated Statements of Changes in Equity (Deficit) — (Unaudited)
(Dollars and shares in millions, except per share amounts)
|
| | | | | | | | | | | | | | | | | | | | | | | | | | | | | | | | | | | | | |
| | | Fannie Mae Stockholders’ Equity (Deficit) |
| | | Shares Outstanding | | Senior
Preferred Stock | | Preferred
Stock | | Common
Stock | |
Accumulated
Deficit | | Accumulated
Other
Comprehensive
Income | | Treasury
Stock | | Total
Equity |
| | Senior
Preferred | | Preferred | | Common | |
| Balance as of March 31, 2019 | | 1 |
| | 556 |
| | 1,158 |
| | $ | 120,836 |
| | $ | 19,130 |
| | $ | 687 |
| | $ | (128,175 | ) | | $ | 283 |
| | $ | (7,400 | ) | | $ | 5,361 |
|
| Senior preferred stock dividends paid | | — |
| | — |
| | — |
| | — |
| | — |
| | — |
| | (2,361 | ) | | — |
| | — |
| | (2,361 | ) |
| Comprehensive income: | | | | | | | | | | | | | | | | | | | | |
| Net income | | — |
| | — |
| | — |
| | — |
| | — |
| | — |
| | 3,432 |
| | — |
| | — |
| | 3,432 |
|
| Other comprehensive income, net of tax effect: | | | | | | | | | | | | | | | | | | | | |
| Changes in net unrealized gains on available-for-sale securities (net of taxes of $3) | | — |
| | — |
| | — |
| | — |
| | — |
| | — |
| | — |
| | 9 |
| | — |
| | 9 |
|
| Reclassification adjustment for gains included in net income (net of taxes of $19) | | — |
| | — |
| | — |
| | — |
| | — |
| | — |
| | — |
| | (74 | ) | | — |
| | (74 | ) |
| Other (net of taxes of $0) | | — |
| | — |
| | — |
| | — |
| | — |
| | — |
| | — |
| | (2 | ) | | — |
| | (2 | ) |
| Total comprehensive income | | | | | | | | | | | | | | | | | | | | 3,365 |
|
| Balance as of June 30, 2019 | | 1 |
| | 556 |
| | 1,158 |
| | $ | 120,836 |
| | $ | 19,130 |
| | $ | 687 |
| | $ | (127,104 | ) | | $ | 216 |
| | $ | (7,400 | ) | | $ | 6,365 |
|
|
| | | | | | | | | | | | | | | | | | | | | | | | | | | | | | | | | | | | | |
| | | Fannie Mae Stockholders’ Equity (Deficit) |
| | | Shares Outstanding | | Senior
Preferred Stock | | Preferred
Stock | | Common
Stock | |
Accumulated
Deficit | | Accumulated
Other
Comprehensive
Income | | Treasury
Stock | | Total
Equity |
| | Senior
Preferred | | Preferred | | Common | |
| Balance as of December 31, 2018 | | 1 |
| | 556 |
| | 1,158 |
| | $ | 120,836 |
| | $ | 19,130 |
| | $ | 687 |
| | $ | (127,335 | ) | | $ | 322 |
| | $ | (7,400 | ) | | $ | 6,240 |
|
| Senior preferred stock dividends paid | | — |
| | — |
| | — |
| | — |
| | — |
| | — |
| | (5,601 | ) | | — |
| | — |
| | (5,601 | ) |
| Comprehensive income: | | | | | | | | | | | | | | | | | | | | |
| Net income | | — |
| | — |
| | — |
| | — |
| | — |
| | — |
| | 5,832 |
| | — |
| | — |
| | 5,832 |
|
| Other comprehensive income, net of tax effect: | | | | | | | | | | | | | | | | | | | | |
| Changes in net unrealized gains on available-for-sale securities (net of taxes of $5) | | — |
| | — |
| | — |
| | — |
| | — |
| | — |
| | — |
| | 17 |
| | — |
| | 17 |
|
| Reclassification adjustment for gains included in net income (net of taxes of $31) | | — |
| | — |
| | — |
| | — |
| | — |
| | — |
| | — |
| | (118 | ) | | — |
| | (118 | ) |
| Other (net of taxes of $1) | | — |
| | — |
| | — |
| | — |
| | — |
| | — |
| | — |
| | (5 | ) | | — |
| | (5 | ) |
| Total comprehensive income | | | | | | | | | | | | | | | | | | | | 5,726 |
|
| Balance as of June 30, 2019 | | 1 |
| | 556 |
| | 1,158 |
| | $ | 120,836 |
| | $ | 19,130 |
| | $ | 687 |
| | $ | (127,104 | ) | | $ | 216 |
| | $ | (7,400 | ) | | $ | 6,365 |
|
See Notes to Condensed Consolidated Financial Statements in the Second Quarter 2019 Form 10-Q
|
| | |
| Second Quarter 2019 Results | 16 |
FANNIE MAE
(In conservatorship)
Condensed Consolidated Statements of Changes in Equity (Deficit) — (Unaudited)
(Dollars and shares in millions, except per share amounts)
|
| | | | | | | | | | | | | | | | | | | | | | | | | | | | | | | | | | | | | |
| | | Fannie Mae Stockholders’ Equity (Deficit) |
| | | Shares Outstanding | | Senior
Preferred Stock | | Preferred
Stock | | Common
Stock | |
Accumulated
Deficit | | Accumulated
Other
Comprehensive
Income | | Treasury
Stock | | Total
Equity
(Deficit) |
| | | Senior
Preferred | | Preferred | | Common | |
| Balance as of March 31, 2018 | | 1 |
| | 556 |
| | 1,158 |
| | $ | 120,836 |
| | $ | 19,130 |
| | $ | 687 |
| | $ | (129,662 | ) | | $ | 347 |
| | $ | (7,400 | ) | | $ | 3,938 |
|
| Senior preferred stock dividends paid | | — |
| | — |
| | — |
| | — |
| | — |
| | — |
| | (938 | ) | | — |
| | — |
| | (938 | ) |
| Increase to senior preferred stock | | — |
| | — |
| | — |
| | — |
| | — |
| | — |
| | — |
| | — |
| | — |
| | — |
|
| Comprehensive income: | | | | | | | | | | | | | | | | | | | | |
| Net income | | — |
| | — |
| | — |
| | — |
| | — |
| | — |
| | 4,457 |
| | — |
| | — |
| | 4,457 |
|
| Other comprehensive income, net of tax effect: | | | | | | | | | | | | | | | | | | | | |
| Changes in net unrealized gains on available-for-sale securities (net of taxes of $1) | | — |
| | — |
| | — |
| | — |
| | — |
| | — |
| | — |
| | 4 |
| | — |
| | 4 |
|
| Reclassification adjustment for gains included in net income (net of taxes of $0) | | — |
| | — |
| | — |
| | — |
| | — |
| | — |
| | — |
| | — |
| | — |
| | — |
|
| Other | | — |
| | — |
| | — |
| | — |
| | — |
| | — |
| | — |
| | (2 | ) | | — |
| | (2 | ) |
| Total comprehensive income | | | | | | | | | | | | | | | | | | | | 4,459 |
|
Reclassification related to Tax Cuts
and Jobs Act | | — |
| | — |
| | — |
| | — |
| | — |
| | — |
| | — |
| | — |
| | — |
| | — |
|
| Other | | — |
| | — |
| | — |
| | — |
| | — |
| | — |
| | — |
| | — |
| | — |
| | — |
|
| Balance as of June 30, 2018 | | 1 |
| | 556 |
| | 1,158 |
| | $ | 120,836 |
| | $ | 19,130 |
| | $ | 687 |
| | $ | (126,143 | ) | | $ | 349 |
| | $ | (7,400 | ) | | $ | 7,459 |
|
|
| | | | | | | | | | | | | | | | | | | | | | | | | | | | | | | | | | | | | |
| | | Fannie Mae Stockholders’ Equity (Deficit) |
| | | Shares Outstanding | | Senior
Preferred Stock | | Preferred
Stock | | Common
Stock | |
Accumulated
Deficit | | Accumulated
Other
Comprehensive
Income | | Treasury
Stock | | Total
Equity (Deficit) |
| | | Senior
Preferred | | Preferred | | Common | |
| Balance as of December 31, 2017 | | 1 |
| | 556 |
| | 1,158 |
| | $ | 117,149 |
| | $ | 19,130 |
| | $ | 687 |
| | $ | (133,805 | ) | | $ | 553 |
| | $ | (7,400 | ) | | $ | (3,686 | ) |
| Senior preferred stock dividends paid | | — |
| | — |
| | — |
| | — |
| | — |
| | — |
| | (938 | ) | | — |
| | — |
| | (938 | ) |
| Increase to senior preferred stock | | — |
| | — |
| | — |
| | 3,687 |
| | — |
| | — |
| | — |
| | — |
| | — |
| | 3,687 |
|
| Comprehensive income: | |
| |
| |
| | | | | | | | | | | | | |
|
| Net income | | — |
| | — |
| | — |
| | — |
| | — |
| | — |
| | 8,718 |
| | — |
| | — |
| | 8,718 |
|
| Other comprehensive income, net of tax effect: | |
| |
| |
| |
| |
| |
| |
| |
| |
| |
|
| Changes in net unrealized gains on available-for-sale securities (net of taxes of $14) | | — |
| | — |
| | — |
| | — |
| | — |
| | — |
| | — |
| | (53 | ) | | — |
| | (53 | ) |
| Reclassification adjustment for gains included in net income (net of taxes of $70) | | — |
| | — |
| | — |
| | — |
| | — |
| | — |
| | — |
| | (263 | ) | | — |
| | (263 | ) |
| Other | | — |
| | — |
| | — |
| | — |
| | — |
| | — |
| | — |
| | (5 | ) | | — |
| | (5 | ) |
| Total comprehensive income | |
| |
| |
| | | | | | | | | | | | | | 8,397 |
|
Reclassification related to Tax Cuts
and Jobs Act | | — |
| | — |
| | — |
| | — |
| | — |
| | — |
| | (117 | ) | | 117 |
| | — |
| | — |
|
| Other | | — |
| | — |
| | — |
| | — |
| | — |
| | — |
| | (1 | ) | | — |
| | — |
| | (1 | ) |
| Balance as of June 30, 2018 | | 1 |
| | 556 |
| | 1,158 |
| | $ | 120,836 |
| | $ | 19,130 |
| | $ | 687 |
| | $ | (126,143 | ) | | $ | 349 |
| | $ | (7,400 | ) | | $ | 7,459 |
|
See Notes to Condensed Consolidated Financial Statements in the Second Quarter 2019 Form 10-Q
|
| | |
| Second Quarter 2019 Results | 17 |