Contact: Pete Bakel Resource Center: 1-800-732-6643
202-752-2034 Exhibit 99.1
Date: April 30, 2021
Fannie Mae Reports Net Income of $5.0 Billion for First Quarter 2021
| | | | | | | | | | | | | | |
| | |
| |
| |
|
| | | | |
| | |
| |
| |
| | |
| |
| |
| |
| | |
| |
| |
| | |
| |
| |
| |
| |
| | | | |
| | | |
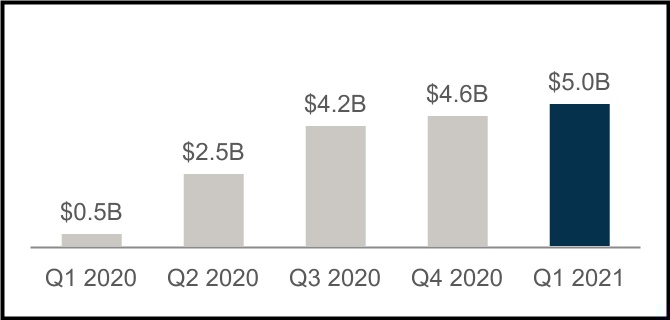
| • | $5.0 billion net income for the first quarter of 2021 compared with $4.6 billion for the fourth quarter of 2020 | | “COVID-19 continues to present challenges and opportunities for homeowners and renters. We had another quarter of near-record mortgage volumes as many took advantage of low rates to refinance or purchase a home. In addition, more than two-thirds of the 1.3 million homeowners with Fannie Mae loans who entered forbearance have since exited, even as we continue to help others find solutions. I’m proud of our steady performance and continuing focus on helping homeowners and renters through uncertain times.”
Hugh R. Frater, Chief Executive Officer |
| | |
| • | Implemented hedge accounting in the first quarter of 2021, which improved first quarter pretax income by approximately $1.2 billion | |
| | |
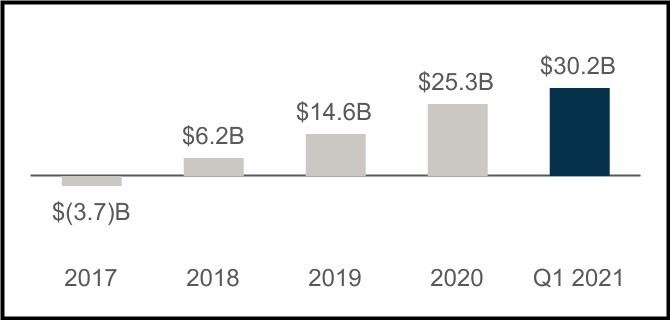
| • | Net worth increased to $30.2 billion as of March 31, 2021 | |
| | |
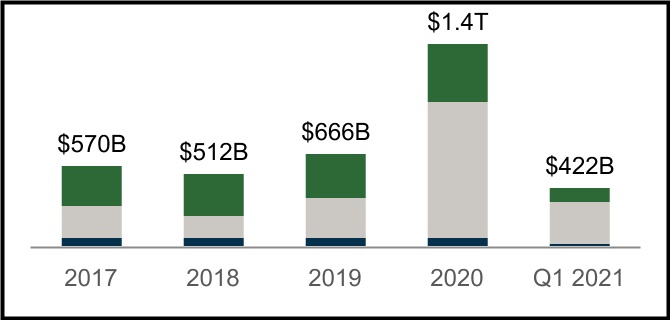
| • | $422 billion in liquidity provided to the Single-Family and Multifamily mortgage markets in the first quarter of 2021 | |
| | |
| | |
| | |
| • | Acquired 340,000 home purchase loans and 1.1 million refinance loans during the quarter, which helped homeowners take advantage of low interest rates | |
| | |
| • | 217,000 units of rental housing financed, more than 90% affordable to families earning at or below 120% of area median income | |
| | |
| • | More than 1.3 million single-family forbearance plans initiated to help borrowers since the onset of the COVID-19 pandemic; as of March 31, 2021, approximately 920,000 of these loans have exited forbearance, including approximately 337,000 through reinstatement and approximately 275,000 through the company’s payment deferral option | |
| | | | |
| | | | |
| | | | |
| |
| | | | |
| | | | | | | | | | | | | | | | | | | | | | | | | | | | | | | | | | | |
| Q1 2021 Key Results | | | | | | | | | | |
| $30.2 Billion Net Worth | $422 Billion Supporting Housing Activity |
| | | | | | | | | | | |
| Increase of $5.0 billion in Q1 2021 | | | SF Home Purchases | | | SF Refinancings | | | MF Rental Units |
| | | | | |
| | | | | | | | | | | | | | | | | | | | |
| | | | | | |
| $5.0 Billion Net Income | | Single-Family SDQ Rate |
| | | | | | |
| Increase of $423 million compared with fourth quarter 2020 | | SDQ Rate | | SDQ Rate without Forbearances |
|
| | | |

| | | | | | | | |
| First Quarter 2021 Results | 1 |
| | | | | | | | | | | | | | | | | | | | | | | | | | | | | | | | | | | | | | | | | | | | | | | | | |
| Summary of Financial Results | |
| (Dollars in millions) | | Q121 | | Q420 | | Variance | | % Change | | | | Q120 | | Variance | | % Change | |
| Net interest income | | $ | 6,742 | | | $ | 7,086 | | | $ | (344) | | | (5) | % | | | | 5,347 | | | 1,395 | | | 26 | % | |
| Fee and other income | | 87 | | | 159 | | | (72) | | | (45) | % | | | | 120 | | | (33) | | | (28) | % | |
| Net revenues | | 6,829 | | | 7,245 | | | (416) | | | (6) | % | | | | 5,467 | | | 1,362 | | | 25 | % | |
| Investment gains (losses), net | | 45 | | | 263 | | | (218) | | | (83) | % | | | | (158) | | | 203 | | | NM | |
| Fair value gains (losses), net | | 784 | | | (880) | | | 1,664 | | | NM | | | | (276) | | | 1,060 | | | NM | |
| Administrative expenses | | (748) | | | (803) | | | 55 | | | (7) | % | | | | (749) | | | 1 | | | — | % | |
| Credit-related income (expenses) | | 770 | | | 1,400 | | | (630) | | | (45) | % | | | | (2,663) | | | 3,433 | | | NM | |
| Temporary Payroll Tax Cut Continuation Act of 2011 (TCCA) fees | | (731) | | | (697) | | | (34) | | | 5 | % | | | | (637) | | | (94) | | | 15 | % | |
| Other expenses, net* | | (634) | | | (819) | | | 185 | | | (23) | % | | | | (406) | | | (228) | | | 56 | % | |
| Income before federal income taxes | | 6,315 | | | 5,709 | | | 606 | | | 11 | % | | | | 578 | | | 5,737 | | | NM | |
| Provision for federal income taxes | | (1,322) | | | (1,139) | | | (183) | | | 16 | % | | | | (117) | | | (1,205) | | | NM | |
| Net income | | $ | 4,993 | | | $ | 4,570 | | | $ | 423 | | | 9 | % | | | | $ | 461 | | | $ | 4,532 | | | NM | |
| | | | | | | | | | | | | | | | | |
| | | | | | | | | | | | | | | | | |
| Total comprehensive income | | $ | 4,966 | | | $ | 4,566 | | | $ | 400 | | | 9 | % | | | | $ | 476 | | | $ | 4,490 | | | NM | |
| Net worth | | $ | 30,225 | | | $ | 25,259 | | | $ | 4,966 | | | 20 | % | | | | $ | 13,945 | | | $ | 16,280 | | | 117 | % | |
| | | | | | | | | | | | | | | | | |
| | | | | | | | | | | | | | | | | |
| NM - Not meaningful | | | | | | | | | | | | | | | | | |
* Other expense, net also includes credit enhancement expense and change in expected credit enhancement recoveries | |
| | | | | | | | | |
| | | |
| Financial Highlights | |
| | | |
| • | | Net income increased $423 million in the first quarter of 2021 compared with the fourth quarter of 2020 driven primarily by a shift to fair value gains in the first quarter of 2021 from fair value losses in the fourth quarter of 2020, partially offset by lower credit-related income and lower net interest income. | |
| | | |
| • | | Fair value gains were $784 million in the first quarter of 2021, compared with fair value losses of $880 million in the fourth quarter of 2020. The $1.7 billion shift from fair value losses in the prior quarter to fair value gains in the first quarter of 2021 resulted largely from the company’s implementation of hedge accounting in January 2021. | |
| | | |
| • | | Credit-related income decreased by $630 million in the first quarter of 2021 compared with the fourth quarter of 2020. Credit-related income in the first quarter of 2021 was driven by a benefit for credit losses due primarily to higher actual and forecasted home prices, partially offset by higher actual and projected interest rates. | |
| | | |
| • | | Net interest income decreased $344 million in the first quarter of 2021 compared with the fourth quarter of 2020 driven primarily by a decrease in net amortization income due to lower levels of single-family mortgage loan prepayment activity in the first quarter of 2021. The company expects that lower levels of refinancing in the future will likely result in fewer loan prepayments leading to lower amortization income in any one period as loans remain outstanding for longer. | |
| | | | | | | | |
| First Quarter 2021 Results | 2 |
| | | | | | |
| Single-Family Business Financial Results |
| | | | | | | | | | | | | | | | | | | | | | | | | | | | | | | | | | | | | | | | | | | | | | |
| (Dollars in millions) | | Q121 | | Q420 | | Variance | | % Change | | | | Q120 | | Variance | | % Change |
| Net interest income | | $ | 5,894 | | | $ | 6,152 | | | $ | (258) | | | (4) | % | | | | $ | 4,541 | | | $ | 1,353 | | | 30 | % |
| Fee and other income | | 62 | | | 130 | | | (68) | | | (52) | % | | | | 94 | | | (32) | | | (34) | % |
| Net revenues | | 5,956 | | | 6,282 | | | (326) | | | (5) | % | | | | 4,635 | | | 1,321 | | | 29 | % |
| Investment gains (losses), net | | 64 | | | 201 | | | (137) | | | (68) | % | | | | (152) | | | 216 | | | NM |
| Fair value gains (losses), net | | 740 | | | (805) | | | 1,545 | | | NM | | | | (460) | | | 1,200 | | | NM |
| Administrative expenses | | (623) | | | (671) | | | 48 | | | (7) | % | | | | (629) | | | 6 | | | (1) | % |
| Credit-related income (expenses) | | 679 | | | 1,324 | | | (645) | | | (49) | % | | | | (2,250) | | | 2,929 | | | NM |
| Temporary Payroll Tax Cut Continuation Act of 2011 (TCCA) fees | | (731) | | | (697) | | | (34) | | | 5 | % | | | | (637) | | | (94) | | | 15 | % |
Other expenses, net* | | (529) | | | (706) | | | 177 | | | (25) | % | | | | (421) | | | (108) | | | 26 | % |
| Income before federal income taxes | | 5,556 | | | 4,928 | | | 628 | | | 13 | % | | | | 86 | | | 5,470 | | | NM |
| Provision for federal income taxes | | (1,162) | | | (984) | | | (178) | | | 18 | % | | | | (18) | | | (1,144) | | | NM |
| Net income | | $ | 4,394 | | | $ | 3,944 | | | $ | 450 | | | 11 | % | | | | $ | 68 | | | $ | 4,326 | | | NM |
| | | | | | | | | | | | | | | | |
| Average charged guaranty fee on new conventional acquisitions, net of TCCA | | 48.0 bps | | 45.8 bps | | 2.2 bps | | 5 | % | | | | 49.4 bps | | (1.4) bps | | (3) | % |
| Average charged guaranty fee on conventional guaranty book of business, net of TCCA | | 44.9 bps | | 44.5 bps | | 0.4 bps | | 1 | % | | | | 43.8 bps | | 1.1 bps | | 3 | % |
| | | | | | | | | | | | | | | | |
* Other expense, net also includes credit enhancement expense and change in expected credit enhancement recoveries |
| | | | | | | | | | | | | | | | |
| | | | | | | | | | | | | | | | |
| | | | | | | | | | | | | | | | |
| | | | | | |
|
| | |
| | |
| | |
| | |
| Key Business Highlights |
| | |
| • | Single-family conventional acquisition volume was $400 billion in the first quarter of 2021, a decrease of 6% compared with the record volume in the fourth quarter of 2020. The $26 billion decrease was driven by a decrease in purchase volume largely due to seasonality, as typically fewer borrowers purchase homes in the first quarter of the year than in the fourth quarter. Refinance acquisition volume in the first quarter remained flat compared with the fourth quarter, while remaining at near-record levels. 9% of the company’s single-family conventional guaranty book of business as of March 31, 2021 was originated in 2021. | |
| | |
| • | Average single-family conventional guaranty book of business during the first quarter of 2021 increased from the fourth quarter of 2020 by 2.4%. Credit characteristics of the single-family conventional guaranty book of business remained strong, with a weighted-average mark-to-market loan-to-value ratio of 57% and weighted-average FICO credit score of 751. | |
| | |
| • | Average charged guaranty fee, net of TCCA fees, on the single-family conventional guaranty book increased from 44.5 basis points for the three months ended December 31, 2020 to 44.9 basis points for the three months ended March 31, 2021. Average charged guaranty fee on newly acquired single-family conventional loans, net of TCCA fees, increased 2.2 basis points to 48.0 basis points for the three months ended March 31, 2021 from 45.8 basis points for the three months ended December 31, 2020, driven by the implementation of the adverse market refinance fee in December 2020. | |
| | |
| • | As of March 31, 2021, 2.5% of the single-family guaranty book of business based on loan count, or 429,592 loans, was in forbearance, the vast majority of which was related to the COVID-19 pandemic, compared with 3.0% as of December 31, 2020. As of March 31, 2021, 10% of the loans in forbearance were still current. | |
| | |
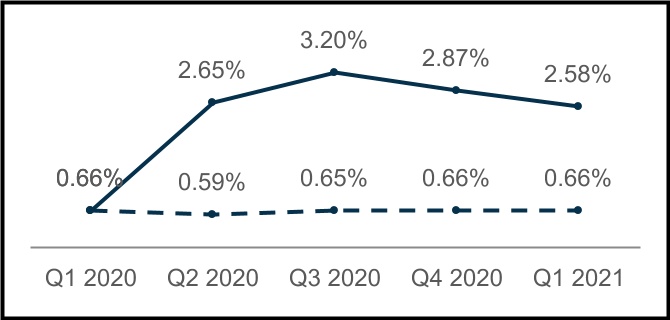
| • | Single-family serious delinquency rate decreased to 2.58% as of March 31, 2021, from 2.87% as of December 31, 2020, due to the on-going economic recovery and the decline in the number of the company’s single-family loans in a COVID-19 forbearance plan. Single-family serious delinquency rate excluding loans in forbearance was 0.66% as of both March 31, 2021 and December 31, 2020. Single-family seriously delinquent loans are loans that are 90 days or more past due or in the foreclosure process. | |
| | | | | | | | |
| First Quarter 2021 Results | 3 |
| | | | | | | | | | | | | | | | | | | | | | | | | | | | | | | | | | | | | | | | | | | | | | |
| Multifamily Business Financial Results |
| (Dollars in millions) | | Q121 | | Q420 | | Variance | | % Change | | | | Q120 | | Variance | | % Change |
| Net interest income | | $ | 848 | | | $ | 934 | | | $ | (86) | | | (9) | % | | | | $ | 806 | | | $ | 42 | | | 5 | % |
| Fee and other income | | 25 | | | 29 | | | (4) | | | (14) | % | | | | 26 | | | (1) | | | (4) | % |
| Net revenues | | 873 | | | 963 | | | (90) | | | (9) | % | | | | 832 | | | 41 | | | 5 | % |
| | | | | | | | | | | | | | | | |
| Fair value gains (losses), net | | 44 | | | (75) | | | 119 | | | NM | | | | 184 | | | (140) | | | (76) | % |
| Administrative expenses | | (125) | | | (132) | | | 7 | | | (5) | % | | | | (120) | | | (5) | | | 4 | % |
| Credit-related income (expenses) | | 91 | | | 76 | | | 15 | | | 20 | % | | | | (413) | | | 504 | | | NM |
| Credit enhancement expense | | (58) | | | (56) | | | (2) | | | 4 | % | | | | (60) | | | 2 | | | (3) | % |
| Change in expected credit enhancement recoveries | | (15) | | | (51) | | | 36 | | | (71) | % | | | | 130 | | | (145) | | | NM |
| Other income (expense), net | | (51) | | | 56 | | | (107) | | | NM | | | | (61) | | | 10 | | | (16) | % |
| Income before federal income taxes | | 759 | | | 781 | | | (22) | | | (3) | % | | | | 492 | | | 267 | | | 54 | % |
| Provision for federal income taxes | | (160) | | | (155) | | | (5) | | | 3 | % | | | | (99) | | | (61) | | | 62 | % |
| Net income | | $ | 599 | | | $ | 626 | | | $ | (27) | | | (4) | % | | | | $ | 393 | | | $ | 206 | | | 52 | % |
| | | | | | | | | | | | | | | | |
| Average charged guaranty fee rate on multifamily guaranty book of business, at end of period | | 75.9 bps | | 74.5 bps | | 1.4 bps | | 2 | % | | | | 71.9 bps | | 4.0 bps | | 6 | % |
| | | | | | | | | | | | | | | | |
| | | | | | | | | | | | | | | | |
| | | | | | | | | | | | | | | | |
| | | | | | | | | | | | | | | | |
| | | | | | |
| | |
| Key Business Highlights |
| | |
| • | New multifamily business volume was $22 billion during the first quarter of 2021. The Federal Housing Finance Agency (FHFA) established a 2021 multifamily volume cap of $70 billion, of which 50% must be mission-driven, focused on certain affordable and underserved market segments, and 20% must be affordable to residents earning 60% of area median income or below. | |
| | |
| • | The multifamily guaranty book of business increased by $15 billion in the first quarter of 2021 to $399 billion. The average charged guaranty fee on the multifamily book increased from 74.5 basis points for the fourth quarter of 2020 to 75.9 basis points for the first quarter of 2021 as a result of increased pricing. This resulted in an increase in guaranty fee revenue, which was more than offset by a decrease in other net interest income. | |
| | |
| • | As of March 31, 2021, based on unpaid principal balance, 1.3% of Fannie Mae’s multifamily guaranty book of business had received a forbearance plan (excluding loans that liquidated prior to period end), primarily as a result of the COVID-19 pandemic. More than three-fourths of those loans, measured by unpaid principal balance, were in a repayment plan or reinstated and only 0.2% of the book, or $917 million in unpaid principal balance, was still in active forbearance as of March 31, 2021. | |
| | |
| • | The multifamily serious delinquency rate decreased to 0.66% as of March 31, 2021 from 0.98% as of December 31, 2020, driven primarily by loans that received forbearance that are now in a forbearance repayment plan or have been modified or otherwise reinstated. This rate increased from 0.05% as of March 31, 2020 due to the economic dislocation caused by the COVID-19 pandemic, which increased borrower participation in forbearance plans since the start of the pandemic. The multifamily serious delinquency rate excluding loans that have received a forbearance was 0.03% as of March 31, 2021 and December 31, 2020. Multifamily seriously delinquent loans are loans that are 60 days or more past due. | |
| | | | | | | | |
| First Quarter 2021 Results | 4 |
| | |
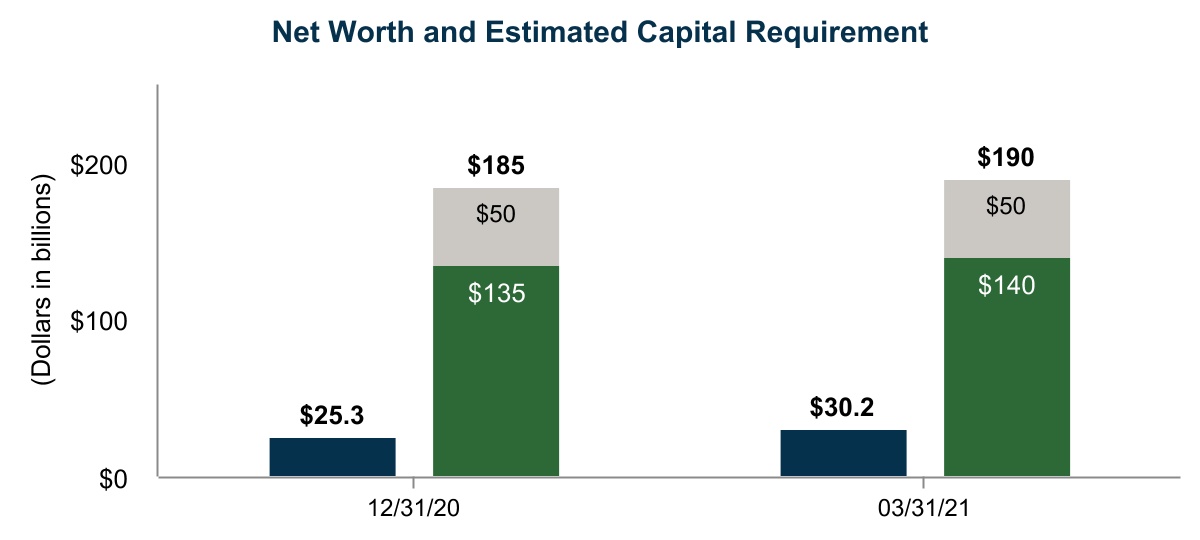
| Net Worth and Capital Requirement |
The chart below shows information about Fannie Mae’s net worth and estimated capital requirement under FHFA’s enterprise regulatory capital framework. The company’s comprehensive income of $5.0 billion for the first quarter of 2021 resulted in a $5.0 billion increase in its net worth to $30.2 billion as of March 31, 2021.
Fannie Mae estimates that, had the new enterprise regulatory capital framework’s requirements been applicable to the company as of March 31, 2021, it would have been required to hold approximately $190 billion in adjusted total capital, of which approximately $140 billion must be in the form of common equity tier 1 capital. Prescribed buffers drive approximately $75 billion of the total requirements. Fannie Mae’s estimated capital requirement grew by approximately $5 billion in the first quarter of 2021 compared with the prior quarter, driven by growth in the company’s guaranty book of business and a reduction in the benefits received from credit risk transfer transactions.
| | | | | | | | |
| Net Worth* | Remaining Treasury funding commitment is $113.9 billion |
| |
| Estimated Common Equity Tier 1 Capital Requirement |
| |
| Estimated Other Tier 1 and Tier 2 Capital Requirement |
| | |
| * | Net worth is not a measure of regulatory capital under FHFA’s enterprise regulatory capital framework |
For information about Fannie Mae’s capital requirements, see “Business—Legislation and Regulation—GSE Act and Other Legislative and Regulatory Matters—Capital” in the company’s 2020 Form 10-K and “Liquidity and Capital Management—Capital Management—Capital Requirements” in its First Quarter 2021 Form 10-Q.
Fannie Mae’s condensed consolidated balance sheets and condensed statements of operations and income for the first quarter of 2021 are available in the accompanying Annex; however, investors and interested parties should read the company’s First Quarter 2021 Form 10-Q, which was filed today with the Securities and Exchange Commission and is available on Fannie Mae’s website, www.fanniemae.com. The company provides further discussion of its financial results and condition, credit performance, and other matters in its First Quarter 2021 Form 10-Q. Additional information about the company’s financial and credit performance is contained in Fannie Mae’s “Q1 2021 Financial Supplement” at www.fanniemae.com.
# # #
In this release, the company has presented forward-looking statements regarding mortgage market conditions and the company’s future business and financial results. Actual outcomes could be materially different from what is set forth in these forward-looking statements due to a variety of factors, including those described in “Forward-Looking Statements” and “Risk Factors” in the company’s First Quarter 2021 Form 10-Q and its 2020 Form 10-K.
Fannie Mae provides website addresses in its news releases solely for readers’ information. Other content or information appearing on these websites is not part of this release.
Fannie Mae helps make the 30-year fixed-rate mortgage and affordable rental housing possible for millions of people in America. We partner with lenders to create housing opportunities for families across the country. We are driving positive changes in housing finance to make the home buying process easier, while reducing costs and risk. To learn more, visit fanniemae.com and follow us on twitter.com/fanniemae.
| | | | | | | | |
| First Quarter 2021 Results | 5 |
ANNEX
FANNIE MAE
Condensed Consolidated Balance Sheets - (Unaudited)
(Dollars in millions)
| | | | | | | | | | | | | | | | | | | | |
| As of |
| March 31, 2021 | | December 31, 2020 |
| |
| ASSETS |
| Cash and cash equivalents | | $ | 26,538 | | | | | $ | 38,337 | |
| Restricted cash and cash equivalents (includes $80,899 and $68,308, respectively, related to consolidated trusts) | | 87,803 | | | | | 77,286 | |
Federal funds sold and securities purchased under agreements to resell or similar arrangements (includes $40,837 and $0, respectively, related to consolidated trusts) | | 54,937 | | | | | 28,200 | |
| Investments in securities: | | | | | | |
| Trading, at fair value (includes $6,658 and $6,544, respectively, pledged as collateral) | | 111,256 | | | | | 136,542 | |
| Available-for-sale, at fair value (with an amortized cost of $1,440 and $1,606, net of allowance for credit losses of $3 as of March 31, 2021 and December 31, 2020) | | 1,502 | | | | | 1,697 | |
| Total investments in securities | | 112,758 | | | | | 138,239 | |
| Mortgage loans: | | | | | | |
| Loans held for sale, at lower of cost or fair value | | 7,824 | | | | | 5,197 | |
| Loans held for investment, at amortized cost: | | | | | | |
| Of Fannie Mae | | 103,310 | | | | | 112,726 | |
| Of consolidated trusts | | 3,638,374 | | | | | 3,546,521 | |
| Total loans held for investment (includes $6,048 and 6,490, respectively, at fair value) | | 3,741,684 | | | | | 3,659,247 | |
| Allowance for loan losses | | (9,628) | | | | | (10,552) | |
| Total loans held for investment, net of allowance | | 3,732,056 | | | | | 3,648,695 | |
| Total mortgage loans | | 3,739,880 | | | | | 3,653,892 | |
| Advances to lenders | | 10,572 | | | | | 10,449 | |
| Deferred tax assets, net | | 12,516 | | | | | 12,947 | |
| Accrued interest receivable, net (includes $9,732 and $9,635, respectively, related to consolidated trusts and net of an allowance of $226 and $216 as of March 31, 2021 and December 31, 2020, respectively) | | 9,993 | | | | | 9,937 | |
| Acquired property, net | | 1,183 | | | | | 1,261 | |
| Other assets | | 13,923 | | | | | 15,201 | |
| Total assets | | $ | 4,070,103 | | | | | $ | 3,985,749 | |
| LIABILITIES AND EQUITY |
| Liabilities: | | | | | | |
| Accrued interest payable (includes $8,768 and $8,955, respectively, related to consolidated trusts) | | $ | 9,585 | | | | | $ | 9,719 | |
| Debt: | | | | | | |
| Of Fannie Mae (includes $3,336 and $3,728, respectively, at fair value) | | 273,442 | | | | | 289,572 | |
| Of consolidated trusts (includes $23,601 and $24,586, respectively, at fair value) | | 3,740,538 | | | | | 3,646,164 | |
| Other liabilities (includes $1,375 and $1,523, respectively, related to consolidated trusts) | | 16,313 | | | | | 15,035 | |
| Total liabilities | | 4,039,878 | | | | | 3,960,490 | |
| Commitments and contingencies (Note 13) | | — | | | | | — | |
| Fannie Mae stockholders’ equity: | | | | | | |
| Senior preferred stock (liquidation preference of $146,758 and $142,192, respectively) | | 120,836 | | | | | 120,836 | |
| Preferred stock, 700,000,000 shares are authorized—555,374,922 shares issued and outstanding | | 19,130 | | | | | 19,130 | |
Common stock, no par value, no maximum authorization—1,308,762,703 shares issued and 1,158,087,567 shares outstanding | | 687 | | | | | 687 | |
| Accumulated deficit | | (103,117) | | | | | (108,110) | |
| Accumulated other comprehensive income | | 89 | | | | | 116 | |
| Treasury stock, at cost, 150,675,136 shares | | (7,400) | | | | | (7,400) | |
| Total stockholders’ equity (See Note 1: Senior Preferred Stock Purchase Agreement and Senior Preferred Stock for information on the related dividend obligation and liquidation preference) | | 30,225 | | | | | 25,259 | |
| Total liabilities and equity | | $ | 4,070,103 | | | | | $ | 3,985,749 | |
See Notes to Condensed Consolidated Financial Statements in the First Quarter 2021 Form 10-Q
| | | | | | | | |
| First Quarter 2021 Results | 6 |
FANNIE MAE
(In conservatorship)
Condensed Consolidated Statements of Operations and Comprehensive Income - (Unaudited)
(Dollars in millions, except per share amounts)
| | | | | | | | | | | | | | | | | | | | | | | | | | | | | |
| For the Three Months ended March 31, | | |
| |
| 2021 | | 2020 | | | | | |
| Interest income: | | | | | | | | | | | | | | | |
| Trading securities | | $ | 140 | | | | | $ | 316 | | | | | | | | | | |
| Available-for-sale securities | | 19 | | | | | 31 | | | | | | | | | | |
| Mortgage loans | | 23,353 | | | | | 28,938 | | | | | | | | | | |
| Federal funds sold and securities purchased under agreements to resell or similar arrangements | | 8 | | | | | 107 | | | | | | | | | | |
| Other | | 42 | | | | | 34 | | | | | | | | | | |
| Total interest income | | 23,562 | | | | | 29,426 | | | | | | | | | | |
| Interest expense: | | | | | | | | | | | | | | | |
| Short-term debt | | (3) | | | | | (102) | | | | | | | | | | |
| Long-term debt | | (16,817) | | | | | (23,977) | | | | | | | | | | |
| Total interest expense | | (16,820) | | | | | (24,079) | | | | | | | | | | |
| Net interest income | | 6,742 | | | | | 5,347 | | | | | | | | | | |
| Benefit (provision) for credit losses | | 765 | | | | | (2,583) | | | | | | | | | | |
| Net interest income after benefit (provision) for credit losses | | 7,507 | | | | | 2,764 | | | | | | | | | | |
| Investment gains (losses), net | | 45 | | | | | (158) | | | | | | | | | | |
| Fair value gains (losses), net | | 784 | | | | | (276) | | | | | | | | | | |
| Fee and other income | | 87 | | | | | 120 | | | | | | | | | | |
| Non-interest income (loss) | | 916 | | | | | (314) | | | | | | | | | | |
| Administrative expenses: | | | | | | | | | | | | | | | |
| Salaries and employee benefits | | (387) | | | | | (393) | | | | | | | | | | |
| Professional services | | (214) | | | | | (212) | | | | | | | | | | |
| | | | | | | | | | | | | | | |
| Other administrative expenses | | (147) | | | | | (144) | | | | | | | | | | |
| Total administrative expenses | | (748) | | | | | (749) | | | | | | | | | | |
| Foreclosed property income (expense) | | 5 | | | | | (80) | | | | | | | | | | |
| Temporary Payroll Tax Cut Continuation Act of 2011 (“TCCA”) fees | | (731) | | | | | (637) | | | | | | | | | | |
| Credit enhancement expense | | (284) | | | | | (376) | | | | | | | | | | |
| Change in expected credit enhancement recoveries | | (31) | | | | | 188 | | | | | | | | | | |
| Other expenses, net | | (319) | | | | | (218) | | | | | | | | | | |
| Total expenses | | (2,108) | | | | | (1,872) | | | | | | | | | | |
| Income before federal income taxes | | 6,315 | | | | | 578 | | | | | | | | | | |
| Provision for federal income taxes | | (1,322) | | | | | (117) | | | | | | | | | | |
| Net income | | 4,993 | | | | | 461 | | | | | | | | | | |
| Other comprehensive income (loss): | | | | | | | | | | | | | | | |
| Changes in unrealized gains (losses) on available-for-sale securities, net of reclassification adjustments and taxes | | (23) | | | | | 18 | | | | | | | | | | |
| Other, net of taxes | | (4) | | | | | (3) | | | | | | | | | | |
| Total other comprehensive income (loss) | | (27) | | | | | 15 | | | | | | | | | | |
| Total comprehensive income | | $ | 4,966 | | | | | $ | 476 | | | | | | | | | | |
| Net income | | $ | 4,993 | | | | | $ | 461 | | | | | | | | | | |
| Dividends distributed or amounts attributable to senior preferred stock | | (4,966) | | | | | (476) | | | | | | | | | | |
| Net income (loss) attributable to common stockholders | | $ | 27 | | | | | $ | (15) | | | | | | | | | | |
| Earnings per share: | | | | | | | | | | | | | | | |
| Basic | | $ | 0.00 | | | | | $ | 0.00 | | | | | | | | | | |
| Diluted | | 0.00 | | | | | 0.00 | | | | | | | | | | |
| Weighted-average common shares outstanding: | | | | | | | | | | | | | | | |
| Basic | | 5,867 | | | | | 5,867 | | | | | | | | | | |
| Diluted | | 5,893 | | | | | 5,867 | | | | | | | | | | |
See Notes to Condensed Consolidated Financial Statements in the First Quarter 2021 Form 10-Q
| | | | | | | | |
| First Quarter 2021 Results | 7 |