Contact: Pete Bakel Resource Center: 1-800-732-6643
202-752-2034 Exhibit 99.1
Date: October 29, 2021
Fannie Mae Reports Net Income of $4.8 Billion for Third Quarter 2021
| | | | | | | | | | | | | | |
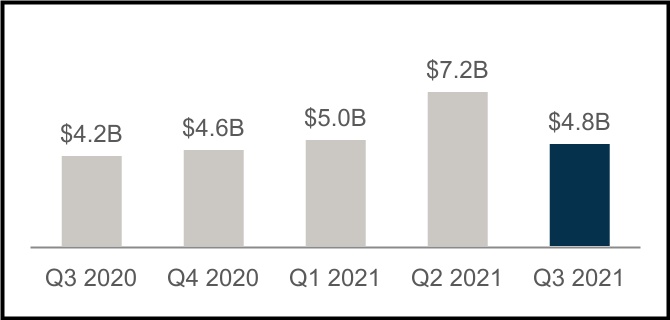
| • | $4.8 billion net income for the third quarter of 2021 compared with $7.2 billion for the second quarter of 2021 | | “It was another strong quarter for the housing market and for Fannie Mae. Our results reflect the credit quality of our guaranty book, a growing economy, strong home price growth, and low interest rates. However, rising home prices, while good for homeowners and others involved with selling a home, can negatively impact affordability for first-time homebuyers. For too many lower- and middle-income families, affordable housing options are scarce and inequities persist in the housing economy. We look forward to continuing to work with FHFA and others to advance equitable and sustainable access to homeownership and affordable, quality rental housing for communities across America.”
Hugh R. Frater, Chief Executive Officer |
| | |
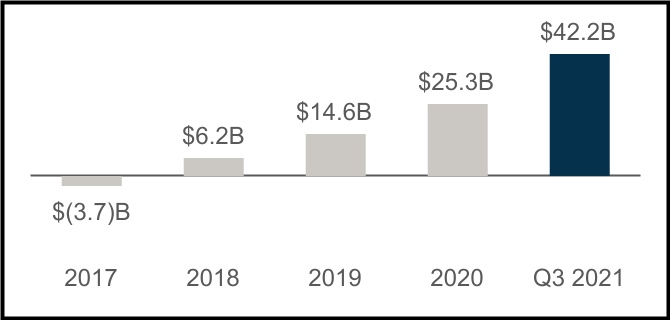
| • | Net worth increased to $42.2 billion as of September 30, 2021 | |
| | |
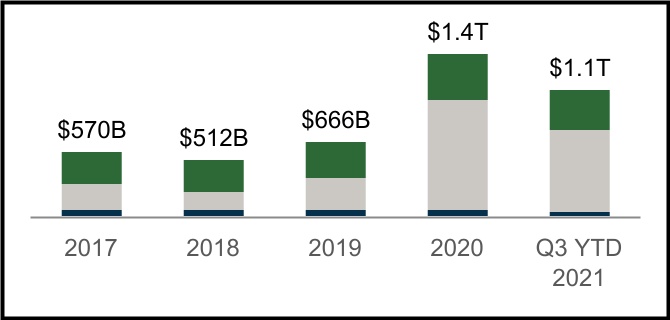
| • | $312.7 billion in liquidity provided to the Single-Family and Multifamily mortgage markets in the third quarter of 2021 | |
| | |
| • | $115.4 billion of Single-Family home purchase acquisitions in the third quarter of 2021 of which nearly 50% were for first-time homebuyers | |
| | |
| | |
| | |
| • | 166,000 units of rental housing financed in the third quarter of 2021, more than 90% of which were affordable to families earning at or below 120% of area median income, providing support for both workforce and affordable housing | |
| | |
| • | Nearly 1.4 million single-family forbearance plans initiated to help borrowers since the onset of the COVID-19 pandemic; as of September 30, 2021, approximately 1.2 million of these loans have exited forbearance, including approximately 727,000 through reinstatement or payoff, and approximately 359,000 through the company’s payment deferral option | |
| | |
| • | Home price growth in the first nine months of 2021 was 16.0%, the highest nine-month growth rate in the history of Fannie Mae’s home price index | |
| | | | |
| | | | |
| | | | |
| |
| | | | |
| | | | | | | | | | | | | | | | | | | | | | | | | | | | | | | | | | | |
| Q3 2021 Key Results | | | | | | | | | | |
| $42.2 Billion Net Worth | $1.1 Trillion Supporting Housing Activity |
| | | | | | | | | | | |
| Increase of $4.8 billion in third quarter 2021 | | SF Home Purchases | | | SF Refinancings | | | MF Rental Units |
| | | | |
| | | | | | | | | | | | | | | | | | | | |
| | | | | | |
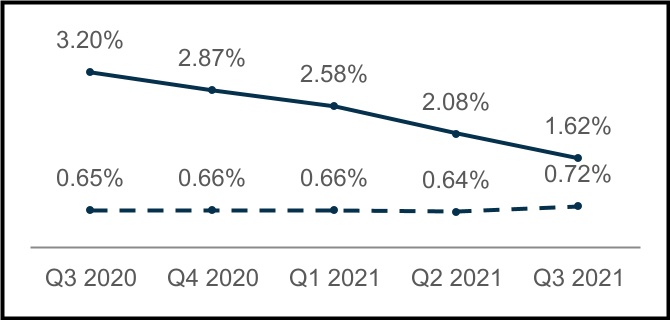
| $4.8 Billion Net Income | | Single-Family SDQ Rate |
| | | | | | |
| Decrease of $2.3 billion compared with second quarter 2021 | | SDQ Rate | | SDQ Rate without Forbearances |
|
| | | |

| | | | | | | | |
| Third Quarter 2021 Results | 1 |
| | | | | | | | | | | | | | | | | | | | | | | | | | | | | | | | | | | | | | | | | | | | | | | | | |
| Summary of Financial Results | |
| (Dollars in millions) | | Q321 | | Q221 | | Variance | | % Change | | | | Q320 | | Variance | | % Change | |
| Net interest income | | $ | 6,972 | | | $ | 8,286 | | | $ | (1,314) | | | (16) | % | | | | $ | 6,656 | | | 316 | | | 5 | % | |
| Fee and other income | | 111 | | | 103 | | | 8 | | | 8 | % | | | | 93 | | | 18 | | | 19 | % | |
| Net revenues | | 7,083 | | | 8,389 | | | (1,306) | | | (16) | % | | | | 6,749 | | | 334 | | | 5 | % | |
| Investment gains, net | | 243 | | | 646 | | | (403) | | | (62) | % | | | | 653 | | | (410) | | | (63) | % | |
| Fair value losses, net | | (17) | | | (446) | | | 429 | | | 96 | % | | | | (327) | | | 310 | | | 95 | % | |
| Administrative expenses | | (745) | | | (746) | | | 1 | | | — | % | | | | (762) | | | 17 | | | 2 | % | |
| Credit-related income | | 868 | | | 2,547 | | | (1,679) | | | (66) | % | | | | 430 | | | 438 | | | 102 | % | |
| Temporary Payroll Tax Cut Continuation Act of 2011 (TCCA) fees | | (781) | | | (758) | | | (23) | | | (3) | % | | | | (679) | | | (102) | | | (15) | % | |
| Other expenses, net* | | (543) | | | (598) | | | 55 | | | 9 | % | | | | (686) | | | 143 | | | 21 | % | |
| Income before federal income taxes | | 6,108 | | | 9,034 | | | (2,926) | | | (32) | % | | | | 5,378 | | | 730 | | | 14 | % | |
| Provision for federal income taxes | | (1,266) | | | (1,882) | | | 616 | | | 33 | % | | | | (1,149) | | | (117) | | | (10) | % | |
| Net income | | $ | 4,842 | | | $ | 7,152 | | | $ | (2,310) | | | (32) | % | | | | $ | 4,229 | | | $ | 613 | | | 14 | % | |
| Total comprehensive income | | $ | 4,828 | | | $ | 7,120 | | | $ | (2,292) | | | (32) | % | | | | $ | 4,216 | | | $ | 612 | | | 15 | % | |
| Net worth | | $ | 42,173 | | | $ | 37,345 | | | $ | 4,828 | | | 13 | % | | | | $ | 20,693 | | | $ | 21,480 | | | 104 | % | |
| | | | | | | | | | | | | | | | | |
| | | | | | | | | | | | | | | | | |
* Other expense, net also includes credit enhancement expense and change in expected credit enhancement recoveries | |
| | | | | | | | | |
| | | |
| Financial Highlights | |
| | | |
| • | | Net income decreased $2.3 billion in the third quarter of 2021 compared with the second quarter of 2021 driven primarily by a decrease in credit-related income and lower net interest income. | |
| | | |
| • | | Credit-related income decreased $1.7 billion in the third quarter of 2021 compared with the second quarter of 2021 driven primarily by a decrease in the volume of loan redesignations, less benefit from both actual and forecasted home price growth, and increases in interest rates. Credit-related income in the third quarter of 2021 was driven primarily by strong actual and forecasted home price growth and a reduction in the company’s estimate of losses it expects to incur as a result of the COVID-19 pandemic. | |
| | | |
| • | | Net interest income decreased $1.3 billion in the third quarter of 2021 compared with the second quarter of 2021 driven primarily by a decrease in net amortization income. Single-family mortgage loan prepayment activity slowed in the third quarter of 2021 compared to the second quarter of 2021; however, refinancing activity remained strong due to the continued low interest-rate environment. | |
| | | |
| • | | Strong earnings for the third quarter of 2021 support Fannie Mae’s continued efforts to build capital; however, the company remains significantly undercapitalized as of September 30, 2021. | |
| | | |
| | | |
| | | | | | | | |
| Third Quarter 2021 Results | 2 |
| | | | | | |
| Single-Family Business Financial Results |
| | | | | | | | | | | | | | | | | | | | | | | | | | | | | | | | | | | | | | | | | | | | | | |
| (Dollars in millions) | | Q321 | | Q221 | | Variance | | % Change | | | | Q320 | | Variance | | % Change |
| Net interest income | | $ | 5,870 | | | $ | 7,323 | | | $ | (1,453) | | | (20) | % | | | | $ | 5,870 | | | $ | — | | | — | % |
| Fee and other income | | 86 | | | 80 | | | 6 | | | 8 | % | | | | 73 | | | 13 | | | 18 | % |
| Net revenues | | 5,956 | | | 7,403 | | | (1,447) | | | (20) | % | | | | 5,943 | | | 13 | | | — | % |
| Investment gains, net | | 222 | | | 658 | | | (436) | | | (66) | % | | | | 583 | | | (361) | | | (62) | % |
| Fair value losses, net | | (31) | | | (386) | | | 355 | | | 92 | % | | | | (244) | | | 213 | | | 87 | % |
| Administrative expenses | | (620) | | | (619) | | | (1) | | | — | % | | | | (634) | | | 14 | | | 2 | % |
| Credit-related income | | 807 | | | 2,525 | | | (1,718) | | | (68) | % | | | | 478 | | | 329 | | | 69 | % |
| Temporary Payroll Tax Cut Continuation Act of 2011 (TCCA) fees | | (781) | | | (758) | | | (23) | | | (3) | % | | | | (679) | | | (102) | | | (15) | % |
Other expenses, net* | | (463) | | | (591) | | | 128 | | | 22 | % | | | | (629) | | | 166 | | | 26 | % |
| Income before federal income taxes | | 5,090 | | | 8,232 | | | (3,142) | | | (38) | % | | | | 4,818 | | | 272 | | | 6 | % |
| Provision for federal income taxes | | (1,065) | | | (1,725) | | | 660 | | | 38 | % | | | | (1,049) | | | (16) | | | (2) | % |
| Net income | | $ | 4,025 | | | $ | 6,507 | | | $ | (2,482) | | | (38) | % | | | | $ | 3,769 | | | $ | 256 | | | 7 | % |
| | | | | | | | | | | | | | | | |
| Average charged guaranty fee on new conventional acquisitions, net of TCCA | | 47.3 bps | | 47.9 bps | | (0.6) bps | | (1) | % | | | | 44.9 bps | | 2.4 bps | | 5 | % |
| Average charged guaranty fee on conventional guaranty book of business, net of TCCA | | 45.4 bps | | 45.2 bps | | 0.2 bps | | — | % | | | | 44.4 bps | | 1.0 bps | | 2 | % |
| | | | | | | | | | | | | | | | |
* Other expense, net also includes credit enhancement expense and change in expected credit enhancement recoveries |
| | | | | | | | | | | | | | | | |
| | | | | | | | | | | | | | | | |
| | | | | | | | | | | | | | | | |
| | | | | | |
|
| | |
| | |
| | |
| | |
| Key Business Highlights |
| | |
| • | Single-family conventional acquisition volume was $296.4 billion in the third quarter of 2021, compared with $373.3 billion in the second quarter of 2021. Purchase acquisitions decreased from $129.5 billion in the second quarter of 2021 to $115.4 billion in the third quarter of 2021, of which nearly 50% were for first-time homebuyers. Refinance acquisitions were $180.9 billion in the third quarter of 2021, a decline from $243.8 billion in the second quarter of 2021, but remained at a high level due to the continued low interest-rate environment. | |
| | |
| • | Average single-family conventional guaranty book of business during the third quarter of 2021 increased from the second quarter of 2021 by 2.3%. Record home price appreciation in the first nine months of 2021 has reduced the weighted-average mark-to-market loan-to-value ratio of our single-family conventional guaranty book of business to 54% as of September 30, 2021. The weighted average FICO credit score of the company’s single-family conventional guaranty book of business was 752 as of September 30, 2021. | |
| | |
| • | Average charged guaranty fee, net of TCCA fees, on the single-family conventional guaranty book increased from 45.2 basis points for the three months ended June 30, 2021 to 45.4 basis points for the three months ended September 30, 2021. Average charged guaranty fee on newly acquired single-family conventional loans, net of TCCA fees, decreased 0.6 basis points compared with the second quarter of 2021. Removal of the adverse market refinance fee in August 2021 contributed to the decrease. | |
| | |
| • | As of September 30, 2021, 1.2% of the single-family guaranty book of business based on loan count, or 206,293 loans, was in forbearance, the vast majority of which was related to the COVID-19 pandemic, compared with 1.8% as of June 30, 2021. Since the start of the pandemic, 81% of loans that entered forbearance have successfully exited. | |
| | |
| • | Single-family serious delinquency rate decreased to 1.62% as of September 30, 2021, from 2.08% as of June 30, 2021, due to the on-going economic recovery and the decline in the number of the company’s single-family loans in a COVID-19 forbearance plan. Single-family serious delinquency rate excluding loans in forbearance increased from 0.64% as of June 30, 2021 to 0.72% as of September 30, 2021 primarily due to loans exiting forbearance without resolving their delinquency. Single-family seriously delinquent loans are loans that are 90 days or more past due or in the foreclosure process. | |
| | | | | | | | |
| Third Quarter 2021 Results | 3 |
| | | | | | | | | | | | | | | | | | | | | | | | | | | | | | | | | | | | | | | | | | | | | | |
| Multifamily Business Financial Results |
| (Dollars in millions) | | Q321 | | Q221 | | Variance | | % Change | | | | Q320 | | Variance | | % Change |
| Net interest income | | $ | 1,102 | | | $ | 963 | | | $ | 139 | | | 14 | % | | | | $ | 786 | | | $ | 316 | | | 40 | % |
| Fee and other income | | 25 | | | 23 | | | 2 | | | 9 | % | | | | 20 | | | 5 | | | 25 | % |
| Net revenues | | 1,127 | | | 986 | | | 141 | | | 14 | % | | | | 806 | | | 321 | | | 40 | % |
| | | | | | | | | | | | | | | | |
| Fair value gains (losses), net | | 14 | | | (60) | | | 74 | | | NM | | | | (83) | | | 97 | | | NM |
| Administrative expenses | | (125) | | | (127) | | | 2 | | | 2 | % | | | | (128) | | | 3 | | | 2 | % |
| Credit-related income (expenses) | | 61 | | | 22 | | | 39 | | | 177 | % | | | | (48) | | | 109 | | | NM |
| Credit enhancement expense | | (59) | | | (55) | | | (4) | | | (7) | % | | | | (51) | | | (8) | | | (16) | % |
| Change in expected credit enhancement recoveries | | (14) | | | 13 | | | (27) | | | NM | | | | — | | | (14) | | | NM |
| Other income (expense), net | | 14 | | | 23 | | | (9) | | | (39) | % | | | | 64 | | | (50) | | | (78) | % |
| Income before federal income taxes | | 1,018 | | | 802 | | | 216 | | | 27 | % | | | | 560 | | | 458 | | | 82 | % |
| Provision for federal income taxes | | (201) | | | (157) | | | (44) | | | (28) | % | | | | (100) | | | (101) | | | (101) | % |
| Net income | | $ | 817 | | | $ | 645 | | | $ | 172 | | | 27 | % | | | | $ | 460 | | | $ | 357 | | | 78 | % |
| | | | | | | | | | | | | | | | |
| Average charged guaranty fee rate on multifamily guaranty book of business | | 77.5 bps | | 76.8 bps | | 0.7 bps | | 1 | % | | | | 73.3 bps | | 4.2 bps | | 6 | % |
| | | | | | | | | | | | | | | | |
| NM - Not meaningful | | | | | | | | | | | | | | | | |
| | | | | | | | | | | | | | | | |
| | | | | | | | | | | | | | | | |
| | | | | | | | | | | | | | | | |
| | | | | | |
| | |
| Key Business Highlights |
| | |
| • | New multifamily business volume was $16.4 billion in the third quarter of 2021, resulting in $48.8 billion for the first nine months of 2021. The Federal Housing Finance Agency (FHFA) established a 2021 multifamily volume cap of $70 billion, of which 50% must be mission-driven, focused on specified affordable and underserved market segments, and 20% must be affordable to residents earning 60% of area median income or below. Multifamily business that meets the minimum 20% requirement also counts as meeting the minimum 50% requirement. In October 2021, FHFA announced that the multifamily loan purchase cap for 2022 will be $78 billion. As in 2021, a minimum of 50% of loan purchases must be mission-driven, focused on specified affordable and underserved market segments. In addition, 25% of loan purchases must be affordable to residents earning 60% or less of area median income, up from the 20% requirement in 2021. | |
| | |
| • | The multifamily guaranty book of business grew by $6.2 billion in the third quarter of 2021 to $408.1 billion. The average charged guaranty fee on the multifamily book increased from 76.8 basis points for the second quarter of 2021 to 77.5 basis points for the third quarter of 2021. | |
| | |
| • | Through September 30, 2021, 1.6% of our multifamily guaranty book of business as of March 31, 2020, based on unpaid principal balance, had been in a COVID-19-related forbearance at some point in time. As of September 30, 2021, nearly 90% of the loans in the company’s multifamily guaranty book of business that had received a forbearance, measured by unpaid principal balance, were in a repayment plan or reinstated. Only 0.1% of the multifamily book, or $362 million in unpaid principal balance, was still in active forbearance. | |
| | |
| • | The multifamily serious delinquency rate continued to decrease in the third quarter to 0.42% as of September 30, 2021 from 0.53% as of June 30, 2021, driven primarily by the on-going economic recovery resulting in loans that received forbearance completing repayment plans or otherwise reinstating. The multifamily serious delinquency rate, excluding loans that received a forbearance, remained at 0.03% as of September 30, 2021. Multifamily seriously delinquent loans are loans that are 60 days or more past due. | |
| | | | | | | | |
| Third Quarter 2021 Results | 4 |
Fannie Mae’s condensed consolidated balance sheets and condensed statements of operations and income for the third quarter of 2021 are available in the accompanying Annex; however, investors and interested parties should read the company’s Third Quarter 2021 Form 10-Q, which was filed today with the Securities and Exchange Commission and is available on Fannie Mae’s website, www.fanniemae.com. The company provides further discussion of its financial results and condition, credit performance, and other matters in its Third Quarter 2021 Form 10-Q. Additional information about the company’s financial and credit performance is contained in Fannie Mae’s “Q3 2021 Financial Supplement” at www.fanniemae.com.
# # #
Fannie Mae provides website addresses in its news releases solely for readers’ information. Other content or information appearing on these websites is not part of this release.
Fannie Mae helps make the 30-year fixed-rate mortgage and affordable rental housing possible for millions of people in America. We partner with lenders to create housing opportunities for people across the country. We are driving positive changes in housing finance to make the home buying process easier, while reducing costs and risk. To learn more, visit fanniemae.com and follow us on twitter.com/fanniemae.
| | | | | | | | |
| Third Quarter 2021 Results | 5 |
ANNEX
FANNIE MAE
Condensed Consolidated Balance Sheets - (Unaudited)
(Dollars in millions)
| | | | | | | | | | | | | | | | | | | | |
| As of |
| September 30, 2021 | | December 31, 2020 |
| |
| ASSETS |
| Cash and cash equivalents | | $ | 67,377 | | | | | $ | 38,337 | |
| Restricted cash and cash equivalents (includes $59,370 and $68,308, respectively, related to consolidated trusts) | | 66,087 | | | | | 77,286 | |
Federal funds sold and securities purchased under agreements to resell or similar arrangements (includes $27,110 and $0, respectively, related to consolidated trusts) | | 27,610 | | | | | 28,200 | |
| Investments in securities: | | | | | | |
| Trading, at fair value (includes $5,567 and $6,544, respectively, pledged as collateral) | | 97,209 | | | | | 136,542 | |
| Available-for-sale, at fair value (with an amortized cost of $873 and $1,606, net of allowance for credit losses of $0 and $3 as of September 30, 2021 and December 31, 2020, respectively) | | 886 | | | | | 1,697 | |
| Total investments in securities | | 98,095 | | | | | 138,239 | |
| Mortgage loans: | | | | | | |
| Loans held for sale, at lower of cost or fair value | | 7,489 | | | | | 5,197 | |
| Loans held for investment, at amortized cost: | | | | | | |
| Of Fannie Mae | | 70,936 | | | | | 112,726 | |
| Of consolidated trusts | | 3,831,578 | | | | | 3,546,521 | |
| Total loans held for investment (includes $5,301 and 6,490, respectively, at fair value) | | 3,902,514 | | | | | 3,659,247 | |
| Allowance for loan losses | | (6,334) | | | | | (10,552) | |
| Total loans held for investment, net of allowance | | 3,896,180 | | | | | 3,648,695 | |
| Total mortgage loans | | 3,903,669 | | | | | 3,653,892 | |
| Advances to lenders | | 9,924 | | | | | 10,449 | |
| Deferred tax assets, net | | 13,128 | | | | | 12,947 | |
| Accrued interest receivable, net (includes $9,544 and $9,635, respectively, related to consolidated trusts and net of an allowance of $118 and $216 as of September 30, 2021 and December 31, 2020, respectively) | | 9,895 | | | | | 9,937 | |
| Acquired property, net | | 1,261 | | | | | 1,261 | |
| Other assets | | 12,163 | | | | | 15,201 | |
| Total assets | | $ | 4,209,209 | | | | | $ | 3,985,749 | |
| LIABILITIES AND EQUITY |
| Liabilities: | | | | | | |
| Accrued interest payable (includes $8,563 and $8,955, respectively, related to consolidated trusts) | | $ | 9,299 | | | | | $ | 9,719 | |
| Debt: | | | | | | |
| Of Fannie Mae (includes $2,633 and $3,728, respectively, at fair value) | | 234,843 | | | | | 289,572 | |
| Of consolidated trusts (includes $23,020 and $24,586, respectively, at fair value) | | 3,907,626 | | | | | 3,646,164 | |
| Other liabilities (includes $1,233 and $1,523, respectively, related to consolidated trusts) | | 15,268 | | | | | 15,035 | |
| Total liabilities | | 4,167,036 | | | | | 3,960,490 | |
| Commitments and contingencies (Note 13) | | — | | | | | — | |
| Fannie Mae stockholders’ equity: | | | | | | |
| Senior preferred stock (liquidation preference of $158,844 and $142,192, respectively) | | 120,836 | | | | | 120,836 | |
| Preferred stock, 700,000,000 shares are authorized—555,374,922 shares issued and outstanding | | 19,130 | | | | | 19,130 | |
Common stock, no par value, no maximum authorization—1,308,762,703 shares issued and 1,158,087,567 shares outstanding | | 687 | | | | | 687 | |
| Accumulated deficit | | (91,123) | | | | | (108,110) | |
| Accumulated other comprehensive income | | 43 | | | | | 116 | |
| Treasury stock, at cost, 150,675,136 shares | | (7,400) | | | | | (7,400) | |
| Total stockholders’ equity (See Note 1: Senior Preferred Stock Purchase Agreement and Senior Preferred Stock for information on the related dividend obligation and liquidation preference) | | 42,173 | | | | | 25,259 | |
| Total liabilities and equity | | $ | 4,209,209 | | | | | $ | 3,985,749 | |
See Notes to Condensed Consolidated Financial Statements in the Third Quarter 2021 Form 10-Q
| | | | | | | | |
| Third Quarter 2021 Results | 6 |
FANNIE MAE
(In conservatorship)
Condensed Consolidated Statements of Operations and Comprehensive Income - (Unaudited)
(Dollars in millions, except per share amounts)
| | | | | | | | | | | | | | | | | | | | | | | | | | | | | | | | | | | | | | | | | | | | | | | |
| For the Three Months Ended September 30, | | For the Nine Months Ended September 30, |
| |
| 2021 | | 2020 | | 2021 | | | 2020 |
| Interest income: | | | | | | | | | | | | | | | |
| Trading securities | | $ | 134 | | | | | $ | 177 | | | | | $ | 396 | | | | | $ | 712 | | |
| Available-for-sale securities | | 11 | | | | | 19 | | | | | 48 | | | | | 76 | | |
| Mortgage loans | | 24,798 | | | | | 25,810 | | | | | 73,083 | | | | | 81,755 | | |
| Federal funds sold and securities purchased under agreements to resell or similar arrangements | | 5 | | | | | 14 | | | | | 17 | | | | | 135 | | |
| Other | | 33 | | | | | 33 | | | | | 106 | | | | | 92 | | |
| Total interest income | | 24,981 | | | | | 26,053 | | | | | 73,650 | | | | | 82,770 | | |
| Interest expense: | | | | | | | | | | | | | | | |
| Short-term debt | | — | | | | | (19) | | | | | (4) | | | | | (175) | | |
| Long-term debt | | (18,009) | | | | | (19,378) | | | | | (51,646) | | | | | (64,815) | | |
| Total interest expense | | (18,009) | | | | | (19,397) | | | | | (51,650) | | | | | (64,990) | | |
| Net interest income | | 6,972 | | | | | 6,656 | | | | | 22,000 | | | | | 17,780 | | |
| Benefit (provision) for credit losses | | 937 | | | | | 501 | | | | | 4,290 | | | | | (2,094) | | |
| Net interest income after benefit (provision) for credit losses | | 7,909 | | | | | 7,157 | | | | | 26,290 | | | | | 15,686 | | |
| Investment gains, net | | 243 | | | | | 653 | | | | | 934 | | | | | 644 | | |
| Fair value gains (losses), net | | (17) | | | | | (327) | | | | | 321 | | | | | (1,621) | | |
| Fee and other income | | 111 | | | | | 93 | | | | | 301 | | | | | 303 | | |
| Non-interest income (loss) | | 337 | | | | | 419 | | | | | 1,556 | | | | | (674) | | |
| Administrative expenses: | | | | | | | | | | | | | | | |
| Salaries and employee benefits | | (376) | | | | | (386) | | | | | (1,128) | | | | | (1,161) | | |
| Professional services | | (184) | | | | | (230) | | | | | (582) | | | | | (673) | | |
| | | | | | | | | | | | | | | |
| Other administrative expenses | | (185) | | | | | (146) | | | | | (529) | | | | | (431) | | |
| Total administrative expenses | | (745) | | | | | (762) | | | | | (2,239) | | | | | (2,265) | | |
| Foreclosed property expense | | (69) | | | | | (71) | | | | | (105) | | | | | (161) | | |
| Temporary Payroll Tax Cut Continuation Act of 2011 (“TCCA”) fees | | (781) | | | | | (679) | | | | | (2,270) | | | | | (1,976) | | |
| Credit enhancement expense | | (233) | | | | | (325) | | | | | (791) | | | | | (1,061) | | |
| Change in expected credit enhancement recoveries | | (42) | | | | | (48) | | | | | (117) | | | | | 413 | | |
| Other expenses, net | | (268) | | | | | (313) | | | | | (867) | | | | | (792) | | |
| Total expenses | | (2,138) | | | | | (2,198) | | | | | (6,389) | | | | | (5,842) | | |
| Income before federal income taxes | | 6,108 | | | | | 5,378 | | | | | 21,457 | | | | | 9,170 | | |
| Provision for federal income taxes | | (1,266) | | | | | (1,149) | | | | | (4,470) | | | | | (1,935) | | |
| Net income | | 4,842 | | | | | 4,229 | | | | | 16,987 | | | | | 7,235 | | |
| Other comprehensive loss: | | | | | | | | | | | | | | | |
| Changes in unrealized losses on available-for-sale securities, net of reclassification adjustments and taxes | | (10) | | | | | (11) | | | | | (64) | | | | | (4) | | |
| Other, net of taxes | | (4) | | | | | (2) | | | | | (9) | | | | | (7) | | |
| Total other comprehensive loss | | (14) | | | | | (13) | | | | | (73) | | | | | (11) | | |
| Total comprehensive income | | $ | 4,828 | | | | | $ | 4,216 | | | | | $ | 16,914 | | | | | $ | 7,224 | | |
| Net income | | $ | 4,842 | | | | | $ | 4,229 | | | | | $ | 16,987 | | | | | $ | 7,235 | | |
| Dividends distributed or amounts attributable to senior preferred stock | | (4,828) | | | | | (4,216) | | | | | (16,914) | | | | | (7,224) | | |
| Net income attributable to common stockholders | | $ | 14 | | | | | $ | 13 | | | | | $ | 73 | | | | | $ | 11 | | |
| Earnings per share: | | | | | | | | | | | | | | | |
| Basic | | $ | 0.00 | | | | | $ | 0.00 | | | | | $ | 0.01 | | | | | $ | 0.00 | | |
| Diluted | | 0.00 | | | | | 0.00 | | | | | 0.01 | | | | | 0.00 | | |
| Weighted-average common shares outstanding: | | | | | | | | | | | | | | | |
| Basic | | 5,867 | | | | | 5,867 | | | | | 5,867 | | | | | 5,867 | | |
| Diluted | | 5,893 | | | | | 5,893 | | | | | 5,893 | | | | | 5,893 | | |
See Notes to Condensed Consolidated Financial Statements in the Third Quarter 2021 Form 10-Q
| | | | | | | | |
| Third Quarter 2021 Results | 7 |