Contact: Pete Bakel Resource Center: 1-800-232-6643
202-752-2034 Exhibit 99.1
Date: February 15, 2022
Fannie Mae Reports Net Income of $22.2 Billion for 2021 and
$5.2 Billion for Fourth Quarter 2021
| | | | | | | | | | | | | | |
| • | $22.2 billion annual net income and $5.2 billion fourth quarter 2021 net income, with net worth reaching $47.4 billion as of December 31, 2021 | | “Fannie Mae continued to be a crucial source of mortgage financing in 2021. Our performance was strong and many parts of the housing economy performed well in 2021, but not for everyone. Our housing mission to advance equitable and sustainable access to homeownership and quality, affordable rental housing has never been more important. Much work remains to ensure that America’s housing finance system serves all people fairly and is safe, sound, and properly capitalized.”
Hugh R. Frater, Chief Executive Officer |
| | |
| • | $1.4 trillion in liquidity provided to the Single-Family and Multifamily mortgage markets in 2021 | |
| | |
| • | $451.3 billion of Single-Family home purchase acquisitions in 2021, highest on record and of which nearly 50% were for first-time homebuyers | |
| | |
| • | Acquired 1.5 million home purchase loans and 3.3 million refinance loans during 2021, helping homeowners take advantage of low interest rates | |
| | |
| • | Approximately 694,000 units of rental housing financed in 2021, nearly 95% of which were affordable to families earning at or below 120% of area median income, providing support for both workforce and affordable housing | |
| | |
| • | More than 1.4 million single-family forbearance plans initiated to help borrowers since the onset of the COVID-19 pandemic; as of December 31, 2021, approximately 1.3 million of these loans have exited forbearance, including approximately 788,000 through reinstatement or payoff, and approximately 380,000 through the company’s payment deferral option | |
| | |
| • | Home price growth in 2021 was 19.0%, the highest annual growth rate in the history of Fannie Mae’s home price index | |
| | |
| | |
| | | | |
| | | | |
| | | | |
| |
| | | | |
| | | | | | | | | | | | | | | | | | | | | | | | | | | | | | | | | | | |
| Q4 and Full Year 2021 Key Results |
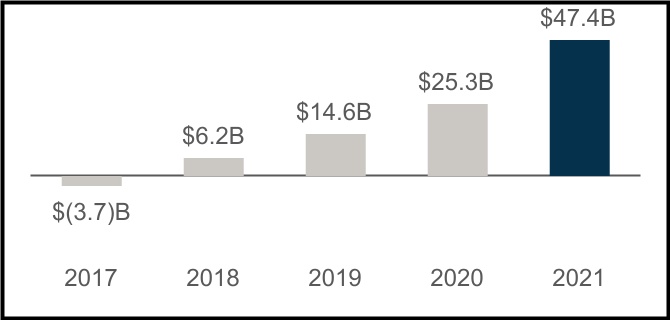
| $47.4 Billion Net Worth | $1.4 Trillion Supporting Housing Activity |
| | | | | | | | | | | |
| Increase of $22.1 billion in 2021 | | SF Home Purchases | | | SF Refinancings | | | MF Rental Units |
| | | | |
| | | | | | | | | | | | | | | | | | | | |
| | | | | | |
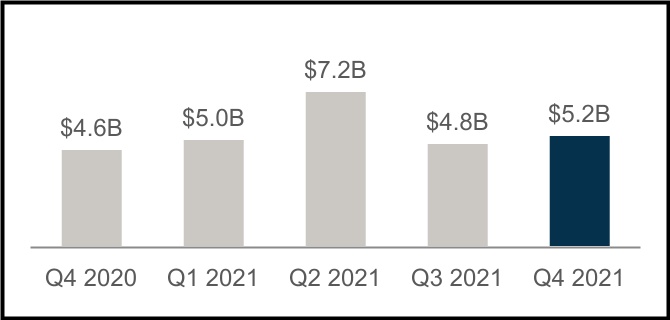
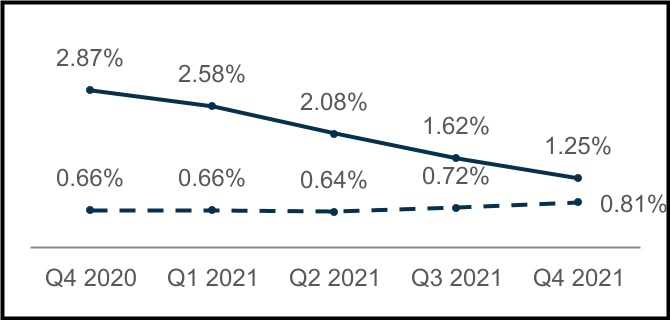
| $5.2 Billion Net Income for Q4 | | Single-Family SDQ Rate |
| | | | | | |
| Increase of $347 million compared with third quarter 2021 | | SDQ Rate | | SDQ Rate excluding loans in forbearance |
|

| | | | | | | | |
| Fourth Quarter and Full Year 2021 Results | 1 |
| | | | | | | | | | | | | | | | | | | | | | | | | | | | | | | | | | | | | | | | | | | | | | | | | | |
| Summary of Financial Results |
| (Dollars in millions) | | 2021 | | 2020 | | Variance | | % Change | | Q421 | | Q321 | | Variance | | % Change |
| Net interest income | | $ | 29,587 | | | $ | 24,866 | | | $ | 4,721 | | | 19 | % | | $ | 7,587 | | | $ | 6,972 | | | $ | 615 | | | 9 | % |
| Fee and other income | | 361 | | | 462 | | | (101) | | | (22) | % | | 60 | | | 111 | | | (51) | | | (46) | % |
| Net revenues | | 29,948 | | | 25,328 | | | 4,620 | | | 18 | % | | 7,647 | | | 7,083 | | | 564 | | | 8 | % |
| Investment gains, net | | 1,352 | | | 907 | | | 445 | | | 49 | % | | 418 | | | 243 | | | 175 | | | 72 | % |
| Fair value gains (losses), net | | 155 | | | (2,501) | | | 2,656 | | | NM | | (166) | | | (17) | | | (149) | | | NM |
| Administrative expenses | | (3,065) | | | (3,068) | | | 3 | | | — | % | | (826) | | | (745) | | | (81) | | | (11) | % |
| Credit-related income (expense) | | 5,097 | | | (855) | | | 5,952 | | | NM | | 912 | | | 868 | | | 44 | | | 5 | % |
| Temporary Payroll Tax Cut Continuation Act of 2011 (TCCA) fees | | (3,071) | | | (2,673) | | | (398) | | | (15) | % | | (801) | | | (781) | | | (20) | | | (3) | % |
| Other expenses, net* | | (2,467) | | | (2,259) | | | (208) | | | (9) | % | | (692) | | | (543) | | | (149) | | | (27) | % |
| Income before federal income taxes | | 27,949 | | | 14,879 | | | 13,070 | | | 88 | % | | 6,492 | | | 6,108 | | | 384 | | | 6 | % |
| Provision for federal income taxes | | (5,773) | | | (3,074) | | | (2,699) | | | (88) | % | | (1,303) | | | (1,266) | | | (37) | | | (3) | % |
| Net income | | $ | 22,176 | | | $ | 11,805 | | | $ | 10,371 | | | 88 | % | | $ | 5,189 | | | $ | 4,842 | | | $ | 347 | | | 7 | % |
| Total comprehensive income | | $ | 22,098 | | | $ | 11,790 | | | $ | 10,308 | | | 87 | % | | $ | 5,184 | | | $ | 4,828 | | | $ | 356 | | | 7 | % |
| Net worth | | $ | 47,357 | | | $ | 25,259 | | | $ | 22,098 | | | 87 | % | | $ | 47,357 | | | $ | 42,173 | | | $ | 5,184 | | | 12 | % |
| | | | | | | | | | | | | | | | |
| | | | | | | | | | | | | | | | |
| NM - Not meaningful | | | | | | | | | | | | | | | | |
| | | | | | | | | | | | | | | | |
* Other expense, net also includes credit enhancement expense and change in expected credit enhancement recoveries |
| | | | | | | | | |
| | | |
| Financial Highlights | |
| | | |
| • | | Net income increased $10.4 billion in 2021, compared with 2020 driven primarily by a shift from credit-related expense to credit-related income, higher net interest income, and a shift from fair value losses to fair value gains. | |
| | | |
| • | | Credit-related income was $5.1 billion in 2021, compared with credit-related expense of $855 million in 2020. Credit-related income in 2021 was driven primarily by strong actual and forecasted home price growth, an increase in the volume of loan redesignations, and a reduction in the company’s estimate of losses it expects to incur as a result of the COVID-19 pandemic, partially offset by increases in interest rates. Credit-related expense in 2020 was driven by the impact of COVID-19 and the associated economic downturn, offset by higher actual and forecasted home prices, lower actual and projected mortgage interest rates, and the redesignation of certain reperforming single-family loans from held-for-investment to held-for-sale. | |
| | | |
| • | | Net interest income increased $4.7 billion in 2021 compared with 2020, driven primarily by higher base guaranty fee income and higher amortization income. The company’s base guaranty fee income grew as a result of growth in its guaranty book of business to $3.9 trillion in 2021, from $3.6 trillion in 2020, coupled with an increase in the company’s average charged guaranty fee. Single-family refinances of $903.7 billion in 2021 drove significant prepayment activity resulting in elevated amortization income during the year. Single-family mortgage loan prepayment activity slowed in the later part of 2021; however, refinancing activity remained strong throughout most of 2021 due to the continued low interest-rate environment. | |
| | | |
| • | | Fair value gains were $155 million in 2021, compared with fair value losses of $2.5 billion in 2020. Fair value gains in 2021 were driven primarily by declines in the fair value of risk management derivatives and trading securities, offset by the impact of hedge accounting. Fair value losses in 2020, before the company implemented hedge accounting, were driven primarily by declines in the fair value of commitments to sell mortgage-related securities as prices increased during the commitment period. | |
| | | |
| |
| |
| | | | | | | | |
| Fourth Quarter and Full Year 2021 Results | 2 |
| | | | | | |
| Single-Family Business Financial Results |
| | | | | | | | | | | | | | | | | | | | | | | | | | | | | | | | | | | | | | | | | | | | | | | | | | | | |
| (Dollars in millions) | | 2021 | | 2020 | | Variance | | % Change | | | | Q4 2021 | | Q3 2021 | | Variance | | % Change |
| Net interest income | | $ | 25,429 | | | $ | 21,502 | | | $ | 3,927 | | | 18 | % | | | | $ | 6,342 | | | $ | 5,870 | | | $ | 472 | | | 8 | % |
| Fee and other income | | 269 | | | 368 | | | (99) | | | (27) | % | | | | 41 | | | 86 | | | (45) | | | (52) | % |
| Net revenues | | 25,698 | | | 21,870 | | | 3,828 | | | 18 | % | | | | 6,383 | | | 5,956 | | | 427 | | | 7 | % |
| Investment gains, net | | 1,392 | | | 728 | | | 664 | | | 91 | % | | | | 448 | | | 222 | | | 226 | | | 102 | % |
| Fair value gains (losses), net | | 167 | | | (2,539) | | | 2,706 | | | NM | | | | (156) | | | (31) | | | (125) | | | NM |
| Administrative expenses | | (2,557) | | | (2,559) | | | 2 | | | — | % | | | | (695) | | | (620) | | | (75) | | | (12) | % |
| Credit-related income (expense) | | 4,586 | | | (232) | | | 4,818 | | | NM | | | | 575 | | | 807 | | | (232) | | | (29) | % |
| Temporary Payroll Tax Cut Continuation Act of 2011 (TCCA) fees | | (3,071) | | | (2,673) | | | (398) | | | (15) | % | | | | (801) | | | (781) | | | (20) | | | (3) | % |
Other expenses, net* | | (2,092) | | | (2,107) | | | 15 | | | 1 | % | | | | (509) | | | (463) | | | (46) | | | (10) | % |
| Income before federal income taxes | | 24,123 | | | 12,488 | | | 11,635 | | | 93 | % | | | | 5,245 | | | 5,090 | | | 155 | | | 3 | % |
| Provision for federal income taxes | | (4,996) | | | (2,607) | | | (2,389) | | | (92) | % | | | | (1,044) | | | (1,065) | | | 21 | | | 2 | % |
| Net income | | $ | 19,127 | | | $ | 9,881 | | | $ | 9,246 | | | 94 | % | | | | $ | 4,201 | | | $ | 4,025 | | | $ | 176 | | | 4 | % |
| | | | | | | | | | | | | | | | | | |
| Average charged guaranty fee on new conventional acquisitions, net of TCCA | | 47.6 bps | | 46.4 bps | | 1.2 bps | | 3 | % | | | | 47.1 bps | | 47.3 bps | | (0.2) bps | | — | % |
| Average charged guaranty fee on conventional guaranty book of business, net of TCCA | | 45.2 bps | | 44.2 bps | | 1.0 bps | | 2 | % | | | | 45.5 bps | | 45.4 bps | | 0.1 bps | | — | % |
| | | | | | | | | | | | | | | | | | |
| NM - Not meaningful | | | | | | | | | | | | | | | | | | |
| | | | | | | | | | | | | | | | | | |
* Other expense, net also includes credit enhancement expense and change in expected credit enhancement recoveries |
| | | | | | | | | | | | | | | | | | |
| | | | | | | | | | | | | | | | | | |
| | | | | | | | | | | | | | | | | | |
| | | | | | |
|
| | |
| | |
| | |
| Key Business Highlights |
| | |
| • | Single-family conventional acquisition volume was $1.4 trillion in 2021. Purchase acquisition volume was $451.3 billion in 2021, the highest on record, of which nearly 50% was for first-time homebuyers. Refinance acquisition volume was $903.7 billion in 2021, a decline from $947.8 billion in 2020, the highest on record. Both purchase and refinance volumes remained elevated due to the continued low interest-rate environment. | |
| | |
| • | Average single-family conventional guaranty book of business in 2021 increased from 2020 by 9.5% driven primarily by growth in the average balance of loans acquired during the year. Record home price appreciation in 2021 has reduced the weighted-average mark-to-market loan-to-value ratio of the company’s single-family conventional guaranty book of business to 54% as of December 31, 2021. The weighted average FICO credit score of the company’s single-family conventional guaranty book of business was 753 as of December 31, 2021. | |
| | |
| • | Average charged guaranty fee, net of TCCA fees, on the single-family conventional guaranty book increased from 44.2 basis points as December 31, 2020 to 45.2 basis points as of December 31, 2021. Average charged guaranty fee on newly acquired single-family conventional loans, net of TCCA fees, increased 1.2 basis points to 47.6 basis points in 2021, compared with 46.4 basis points in 2020. | |
| | |
| • | As of December 31, 2021, 0.7% of the single-family guaranty book of business based on loan count, or 117,440 loans, was in forbearance, the vast majority of which was related to the COVID-19 pandemic, compared with 3.0% as of December 31, 2020. Since the start of the pandemic, 88% of loans that entered forbearance have successfully exited. | |
| | |
| • | Single-family serious delinquency rate decreased to 1.25% as of December 31, 2021, from 1.62% as of September 30, 2021 and 2.87% as of December 31, 2020, due to the on-going economic recovery and the decline in the number of the company’s single-family loans in a COVID-19 forbearance plan. Single-family serious delinquency rate, excluding loans in forbearance, increased to 0.81% as of December 31, 2021, from 0.72% as of September 30, 2021 and 0.66% as of December 31, 2020, due primarily to loans exiting forbearance and entering into trial modifications. The company expects the majority of loans exiting forbearance and entering trial modifications currently and in the future will successfully complete their trial modification periods. Upon successful completion of a trial modification period (typically lasting three to four months), a loan will no longer be considered seriously delinquent. Single-family seriously delinquent loans are loans that are 90 days or more past due or in the foreclosure process. | |
| | | | | | | | |
| Fourth Quarter and Full Year 2021 Results | 3 |
| | | | | | | | | | | | | | | | | | | | | | | | | | | | | | | | | | | | | | | | | | | | | | | | | | | | |
| Multifamily Business Financial Results |
| (Dollars in millions) | | 2021 | | 2020 | | Variance | | % Change | | | | Q4 2021 | | Q3 2021 | | Variance | | % Change |
| Net interest income | | $ | 4,158 | | | $ | 3,364 | | | $ | 794 | | | 24 | % | | | | $ | 1,245 | | | $ | 1,102 | | | $ | 143 | | | 13 | % |
| Fee and other income | | 92 | | | 94 | | | (2) | | | (2) | % | | | | 19 | | | 25 | | | (6) | | | (24) | % |
| Net revenues | | 4,250 | | | 3,458 | | | 792 | | | 23 | % | | | | 1,264 | | | 1,127 | | | 137 | | | 12 | % |
| | | | | | | | | | | | | | | | | | |
| Fair value gains (losses), net | | (12) | | | 38 | | | (50) | | | NM | | | | (10) | | | 14 | | | (24) | | | NM |
| Administrative expenses | | (508) | | | (509) | | | 1 | | | — | % | | | | (131) | | | (125) | | | (6) | | | (5) | % |
| Credit-related income (expenses) | | 511 | | | (623) | | | 1,134 | | | NM | | | | 337 | | | 61 | | | 276 | | | NM |
| Credit enhancement expense | | (239) | | | (220) | | | (19) | | | (9) | % | | | | (67) | | | (59) | | | (8) | | | (14) | % |
| Change in expected credit enhancement recoveries | | (108) | | | 144 | | | (252) | | | NM | | | | (92) | | | (14) | | | (78) | | | NM |
| Other income (expense), net | | (68) | | | 103 | | | (171) | | | NM | | | | (54) | | | 14 | | | (68) | | | NM |
| Income before federal income taxes | | 3,826 | | | 2,391 | | | 1,435 | | | 60 | % | | | | 1,247 | | | 1,018 | | | 229 | | | 22 | % |
| Provision for federal income taxes | | (777) | | | (467) | | | (310) | | | (66) | % | | | | (259) | | | (201) | | | (58) | | | (29) | % |
| Net income | | $ | 3,049 | | | $ | 1,924 | | | $ | 1,125 | | | 58 | % | | | | $ | 988 | | | $ | 817 | | | $ | 171 | | | 21 | % |
| | | | | | | | | | | | | | | | | | |
| Average charged guaranty fee rate on multifamily guaranty book of business, at period end | | 78.4 bps | | 74.5 bps | | 3.9 bps | | 5% | | | | 78.4 bps | | 77.5 bps | | 0.9 bps | | 1% |
| | | | | | | | | | | | | | | | | | |
| NM - Not meaningful | | | | | | | | | | | | | | | | | | |
| | | | | | | | | | | | | | | | | | |
| | | | | | | | | | | | | | | | | | |
| | | | | | | | | | | | | | | | | | |
| | | | | | |
| | |
| Key Business Highlights |
| | |
| • | New multifamily business volume was $69.5 billion in 2021, in compliance with the $70 billion volume cap established by the Federal Housing Finance Agency (FHFA) for 2021. The company’s 2021 business volume also met FHFA’s requirement that a minimum of 50% of volume be mission-driven, focused on specified affordable and underserved market segments, with 20% affordable to residents earning 60% of area median income or below. The cap for 2022 is $78 billion, with a minimum of 50% mission-driven volume, and 25% of loan purchases affordable to residents earning 60% or less of area median income. | |
| | |
| • | The multifamily guaranty book of business grew by 7% in 2021 to $413.1 billion. The average charged guaranty fee on the multifamily book increased from 74.5 basis points as of December 31, 2020 to 78.4 basis points as of December 31, 2021. These changes contributed to an increase in guaranty fee revenue, which, along with higher yield maintenance revenue due to higher prepayment volumes, drove the year-over-year increase in net interest income. | |
| | |
| • | As of December 31, 2021, nearly 90% of the loans in the company’s multifamily guaranty book of business that had received a forbearance, measured by unpaid principal balance, were in a repayment plan or reinstated. Less than 0.1% of the multifamily book, or $363 million in unpaid principal balance, was still in active forbearance, with 66% resulting from COVID-19-related financial hardship. | |
| | |
| • | The multifamily serious delinquency rate remained flat at 0.42% as of December 31, 2021, compared with September 30, 2021, and decreased from 0.98% as of December 31, 2020, driven primarily by the on-going economic recovery resulting in loans that received forbearance completing repayment plans or otherwise reinstating, offset by an increase in forbearance resulting from natural disaster-related financial hardship. The multifamily serious delinquency rate, excluding loans that received a forbearance, increased slightly to 0.04% as of December 31, 2021 from 0.03% as of September 30, 2021 and December 31, 2020. Multifamily seriously delinquent loans are loans that are 60 days or more past due. | |
| | | | | | | | |
| Fourth Quarter and Full Year 2021 Results | 4 |
Fannie Mae’s Consolidated Balance Sheets and Statements of Operations and Income for the full year of 2021 are available in the accompanying Annex; however, investors and interested parties should read the company’s 2021 Form 10-K, which was filed today with the Securities and Exchange Commission and is available on Fannie Mae’s website, www.fanniemae.com. The company provides further discussion of its financial results and condition, credit performance, and other matters in its 2021 Form 10-K. Additional information about the company’s financial and credit performance is contained in Fannie Mae’s “Q4 and Full Year 2021 Financial Supplement” at www.fanniemae.com.
# # #
In this release, the company has presented a forward-looking statement regarding the performance of the company’s loans in trial modifications. Actual outcomes could be materially different due to a variety of factors, including those described in “Forward-Looking Statements” and “Risk Factors” in the company’s 2021 Form 10-K.
Fannie Mae provides website addresses in its news releases solely for readers’ information. Other content or information appearing on these websites is not part of this release.
Fannie Mae advances equitable and sustainable access to homeownership and quality, affordable rental housing for millions of people across America. We enable the 30-year fixed-rate mortgage and drive responsible innovation to make homebuying and renting easier, fairer, and more accessible. To learn more, visit fanniemae.com and follow us on twitter.com/fanniemae.
| | | | | | | | |
| Fourth Quarter and Full Year 2021 Results | 5 |
ANNEX
FANNIE MAE
Consolidated Balance Sheets
(Dollars in millions)
| | | | | | | | | | | | | | | | | | | | | | | |
| As of December 31, 2021 |
| 2021 | | 2020 |
| ASSETS | |
| Cash and cash equivalents | | $ | 42,448 | | | | | $ | 38,337 | | |
| Restricted cash and cash equivalents (includes $59,203 and $68,308, respectively, related to consolidated trusts) | | 66,183 | | | | | 77,286 | | |
| Securities purchased under agreements to resell or similar arrangements (includes $13,533 and $0, respectively, related to consolidated trusts) | | 20,743 | | | | | 28,200 | | |
| Investments in securities: | | | | | | | |
| Trading, at fair value (includes $4,224 and $6,544, respectively, pledged as collateral) | | 88,206 | | | | | 136,542 | | |
| Available-for-sale, at fair value (with an amortized cost of $827 and $1,606, net of allowance for credit losses of $0 and $3, respectively) | | 837 | | | | | 1,697 | | |
| Total investments in securities | | 89,043 | | | | | 138,239 | | |
| Mortgage loans: | | | | | | | |
| Loans held for sale, at lower of cost or fair value | | 5,134 | | | | | 5,197 | | |
| Loans held for investment, at amortized cost: | | | | | | | |
| Of Fannie Mae | | 61,025 | | | | | 112,726 | | |
| Of consolidated trusts | | 3,907,712 | | | | | 3,546,521 | | |
| Total loans held for investment (includes $4,964 and 6,490, respectively, at fair value) | | 3,968,737 | | | | | 3,659,247 | | |
| Allowance for loan losses | | (5,629) | | | | | (10,552) | | |
| Total loans held for investment, net of allowance | | 3,963,108 | | | | | 3,648,695 | | |
| Total mortgage loans | | 3,968,242 | | | | | 3,653,892 | | |
| Advances to lenders | | 8,414 | | | | | 10,449 | | |
| Deferred tax assets, net | | 12,715 | | | | | 12,947 | | |
| Accrued interest receivable, net (includes $8,878 and $9,635, respectively, related to consolidated trusts and net of an allowance of $140 and $216, respectively) | | 9,264 | | | | | 9,937 | | |
| Acquired property, net | | 1,259 | | | | | 1,261 | | |
| Other assets | | 10,855 | | | | | 15,201 | | |
| Total assets | | $ | 4,229,166 | | | | | $ | 3,985,749 | | |
| LIABILITIES AND EQUITY | |
| Liabilities: | | | | | | | |
| Accrued interest payable (includes $8,517 and $8,955, respectively, related to consolidated trusts) | | $ | 9,186 | | | | | $ | 9,719 | | |
| Debt: | | | | | | | |
| Of Fannie Mae (includes $2,381 and $3,728, respectively, at fair value) | | 200,892 | | | | | 289,572 | | |
| Of consolidated trusts (includes $21,735 and $24,586, respectively, at fair value) | | 3,957,299 | | | | | 3,646,164 | | |
| Other liabilities (includes $1,245 and $1,523, respectively, related to consolidated trusts) | | 14,432 | | | | | 15,035 | | |
| Total liabilities | | 4,181,809 | | | | | 3,960,490 | | |
| Commitments and contingencies (Note 16) | | — | | | | | — | | |
| Fannie Mae stockholders’ equity: | | | | | | | |
| Senior preferred stock (liquidation preference of $163,672 and $142,192, respectively) | | 120,836 | | | | | 120,836 | | |
| Preferred stock, 700,000,000 shares are authorized—555,374,922 shares issued and outstanding | | 19,130 | | | | | 19,130 | | |
Common stock, no par value, no maximum authorization—1,308,762,703 shares issued and 1,158,087,567 shares outstanding | | 687 | | | | | 687 | | |
| Accumulated deficit | | (85,934) | | | | | (108,110) | | |
| Accumulated other comprehensive income | | 38 | | | | | 116 | | |
| Treasury stock, at cost, 150,675,136 shares | | (7,400) | | | | | (7,400) | | |
| Total stockholders’ equity (See Note 1: Senior Preferred Stock Purchase Agreement, Senior Preferred Stock and Warrant for information on the related dividend obligation and liquidation preference) | | 47,357 | | | | | 25,259 | | |
| Total liabilities and equity | | $ | 4,229,166 | | | | | $ | 3,985,749 | | |
See Notes to Consolidated Financial Statements in the 2021 Form 10-K
| | | | | | | | |
| Fourth Quarter and Full Year 2021 Results | 6 |
FANNIE MAE
(In conservatorship)
Consolidated Statements of Operations and Comprehensive Income
(Dollars in millions, except per share amounts)
| | | | | | | | | | | | | | | | | | | | | | | | | | | | | | | | | | | | | | | | | | | | |
| | | | | For the Twelve Months ended December 31, | |
| | | | |
| 2021 | | 2020 | | 2019 |
| Interest income: | | | | | | | | | | | | | | | | | | | | |
| Trading securities | | | | | | | | | | | $ | 524 | | | | | $ | 874 | | | | | $ | 1,627 | | |
| Available-for-sale securities | | | | | | | | | | | 58 | | | | | 98 | | | | | 175 | | |
| Mortgage loans | | | | | | | | | | | 98,930 | | | | | 106,316 | | | | | 117,374 | | |
| Securities purchased under agreements to resell or similar arrangements | | | | | | | | | | | 21 | | | | | 146 | | | | | 843 | | |
| Other | | | | | | | | | | | 142 | | | | | 135 | | | | | 163 | | |
| Total interest income | | | | | | | | | | | 99,675 | | | | | 107,569 | | | | | 120,182 | | |
| Interest expense: | | | | | | | | | | | | | | | | | | | | |
| Short-term debt | | | | | | | | | | | (4) | | | | | (182) | | | | | (501) | | |
| Long-term debt | | | | | | | | | | | (70,084) | | | | | (82,521) | | | | | (98,388) | | |
| Total interest expense | | | | | | | | | | | (70,088) | | | | | (82,703) | | | | | (98,889) | | |
| Net interest income | | | | | | | | | | | 29,587 | | | | | 24,866 | | | | | 21,293 | | |
| Benefit (provision) for credit losses | | | | | | | | | | | 5,130 | | | | | (678) | | | | | 4,011 | | |
| Net interest income after benefit (provision) for credit losses | | | | | | | | | | | 34,717 | | | | | 24,188 | | | | | 25,304 | | |
| Investment gains, net | | | | | | | | | | | 1,352 | | | | | 907 | | | | | 1,770 | | |
| Fair value gains (losses), net | | | | | | | | | | | 155 | | | | | (2,501) | | | | | (2,214) | | |
| Fee and other income | | | | | | | | | | | 361 | | | | | 462 | | | | | 566 | | |
| Non-interest income (loss) | | | | | | | | | | | 1,868 | | | | | (1,132) | | | | | 122 | | |
| Administrative expenses: | | | | | | | | | | | | | | | | | | | | |
| Salaries and employee benefits | | | | | | | | | | | (1,493) | | | | | (1,554) | | | | | (1,486) | | |
| Professional services | | | | | | | | | | | (817) | | | | | (921) | | | | | (967) | | |
| | | | | | | | | | | | | | | | | | | | |
| Other administrative expenses | | | | | | | | | | | (755) | | | | | (593) | | | | | (570) | | |
| Total administrative expenses | | | | | | | | | | | (3,065) | | | | | (3,068) | | | | | (3,023) | | |
| Foreclosed property expense | | | | | | | | | | | (33) | | | | | (177) | | | | | (515) | | |
| Temporary Payroll Tax Cut Continuation Act of 2011 (“TCCA”) fees | | | | | | | | | | | (3,071) | | | | | (2,673) | | | | | (2,432) | | |
| Credit enhancement expense | | | | | | | | | | | (1,051) | | | | | (1,361) | | | | | (1,134) | | |
| Change in expected credit enhancement recoveries | | | | | | | | | | | (194) | | | | | 233 | | | | | — | | |
| Other expenses, net | | | | | | | | | | | (1,222) | | | | | (1,131) | | | | | (745) | | |
| Total expenses | | | | | | | | | | | (8,636) | | | | | (8,177) | | | | | (7,849) | | |
| Income before federal income taxes | | | | | | | | | | | 27,949 | | | | | 14,879 | | | | | 17,577 | | |
| Provision for federal income taxes | | | | | | | | | | | (5,773) | | | | | (3,074) | | | | | (3,417) | | |
| Net income | | | | | | | | | | | 22,176 | | | | | 11,805 | | | | | 14,160 | | |
| Other comprehensive loss: | | | | | | | | | | | | | | | | | | | | |
| Changes in unrealized gains on available-for-sale securities, net of reclassification adjustments and taxes | | | | | | | | | | | (67) | | | | | (23) | | | | | (179) | | |
| Other, net of taxes | | | | | | | | | | | (11) | | | | | 8 | | | | | (12) | | |
| Total other comprehensive loss | | | | | | | | | | | (78) | | | | | (15) | | | | | (191) | | |
| Total comprehensive income | | | | | | | | | | | $ | 22,098 | | | | | $ | 11,790 | | | | | $ | 13,969 | | |
| Net income | | | | | | | | | | | $ | 22,176 | | | | | $ | 11,805 | | | | | $ | 14,160 | | |
| Dividends distributed or amounts attributable to senior preferred stock | | | | | | | | | | | (22,098) | | | | | (11,790) | | | | | (13,969) | | |
| Net income attributable to common stockholders | | | | | | | | | | | $ | 78 | | | | | $ | 15 | | | | | $ | 191 | | |
| Earnings per share: | | | | | | | | | | | | | | | | | | | | |
| Basic | | | | | | | | | | | $ | 0.01 | | | | | $ | 0.00 | | | | | $ | 0.03 | | |
| Diluted | | | | | | | | | | | 0.01 | | | | | 0.00 | | | | | 0.03 | | |
| Weighted-average common shares outstanding: | | | | | | | | | | | | | | | | | | | | |
| Basic | | | | | | | | | | | 5,867 | | | | | 5,867 | | | | | 5,762 | | |
| Diluted | | | | | | | | | | | 5,893 | | | | | 5,893 | | | | | 5,893 | | |
See Notes to Consolidated Financial Statements in the 2021 Form 10-K
| | | | | | | | |
| Fourth Quarter and Full Year 2021 Results | 7 |