Contact: Pete Bakel Resource Center: 1-800-232-6643
202-752-2034 Exhibit 99.1
Date: May 3, 2022
Fannie Mae Reports Net Income of $4.4 Billion for First Quarter 2022
| | | | | | | | | | | | | | |
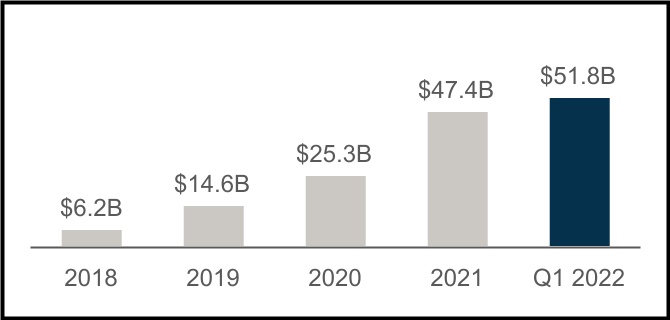
| • | $4.4 billion net income for the first quarter of 2022, with net worth reaching $51.8 billion as of March 31, 2022 | | “Fannie Mae’s solid first quarter results were set against a backdrop of rising interest rates, inflationary pressures, robust home price appreciation, and geopolitical tensions. We continue to focus on the needs of renters and homeowners as they navigate these challenges and on prudently managing our risk.”
David C. Benson, President and Interim Chief Executive Officer |
| | |
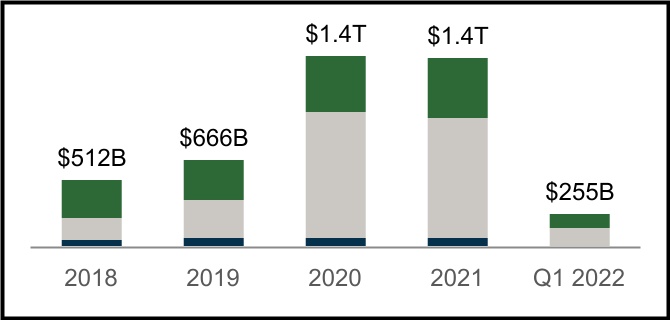
| • | $255 billion in liquidity provided to the Single-Family and Multifamily mortgage markets in the first quarter of 2022 | |
| | |
| • | $104 billion of Single-Family home purchase acquisitions in the first quarter of 2022, of which nearly 50% were for first-time homebuyers | |
| | |
| • | Acquired approximately 312,000 home purchase loans and 487,000 refinance loans during the first quarter of 2022, helping homeowners take advantage of low interest rates | |
| | |
| • | Approximately 136,000 units of rental housing financed in the first quarter of 2022, a significant majority of which were affordable to families earning at or below 120% of area median income, providing support for both workforce and affordable housing | |
| | |
| • | Mortgage interest rates increased 1.56 percentage points during the first quarter of 2022, from 3.11% as of December 31, 2021 to 4.67% as of March 31, 2022, the fastest increase since 1994 | |
| | |
| | |
| | |
| | |
| | | | |
| | | | |
| | | | |
| |
| | | | |
| | | | | | | | | | | | | | | | | | | | | | | | | | | | | | | | | | | |
| Q1 2022 Key Results |
|
| $51.8 Billion Net Worth | $255 Billion Supporting Housing Activity |
| | | | | | | | | | | |
| Increase of $4.4 Billion in the first quarter of 2022 | | SF Home Purchases | | | SF Refinancings | | | MF Rental Units |
| | | | |
| | | | | | | | | | | | | | | | | | | | |
| | | | | | |
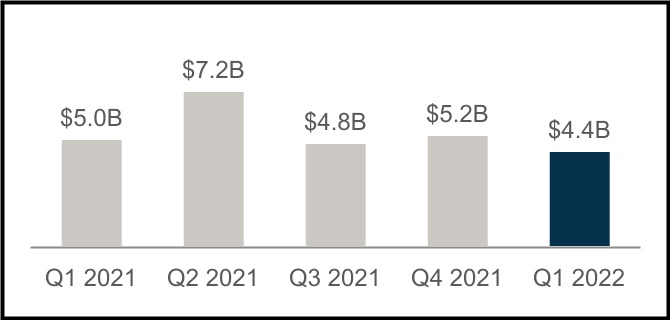
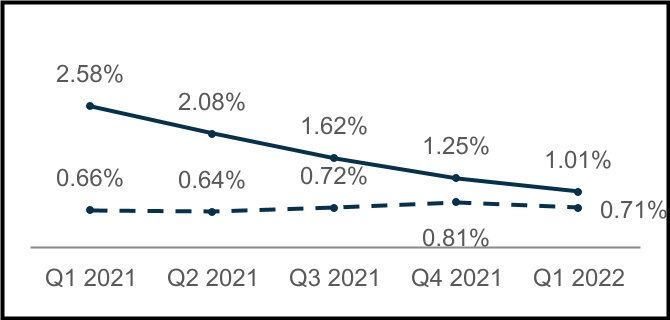
$4.4 Billion Net Income for Q1 2022 | Single-Family SDQ Rate |
| | | | | | |
| Decrease of $781 Million compared with fourth quarter 2021 | | SDQ Rate | | SDQ Rate excluding loans in forbearance |
|

| | | | | | | | |
| First Quarter 2022 Results | 1 |
| | | | | | | | | | | | | | | | | | | | | | | | | | | | | | | | | | | | | | | | | | | | | | |
| Summary of Financial Results |
| | | | | | | | | | | | | | | | |
| (Dollars in millions) | | Q122 | | Q421 | | Variance | | % Change | | Q121 | | | | Variance | | % Change |
| Net interest income | | $ | 7,399 | | | $ | 7,587 | | | $ | (188) | | | (2) | % | | $ | 6,742 | | | | | $ | 657 | | | 10 | % |
| Fee and other income | | 83 | | | 60 | | | 23 | | | 38 | % | | 87 | | | | | (4) | | | (5) | % |
| Net revenues | | 7,482 | | | 7,647 | | | (165) | | | (2) | % | | 6,829 | | | | | 653 | | | 10 | % |
| Investment gains (losses), net | | (102) | | | 418 | | | (520) | | | NM | | 45 | | | | | (147) | | | NM |
| Fair value gains (losses), net | | 480 | | | (166) | | | 646 | | | NM | | 784 | | | | | (304) | | | (39) | % |
| Administrative expenses | | (808) | | | (826) | | | 18 | | | 2 | % | | (748) | | | | | (60) | | | (8) | % |
| Credit-related income (expense) | | (201) | | | 912 | | | (1,113) | | | NM | | 770 | | | | | (971) | | | NM |
| TCCA fees | | (824) | | | (801) | | | (23) | | | (3) | % | | (731) | | | | | (93) | | | (13) | % |
| Credit enhancement expense | | (278) | | | (260) | | | (18) | | | (7) | % | | (284) | | | | | 6 | | | 2 | % |
| Change in expected credit enhancement recoveries | | 60 | | | (77) | | | 137 | | | NM | | (31) | | | | | 91 | | | NM |
| Other expenses, net | | (236) | | | (355) | | | 119 | | | 34 | % | | (319) | | | | | 83 | | | 26 | % |
| | | | | | | | | | | | | | | | |
| Income before federal income taxes | | 5,573 | | | 6,492 | | | (919) | | | (14) | % | | 6,315 | | | | | (742) | | | (12) | % |
| Provision for federal income taxes | | (1,165) | | | (1,303) | | | 138 | | | 11 | % | | (1,322) | | | | | 157 | | | 12 | % |
| Net income | | $ | 4,408 | | | $ | 5,189 | | | $ | (781) | | | (15) | % | | $ | 4,993 | | | | | $ | (585) | | | (12) | % |
| | | | | | | | | | | | | | | | |
| Total comprehensive income | | $ | 4,401 | | | $ | 5,184 | | | $ | (783) | | | (15) | % | | $ | 4,966 | | | | | $ | (565) | | | (11) | % |
| Net worth | | $ | 51,758 | | | $ | 47,357 | | | $ | 4,401 | | | 9 | % | | $ | 30,225 | | | | | $ | 21,533 | | | 71 | % |
| | | | | | | | | | | | | | | | |
| | | | | | | | | | | | | | | | |
| NM - Not meaningful | | | | | | | | | | | | | | | | |
| | | | | | | | | | | | | | | | |
|
| | | | | | | | | |
| | | |
| Financial Highlights | |
| | | |
| • | | Net income decreased $781 million in the first quarter of 2022, compared with the fourth quarter of 2021, driven primarily by a shift from credit-related income to credit-related expense and a shift from investment gains to investment losses, partially offset by a shift from fair value losses to fair value gains. | |
| | | |
| • | | Credit-related expense was $201 million in the first quarter of 2022, compared with credit-related income of $912 million in the fourth quarter of 2021. Credit-related expense in the first quarter of 2022 was driven primarily by increases in actual and projected interest rates related to a population of previously modified loans. ◦Increases in interest rates reduce the expected volume of loan prepayments and extend the expected life of previously modified loans accounted for as troubled debt restructurings, or TDRs, as it is less likely these loans will refinance. ◦As the expected life of these loans extends, the financial impact of economic concessions the company provided on these loans grows, resulting in an increase in the company’s allowance, which drives credit-related expense. ◦This expense was partially offset by some loans previously accounted for as TDRs receiving loss mitigation arrangements during the quarter. As a result of the company’s adoption of new accounting guidance, these loans were removed from the legacy TDR population and prior economic concessions relating to them were released from the company’s allowance, resulting in credit-related income. | |
| | | |
| • | | Investment losses in the first quarter of 2022 were $102 million compared with investment gains of $418 million in the fourth quarter of 2021. The shift from investment gains to investment losses was driven primarily by the absence of loan sales in the first quarter of 2022. | |
| | | |
| • | | Fair value gains were $480 million in the first quarter of 2022, compared with fair value losses of $166 million in the fourth quarter of 2021. Fair value gains in the first quarter of 2022 were driven primarily by increases in the fair value of commitments to sell mortgage-related securities as prices decreased during the commitment period, as well as gains in the fair value of long-term debt of consolidated trusts held at fair value, both due to rising interest rates and widening of the secondary spread. Fair value gains were partially offset by declines in the fair value of fixed-rate trading securities. Fair value hedge accounting, which the company implemented in January 2021, continues to be an effective tool in addressing income statement volatility driven by interest rate changes. | |
| | | |
| | | |
| | | | | | | | |
| First Quarter 2022 Results | 2 |
| | | | | | | | | | | | | | | | | | | | | | | | | | | | | | | | | | | | | | | | | | | | | | | | |
| Single-Family Business Financial Results |
|
| (Dollars in millions) | | Q122 | | Q421 | | Variance | | % Change | | | | Q121 | | | | Variance | | % Change |
| Net interest income | | $ | 6,255 | | | $ | 6,342 | | | $ | (87) | | | (1) | % | | | | $ | 5,894 | | | | | $ | 361 | | | 6 | % |
| Fee and other income | | 61 | | | 41 | | | 20 | | | 49 | % | | | | 62 | | | | | (1) | | | (2) | % |
| Net revenues | | 6,316 | | | 6,383 | | | (67) | | | (1) | % | | | | 5,956 | | | | | 360 | | | 6 | % |
| Investment gains (losses), net | | (66) | | | 448 | | | (514) | | | NM | | | | 64 | | | | | (130) | | | NM |
| Fair value gains (losses), net | | 527 | | | (156) | | | 683 | | | NM | | | | 740 | | | | | (213) | | | (29) | % |
| Administrative expenses | | (683) | | | (695) | | | 12 | | | 2 | % | | | | (623) | | | | | (60) | | | (10) | % |
| Credit-related income (expenses) | | (236) | | | 575 | | | (811) | | | NM | | | | 679 | | | | | (915) | | | NM |
| TCCA fees | | (824) | | | (801) | | | (23) | | | (3) | % | | | | (731) | | | | | (93) | | | (13) | % |
| Credit enhancement expense | | (210) | | | (193) | | | (17) | | | (9) | % | | | | (226) | | | | | 16 | | | 7 | % |
| Change in expected credit enhancement recoveries | | 69 | | | 15 | | | 54 | | | NM | | | | (16) | | | | | 85 | | | NM |
| Other expenses, net | | (198) | | | (331) | | | 133 | | | 40 | % | | | | (287) | | | | | 89 | | | 31 | % |
| Income before federal income taxes | | 4,695 | | | 5,245 | | | (550) | | | (10) | % | | | | 5,556 | | | | | (861) | | | (15) | % |
| Provision for federal income taxes | | (986) | | | (1,044) | | | 58 | | | 6 | % | | | | (1,162) | | | | | 176 | | | 15 | % |
| Net income | | $ | 3,709 | | | $ | 4,201 | | | $ | (492) | | | (12) | % | | | | $ | 4,394 | | | | | $ | (685) | | | (16) | % |
| | | | | | | | | | | | | | | | | | |
| Average charged guaranty fee on new conventional acquisitions, net of TCCA fees | | 48.9 bps | | 47.1 bps | | 1.8 bps | | 4 | % | | | | 48.0 bps | | | | 0.9 bps | | 2 | % |
| Average charged guaranty fee on conventional guaranty book of business, net of TCCA fees | | 45.6 bps | | 45.5 bps | | 0.1 bps | | — | % | | | | 44.9 bps | | | | 0.7 bps | | 2 | % |
| | | | | | | | | | | | | | | | | | |
| NM - Not meaningful | | | | | | | | | | | | | | | | | | |
| | | | | | | | | | | | | | | | | | |
| | | | | | | | | | | | | | | | | | |
| | | | | | | | | | | | | | | | | | |
| | | | | | | | | | | | | | | | | | |
| | | | | | |
|
| | |
| | |
| | |
| Key Business Highlights |
| | |
| • | Single-family conventional acquisition volume was $239.5 billion in the first quarter of 2022, a decrease of 16% compared with $284.8 billion in the fourth quarter of 2021. Purchase acquisition volume decreased from $107.2 billion in the fourth quarter of 2021 to $104.0 billion in the first quarter of 2022, of which nearly 50% was for first-time homebuyers. Refinance acquisition volume was $135.5 billion in the first quarter of 2022, a decline from $177.6 billion in the fourth quarter of 2021. Both purchase and refinance volumes decreased quarter-over-quarter due to the rising rate environment. | |
| | |
| • | Average single-family conventional guaranty book of business in the first quarter of 2022 increased from the the fourth quarter of 2021 by 2.1% driven primarily by growth in the average balance of loans acquired during the quarter. Credit characteristics of the single-family conventional guaranty book of business remained strong, with a weighted-average mark-to-market loan-to-value ratio of 53% and a weighted-average FICO credit score at origination of 753 as of March 31, 2022. | |
| | |
| • | Average charged guaranty fee, net of TCCA fees, on the single-family conventional guaranty book increased to 45.6 basis points as of March 31, 2022. Average charged guaranty fee on newly acquired single-family conventional loans, net of TCCA fees, increased 1.8 basis points to 48.9 basis points for the first quarter of 2022, compared with 47.1 basis points for the fourth quarter of 2021. | |
| | |
| • | Single-family serious delinquency rate decreased to 1.01% as of March 31, 2022, from 1.25% as of December 31, 2021 driven by single-family loans exiting forbearance through a loan workout or by otherwise reinstating their loan. Single-family seriously delinquent loans are loans that are 90 days or more past due or in the foreclosure process. | |
| | | | | | | | |
| First Quarter 2022 Results | 3 |
| | | | | | | | | | | | | | | | | | | | | | | | | | | | | | | | | | | | | | | | | | | | | | | | |
| Multifamily Business Financial Results |
|
| (Dollars in millions) | | Q122 | | Q421 | | Variance | | % Change | | | | Q121 | | | | Variance | | % Change |
| Net interest income | | $ | 1,144 | | | $ | 1,245 | | | $ | (101) | | | (8) | % | | | | $ | 848 | | | | | $ | 296 | | | 35 | % |
| Fee and other income | | 22 | | | 19 | | | 3 | | | 16 | % | | | | 25 | | | | | (3) | | | (12) | % |
| Net revenues | | 1,166 | | | 1,264 | | | (98) | | | (8) | % | | | | 873 | | | | | 293 | | | 34 | % |
| | | | | | | | | | | | | | | | | | |
| Fair value gains (losses), net | | (47) | | | (10) | | | (37) | | | NM | | | | 44 | | | | | (91) | | | NM |
| Administrative expenses | | (125) | | | (131) | | | 6 | | | 5 | % | | | | (125) | | | | | — | | | — | % |
| Credit-related income | | 35 | | | 337 | | | (302) | | | (90) | % | | | | 91 | | | | | (56) | | | (62) | % |
| Credit enhancement expense | | (68) | | | (67) | | | (1) | | | (1) | % | | | | (58) | | | | | (10) | | | (17) | % |
| Change in expected credit enhancement recoveries | | (9) | | | (92) | | | 83 | | | 90 | % | | | | (15) | | | | | 6 | | | 40 | % |
| Other expenses, net* | | (74) | | | (54) | | | (20) | | | (37) | % | | | | (51) | | | | | (23) | | | (45) | % |
| Income before federal income taxes | | 878 | | | 1,247 | | | (369) | | | (30) | % | | | | 759 | | | | | 119 | | | 16 | % |
| Provision for federal income taxes | | (179) | | | (259) | | | 80 | | | 31 | % | | | | (160) | | | | | (19) | | | (12) | % |
| Net income | | $ | 699 | | | $ | 988 | | | $ | (289) | | | (29) | % | | | | $ | 599 | | | | | $ | 100 | | | 17 | % |
| | | | | | | | | | | | | | | | | | |
| Average charged guaranty fee rate on multifamily guaranty book of business, at period end | | 79.3 bps | | 78.4 bps | | 0.9 bps | | 1% | | | | 75.9 bps | | | | 3.4 bps | | 4% |
| | | | | | | | | | | | | | | | | | |
| NM - Not meaningful | | | | | | | | | | | | | | | | | | |
| | | | | | | | | | | | | | | | | | |
| * Includes investment gains or losses and other income or expenses. |
| | | | | | | | | | | | | | | | | | |
| | | | | | | | | | | | | | | | | | |
| | | | | | | | | | | | | | | | | | |
| | | | | | |
| | |
| Key Business Highlights |
| | |
| • | New multifamily business volume was $16.0 billion during the first quarter of 2022. The Federal Housing Finance Agency (FHFA) established a 2022 multifamily volume cap of $78 billion, of which 50% must be mission-driven, focused on certain affordable and underserved market segments, and 25% affordable to residents earning 60% or less of area median income. | |
| | |
| • | The multifamily guaranty book of business grew by nearly 2% in the first quarter of 2022 to $419.8 billion. The average charged guaranty fee on the multifamily book increased from 78.4 basis points as of December 31, 2021 to 79.3 basis points as of March 31, 2022. | |
| | |
| • | As of March 31, 2022, more than 90% of the loans in the company’s multifamily guaranty book of business that had received a forbearance, measured by unpaid principal balance, were in a repayment plan or reinstated. Less than 0.1% of the multifamily book, or $246 million in unpaid principal balance, was still in active forbearance, with the majority resulting from COVID-19-related financial hardship. | |
| | |
| • | The multifamily serious delinquency rate decreased to 0.38% as of March 31, 2022, compared with 0.42% as of December 31, 2021, as recovery from COVID-19 continues. The multifamily serious delinquency rate, excluding loans that received a forbearance, decreased slightly to 0.03% as of March 31, 2022 from 0.04% as of December 31, 2021. Multifamily seriously delinquent loans are loans that are 60 days or more past due. | |
| | | | | | | | |
| First Quarter 2022 Results | 4 |
Fannie Mae’s Condensed Consolidated Balance Sheets and Condensed Consolidated Statements of Operations and Income for the first quarter of 2022 are available in the accompanying Annex; however, investors and interested parties should read the company’s First Quarter 2022 Form 10-Q, which was filed today with the Securities and Exchange Commission and is available on Fannie Mae’s website, www.fanniemae.com. The company provides further discussion of its financial results and condition, credit performance, and other matters in its First Quarter 2022 Form 10-Q. Additional information about the company’s financial and credit performance is contained in Fannie Mae’s “Q1 2022 Financial Supplement” at www.fanniemae.com.
# # #
Fannie Mae provides website addresses in its news releases solely for readers’ information. Other content or information appearing on these websites is not part of this release.
Fannie Mae advances equitable and sustainable access to homeownership and quality, affordable rental housing for millions of people across America. We enable the 30-year fixed-rate mortgage and drive responsible innovation to make homebuying and renting easier, fairer, and more accessible. To learn more, visit fanniemae.com and follow us on twitter.com/fanniemae.
| | | | | | | | |
| First Quarter 2022 Results | 5 |
ANNEX
FANNIE MAE
Condensed Consolidated Balance Sheets
(Dollars in millions)
| | | | | | | | | | | | | | | | | | | | | | | |
| As of |
| March 31, 2022 | | December 31, 2021 |
| ASSETS | |
| Cash and cash equivalents | | $ | 36,330 | | | | | $ | 42,448 | | |
| Restricted cash and cash equivalents (includes $46,317 and $59,203, respectively, related to consolidated trusts) | | 52,651 | | | | | 66,183 | | |
| Securities purchased under agreements to resell or similar arrangements (includes $9,707 and $13,533, respectively, related to consolidated trusts) | | 17,907 | | | | | 20,743 | | |
| Investments in securities: | | | | | | | |
| Trading, at fair value (includes $2,891 and $4,224, respectively, pledged as collateral) | | 84,629 | | | | | 88,206 | | |
| Available-for-sale, at fair value (with an amortized cost of $802 and $827, respectively) | | 806 | | | | | 837 | | |
| Total investments in securities | | 85,435 | | | | | 89,043 | | |
| Mortgage loans: | | | | | | | |
| Loans held for sale, at lower of cost or fair value | | 5,920 | | | | | 5,134 | | |
| Loans held for investment, at amortized cost: | | | | | | | |
| Of Fannie Mae | | 60,297 | | | | | 61,025 | | |
| Of consolidated trusts | | 3,990,220 | | | | | 3,907,712 | | |
| Total loans held for investment (includes $4,492 and $4,964, respectively, at fair value) | | 4,050,517 | | | | | 3,968,737 | | |
| Allowance for loan losses | | (5,899) | | | | | (5,629) | | |
| Total loans held for investment, net of allowance | | 4,044,618 | | | | | 3,963,108 | | |
| Total mortgage loans | | 4,050,538 | | | | | 3,968,242 | | |
| Advances to lenders | | 5,977 | | | | | 8,414 | | |
| Deferred tax assets, net | | 13,075 | | | | | 12,715 | | |
| Accrued interest receivable, net (includes $8,824 and $8,878 related to consolidated trusts and net of allowance of $128 and $140, respectively) | | 9,383 | | | | | 9,264 | | |
| Acquired property, net | | 1,456 | | | | | 1,259 | | |
| Other assets | | 12,277 | | | | | 10,855 | | |
| Total assets | | $ | 4,285,029 | | | | | $ | 4,229,166 | | |
| LIABILITIES AND EQUITY | |
| Liabilities: | | | | | | | |
| Accrued interest payable (includes $8,598 and $8,517, respectively, related to consolidated trusts) | | $ | 9,270 | | | | | $ | 9,186 | | |
| Debt: | | | | | | | |
| Of Fannie Mae (includes $2,091 and $2,381, respectively, at fair value) | | 180,169 | | | | | 200,892 | | |
| Of consolidated trusts (includes $20,117 and $21,735, respectively, at fair value) | | 4,028,628 | | | | | 3,957,299 | | |
| Other liabilities (includes $2,119 and $1,245, respectively, related to consolidated trusts) | | 15,204 | | | | | 14,432 | | |
| Total liabilities | | 4,233,271 | | | | | 4,181,809 | | |
| Commitments and contingencies (Note 13) | | — | | | | | — | | |
| Fannie Mae stockholders’ equity: | | | | | | | |
| Senior preferred stock (liquidation preference of $168,856 and $163,672, respectively) | | 120,836 | | | | | 120,836 | | |
| Preferred stock, 700,000,000 shares are authorized—555,374,922 shares issued and outstanding | | 19,130 | | | | | 19,130 | | |
| Common stock, no par value, no maximum authorization—1,308,762,703 shares issued and 1,158,087,567 shares outstanding | | 687 | | | | | 687 | | |
| Accumulated deficit | | (81,526) | | | | | (85,934) | | |
| Accumulated other comprehensive income | | 31 | | | | | 38 | | |
| Treasury stock, at cost, 150,675,136 shares | | (7,400) | | | | | (7,400) | | |
| Total stockholders’ equity (See Note 1: Senior Preferred Stock Purchase Agreement and Senior Preferred Stock for information on the related dividend obligation and liquidation preference) | | 51,758 | | | | | 47,357 | | |
| Total liabilities and equity | | $ | 4,285,029 | | | | | $ | 4,229,166 | | |
See Notes to Condensed Consolidated Financial Statements in the First Quarter 2022 Form 10-Q
| | | | | | | | |
| First Quarter 2022 Results | 6 |
FANNIE MAE
(In conservatorship)
Condensed Consolidated Statements of Operations and Comprehensive Income
(Dollars in millions, except per share amounts)
| | | | | | | | | | | | | | | | | | | | | | | | | | | | | | | | | | |
| | | | | For the Three Months Ended March 31, | |
| | | | |
| 2022 | | 2021 | | |
| Interest income: | | | | | | | | | | | | | | | | | | | | |
| Trading securities | | | | | | | | | | | $ | 156 | | | | | $ | 140 | | | | | | |
| Available-for-sale securities | | | | | | | | | | | 10 | | | | | 19 | | | | | | |
| Mortgage loans | | | | | | | | | | | 27,142 | | | | | 23,353 | | | | | | |
| Securities purchased under agreements to resell or similar arrangements | | | | | | | | | | | 6 | | | | | 8 | | | | | | |
| Other | | | | | | | | | | | 26 | | | | | 42 | | | | | | |
| Total interest income | | | | | | | | | | | 27,340 | | | | | 23,562 | | | | | | |
| Interest expense: | | | | | | | | | | | | | | | | | | | | |
| Short-term debt | | | | | | | | | | | (1) | | | | | (3) | | | | | | |
| Long-term debt | | | | | | | | | | | (19,940) | | | | | (16,817) | | | | | | |
| Total interest expense | | | | | | | | | | | (19,941) | | | | | (16,820) | | | | | | |
| Net interest income | | | | | | | | | | | 7,399 | | | | | 6,742 | | | | | | |
| Benefit (provision) for credit losses | | | | | | | | | | | (240) | | | | | 765 | | | | | | |
| Net interest income after benefit (provision) for credit losses | | | | | | | | | | | 7,159 | | | | | 7,507 | | | | | | |
| Investment gains (losses), net | | | | | | | | | | | (102) | | | | | 45 | | | | | | |
| Fair value gains, net | | | | | | | | | | | 480 | | | | | 784 | | | | | | |
| Fee and other income | | | | | | | | | | | 83 | | | | | 87 | | | | | | |
| Non-interest income | | | | | | | | | | | 461 | | | | | 916 | | | | | | |
| Administrative expenses: | | | | | | | | | | | | | | | | | | | | |
| Salaries and employee benefits | | | | | | | | | | | (407) | | | | | (387) | | | | | | |
| Professional services | | | | | | | | | | | (209) | | | | | (214) | | | | | | |
| | | | | | | | | | | | | | | | | | | | |
| Other administrative expenses | | | | | | | | | | | (192) | | | | | (147) | | | | | | |
| Total administrative expenses | | | | | | | | | | | (808) | | | | | (748) | | | | | | |
| Foreclosed property income | | | | | | | | | | | 39 | | | | | 5 | | | | | | |
| Temporary Payroll Tax Cut Continuation Act of 2011 (“TCCA”) fees | | | | | | | | | | | (824) | | | | | (731) | | | | | | |
| Credit enhancement expense | | | | | | | | | | | (278) | | | | | (284) | | | | | | |
| Change in expected credit enhancement recoveries | | | | | | | | | | | 60 | | | | | (31) | | | | | | |
| Other expenses, net | | | | | | | | | | | (236) | | | | | (319) | | | | | | |
| Total expenses | | | | | | | | | | | (2,047) | | | | | (2,108) | | | | | | |
| Income before federal income taxes | | | | | | | | | | | 5,573 | | | | | 6,315 | | | | | | |
| Provision for federal income taxes | | | | | | | | | | | (1,165) | | | | | (1,322) | | | | | | |
| Net income | | | | | | | | | | | 4,408 | | | | | 4,993 | | | | | | |
| Other comprehensive loss: | | | | | | | | | | | | | | | | | | | | |
| Changes in unrealized losses on available-for-sale securities, net of reclassification adjustments and taxes | | | | | | | | | | | (5) | | | | | (23) | | | | | | |
| Other, net of taxes | | | | | | | | | | | (2) | | | | | (4) | | | | | | |
| Total other comprehensive loss | | | | | | | | | | | (7) | | | | | (27) | | | | | | |
| Total comprehensive income | | | | | | | | | | | $ | 4,401 | | | | | $ | 4,966 | | | | | | |
| Net income | | | | | | | | | | | $ | 4,408 | | | | | $ | 4,993 | | | | | | |
| Dividends distributed or amounts attributable to senior preferred stock | | | | | | | | | | | (4,401) | | | | | (4,966) | | | | | | |
| Net income attributable to common stockholders | | | | | | | | | | | $ | 7 | | | | | $ | 27 | | | | | | |
| Earnings per share: | | | | | | | | | | | | | | | | | | | | |
| Basic | | | | | | | | | | | $ | 0.00 | | | | | $ | 0.00 | | | | | | |
| Diluted | | | | | | | | | | | 0.00 | | | | | 0.00 | | | | | | |
| Weighted-average common shares outstanding: | | | | | | | | | | | | | | | | | | | | |
| Basic | | | | | | | | | | | 5,867 | | | | | 5,867 | | | | | | |
| Diluted | | | | | | | | | | | 5,893 | | | | | 5,893 | | | | | | |
See Notes to Condensed Consolidated Financial Statements in the First Quarter 2022 Form 10-Q
| | | | | | | | |
| First Quarter 2022 Results | 7 |