Contact: Pete Bakel Resource Center: 1-800-232-6643
202-752-2034 Exhibit 99.1
Date: November 8, 2022
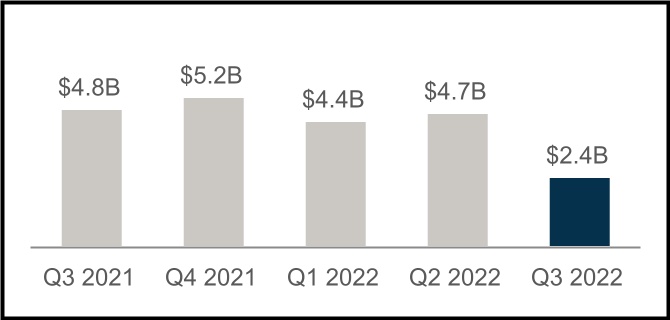
Fannie Mae Reports Net Income of $2.4 Billion for Third Quarter 2022
| | | | | | | | | | | | | | |
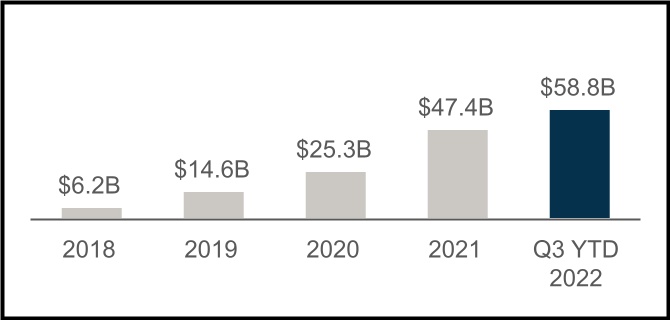
| • | $2.4 billion net income for the third quarter of 2022, with net worth reaching $58.8 billion as of September 30, 2022 | | “Our third quarter results reflect the changing conditions in today’s housing market, and in this environment we continue to focus on being a stable pillar for the market, managing risk, and supporting renters and homeowners.”
David C. Benson, President and Interim Chief Executive Officer
|
| | |
| • | Net income decreased $2.2 billion in the third quarter of 2022 compared with the second quarter of 2022. The largest driver of this decrease was an increase in credit-related expense. Credit-related expense for the third quarter was primarily driven by lower actual and projected home prices. | |
| | |
| • | $134 billion in liquidity provided to the single-family and multifamily mortgage markets in the third quarter of 2022 | |
| | |
| • | $92 billion of single-family home purchase acquisitions in the third quarter of 2022, more than 45% were for first-time homebuyers | |
| | |
| • | Acquired approximately 285,000 home purchase loans and 99,000 single-family refinance loans during the third quarter of 2022 | |
| | |
| • | Approximately 143,000 units of rental housing financed in the third quarter of 2022, a significant majority of which were affordable to households earning at or below 120% of area median income, providing support for both workforce and affordable housing | |
| | |
| • | The U.S. weekly average 30-year fixed-rate mortgage rate increased from 5.70% as of the end of the second quarter of 2022 to 6.70% as of the end of the third quarter of 2022 | |
| | |
| | |
| | |
| | |
| | | | |
| | | | |
| | | | |
| |
| | | | |
| | | | | | | | | | | | | | | | | | | | | | | | | | | | | | | | | | | |
| Q3 2022 Key Results |
|
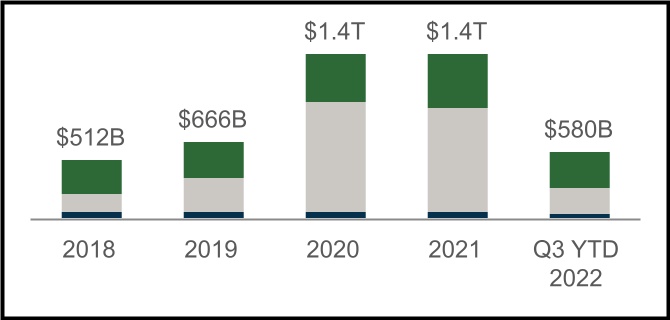
| $58.8 Billion Net Worth | $580 Billion Supporting Housing Activity |
| | | | | | | | | | | |
| Increase of $2.4 billion in the third quarter of 2022 | | SF Home Purchases | | | SF Refinancings | | | MF Rental Units |
| | | | |
| | | | | | | | | | | | | | | | | | | | |
| | | | | | |
$2.4 Billion Net Income for Q3 2022 | Serious Delinquency Rates |
| | | | | | |
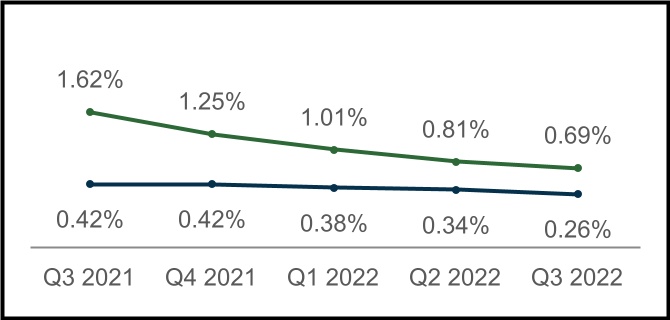
| Decrease of $2.2 billion compared with second quarter 2022 | | Single-Family SDQ Rate | | Multifamily SDQ Rate |
| |

| | | | | | | | |
| Third Quarter 2022 Results | 1 |
| | | | | | | | | | | | | | | | | | | | | | | | | | | | | | | | | | | | | | | | | | | | | | |
| Summary of Financial Results |
| | | | | | | | | | | | | | | | |
| (Dollars in millions) | | Q322 | | Q222 | | Variance | | % Change | | Q321 | | | | Variance | | % Change |
| Net interest income | | $ | 7,124 | | | $ | 7,808 | | | $ | (684) | | | (9) | % | | $ | 6,972 | | | | | $ | 152 | | | 2 | % |
| Fee and other income | | 105 | | | 81 | | | 24 | | | 30 | % | | 111 | | | | | (6) | | | (5) | % |
| Net revenues | | 7,229 | | | 7,889 | | | (660) | | | (8) | % | | 7,083 | | | | | 146 | | | 2 | % |
| Investment gains (losses), net | | (172) | | | (49) | | | (123) | | | NM | | 243 | | | | | (415) | | | NM |
| Fair value gains (losses), net | | 292 | | | 529 | | | (237) | | | (45) | % | | (17) | | | | | 309 | | | NM |
| Administrative expenses | | (870) | | | (795) | | | (75) | | | (9) | % | | (745) | | | | | (125) | | | (17) | % |
| Credit-related income (expense) | | (2,521) | | | (251) | | | (2,270) | | | NM | | 868 | | | | | (3,389) | | | NM |
| TCCA fees | | (850) | | | (841) | | | (9) | | | (1) | % | | (781) | | | | | (69) | | | (9) | % |
| Credit enhancement expense | | (364) | | | (332) | | | (32) | | | (10) | % | | (233) | | | | | (131) | | | (56) | % |
| Change in expected credit enhancement recoveries | | 290 | | | (47) | | | 337 | | | NM | | (42) | | | | | 332 | | | NM |
| Other expenses, net | | (169) | | | (228) | | | 59 | | | 26 | % | | (268) | | | | | 99 | | | 37 | % |
| | | | | | | | | | | | | | | | |
| Income before federal income taxes | | 2,865 | | | 5,875 | | | (3,010) | | | (51) | % | | 6,108 | | | | | (3,243) | | | (53) | % |
| Provision for federal income taxes | | (429) | | | (1,222) | | | 793 | | | 65 | % | | (1,266) | | | | | 837 | | | 66 | % |
| Net income | | $ | 2,436 | | | $ | 4,653 | | | $ | (2,217) | | | (48) | % | | $ | 4,842 | | | | | $ | (2,406) | | | (50) | % |
| | | | | | | | | | | | | | | | |
| Total comprehensive income | | $ | 2,433 | | | $ | 4,649 | | | $ | (2,216) | | | (48) | % | | $ | 4,828 | | | | | $ | (2,395) | | | (50) | % |
| Net worth | | $ | 58,840 | | | $ | 56,407 | | | $ | 2,433 | | | 4 | % | | $ | 42,173 | | | | | $ | 16,667 | | | 40 | % |
| | | | | | | | | | | | | | | | |
| | | | | | | | | | | | | | | | |
| NM - Not meaningful | | | | | | | | | | | | | | | | |
| | | | | | | | | | | | | | | | |
|
| | | | | | | | | |
| | | |
| Financial Highlights | |
| | | |
| | | |
| Net income decreased $2.2 billion in the third quarter of 2022, compared with the second quarter of 2022, primarily driven by an increase in credit-related expense and a decrease in net interest income. | |
| | | |
| • | | Credit-related expense was $2.5 billion in the third quarter of 2022, compared with $251 million in the second quarter of 2022. Credit-related expense for the third quarter was primarily driven by lower actual and projected home prices during the quarter. | |
| | | |
| • | | Net interest income was $7.1 billion in the third quarter of 2022, compared with $7.8 billion in the second quarter of 2022. Net interest income from the company’s guaranty book of business decreased due to a decline in net amortization income driven by a decrease in refinancing activity due to rising interest rates. | |
| | | | | | | | |
| Third Quarter 2022 Results | 2 |
| | | | | | | | | | | | | | | | | | | | | | | | | | | | | | | | | | | | | | | | | | | | | | | | |
| Single-Family Business Financial Results |
|
| (Dollars in millions) | | Q322 | | Q222 | | Variance | | % Change | | | | Q321 | | | | Variance | | % Change |
| Net interest income | | $ | 5,918 | | | $ | 6,573 | | | $ | (655) | | | (10) | % | | | | $ | 5,870 | | | | | $ | 48 | | | 1 | % |
| Fee and other income | | 83 | | | 60 | | | 23 | | | 38 | % | | | | 86 | | | | | (3) | | | (3) | % |
| Net revenues | | 6,001 | | | 6,633 | | | (632) | | | (10) | % | | | | 5,956 | | | | | 45 | | | 1 | % |
| Investment gains (losses), net | | (178) | | | (27) | | | (151) | | | NM | | | | 222 | | | | | (400) | | | NM |
| Fair value gains (losses), net | | 309 | | | 543 | | | (234) | | | (43) | % | | | | (31) | | | | | 340 | | | NM |
| Administrative expenses | | (730) | | | (671) | | | (59) | | | (9) | % | | | | (620) | | | | | (110) | | | (18) | % |
| Credit-related income (expense) | | (2,367) | | | (231) | | | (2,136) | | | NM | | | | 807 | | | | | (3,174) | | | NM |
| TCCA fees | | (850) | | | (841) | | | (9) | | | (1) | % | | | | (781) | | | | | (69) | | | (9) | % |
| Credit enhancement expense | | (298) | | | (270) | | | (28) | | | (10) | % | | | | (174) | | | | | (124) | | | (71) | % |
| Change in expected credit enhancement recoveries | | 245 | | | (43) | | | 288 | | | NM | | | | (28) | | | | | 273 | | | NM |
| Other expenses, net | | (159) | | | (199) | | | 40 | | | 20 | % | | | | (261) | | | | | 102 | | | 39 | % |
| Income before federal income taxes | | 1,973 | | | 4,894 | | | (2,921) | | | (60) | % | | | | 5,090 | | | | | (3,117) | | | (61) | % |
| Provision for federal income taxes | | (276) | | | (1,008) | | | 732 | | | 73 | % | | | | (1,065) | | | | | 789 | | | 74 | % |
| Net income | | $ | 1,697 | | | $ | 3,886 | | | $ | (2,189) | | | (56) | % | | | | $ | 4,025 | | | | | $ | (2,328) | | | (58) | % |
| | | | | | | | | | | | | | | | | | |
| Average charged guaranty fee on new conventional acquisitions, net of TCCA fees | | 53.3 bps | | 51.7 bps | | 1.6 bps | | 3 | % | | | | 47.3 bps | | | | 6.0 bps | | 13 | % |
| Average charged guaranty fee on conventional guaranty book of business, net of TCCA fees | | 46.2 bps | | 45.9 bps | | 0.3 bps | | 1 | % | | | | 45.4 bps | | | | 0.8 bps | | 2 | % |
| | | | | | | | | | | | | | | | | | |
| NM - Not meaningful | | | | | | | | | | | | | | | | | | |
| | | | | | | | | | | | | | | | | | |
| | | | | | | | | | | | | | | | | | |
| | | | | | | | | | | | | | | | | | |
| | | | | | | | | | | | | | | | | | |
| | | | | | |
|
| | |
| | |
| | |
| Key Business Highlights |
| | |
| | |
| • | Single-family conventional acquisition volume was $117.7 billion in the third quarter of 2022, a decrease of 32% compared with $172.3 billion in the second quarter of 2022. Purchase acquisition volume decreased from $111.0 billion in the second quarter of 2022 to $92.2 billion in the third quarter of 2022, of which more than 45% was for first-time homebuyers. Refinance acquisition volume was $25.5 billion in the third quarter of 2022, a decline from $61.3 billion in the second quarter of 2022, due to the higher mortgage interest-rate environment. | |
| | |
| • | Average single-family conventional guaranty book of business in the third quarter of 2022 increased from the second quarter of 2022 by 0.9% driven primarily by growth in the average balance of loans acquired during the quarter. Credit characteristics of the single-family conventional guaranty book of business remained strong, with a weighted-average mark-to-market loan-to-value ratio of 50% and a weighted-average FICO credit score at origination of 752 as of September 30, 2022. | |
| | |
| • | Single-family serious delinquency rate decreased to 0.69% as of September 30, 2022, from 0.81% as of June 30, 2022 driven by borrowers exiting forbearance through a loan workout or by otherwise reinstating their loan. Single-family seriously delinquent loans are loans that are 90 days or more past due or in the foreclosure process. | |
| | | | | | | | |
| Third Quarter 2022 Results | 3 |
| | | | | | | | | | | | | | | | | | | | | | | | | | | | | | | | | | | | | | | | | | | | | | | | |
| Multifamily Business Financial Results |
|
| (Dollars in millions) | | Q322 | | Q222 | | Variance | | % Change | | | | Q321 | | | | Variance | | % Change |
| Net interest income | | $ | 1,206 | | | $ | 1,235 | | | $ | (29) | | | (2) | % | | | | $ | 1,102 | | | | | $ | 104 | | | 9 | % |
| Fee and other income | | 22 | | | 21 | | | 1 | | | 5 | % | | | | 25 | | | | | (3) | | | (12) | % |
| Net revenues | | 1,228 | | | 1,256 | | | (28) | | | (2) | % | | | | 1,127 | | | | | 101 | | | 9 | % |
| | | | | | | | | | | | | | | | | | |
| Fair value gains (losses), net | | (17) | | | (14) | | | (3) | | | (21) | % | | | | 14 | | | | | (31) | | | NM |
| Administrative expenses | | (140) | | | (124) | | | (16) | | | (13) | % | | | | (125) | | | | | (15) | | | (12) | % |
| Credit-related income (expense) | | (154) | | | (20) | | | (134) | | | NM | | | | 61 | | | | | (215) | | | NM |
| Credit enhancement expense | | (66) | | | (62) | | | (4) | | | (6) | % | | | | (59) | | | | | (7) | | | (12) | % |
| Change in expected credit enhancement recoveries | | 45 | | | (4) | | | 49 | | | NM | | | | (14) | | | | | 59 | | | NM |
| Other income (expenses), net* | | (4) | | | (51) | | | 47 | | | 92 | % | | | | 14 | | | | | (18) | | | NM |
| Income before federal income taxes | | 892 | | | 981 | | | (89) | | | (9) | % | | | | 1,018 | | | | | (126) | | | (12) | % |
| Provision for federal income taxes | | (153) | | | (214) | | | 61 | | | 29 | % | | | | (201) | | | | | 48 | | | 24 | % |
| Net income | | $ | 739 | | | $ | 767 | | | $ | (28) | | | (4) | % | | | | $ | 817 | | | | | $ | (78) | | | (10) | % |
| | | | | | | | | | | | | | | | | | |
| Average charged guaranty fee rate on multifamily guaranty book of business, at period end | | 79.0 bps | | 79.5 bps | | (0.5) bps | | NM | | | | 77.5 bps | | | | 1.5 bps | | 2 | % |
| | | | | | | | | | | | | | | | | | |
| NM - Not meaningful | | | | | | | | | | | | | | | | | | |
| | | | | | | | | | | | | | | | | | |
| * Includes investment gains or losses and other income or expenses. |
| | | | | | | | | | | | | | | | | | |
| | | | | | | | | | | | | | | | | | |
| | | | | | | | | | | | | | | | | | |
| | | | | | |
| | |
| Key Business Highlights |
| | |
| | |
| • | New multifamily business volume was $15.9 billion during the third quarter of 2022, compared with $18.7 billion during the second quarter of 2022. During the first nine months of 2022, new multifamily business volume was $50.6 billion. The Federal Housing Finance Agency (FHFA) established a 2022 multifamily volume cap of $78 billion, of which 50% must be mission-driven, focused on certain affordable and underserved market segments, and 25% affordable to residents earning 60% or less of area median income. | |
| | |
| • | The multifamily guaranty book of business grew by 0.9% in the third quarter of 2022 to $429.4 billion. The average charged guaranty fee on the multifamily book decreased from 79.5 basis points as of June 30, 2022, to 79.0 basis points as of September 30, 2022, but increased from 77.5 basis points from September 30, 2021. | |
| | |
| • | As of September 30, 2022, more than 95% of the loans in the company’s active multifamily guaranty book of business that had received a forbearance, measured by unpaid principal balance, were in a repayment plan or reinstated. | |
| | |
| • | The multifamily serious delinquency rate decreased to 0.26% as of September 30, 2022, compared with 0.34% as of June 30, 2022, as recovery from COVID-19 continues. The multifamily serious delinquency rate, excluding loans that have received a forbearance since the start of the pandemic, was 0.04% as of September 30, 2022. Multifamily seriously delinquent loans are loans that are 60 days or more past due. | |
| | | | | | | | |
| Third Quarter 2022 Results | 4 |
Fannie Mae’s Condensed Consolidated Balance Sheets and Condensed Consolidated Statements of Operations and Comprehensive Income for the third quarter of 2022 are available in the accompanying Annex; however, investors and interested parties should read the company’s Third Quarter 2022 Form 10-Q, which was filed today with the Securities and Exchange Commission and is available on Fannie Mae’s website, www.fanniemae.com. The company provides further discussion of its financial results and condition, credit performance, and other matters in its Third Quarter 2022 Form 10-Q. Additional information about the company’s financial and credit performance is contained in Fannie Mae’s “Q3 2022 Financial Supplement” at www.fanniemae.com.
# # #
Fannie Mae provides website addresses in its news releases solely for readers’ information. Other content or information appearing on these websites is not part of this release.
Fannie Mae advances equitable and sustainable access to homeownership and quality, affordable rental housing for millions of people across America. We enable the 30-year fixed-rate mortgage and drive responsible innovation to make homebuying and renting easier, fairer, and more accessible. To learn more, visit fanniemae.com and follow us on twitter.com/fanniemae.
| | | | | | | | |
| Third Quarter 2022 Results | 5 |
ANNEX
FANNIE MAE
(In conservatorship)
Condensed Consolidated Balance Sheets — (Unaudited)
(Dollars in millions)
| | | | | | | | | | | | | | | | | | | | | | | |
| As of |
| September 30, 2022 | December 31, 2021 | |
| ASSETS | |
| Cash and cash equivalents | | $ | 35,640 | | | | | $ | 42,448 | | |
| Restricted cash and cash equivalents (includes $21,863 and $59,203, respectively, related to consolidated trusts) | | 27,921 | | | | | 66,183 | | |
| Securities purchased under agreements to resell (includes $13,150 and $13,533, respectively, related to consolidated trusts) | | 23,950 | | | | | 20,743 | | |
| Investments in securities: | | | | | | | |
| Trading, at fair value (includes $3,275 and $4,224, respectively, pledged as collateral) | | 58,253 | | | | | 88,206 | | |
| Available-for-sale, at fair value (with an amortized cost of $744 and $827, respectively) | | 741 | | | | | 837 | | |
| Total investments in securities | | 58,994 | | | | | 89,043 | | |
| Mortgage loans: | | | | | | | |
| Loans held for sale, at lower of cost or fair value | | 4,177 | | | | | 5,134 | | |
| Loans held for investment, at amortized cost: | | | | | | | |
| Of Fannie Mae | | 49,952 | | | | | 61,025 | | |
| Of consolidated trusts | | 4,058,901 | | | | | 3,907,712 | | |
| Total loans held for investment (includes $3,691 and $4,964, respectively, at fair value) | | 4,108,853 | | | | | 3,968,737 | | |
| Allowance for loan losses | | (8,302) | | | | | (5,629) | | |
| Total loans held for investment, net of allowance | | 4,100,551 | | | | | 3,963,108 | | |
| Total mortgage loans | | 4,104,728 | | | | | 3,968,242 | | |
| Advances to lenders | | 3,443 | | | | | 8,414 | | |
| Deferred tax assets, net | | 12,729 | | | | | 12,715 | | |
| Accrued interest receivable, net (includes $8,902 and $8,878 related to consolidated trusts and net of allowance of $112 and $140, respectively) | | 9,478 | | | | | 9,264 | | |
| Acquired property, net | | 1,539 | | | | | 1,259 | | |
| Other assets | | 11,031 | | | | | 10,855 | | |
| Total assets | | $ | 4,289,453 | | | | | $ | 4,229,166 | | |
| LIABILITIES AND EQUITY | |
| Liabilities: | | | | | | | |
| Accrued interest payable (includes $9,040 and $8,517, respectively, related to consolidated trusts) | | $ | 9,650 | | | | | $ | 9,186 | | |
| Debt: | | | | | | | |
| Of Fannie Mae (includes $1,766 and $2,381, respectively, at fair value) | | 129,776 | | | | | 200,892 | | |
| Of consolidated trusts (includes $16,758 and $21,735, respectively, at fair value) | | 4,078,038 | | | | | 3,957,299 | | |
| Other liabilities (includes $1,812 and $1,245, respectively, related to consolidated trusts) | | 13,149 | | | | | 14,432 | | |
| Total liabilities | | 4,230,613 | | | | | 4,181,809 | | |
| Commitments and contingencies (Note 13) | | — | | | | | — | | |
| Fannie Mae stockholders’ equity: | | | | | | | |
| Senior preferred stock (liquidation preference of $177,906 and $163,672, respectively) | | 120,836 | | | | | 120,836 | | |
| Preferred stock, 700,000,000 shares are authorized—555,374,922 shares issued and outstanding | | 19,130 | | | | | 19,130 | | |
| Common stock, no par value, no maximum authorization—1,308,762,703 shares issued and 1,158,087,567 shares outstanding | | 687 | | | | | 687 | | |
| Accumulated deficit | | (74,437) | | | | | (85,934) | | |
| Accumulated other comprehensive income | | 24 | | | | | 38 | | |
| Treasury stock, at cost, 150,675,136 shares | | (7,400) | | | | | (7,400) | | |
| Total stockholders’ equity (See Note 1: Senior Preferred Stock Purchase Agreement and Senior Preferred Stock for information on the related dividend obligation and liquidation preference) | | 58,840 | | | | | 47,357 | | |
| Total liabilities and equity | | $ | 4,289,453 | | | | | $ | 4,229,166 | | |
See Notes to Condensed Consolidated Financial Statements in the Third Quarter 2022 Form 10-Q
| | | | | | | | |
| Third Quarter 2022 Results | 6 |
FANNIE MAE
(In conservatorship)
Condensed Consolidated Statements of Operations and Comprehensive Income — (Unaudited)
(Dollars in millions, except per share amounts)
| | | | | | | | | | | | | | | | | | | | | | | | | | | | | | | | | | | | | | | | | | | | | | | | | | | |
| For the Three Months Ended September 30, | | For the Nine Months Ended September 30, | |
| | |
| 2022 | | 2021 | | 2022 | | 2021 | | |
| Interest income: | | | | | | | | | | | | | | | | | | | |
| Trading securities | | $ | 515 | | | | | $ | 134 | | | | | $ | 980 | | | | | $ | 396 | | | | | | |
| Available-for-sale securities | | 10 | | | | | 11 | | | | | 29 | | | | | 48 | | | | | | |
| Mortgage loans | | 30,114 | | | | | 24,798 | | | | | 86,338 | | | | | 73,083 | | | | | | |
| Securities purchased under agreements to resell | | 171 | | | | | 5 | | | | | 205 | | | | | 17 | | | | | | |
| Other | | 40 | | | | | 33 | | | | | 93 | | | | | 106 | | | | | | |
| Total interest income | | 30,850 | | | | | 24,981 | | | | | 87,645 | | | | | 73,650 | | | | | | |
| Interest expense: | | | | | | | | | | | | | | | | | | | |
| Short-term debt | | (17) | | | | | — | | | | | (23) | | | | | (4) | | | | | | |
| Long-term debt | | (23,709) | | | | | (18,009) | | | | | (65,291) | | | | | (51,646) | | | | | | |
| Total interest expense | | (23,726) | | | | | (18,009) | | | | | (65,314) | | | | | (51,650) | | | | | | |
| Net interest income | | 7,124 | | | | | 6,972 | | | | | 22,331 | | | | | 22,000 | | | | | | |
| Benefit (provision) for credit losses | | (2,536) | | | | | 937 | | | | | (2,994) | | | | | 4,290 | | | | | | |
| Net interest income after benefit (provision) for credit losses | | 4,588 | | | | | 7,909 | | | | | 19,337 | | | | | 26,290 | | | | | | |
| Investment gains (losses), net | | (172) | | | | | 243 | | | | | (323) | | | | | 934 | | | | | | |
| Fair value gains (losses), net | | 292 | | | | | (17) | | | | | 1,301 | | | | | 321 | | | | | | |
| Fee and other income | | 105 | | | | | 111 | | | | | 269 | | | | | 301 | | | | | | |
| Non-interest income | | 225 | | | | | 337 | | | | | 1,247 | | | | | 1,556 | | | | | | |
| Administrative expenses: | | | | | | | | | | | | | | | | | | | |
| Salaries and employee benefits | | (439) | | | | | (376) | | | | | (1,244) | | | | | (1,128) | | | | | | |
| Professional services | | (229) | | | | | (184) | | | | | (636) | | | | | (582) | | | | | | |
| | | | | | | | | | | | | | | | | | | |
| Other administrative expenses | | (202) | | | | | (185) | | | | | (593) | | | | | (529) | | | | | | |
| Total administrative expenses | | (870) | | | | | (745) | | | | | (2,473) | | | | | (2,239) | | | | | | |
| Foreclosed property income (expense) | | 15 | | | | | (69) | | | | | 21 | | | | | (105) | | | | | | |
| TCCA fees | | (850) | | | | | (781) | | | | | (2,515) | | | | | (2,270) | | | | | | |
| Credit enhancement expense | | (364) | | | | | (233) | | | | | (974) | | | | | (791) | | | | | | |
| Change in expected credit enhancement recoveries | | 290 | | | | | (42) | | | | | 303 | | | | | (117) | | | | | | |
| Other expenses, net | | (169) | | | | | (268) | | | | | (633) | | | | | (867) | | | | | | |
| Total expenses | | (1,948) | | | | | (2,138) | | | | | (6,271) | | | | | (6,389) | | | | | | |
| Income before federal income taxes | | 2,865 | | | | | 6,108 | | | | | 14,313 | | | | | 21,457 | | | | | | |
| Provision for federal income taxes | | (429) | | | | | (1,266) | | | | | (2,816) | | | | | (4,470) | | | | | | |
| Net income | | 2,436 | | | | | 4,842 | | | | | 11,497 | | | | | 16,987 | | | | | | |
| Other comprehensive loss: | | | | | | | | | | | | | | | | | | | |
| Changes in unrealized losses on available-for-sale securities, net of reclassification adjustments and taxes | | (1) | | | | | (10) | | | | | (8) | | | | | (64) | | | | | | |
| Other, net of taxes | | (2) | | | | | (4) | | | | | (6) | | | | | (9) | | | | | | |
| Total other comprehensive loss | | (3) | | | | | (14) | | | | | (14) | | | | | (73) | | | | | | |
| Total comprehensive income | | $ | 2,433 | | | | | $ | 4,828 | | | | | $ | 11,483 | | | | | $ | 16,914 | | | | | | |
| Net income | | $ | 2,436 | | | | | $ | 4,842 | | | | | $ | 11,497 | | | | | $ | 16,987 | | | | | | |
| Dividends distributed or amounts attributable to senior preferred stock | | (2,433) | | | | | (4,828) | | | | | (11,483) | | | | | (16,914) | | | | | | |
| Net income attributable to common stockholders | | $ | 3 | | | | | $ | 14 | | | | | $ | 14 | | | | | $ | 73 | | | | | | |
| Earnings per share: | | | | | | | | | | | | | | | | | | | |
| Basic | | $ | 0.00 | | | | | $ | 0.00 | | | | | $ | 0.00 | | | | | $ | 0.01 | | | | | | |
| Diluted | | 0.00 | | | | | 0.00 | | | | | 0.00 | | | | | 0.01 | | | | | | |
| Weighted-average common shares outstanding: | | | | | | | | | | | | | | | | | | | |
| Basic | | 5,867 | | | | | 5,867 | | | | | 5,867 | | | | | 5,867 | | | | | | |
| Diluted | | 5,893 | | | | | 5,893 | | | | | 5,893 | | | | | 5,893 | | | | | | |
See Notes to Condensed Consolidated Financial Statements in the Third Quarter 2022 Form 10-Q
| | | | | | | | |
| Third Quarter 2022 Results | 7 |