Contact: Pete Bakel Resource Center: 1-800-232-6643
202-752-2034 Exhibit 99.1
Date: May 2, 2023
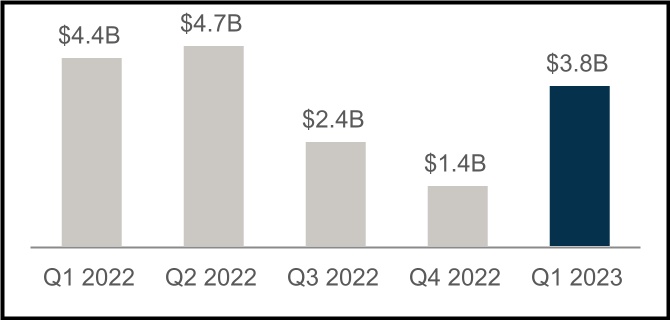
Fannie Mae Reports Net Income of $3.8 Billion for First Quarter 2023
| | | | | | | | | | | | | | |
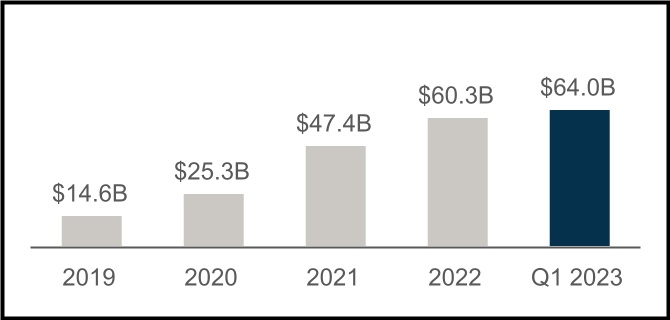
| • | $3.8 billion net income for the first quarter 2023, with net worth reaching $64.0 billion as of March 31, 2023 | | “We delivered strong first quarter results in a volatile market and remain committed to being a source of stability for the housing finance system throughout all economic cycles. We are able to do so because of the changes we've made to improve the resilience of our business, our focus on risk management, and strong liquidity. This allows us to continue to facilitate affordable, equitable, and sustainable access to homeownership and rental housing.”
Priscilla Almodovar, Chief Executive Officer |
| | |
| • | Net income increased $2.3 billion in the first quarter of 2023 compared with the fourth quarter of 2022, primarily driven by a $3.2 billion decrease in provision for credit losses | |
| | |
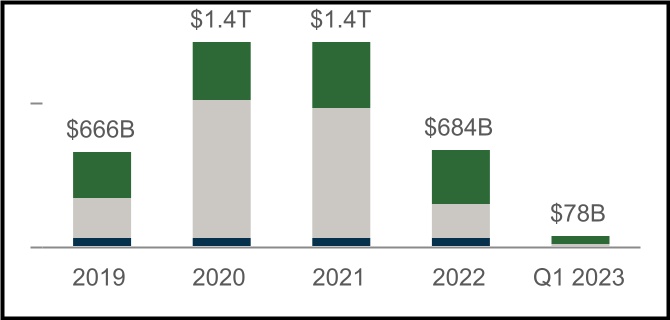
| • | $78 billion in liquidity provided to the mortgage market in the first quarter of 2023 | |
| | |
| • | Acquired approximately 170,000 single-family purchase loans, of which more than 45% were for first-time homebuyers, and approximately 45,000 single-family refinance loans during the first quarter of 2023 | |
| | |
| • | Financed approximately 91,000 units of multifamily rental housing in the first quarter of 2023, a significant majority of which were affordable to households earning at or below 120% of area median income, providing support for both workforce and affordable housing | |
| | |
| • | Home prices grew 1.0% on a national basis in the first quarter of 2023, compared with a 1.2% decline in the fourth quarter of 2022 | |
| | |
| • | The U.S. weekly average 30-year fixed-rate mortgage rate decreased from 6.42% as of the end of 2022 to 6.32% as of the end of the first quarter of 2023 | |
| | |
| | |
| | |
| | |
| | | | |
| | | | |
| | | | |
| |
| | | | |
| | | | | | | | | | | | | | | | | | | | | | | | | | | | | | | | | | | |
| Q1 2023 Key Results |
|
| $64.0 Billion Net Worth | $78 Billion Supporting Housing Activity |
| | | | | | | | | | | |
| Increase of $3.8 billion in the first quarter of 2023 | | SF Home Purchases | | | SF Refinancings | | | MF Rental Units |
| | | | |
| | | | | | | | | | | | | | | | | | | | |
| | | | | | |
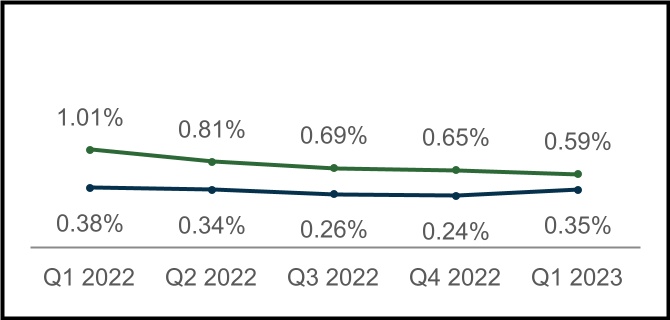
| $3.8 Billion Net Income for Q1 2023 | Serious Delinquency Rates |
| | | | | | |
| Increase of $2.3 billion compared with fourth quarter 2022 | | Single-Family SDQ Rate | | Multifamily SDQ Rate |
| |

| | | | | | | | |
| First Quarter 2023 Results | 1 |
| | | | | | | | | | | | | | | | | | | | | | | | | | | | | | | | | | | | | | | | | | | | | | |
| Summary of Financial Results |
| | | | | | | | | | | | | | | | |
| (Dollars in millions) | | Q123 | | Q422 | | Variance | | % Change | | Q122 | | | | Variance | | % Change |
| Net interest income | | $ | 6,786 | | | $ | 7,092 | | | $ | (306) | | | (4) | % | | $ | 7,399 | | | | | $ | (613) | | | (8) | % |
| Fee and other income | | 63 | | | 43 | | | 20 | | | 47 | % | | 83 | | | | | (20) | | | (24) | % |
| Net revenues | | 6,849 | | | 7,135 | | | (286) | | | (4) | % | | 7,482 | | | | | (633) | | | (8) | % |
| Investment gains (losses), net | | (67) | | | 26 | | | (93) | | | NM | | (102) | | | | | 35 | | | 34 | % |
| Fair value gains (losses), net | | 204 | | | (17) | | | 221 | | | NM | | 480 | | | | | (276) | | | (58) | % |
| Administrative expenses | | (868) | | | (856) | | | (12) | | | (1) | % | | (808) | | | | | (60) | | | (7) | % |
| Provision for credit losses | | (132) | | | (3,283) | | | 3,151 | | | 96 | % | | (240) | | | | | 108 | | | 45 | % |
| TCCA fees | | (855) | | | (854) | | | (1) | | | — | % | | (824) | | | | | (31) | | | (4) | % |
Credit enhancement expense(1) | | (341) | | | (349) | | | 8 | | | 2 | % | | (278) | | | | | (63) | | | (23) | % |
| Change in expected credit enhancement recoveries | | 120 | | | 424 | | | (304) | | | (72) | % | | 60 | | | | | 60 | | | 100 | % |
Other expenses, net(2) | | (130) | | | (306) | | | 176 | | | 58 | % | | (197) | | | | | 67 | | | 34 | % |
| Income before federal income taxes | | 4,780 | | | 1,920 | | | 2,860 | | | 149 | % | | 5,573 | | | | | (793) | | | (14) | % |
| Provision for federal income taxes | | (1,008) | | | (494) | | | (514) | | | (104) | % | | (1,165) | | | | | 157 | | | 13 | % |
| Net income | | $ | 3,772 | | | $ | 1,426 | | | $ | 2,346 | | | 165 | % | | $ | 4,408 | | | | | $ | (636) | | | (14) | % |
| | | | | | | | | | | | | | | | |
| Total comprehensive income | | $ | 3,772 | | | $ | 1,437 | | | $ | 2,335 | | | 162 | % | | $ | 4,401 | | | | | $ | (629) | | | (14) | % |
| Net worth | | $ | 64,049 | | | $ | 60,277 | | | $ | 3,772 | | | 6 | % | | $ | 51,758 | | | | | $ | 12,291 | | | 24 | % |
| | | | | | | | | | | | | | | | |
| | | | | | | | | | | | | | | | |
| NM - Not meaningful | | | | | | | | | | | | | | | | |
(1) Consists of costs associated with freestanding credit enhancements, which primarily include Connecticut Avenue Securities® and Credit Insurance Risk TransferTM programs, enterprise-paid mortgage insurance, and certain lender risk-sharing programs. |
| | | | | | | | | | | | | | | | |
(2) Consists of debt extinguishment gains (losses), foreclosed property income (expense), gains (losses) from partnership investments, housing trust fund expenses, loan subservicing costs, and servicer fees paid in connection with certain loss mitigation activities. |
| | | | | | | | | | | | | | | | |
|
| | | | | | | | | |
| Financial Highlights | |
| | | |
| | | |
| Net income increased $2.3 billion in the first quarter of 2023, compared with the fourth quarter of 2022, primarily driven by a $3.2 billion decrease in provision for credit losses. | |
| | | |
| • | | Net interest income decreased $306 million in the first quarter of 2023, compared with the fourth quarter of 2022, primarily driven by a decrease in amortization income partially offset by an increase in income from the other investments portfolio. Amortization income declined due to the continued higher interest-rate environment in the first quarter of 2023, which continued to slow refinancing activity driving lower loan prepayment volumes. Substantially all of the company’s single-family conventional guaranty book of business as of March 31, 2023 had an interest rate below the current market rate, resulting in a low likelihood these loans would refinance at current rates. Higher income from the other investments portfolio was due to an increase in short-term yields. | |
| | | |
| • | | Provision for credit losses was $132 million in the first quarter of 2023, compared with $3.3 billion in the fourth quarter of 2022. The provision for credit losses for the first quarter of 2023 was driven by a multifamily provision, partially offset by a modest single-family credit benefit. •The multifamily provision was primarily due to declines in property values and continued uncertainty related to seniors housing loans, including uncertainty related to adjustable-rate loans, partially offset by a benefit from lower actual and projected interest rates. •The single-family credit benefit was primarily driven by improvements in actual and forecasted home prices, substantially offset by provision on newly acquired loans. The provision for credit losses for the fourth quarter of 2022 was driven by: •A single-family provision primarily driven by decreases in forecasted home prices. •A multifamily provision primarily driven by an increase in expected credit losses on the company’s seniors housing portfolio, which has been disproportionately impacted by recent market conditions, as well as higher actual and projected interest rates. | |
| | | |
| | | | | | | | |
| First Quarter 2023 Results | 2 |
| | | | | | | | | | | | | | | | | | | | | | | | | | | | | | | | | | | | | | | | | | | | | | | | |
| Single-Family Business Financial Results |
|
| (Dollars in millions) | | Q123 | | Q422 | | Variance | | % Change | | | | Q122 | | | | Variance | | % Change |
| Net interest income | | $ | 5,672 | | | $ | 5,990 | | | $ | (318) | | | (5) | % | | | | $ | 6,255 | | | | | $ | (583) | | | (9) | % |
| Fee and other income | | 48 | | | 20 | | | 28 | | | 140 | % | | | | 61 | | | | | (13) | | | (21) | % |
| Net revenues | | 5,720 | | | 6,010 | | | (290) | | | (5) | % | | | | 6,316 | | | | | (596) | | | (9) | % |
| Investment gains (losses), net | | (71) | | | 48 | | | (119) | | | NM | | | | (66) | | | | | (5) | | | (8) | % |
| Fair value gains (losses), net | | 166 | | | (15) | | | 181 | | | NM | | | | 527 | | | | | (361) | | | (69) | % |
| Administrative expenses | | (720) | | | (705) | | | (15) | | | (2) | % | | | | (683) | | | | | (37) | | | (5) | % |
| Benefit (provision) for credit losses | | 47 | | | (2,192) | | | 2,239 | | | NM | | | | (270) | | | | | 317 | | | NM |
| TCCA fees | | (855) | | | (854) | | | (1) | | | — | % | | | | (824) | | | | | (31) | | | (4) | % |
| Credit enhancement expense | | (287) | | | (284) | | | (3) | | | (1) | % | | | | (210) | | | | | (77) | | | (37) | % |
| Change in expected credit enhancement recoveries | | 95 | | | 199 | | | (104) | | | (52) | % | | | | 69 | | | | | 26 | | | 38 | % |
| Other expenses, net | | (116) | | | (225) | | | 109 | | | 48 | % | | | | (164) | | | | | 48 | | | 29 | % |
| Income before federal income taxes | | 3,979 | | | 1,982 | | | 1,997 | | | 101 | % | | | | 4,695 | | | | | (716) | | | (15) | % |
| Provision for federal income taxes | | (847) | | | (504) | | | (343) | | | (68) | % | | | | (986) | | | | | 139 | | | 14 | % |
| Net income | | $ | 3,132 | | | $ | 1,478 | | | $ | 1,654 | | | 112 | % | | | | $ | 3,709 | | | | | $ | (577) | | | (16) | % |
| | | | | | | | | | | | | | | | | | |
| Average charged guaranty fee on new conventional acquisitions, net of TCCA fees* | | 51.6 bps | | 49.3 bps | | 2.3 bps | | 5 | % | | | | 47.9 bps | | | | 3.7 bps | | 8 | % |
| Average charged guaranty fee on conventional guaranty book of business, net of TCCA fees* | | 46.6 bps | | 46.5 bps | | 0.1 bps | | — | % | | | | 46.0 bps | | | | 0.6 bps | | 1 | % |
| NM - Not meaningful | | | | | | | | | | | | | | | | | | |
| * In Q4 2022, the company enhanced the method it uses to estimate average loan life at acquisition. Charged fees reported for prior periods have been updated in this release to reflect this updated methodology. |
| | | | | | | | | | | | | | | | | | |
| | | | | | | | | | | | | | | | | | |
| | | | | | | | | | | | | | | | | | |
| | | | | | |
|
| | |
| | |
| | |
| Key Business Highlights |
| | |
| | |
| • | Single-family conventional acquisition volume was $67.5 billion in the first quarter of 2023, a decrease of 21% compared with $85.3 billion in the fourth quarter of 2022. Purchase acquisition volume, of which more than 45% was for first-time homebuyers, decreased to $56.5 billion in the first quarter of 2023 from $70.8 billion in the fourth quarter of 2022. Refinance acquisition volume was $11.0 billion in the first quarter of 2023, a decline from $14.5 billion in the fourth quarter of 2022, due to the continued higher mortgage interest-rate environment. Over 90% of the company’s single-family conventional guaranty book of business as of March 31, 2023 had an interest rate below 5.50%, more than 80 basis points below the average interest rate for a single-family 30-year fixed-rate mortgage as of that date, resulting in a low likelihood these loans would refinance at current rates. | |
| | |
| • | Average single-family conventional guaranty book of business in the first quarter of 2023 declined by $322 million from the fourth quarter of 2022 driven by acquisition volumes being lower than loan paydowns during the quarter. Overall credit characteristics of the single-family conventional guaranty book of business remained strong, with a weighted-average mark-to-market loan-to-value ratio of 53% and a weighted-average FICO credit score at origination of 752 as of March 31, 2023. | |
| | |
| • | Average charged guaranty fee, net of TCCA fees, on the single-family conventional guaranty book remained relatively flat at 46.6 basis points as of March 31, 2023, compared with 46.5 basis points as of December 31, 2022. Average charged guaranty fee on newly acquired single-family conventional loans, net of TCCA fees, increased 2.3 basis points to 51.6 basis points for the first quarter of 2023, compared with 49.3 basis points for the fourth quarter of 2022. | |
| | |
| • | Single-family serious delinquency rate decreased to 0.59% as of March 31, 2023, the lowest level since 2005, from 0.65% as of December 31, 2022. The company expects the credit performance of the loans in its single-family guaranty book of business will decline compared to recent performance, which could lead to an increase in the single-family serious delinquency rate later this year. Single-family seriously delinquent loans are loans that are 90 days or more past due or in the foreclosure process. | |
| | | | | | | | |
| First Quarter 2023 Results | 3 |
| | | | | | | | | | | | | | | | | | | | | | | | | | | | | | | | | | | | | | | | | | | | | | | | |
| Multifamily Business Financial Results |
|
| (Dollars in millions) | | Q123 | | Q422 | | Variance | | % Change | | | | Q122 | | | | Variance | | % Change |
| Net interest income | | $ | 1,114 | | | $ | 1,102 | | | $ | 12 | | | 1 | % | | | | $ | 1,144 | | | | | $ | (30) | | | (3) | % |
| Fee and other income | | 15 | | | 23 | | | (8) | | | (35) | % | | | | 22 | | | | | (7) | | | (32) | % |
| Net revenues | | 1,129 | | | 1,125 | | | 4 | | | — | % | | | | 1,166 | | | | | (37) | | | (3) | % |
| | | | | | | | | | | | | | | | | | |
| Fair value gains (losses), net | | 38 | | | (2) | | | 40 | | | NM | | | | (47) | | | | | 85 | | | NM |
| Administrative expenses | | (148) | | | (151) | | | 3 | | | 2 | % | | | | (125) | | | | | (23) | | | (18) | % |
| Benefit (provision) for credit losses | | (179) | | | (1,091) | | | 912 | | | 84 | % | | | | 30 | | | | | (209) | | | NM |
| Credit enhancement expense | | (54) | | | (65) | | | 11 | | | 17 | % | | | | (68) | | | | | 14 | | | 21 | % |
| Change in expected credit enhancement recoveries | | 25 | | | 225 | | | (200) | | | (89) | % | | | | (9) | | | | | 34 | | | NM |
| Other expenses, net* | | (10) | | | (103) | | | 93 | | | 90 | % | | | | (69) | | | | | 59 | | | 86 | % |
| Income (loss) before federal income taxes | | 801 | | | (62) | | | 863 | | | NM | | | | 878 | | | | | (77) | | | (9) | % |
| Benefit (provision) for federal income taxes | | (161) | | | 10 | | | (171) | | | NM | | | | (179) | | | | | 18 | | | 10 | % |
| Net income (loss) | | $ | 640 | | | $ | (52) | | | $ | 692 | | | NM | | | | $ | 699 | | | | | $ | (59) | | | (8) | % |
| | | | | | | | | | | | | | | | | | |
| Average charged guaranty fee rate on multifamily guaranty book of business, at period end | | 78.1 bps | | 78.5 bps | | (0.4) bps | | (1) | % | | | | 79.3 bps | | | | (1.2) bps | | (2) | % |
| | | | | | | | | | | | | | | | | | |
| NM - Not meaningful | | | | | | | | | | | | | | | | | | |
| | | | | | | | | | | | | | | | | | |
| * Includes investment gains or losses and other income or expenses. |
| | | | | | | | | | | | | | | | | | |
| | | | | | | | | | | | | | | | | | |
| | | | | | | | | | | | | | | | | | |
| | | | | | |
| | |
| Key Business Highlights |
| | |
| | |
| • | New multifamily business volume was $10.2 billion in the first quarter of 2023, compared with $18.6 billion in the fourth quarter of 2022. This decline in new multifamily business volume was driven by less overall market activity. FHFA has capped the company’s multifamily loan purchases for 2023 at $75 billion. FHFA requires that a minimum of 50% of loan purchases must be mission-driven, focused on specified affordable and underserved market segments. | |
| | |
| • | The multifamily guaranty book of business grew by approximately 1% in the first quarter of 2023 to $445.4 billion. The average charged guaranty fee on the multifamily book declined slightly to 78.1 basis points as of March 31, 2023, compared with 78.5 basis points as of December 31, 2022. | |
| | |
| | |
| | |
| • | The multifamily serious delinquency rate increased to 0.35% as of March 31, 2023, compared with 0.24% as of December 31, 2022, largely driven by a seniors housing portfolio. Multifamily seriously delinquent loans are loans that are 60 days or more past due. | |
| | |
| • | The credit profile of Fannie Mae’s multifamily guaranty book of business, as a whole, is strong. However, the company’s seniors housing loans, especially those that are adjustable-rate mortgages, remain stressed. Approximately 38% of the $16.5 billion seniors housing loans in the company’s multifamily guaranty book of business as of March 31, 2023 were adjustable-rate mortgages, compared with 11% for the entire multifamily guaranty book. In a rising mortgage interest rate environment, multifamily borrowers with adjustable-rate mortgages will have higher monthly payments, which may lower their debt service coverage ratios. | |
| | | | | | | | |
| First Quarter 2023 Results | 4 |
Fannie Mae’s Condensed Consolidated Balance Sheets and Condensed Consolidated Statements of Operations and Comprehensive Income for the first quarter of 2023 are available in the accompanying Annex; however, investors and interested parties should read the company’s First Quarter 2023 Form 10-Q, which was filed today with the Securities and Exchange Commission and is available on Fannie Mae’s website, www.fanniemae.com. The company provides further discussion of its financial results and condition, credit performance, and other matters in its First Quarter 2023 Form 10-Q. Additional information about the company’s financial and credit performance is contained in Fannie Mae’s “Q1 2023 Financial Supplement” at www.fanniemae.com.
# # #
In this release, the company has presented forward-looking statements regarding the credit performance of the loans in the company’s guaranty book of business, economic and housing market conditions and their impact, as well as the company’s business plans and their impact. Actual outcomes could be materially different from what is set forth in these forward-looking statements due to a variety of factors, including those described in “Forward-Looking Statements” in the company’s First Quarter 2023 Form 10-Q and in “Forward-Looking Statements” and “Risk Factors” in the company’s 2022 Form 10-K.
Fannie Mae provides website addresses in its news releases solely for readers’ information. Other content or information appearing on these websites is not part of this release.
Fannie Mae advances equitable and sustainable access to homeownership and quality, affordable rental housing for millions of people across America. We enable the 30-year fixed-rate mortgage and drive responsible innovation to make homebuying and renting easier, fairer, and more accessible. To learn more, visit fanniemae.com.
| | | | | | | | |
| First Quarter 2023 Results | 5 |
ANNEX
FANNIE MAE
(In conservatorship)
Condensed Consolidated Balance Sheets — (Unaudited)
(Dollars in millions)
| | | | | | | | | | | | | | | | | | | | | | | |
| As of |
| March 31, 2023 | December 31, 2022 | |
| ASSETS | |
| Cash and cash equivalents | | $ | 60,330 | | | | | $ | 57,987 | | |
| Restricted cash and cash equivalents (includes $24,639 and $23,348, respectively, related to consolidated trusts) | | 30,507 | | | | | 29,854 | | |
| Securities purchased under agreements to resell (includes $5,500 and $3,475, respectively, related to consolidated trusts) | | 26,950 | | | | | 14,565 | | |
| Investments in securities, at fair value | | 51,089 | | | | | 50,825 | | |
| Mortgage loans: | | | | | | | |
| Loans held for sale, at lower of cost or fair value | | 512 | | | | | 2,033 | | |
| Loans held for investment, at amortized cost: | | | | | | | |
| Of Fannie Mae | | 51,645 | | | | | 52,081 | | |
| Of consolidated trusts | | 4,069,513 | | | | | 4,071,669 | | |
| Total loans held for investment (includes $3,599 and $3,645, respectively, at fair value) | | 4,121,158 | | | | | 4,123,750 | | |
| Allowance for loan losses | | (11,335) | | | | | (11,347) | | |
| Total loans held for investment, net of allowance | | 4,109,823 | | | | | 4,112,403 | | |
| Total mortgage loans | | 4,110,335 | | | | | 4,114,436 | | |
| Advances to lenders | | 2,748 | | | | | 1,502 | | |
| Deferred tax assets, net | | 12,615 | | | | | 12,911 | | |
| Accrued interest receivable, net (includes $9,236 and $9,241 related to consolidated trusts and net of allowance of $68 and $111, respectively) | | 9,780 | | | | | 9,821 | | |
| Other assets | | 13,106 | | | | | 13,387 | | |
| Total assets | | $ | 4,317,460 | | | | | $ | 4,305,288 | | |
| LIABILITIES AND EQUITY | |
| Liabilities: | | | | | | | |
| Accrued interest payable (includes $9,545 and $9,347, respectively, related to consolidated trusts) | | $ | 10,182 | | | | | $ | 9,917 | | |
| Debt: | | | | | | | |
| Of Fannie Mae (includes $1,132 and $1,161, respectively, at fair value) | | 139,164 | | | | | 134,168 | | |
| Of consolidated trusts (includes $15,972 and $16,260, respectively, at fair value) | | 4,091,602 | | | | | 4,087,720 | | |
| Other liabilities (includes $1,729 and $1,748, respectively, related to consolidated trusts) | | 12,463 | | | | | 13,206 | | |
| Total liabilities | | 4,253,411 | | | | | 4,245,011 | | |
| Commitments and contingencies (Note 13) | | — | | | | | — | | |
| Fannie Mae stockholders’ equity: | | | | | | | |
| Senior preferred stock (liquidation preference of $181,776 and $180,339, respectively) | | 120,836 | | | | | 120,836 | | |
| Preferred stock, 700,000,000 shares are authorized—555,374,922 shares issued and outstanding | | 19,130 | | | | | 19,130 | | |
| Common stock, no par value, no maximum authorization—1,308,762,703 shares issued and 1,158,087,567 shares outstanding | | 687 | | | | | 687 | | |
| Accumulated deficit | | (69,239) | | | | | (73,011) | | |
| Accumulated other comprehensive income | | 35 | | | | | 35 | | |
| Treasury stock, at cost, 150,675,136 shares | | (7,400) | | | | | (7,400) | | |
| Total stockholders’ equity (See Note 1: Senior Preferred Stock Purchase Agreement and Senior Preferred Stock for information on the related dividend obligation and liquidation preference) | | 64,049 | | | | | 60,277 | | |
| Total liabilities and equity | | $ | 4,317,460 | | | | | $ | 4,305,288 | | |
See Notes to Condensed Consolidated Financial Statements in the First Quarter 2023 Form 10-Q
| | | | | | | | |
| First Quarter 2023 Results | 6 |
FANNIE MAE
(In conservatorship)
Condensed Consolidated Statements of Operations and Comprehensive Income — (Unaudited)
(Dollars in millions, except per share amounts)
| | | | | | | | | | | | | | | | | | | | | | | | | | | | | | | | | | | |
| For the HIDE COLUMNS | | | For the Three Months Ended March 31, | |
| | | |
| 2023 | | | | | 2023 | | 2022 | | |
| Interest income: | | | | | | | | | | | | | | | | | | | |
| Investments in securities | | | | | | | | | | $ | 981 | | | | | $ | 166 | | | | | | |
| Mortgage loans | | | | | | | | | | 32,137 | | | | | 27,142 | | | | | | |
| Other | | | | | | | | | | 452 | | | | | 32 | | | | | | |
| Total interest income | | | | | | | | | | 33,570 | | | | | 27,340 | | | | | | |
| Interest expense: | | | | | | | | | | | | | | | | | | | |
| Short-term debt | | | | | | | | | | (119) | | | | | (1) | | | | | | |
| Long-term debt | | | | | | | | | | (26,665) | | | | | (19,940) | | | | | | |
| Total interest expense | | | | | | | | | | (26,784) | | | | | (19,941) | | | | | | |
| Net interest income | | | | | | | | | | 6,786 | | | | | 7,399 | | | | | | |
| Provision for credit losses | | | | | | | | | | (132) | | | | | (240) | | | | | | |
| Net interest income after provision for credit losses | | | | | | | | | | 6,654 | | | | | 7,159 | | | | | | |
| Investment losses, net | | | | | | | | | | (67) | | | | | (102) | | | | | | |
| Fair value gains, net | | | | | | | | | | 204 | | | | | 480 | | | | | | |
| Fee and other income | | | | | | | | | | 63 | | | | | 83 | | | | | | |
| Non-interest income | | | | | | | | | | 200 | | | | | 461 | | | | | | |
| Administrative expenses: | | | | | | | | | | | | | | | | | | | |
| Salaries and employee benefits | | | | | | | | | | (480) | | | | | (407) | | | | | | |
| Professional services | | | | | | | | | | (184) | | | | | (209) | | | | | | |
| | | | | | | | | | | | | | | | | | | |
| Other administrative expenses | | | | | | | | | | (204) | | | | | (192) | | | | | | |
| Total administrative expenses | | | | | | | | | | (868) | | | | | (808) | | | | | | |
| TCCA fees | | | | | | | | | | (855) | | | | | (824) | | | | | | |
| Credit enhancement expense | | | | | | | | | | (341) | | | | | (278) | | | | | | |
| Change in expected credit enhancement recoveries | | | | | | | | | | 120 | | | | | 60 | | | | | | |
| Other expenses, net | | | | | | | | | | (130) | | | | | (197) | | | | | | |
| Total expenses | | | | | | | | | | (2,074) | | | | | (2,047) | | | | | | |
| Income before federal income taxes | | | | | | | | | | 4,780 | | | | | 5,573 | | | | | | |
| Provision for federal income taxes | | | | | | | | | | (1,008) | | | | | (1,165) | | | | | | |
| Net income | | | | | | | | | | 3,772 | | | | | 4,408 | | | | | | |
| Other comprehensive loss | | | | | | | | | | — | | | | | (7) | | | | | | |
| Total comprehensive income | | | | | | | | | | $ | 3,772 | | | | | $ | 4,401 | | | | | | |
| Net income | | | | | | | | | | $ | 3,772 | | | | | $ | 4,408 | | | | | | |
| Dividends distributed or amounts attributable to senior preferred stock | | | | | | | | | | (3,772) | | | | | (4,401) | | | | | | |
| Net income attributable to common stockholders | | | | | | | | | | $ | — | | | | | $ | 7 | | | | | | |
| Earnings per share: | | | | | | | | | | | | | | | | | | | |
| Basic | | | | | | | | | | $ | 0.00 | | | | | $ | 0.00 | | | | | | |
| Diluted | | | | | | | | | | 0.00 | | | | | 0.00 | | | | | | |
| Weighted-average common shares outstanding: | | | | | | | | | | | | | | | | | | | |
| Basic | | | | | | | | | | 5,867 | | | | | 5,867 | | | | | | |
| Diluted | | | | | | | | | | 5,867 | | | | | 5,893 | | | | | | |
See Notes to Condensed Consolidated Financial Statements in the First Quarter 2023 Form 10-Q
| | | | | | | | |
| First Quarter 2023 Results | 7 |