Contact: Pete Bakel Resource Center: 1-800-232-6643
202-752-2034 Exhibit 99.1
Date: August 1, 2023
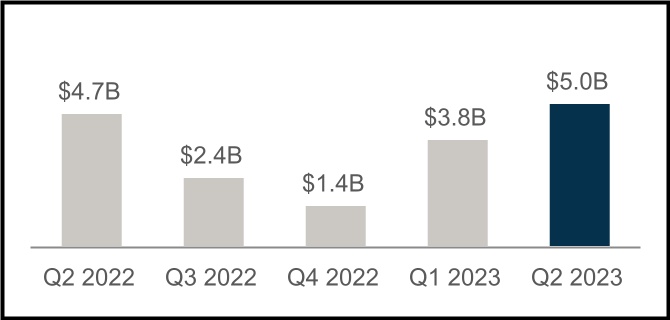
Fannie Mae Reports Net Income of $5.0 Billion for Second Quarter 2023
| | | | | | | | | | | | | | |
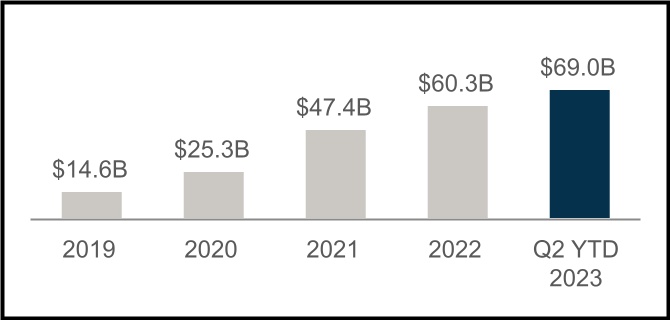
| • | $5.0 billion net income for the second quarter of 2023, with net worth reaching $69.0 billion as of June 30, 2023 | | “With our solid second quarter performance, Fannie Mae continues to serve as a stabilizing force for America’s housing finance system in even the most challenging markets. After nearly 15 years of transformation, today, Fannie Mae is safer and stronger. This is thanks to our team’s dedicated efforts to improve the resiliency of our business and our steadfast focus on risk management.”
Priscilla Almodovar, Chief Executive Officer |
| | |
| • | Net income increased $1.2 billion in the second quarter of 2023 compared with the first quarter of 2023, primarily driven by a $1.4 billion shift from provision for credit losses to benefit for credit losses | |
| | |
| • | $104 billion in liquidity provided to the mortgage market in the second quarter of 2023 | |
| | |
| • | Acquired approximately 227,000 single-family purchase loans, of which more than 45% were for first-time homebuyers, and approximately 54,000 single-family refinance loans during the second quarter of 2023 | |
| | |
| • | Financed approximately 139,000 units of multifamily rental housing in the second quarter of 2023, a significant majority of which were affordable to households earning at or below 120% of area median income, providing support for both workforce and affordable housing | |
| | |
| • | Home prices grew 3.6% on a national basis in the second quarter of 2023, compared with a 1.4% increase in the first quarter of 2023 | |
| | |
| • | The U.S. weekly average 30-year fixed-rate mortgage rate increased from 6.32% as of the end of the first quarter of 2023 to 6.71% as of the end of the second quarter of 2023 | |
| | |
| | |
| | |
| | |
| | | | |
| | | | |
| | | | |
| |
| | | | |
| | | | | | | | | | | | | | | | | | | | | | | | | | | | | | | | | | | |
| Q2 2023 Key Results |
|
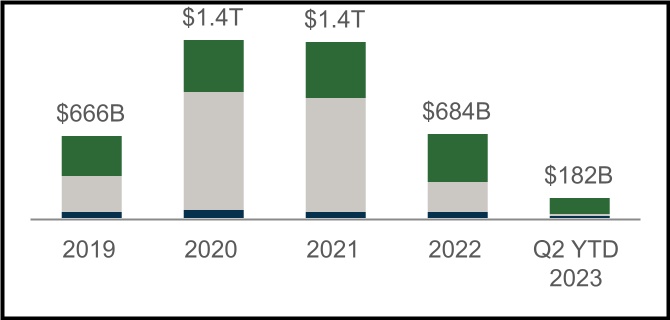
| $69.0 Billion Net Worth | $182 Billion Supporting Housing Activity |
| | | | | | | | | | | |
| Increase of $5.0 billion in the second quarter of 2023 | | SF Home Purchases | | | SF Refinancings | | | MF Rental Units |
| | | | |
| | | | | | | | | | | | | | | | | | | | |
| | | | | | |
| $5.0 Billion Net Income for Q2 2023 | Serious Delinquency Rates |
| | | | | | |
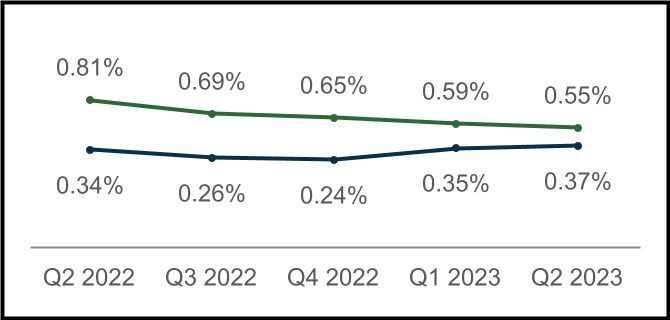
| Increase of $1.2 billion compared with first quarter 2023 | | Single-Family SDQ Rate | | Multifamily SDQ Rate |
| |

| | | | | | | | |
| Second Quarter 2023 Results | 1 |
| | | | | | | | | | | | | | | | | | | | | | | | | | | | | | | | | | | | | | | | | | | | | | |
| Summary of Financial Results |
| | | | | | | | | | | | | | | | |
| (Dollars in millions) | | Q223 | | Q123 | | Variance | | % Change | | Q222 | | | | Variance | | % Change |
| Net interest income | | $ | 7,035 | | | $ | 6,786 | | | $ | 249 | | | 4 | % | | $ | 7,808 | | | | | $ | (773) | | | (10) | % |
| Fee and other income | | 70 | | | 63 | | | 7 | | | 11 | % | | 81 | | | | | (11) | | | (14) | % |
| Net revenues | | 7,105 | | | 6,849 | | | 256 | | | 4 | % | | 7,889 | | | | | (784) | | | (10) | % |
| Investment gains (losses), net | | 25 | | | (67) | | | 92 | | | NM | | (49) | | | | | 74 | | | NM |
| Fair value gains, net | | 404 | | | 204 | | | 200 | | | 98 | % | | 529 | | | | | (125) | | | (24) | % |
| Administrative expenses | | (864) | | | (868) | | | 4 | | | — | % | | (795) | | | | | (69) | | | (9) | % |
| Benefit (provision) for credit losses | | 1,266 | | | (132) | | | 1,398 | | | NM | | (218) | | | | | 1,484 | | | NM |
| TCCA fees | | (856) | | | (855) | | | (1) | | | — | % | | (841) | | | | | (15) | | | (2) | % |
Credit enhancement expense(1) | | (384) | | | (341) | | | (43) | | | (13) | % | | (332) | | | | | (52) | | | (16) | % |
| Change in expected credit enhancement recoveries | | (160) | | | 120 | | | (280) | | | NM | | (47) | | | | | (113) | | | NM |
Other expenses, net(2) | | (257) | | | (130) | | | (127) | | | (98) | % | | (261) | | | | | 4 | | | 2 | % |
| Income before federal income taxes | | 6,279 | | | 4,780 | | | 1,499 | | | 31 | % | | 5,875 | | | | | 404 | | | 7 | % |
| Provision for federal income taxes | | (1,285) | | | (1,008) | | | (277) | | | (27) | % | | (1,222) | | | | | (63) | | | (5) | % |
| Net income | | $ | 4,994 | | | $ | 3,772 | | | $ | 1,222 | | | 32 | % | | $ | 4,653 | | | | | $ | 341 | | | 7 | % |
| | | | | | | | | | | | | | | | |
| Total comprehensive income | | $ | 4,995 | | | $ | 3,772 | | | $ | 1,223 | | | 32 | % | | $ | 4,649 | | | | | $ | 346 | | | 7 | % |
| Net worth | | $ | 69,044 | | | $ | 64,049 | | | $ | 4,995 | | | 8 | % | | $ | 56,407 | | | | | $ | 12,637 | | | 22 | % |
| | | | | | | | | | | | | | | | |
| | | | | | | | | | | | | | | | |
| NM - Not meaningful | | | | | | | | | | | | | | | | |
(1) Consists of costs associated with freestanding credit enhancements, which primarily include Connecticut Avenue Securities® and Credit Insurance Risk TransferTM programs, enterprise-paid mortgage insurance, and certain lender risk-sharing programs. |
| | | | | | | | | | | | | | | | |
(2) Consists of debt extinguishment gains (losses), foreclosed property income (expense), gains (losses) from partnership investments, housing trust fund expenses, loan subservicing costs, and servicer fees paid in connection with certain loss mitigation activities. |
| | | | | | | | | | | | | | | | |
|
| | | | | | | | | |
| Financial Highlights | |
| | | |
| | | |
| Net income increased $1.2 billion in the second quarter of 2023, compared with the first quarter of 2023, primarily driven by a $1.4 billion shift from provision for credit losses to benefit for credit losses. | |
| | | |
| • | | Net interest income increased $249 million in the second quarter of 2023, compared with the first quarter of 2023, primarily driven by an increase in income from the company’s other investments portfolio and an increase in amortization income. Higher income from the other investments portfolio was due to an increase in short-term yields. Amortization income increased due to increases in prepayment volumes in the second quarter of 2023. | |
| | | |
| • | | Benefit for credit losses was $1.3 billion in the second quarter of 2023, compared with a provision of $132 million in the first quarter of 2023. The benefit for credit losses for the second quarter of 2023 was driven by a single-family credit benefit, partially offset by a modest multifamily provision. •The single-family credit benefit was primarily driven by improvements in actual and forecasted home prices, partially offset by a provision on newly acquired loans. •The multifamily provision was primarily due to decreases in estimated multifamily property values. The provision for credit losses for the first quarter of 2023 was driven by a multifamily provision, partially offset by a modest single-family credit benefit. •The multifamily provision was primarily due to declines in estimated multifamily property values and continued uncertainty related to seniors housing loans, including uncertainty related to adjustable-rate loans, partially offset by a benefit from lower actual and projected interest rates. •The single-family credit benefit was primarily driven by improvements in actual and forecasted home prices, substantially offset by provision on newly acquired loans. | |
| | | |
| | | | | | | | |
| Second Quarter 2023 Results | 2 |
| | | | | | | | | | | | | | | | | | | | | | | | | | | | | | | | | | | | | | | | | | | | | | | | |
| Single-Family Business Financial Results |
|
| (Dollars in millions) | | Q223 | | Q123 | | Variance | | % Change | | | | Q222 | | | | Variance | | % Change |
| Net interest income | | $ | 5,917 | | | $ | 5,672 | | | $ | 245 | | | 4 | % | | | | $ | 6,573 | | | | | $ | (656) | | | (10) | % |
| Fee and other income | | 52 | | | 48 | | | 4 | | | 8 | % | | | | 60 | | | | | (8) | | | (13) | % |
| Net revenues | | 5,969 | | | 5,720 | | | 249 | | | 4 | % | | | | 6,633 | | | | | (664) | | | (10) | % |
| Investment gains (losses), net | | 27 | | | (71) | | | 98 | | | NM | | | | (27) | | | | | 54 | | | NM |
| Fair value gains, net | | 460 | | | 166 | | | 294 | | | 177 | % | | | | 543 | | | | | (83) | | | (15) | % |
| Administrative expenses | | (718) | | | (720) | | | 2 | | | — | % | | | | (671) | | | | | (47) | | | (7) | % |
| Benefit (provision) for credit losses | | 1,418 | | | 47 | | | 1,371 | | | NM | | | | (206) | | | | | 1,624 | | | NM |
| TCCA fees | | (856) | | | (855) | | | (1) | | | — | % | | | | (841) | | | | | (15) | | | (2) | % |
| Credit enhancement expense | | (327) | | | (287) | | | (40) | | | (14) | % | | | | (270) | | | | | (57) | | | (21) | % |
| Change in expected credit enhancement recoveries | | (223) | | | 95 | | | (318) | | | NM | | | | (43) | | | | | (180) | | | NM |
| Other expenses, net | | (203) | | | (116) | | | (87) | | | (75) | % | | | | (224) | | | | | 21 | | | 9 | % |
| Income before federal income taxes | | 5,547 | | | 3,979 | | | 1,568 | | | 39 | % | | | | 4,894 | | | | | 653 | | | 13 | % |
| Provision for federal income taxes | | (1,153) | | | (847) | | | (306) | | | (36) | % | | | | (1,008) | | | | | (145) | | | (14) | % |
| Net income | | $ | 4,394 | | | $ | 3,132 | | | $ | 1,262 | | | 40 | % | | | | $ | 3,886 | | | | | $ | 508 | | | 13 | % |
| | | | | | | | | | | | | | | | | | |
| Average charged guaranty fee on new conventional acquisitions, net of TCCA fees* | | 52.2 bps | | 51.6 bps | | 0.6 bps | | 1 | % | | | | 49.6 bps | | | | 2.6 bps | | 5 | % |
| Average charged guaranty fee on conventional guaranty book of business, net of TCCA fees* | | 46.8 bps | | 46.6 bps | | 0.2 bps | | — | % | | | | 46.1 bps | | | | 0.7 bps | | 2 | % |
| NM - Not meaningful | | | | | | | | | | | | | | | | | | |
| * In Q4 2022, the company enhanced the method it uses to estimate average loan life at acquisition. Charged fees reported for prior periods have been updated in this release to reflect this updated methodology. |
| | | | | | | | | | | | | | | | | | |
| | | | | | | | | | | | | | | | | | |
| | | | | | | | | | | | | | | | | | |
| | | | | | |
|
| | |
| | |
| | |
| Key Business Highlights |
| | |
| | |
| • | Single-family conventional acquisition volume was $89.2 billion in the second quarter of 2023, an increase of 32% compared with $67.5 billion in the first quarter of 2023. Purchase acquisition volume, of which more than 45% was for first-time homebuyers, increased to $76.4 billion in the second quarter of 2023 from $56.5 billion in the first quarter of 2023. Refinance acquisition volume was $12.8 billion in the second quarter of 2023, an increase from $11.0 billion in the first quarter of 2023. | |
| | |
| • | Average single-family conventional guaranty book of business in the second quarter of 2023 declined by $1.4 billion from the first quarter of 2023 driven by acquisition volumes being lower than loan paydowns during the quarter. Overall credit characteristics of the single-family conventional guaranty book of business remained strong, with a weighted-average mark-to-market loan-to-value ratio of 51% and a weighted-average FICO credit score at origination of 752 as of June 30, 2023. | |
| | |
| • | Average charged guaranty fee, net of TCCA fees, on the single-family conventional guaranty book remained relatively flat at 46.8 basis points as of June 30, 2023, compared with 46.6 basis points as of March 31, 2023. Average charged guaranty fee on newly acquired single-family conventional loans, net of TCCA fees, remained relatively flat at 52.2 basis points for the second quarter of 2023, compared with 51.6 basis points for the first quarter of 2023. | |
| | |
| • | Single-family serious delinquency rate decreased to 0.55% as of June 30, 2023 from 0.59% as of March 31, 2023. Single-family seriously delinquent loans are loans that are 90 days or more past due or in the foreclosure process. | |
| | | | | | | | |
| Second Quarter 2023 Results | 3 |
| | | | | | | | | | | | | | | | | | | | | | | | | | | | | | | | | | | | | | | | | | | | | | | | |
| Multifamily Business Financial Results |
|
| (Dollars in millions) | | Q223 | | Q123 | | Variance | | % Change | | | | Q222 | | | | Variance | | % Change |
| Net interest income | | $ | 1,118 | | | $ | 1,114 | | | $ | 4 | | | — | % | | | | $ | 1,235 | | | | | $ | (117) | | | (9) | % |
| Fee and other income | | 18 | | | 15 | | | 3 | | | 20 | % | | | | 21 | | | | | (3) | | | (14) | % |
| Net revenues | | 1,136 | | | 1,129 | | | 7 | | | 1 | % | | | | 1,256 | | | | | (120) | | | (10) | % |
| | | | | | | | | | | | | | | | | | |
| Fair value gains (losses), net | | (56) | | | 38 | | | (94) | | | NM | | | | (14) | | | | | (42) | | | NM |
| Administrative expenses | | (146) | | | (148) | | | 2 | | | 1 | % | | | | (124) | | | | | (22) | | | (18) | % |
| Provision for credit losses | | (152) | | | (179) | | | 27 | | | 15 | % | | | | (12) | | | | | (140) | | | NM |
| Credit enhancement expense | | (57) | | | (54) | | | (3) | | | (6) | % | | | | (62) | | | | | 5 | | | 8 | % |
| Change in expected credit enhancement recoveries | | 63 | | | 25 | | | 38 | | | 152 | % | | | | (4) | | | | | 67 | | | NM |
| Other expenses, net* | | (56) | | | (10) | | | (46) | | | NM | | | | (59) | | | | | 3 | | | 5 | % |
| Income before federal income taxes | | 732 | | | 801 | | | (69) | | | (9) | % | | | | 981 | | | | | (249) | | | (25) | % |
| Provision for federal income taxes | | (132) | | | (161) | | | 29 | | | 18 | % | | | | (214) | | | | | 82 | | | 38 | % |
| Net income | | $ | 600 | | | $ | 640 | | | $ | (40) | | | (6) | % | | | | $ | 767 | | | | | $ | (167) | | | (22) | % |
| | | | | | | | | | | | | | | | | | |
| Average charged guaranty fee rate on multifamily guaranty book of business, at period end | | 77.4 bps | | 78.1 bps | | (0.7) bps | | (1) | % | | | | 79.5 bps | | | | (2.1) bps | | (3) | % |
| | | | | | | | | | | | | | | | | | |
| NM - Not meaningful | | | | | | | | | | | | | | | | | | |
| | | | | | | | | | | | | | | | | | |
| * Includes investment gains or losses and other income or expenses. |
| | | | | | | | | | | | | | | | | | |
| | | | | | | | | | | | | | | | | | |
| | | | | | | | | | | | | | | | | | |
| | | | | | |
| | |
| Key Business Highlights |
| | |
| | |
| • | New multifamily business volume was $15.1 billion in the second quarter of 2023, compared with $10.2 billion in the first quarter of 2023. FHFA has capped the company’s multifamily loan purchases for 2023 at $75 billion. FHFA requires that a minimum of 50% of the company’s multifamily loan purchases must be mission-driven, focused on specified affordable and underserved market segments. | |
| | |
| • | The multifamily guaranty book of business grew by approximately 2% in the second quarter of 2023 to $454.7 billion. The average charged guaranty fee on the multifamily book declined slightly to 77.4 basis points as of June 30, 2023, compared with 78.1 basis points as of March 31, 2023. | |
| | |
| | |
| | |
| • | The multifamily serious delinquency rate increased to 0.37% as of June 30, 2023, compared with 0.35% as of March 31, 2023. Multifamily seriously delinquent loans are loans that are 60 days or more past due. | |
| | |
| | | | | | | | |
| Second Quarter 2023 Results | 4 |
Fannie Mae’s Condensed Consolidated Balance Sheets and Condensed Consolidated Statements of Operations and Comprehensive Income for the second quarter of 2023 are available in the accompanying Annex; however, investors and interested parties should read the company’s Second Quarter 2023 Form 10-Q, which was filed today with the Securities and Exchange Commission and is available on Fannie Mae’s website, www.fanniemae.com. The company provides further discussion of its financial results and condition, credit performance, and other matters in its Second Quarter 2023 Form 10-Q. Additional information about the company’s financial and credit performance is contained in Fannie Mae’s “Q2 2023 Financial Supplement” at www.fanniemae.com.
# # #
Fannie Mae provides website addresses in its news releases solely for readers’ information. Other content or information appearing on these websites is not part of this release.
Fannie Mae advances equitable and sustainable access to homeownership and quality, affordable rental housing for millions of people across America. We enable the 30-year fixed-rate mortgage and drive responsible innovation to make homebuying and renting easier, fairer, and more accessible. To learn more, visit fanniemae.com.
| | | | | | | | |
| Second Quarter 2023 Results | 5 |
ANNEX
FANNIE MAE
(In conservatorship)
Condensed Consolidated Balance Sheets — (Unaudited)
(Dollars in millions)
| | | | | | | | | | | | | | | | | | | | | | | |
| As of |
| June 30, 2023 | | December 31, 2022 |
| ASSETS | |
| Cash and cash equivalents | | $ | 52,229 | | | | | $ | 57,987 | | |
| Restricted cash and cash equivalents (includes $21,605 and $23,348, respectively, related to consolidated trusts) | | 27,206 | | | | | 29,854 | | |
| Securities purchased under agreements to resell (includes $10,450 and $3,475, respectively, related to consolidated trusts) | | 33,050 | | | | | 14,565 | | |
| Investments in securities, at fair value | | 51,231 | | | | | 50,825 | | |
| Mortgage loans: | | | | | | | |
| Loans held for sale, at lower of cost or fair value | | 513 | | | | | 2,033 | | |
| Loans held for investment, at amortized cost: | | | | | | | |
| Of Fannie Mae | | 49,785 | | | | | 52,081 | | |
| Of consolidated trusts | | 4,080,809 | | | | | 4,071,669 | | |
| Total loans held for investment (includes $3,433 and $3,645, respectively, at fair value) | | 4,130,594 | | | | | 4,123,750 | | |
| Allowance for loan losses | | (9,982) | | | | | (11,347) | | |
| Total loans held for investment, net of allowance | | 4,120,612 | | | | | 4,112,403 | | |
| Total mortgage loans | | 4,121,125 | | | | | 4,114,436 | | |
| Advances to lenders | | 3,483 | | | | | 1,502 | | |
| Deferred tax assets, net | | 11,990 | | | | | 12,911 | | |
| Accrued interest receivable, net (includes $9,442 and $9,241 related to consolidated trusts and net of allowance of $49 and $111, respectively) | | 9,930 | | | | | 9,821 | | |
| Other assets | | 13,466 | | | | | 13,387 | | |
| Total assets | | $ | 4,323,710 | | | | | $ | 4,305,288 | | |
| LIABILITIES AND EQUITY | |
| Liabilities: | | | | | | | |
| Accrued interest payable (includes $9,721 and $9,347, respectively, related to consolidated trusts) | | $ | 10,413 | | | | | $ | 9,917 | | |
| Debt: | | | | | | | |
| Of Fannie Mae (includes $884 and $1,161, respectively, at fair value) | | 137,696 | | | | | 134,168 | | |
| Of consolidated trusts (includes $15,172 and $16,260, respectively, at fair value) | | 4,094,654 | | | | | 4,087,720 | | |
| Other liabilities (includes $1,699 and $1,748, respectively, related to consolidated trusts) | | 11,903 | | | | | 13,206 | | |
| Total liabilities | | 4,254,666 | | | | | 4,245,011 | | |
| Commitments and contingencies (Note 13) | | — | | | | | — | | |
| Fannie Mae stockholders’ equity: | | | | | | | |
| Senior preferred stock (liquidation preference of $185,548 and $180,339, respectively) | | 120,836 | | | | | 120,836 | | |
| Preferred stock, 700,000,000 shares are authorized—555,374,922 shares issued and outstanding | | 19,130 | | | | | 19,130 | | |
| Common stock, no par value, no maximum authorization—1,308,762,703 shares issued and 1,158,087,567 shares outstanding | | 687 | | | | | 687 | | |
| Accumulated deficit | | (64,245) | | | | | (73,011) | | |
| Accumulated other comprehensive income | | 36 | | | | | 35 | | |
| Treasury stock, at cost, 150,675,136 shares | | (7,400) | | | | | (7,400) | | |
| Total stockholders’ equity (See Note 1: Senior Preferred Stock Purchase Agreement and Senior Preferred Stock for information on the related dividend obligation and liquidation preference) | | 69,044 | | | | | 60,277 | | |
| Total liabilities and equity | | $ | 4,323,710 | | | | | $ | 4,305,288 | | |
See Notes to Condensed Consolidated Financial Statements in the Second Quarter 2023 Form 10-Q
| | | | | | | | |
| Second Quarter 2023 Results | 6 |
FANNIE MAE
(In conservatorship)
Condensed Consolidated Statements of Operations and Comprehensive Income — (Unaudited)
(Dollars in millions, except per share amounts)
| | | | | | | | | | | | | | | | | | | | | | | | | | | | | | | | | | | | | | | | | | | | | | | |
| For the Three Months Ended June 30, | | For the Six Months Ended June 30, |
| |
| 2023 | | 2022 | | 2023 | | 2022 |
| Interest income: | | | | | | | | | | | | | | | |
| Investments in securities | | $ | 1,101 | | | | | $ | 318 | | | | | $ | 2,082 | | | | | $ | 484 | | |
| Mortgage loans | | 32,655 | | | | | 29,082 | | | | | 64,792 | | | | | 56,224 | | |
| Other | | 584 | | | | | 55 | | | | | 1,036 | | | | | 87 | | |
| Total interest income | | 34,340 | | | | | 29,455 | | | | | 67,910 | | | | | 56,795 | | |
| Interest expense: | | | | | | | | | | | | | | | |
| Short-term debt | | (183) | | | | | (5) | | | | | (302) | | | | | (6) | | |
| Long-term debt | | (27,122) | | | | | (21,642) | | | | | (53,787) | | | | | (41,582) | | |
| Total interest expense | | (27,305) | | | | | (21,647) | | | | | (54,089) | | | | | (41,588) | | |
| Net interest income | | 7,035 | | | | | 7,808 | | | | | 13,821 | | | | | 15,207 | | |
| Benefit (provision) for credit losses | | 1,266 | | | | | (218) | | | | | 1,134 | | | | | (458) | | |
| Net interest income after benefit (provision) for credit losses | | 8,301 | | | | | 7,590 | | | | | 14,955 | | | | | 14,749 | | |
| Investment gains (losses), net | | 25 | | | | | (49) | | | | | (42) | | | | | (151) | | |
| Fair value gains, net | | 404 | | | | | 529 | | | | | 608 | | | | | 1,009 | | |
| Fee and other income | | 70 | | | | | 81 | | | | | 133 | | | | | 164 | | |
| Non-interest income | | 499 | | | | | 561 | | | | | 699 | | | | | 1,022 | | |
| Administrative expenses: | | | | | | | | | | | | | | | |
| Salaries and employee benefits | | (467) | | | | | (398) | | | | | (947) | | | | | (805) | | |
| Professional services | | (192) | | | | | (198) | | | | | (376) | | | | | (407) | | |
| | | | | | | | | | | | | | | |
| Other administrative expenses | | (205) | | | | | (199) | | | | | (409) | | | | | (391) | | |
| Total administrative expenses | | (864) | | | | | (795) | | | | | (1,732) | | | | | (1,603) | | |
| TCCA fees | | (856) | | | | | (841) | | | | | (1,711) | | | | | (1,665) | | |
| Credit enhancement expense | | (384) | | | | | (332) | | | | | (725) | | | | | (610) | | |
| Change in expected credit enhancement recoveries | | (160) | | | | | (47) | | | | | (40) | | | | | 13 | | |
| Other expenses, net | | (257) | | | | | (261) | | | | | (387) | | | | | (458) | | |
| Total expenses | | (2,521) | | | | | (2,276) | | | | | (4,595) | | | | | (4,323) | | |
| Income before federal income taxes | | 6,279 | | | | | 5,875 | | | | | 11,059 | | | | | 11,448 | | |
| Provision for federal income taxes | | (1,285) | | | | | (1,222) | | | | | (2,293) | | | | | (2,387) | | |
| Net income | | 4,994 | | | | | 4,653 | | | | | 8,766 | | | | | 9,061 | | |
| Other comprehensive income (loss) | | 1 | | | | | (4) | | | | | 1 | | | | | (11) | | |
| Total comprehensive income | | $ | 4,995 | | | | | $ | 4,649 | | | | | $ | 8,767 | | | | | $ | 9,050 | | |
| Net income | | $ | 4,994 | | | | | $ | 4,653 | | | | | $ | 8,766 | | | | | $ | 9,061 | | |
| Dividends distributed or amounts attributable to senior preferred stock | | (4,995) | | | | | (4,649) | | | | | (8,767) | | | | | (9,050) | | |
| Net income (loss) attributable to common stockholders | | $ | (1) | | | | | $ | 4 | | | | | $ | (1) | | | | | $ | 11 | | |
| Earnings per share: | | | | | | | | | | | | | | | |
| Basic | | $ | 0.00 | | | | | $ | 0.00 | | | | | $ | 0.00 | | | | | $ | 0.00 | | |
| Diluted | | 0.00 | | | | | 0.00 | | | | | 0.00 | | | | | 0.00 | | |
| Weighted-average common shares outstanding: | | | | | | | | | | | | | | | |
| Basic | | 5,867 | | | | | 5,867 | | | | | 5,867 | | | | | 5,867 | | |
| Diluted | | 5,867 | | | | | 5,893 | | | | | 5,867 | | | | | 5,893 | | |
See Notes to Condensed Consolidated Financial Statements in the Second Quarter 2023 Form 10-Q
| | | | | | | | |
| Second Quarter 2023 Results | 7 |