
Contact: Pete Bakel Resource Center: 1-800-232-6643
202-752-2034 Exhibit 99.1
Date: February 15, 2024
Fannie Mae Reports Net Income of $17.4 Billion for 2023 and
$3.9 Billion for Fourth Quarter 2023
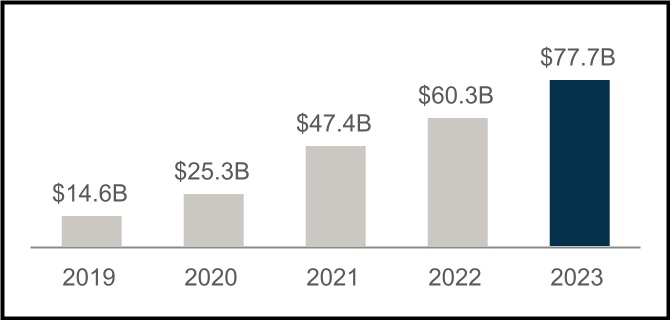
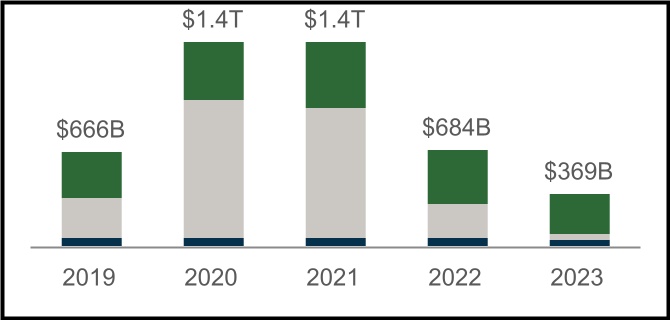
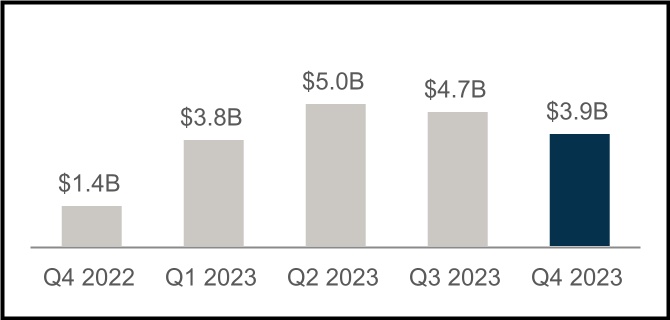
| • | $17.4 billion annual net income and $3.9 billion fourth quarter 2023 net income, with net worth reaching $77.7 billion as of December 31, 2023 | “The fourth quarter capped another successful year. Fannie Mae reported $3.9 billion in net income, marking our twenty-fourth consecutive quarter of positive earnings. In 2023, we delivered $17.4 billion in earnings and continued to rebuild our capital and further strengthen our financial stability. It was a challenging year for housing, with higher mortgage rates, limited homes for sale, and high home prices weighing on affordability. Against this backdrop, we provided $369 billion in liquidity, helping 1.5 million households buy, refinance, or rent a home. As we close on our 85th year supporting America’s housing system, we remain committed to effectively managing risks and being a reliable source of mortgage credit for America’s homeowners and renters.” Priscilla Almodovar Chief Executive Officer | |||||||||
| • | Net income increased $4.5 billion in 2023 compared with 2022, primarily driven by a $7.9 billion shift to a benefit for credit losses in 2023 from provision for credit losses in 2022 | ||||||||||
| • | $369 billion in liquidity provided in 2023, which enabled the financing of approximately 1.5 million home purchases, refinancings, and rental units | ||||||||||
| • | Acquired approximately 805,000 single-family purchase loans, of which more than 45% were for first-time homebuyers, and approximately 179,000 single-family refinance loans during 2023 | ||||||||||
| • | Financed approximately 482,000 units of multifamily rental housing in 2023; a significant majority were affordable to households earning at or below 120% of area median income, providing support for both workforce and affordable housing | ||||||||||
| • | Home prices grew 7.1% on a national basis in 2023 according to the Fannie Mae Home Price Index | ||||||||||
| • | The U.S. weekly average 30-year fixed-rate mortgage rate increased from 6.42% as of the end of 2022 to 6.61% as of the end of 2023 | ||||||||||
| Q4 and Full Year 2023 Key Results | |||||||||||||||||||||||||||||||||||
| $77.7 Billion Net Worth | $369 Billion Supporting Housing Activity | ||||||||||||||||||||||||||||||||||
| Increase of $17.4 billion in 2023 | SF Home Purchases | SF Refinancings | MF Rental Units | ||||||||||||||||||||||||||||||||
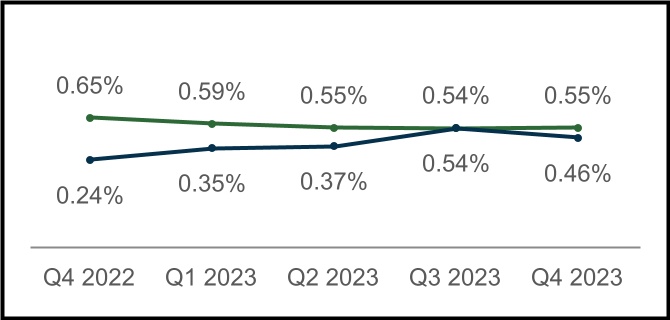
| $3.9 Billion Net Income for Q4 2023 | Serious Delinquency Rates | |||||||||||||||||||
| Decrease of $756 million compared with third quarter 2023 | Single-Family SDQ Rate | Multifamily SDQ Rate | ||||||||||||||||||

| Fourth Quarter and Full Year 2023 Results | 1 | |||||||
| Summary of Financial Results | ||||||||||||||||||||||||||||||||||||||||||||||||||
| (Dollars in millions) | 2023 | 2022 | Variance | % Change | Q423 | Q323 | Variance | % Change | ||||||||||||||||||||||||||||||||||||||||||
| Net interest income | $ | 28,773 | $ | 29,423 | $ | (650) | (2) | % | $ | 7,732 | $ | 7,220 | $ | 512 | 7 | % | ||||||||||||||||||||||||||||||||||
| Fee and other income | 275 | 312 | (37) | (12) | % | 66 | 76 | (10) | (13) | % | ||||||||||||||||||||||||||||||||||||||||
| Net revenues | 29,048 | 29,735 | (687) | (2) | % | 7,798 | 7,296 | 502 | 7 | % | ||||||||||||||||||||||||||||||||||||||||
| Investment gains (losses), net | (53) | (297) | 244 | 82 | % | (19) | 8 | (27) | NM | |||||||||||||||||||||||||||||||||||||||||
| Fair value gains (losses), net | 1,304 | 1,284 | 20 | 2 | % | (99) | 795 | (894) | NM | |||||||||||||||||||||||||||||||||||||||||
| Administrative expenses | (3,604) | (3,329) | (275) | (8) | % | (975) | (897) | (78) | (9) | % | ||||||||||||||||||||||||||||||||||||||||
| Benefit (provision) for credit losses | 1,670 | (6,277) | 7,947 | NM | (116) | 652 | (768) | NM | ||||||||||||||||||||||||||||||||||||||||||
| TCCA fees | (3,431) | (3,369) | (62) | (2) | % | (860) | (860) | — | — | % | ||||||||||||||||||||||||||||||||||||||||
Credit enhancement expense(1) | (1,512) | (1,323) | (189) | (14) | % | (397) | (390) | (7) | (2) | % | ||||||||||||||||||||||||||||||||||||||||
| Change in expected credit enhancement recoveries | (193) | 727 | (920) | NM | (25) | (128) | 103 | 80 | % | |||||||||||||||||||||||||||||||||||||||||
Other expenses, net(2) | (1,273) | (918) | (355) | (39) | % | (351) | (535) | 184 | 34 | % | ||||||||||||||||||||||||||||||||||||||||
| Income before federal income taxes | 21,956 | 16,233 | 5,723 | 35 | % | 4,956 | 5,941 | (985) | (17) | % | ||||||||||||||||||||||||||||||||||||||||
| Provision for federal income taxes | (4,548) | (3,310) | (1,238) | (37) | % | (1,013) | (1,242) | 229 | 18 | % | ||||||||||||||||||||||||||||||||||||||||
| Net income | $ | 17,408 | $ | 12,923 | $ | 4,485 | 35 | % | $ | 3,943 | $ | 4,699 | $ | (756) | (16) | % | ||||||||||||||||||||||||||||||||||
| 4,681 | ||||||||||||||||||||||||||||||||||||||||||||||||||
| Total comprehensive income | $ | 17,405 | $ | 12,920 | $ | 4,485 | 35 | % | $ | 3,957 | $ | 4,681 | $ | (724) | (15) | % | ||||||||||||||||||||||||||||||||||
| Net worth | $ | 77,682 | $ | 60,277 | $ | 17,405 | 29 | % | $ | 77,682 | $ | 73,725 | $ | 3,957 | 5 | % | ||||||||||||||||||||||||||||||||||
| NM - Not meaningful | ||||||||||||||||||||||||||||||||||||||||||||||||||
(1) Consists of costs associated with freestanding credit enhancements, which primarily include the company’s Connecticut Avenue Securities® and Credit Insurance Risk TransferTM programs, enterprise-paid mortgage insurance, and certain lender risk-sharing programs. | ||||||||||||||||||||||||||||||||||||||||||||||||||
(2) Consists of debt extinguishment gains and losses, expenses associated with legal claims, foreclosed property income (expense), gains and losses from partnership investments, housing trust fund expenses, loan subservicing costs, and servicer fees paid in connection with certain loss mitigation activities. | ||||||||||||||||||||||||||||||||||||||||||||||||||
| Financial Highlights | |||||||||||
| Net income increased $4.5 billion in 2023 compared with 2022, primarily driven by a $7.9 billion shift to a benefit for credit losses in 2023 from provision for credit losses in 2022. | |||||||||||
| • | Net interest income remained strong in 2023 primarily driven by guaranty fee income. While the company’s base guaranty fee income grew slightly in 2023, higher interest rates during the year drove a decline in deferred guaranty fee income due to lower refinance activity. This was offset by an increase in income due to higher yields on securities in the company’s corporate liquidity portfolio. | ||||||||||
| • | Benefit for credit losses was $1.7 billion in 2023, compared with a provision of $6.3 billion in 2022. The benefit for credit losses in 2023 reflects a $2.2 billion single-family benefit for credit losses, partially offset by a $495 million multifamily provision for credit losses. The $6.3 billion provision for credit losses in 2022 reflected a $5.0 billion single-family provision for credit losses and a $1.2 billion multifamily provision for credit losses. • The single-family benefit for credit losses in 2023 was primarily driven by a benefit from actual and forecasted home price growth, partially offset by a provision driven by the overall credit risk profile of the company’s newly acquired single-family loans and a provision relating to the redesignation of certain single-family loans from held for investment to held for sale. • The multifamily provision for credit losses in 2023 was primarily driven by changes in loan activity and declining property values on the company’s overall multifamily guaranty book. The company’s seniors housing loans were not a driver of its multifamily provision for credit losses in 2023; however, the company’s allowance for seniors housing loans remained elevated as of December 31, 2023. | ||||||||||
| • | |||||||||||
| Fourth Quarter and Full Year 2023 Results | 2 | |||||||
| Single-Family Business Financial Results | ||||||||||||||||||||||||||||||||||||||||||||||||||||||||
| (Dollars in millions) | 2023 | 2022 | Variance | % Change | Q423 | Q323 | Variance | % Change | ||||||||||||||||||||||||||||||||||||||||||||||||
| Net interest income | $ | 24,229 | $ | 24,736 | $ | (507) | (2) | % | $ | 6,566 | $ | 6,074 | $ | 492 | 8 | % | ||||||||||||||||||||||||||||||||||||||||
| Fee and other income | 205 | 224 | (19) | (8) | % | 49 | 56 | (7) | (13) | % | ||||||||||||||||||||||||||||||||||||||||||||||
| Net revenues | 24,434 | 24,960 | (526) | (2) | % | 6,615 | 6,130 | 485 | 8 | % | ||||||||||||||||||||||||||||||||||||||||||||||
| Investment gains (losses), net | (41) | (223) | 182 | 82 | % | (6) | 9 | (15) | NM | |||||||||||||||||||||||||||||||||||||||||||||||
| Fair value gains (losses), net | 1,231 | 1,364 | (133) | (10) | % | (137) | 742 | (879) | NM | |||||||||||||||||||||||||||||||||||||||||||||||
| Administrative expenses | (2,993) | (2,789) | (204) | (7) | % | (810) | (745) | (65) | (9) | % | ||||||||||||||||||||||||||||||||||||||||||||||
| Benefit (provision) for credit losses | 2,165 | (5,029) | 7,194 | NM | (36) | 736 | (772) | NM | ||||||||||||||||||||||||||||||||||||||||||||||||
| TCCA fees | (3,431) | (3,369) | (62) | (2) | % | (860) | (860) | — | — | % | ||||||||||||||||||||||||||||||||||||||||||||||
| Credit enhancement expense | (1,281) | (1,062) | (219) | (21) | % | (332) | (335) | 3 | 1 | % | ||||||||||||||||||||||||||||||||||||||||||||||
| Change in expected credit enhancement recoveries | (310) | 470 | (780) | NM | (12) | (170) | 158 | 93 | % | |||||||||||||||||||||||||||||||||||||||||||||||
| Other expenses, net | (984) | (778) | (206) | (26) | % | (254) | (411) | 157 | 38 | % | ||||||||||||||||||||||||||||||||||||||||||||||
| Income before federal income taxes | 18,790 | 13,544 | 5,246 | 39 | % | 4,168 | 5,096 | (928) | (18) | % | ||||||||||||||||||||||||||||||||||||||||||||||
| Provision for federal income taxes | (3,935) | (2,774) | (1,161) | (42) | % | (864) | (1,071) | 207 | 19 | % | ||||||||||||||||||||||||||||||||||||||||||||||
| Net income | $ | 14,855 | $ | 10,770 | $ | 4,085 | 38 | % | $ | 3,304 | $ | 4,025 | $ | (721) | (18) | % | ||||||||||||||||||||||||||||||||||||||||
| Average charged guaranty fee on new conventional acquisitions, net of TCCA fees | 53.2 bps | 49.4 bps | 3.8 bps | 8 | % | 54.3 bps | 54.3 bps | — bps | — | % | ||||||||||||||||||||||||||||||||||||||||||||||
| Average charged guaranty fee on conventional guaranty book of business, net of TCCA fees | 46.9 bps | 46.2 bps | 0.7 bps | 2 | % | 47.2 bps | 47.0 bps | 0.2 bps | — | %* | ||||||||||||||||||||||||||||||||||||||||||||||
| NM - Not meaningful | ||||||||||||||||||||||||||||||||||||||||||||||||||||||||
| * Represents less than 0.5% | ||||||||||||||||||||||||||||||||||||||||||||||||||||||||
| Key Business Highlights | ||||||||
| • | Single-family conventional acquisition volume was $316.0 billion in 2023, compared with $614.8 billion in 2022. Purchase acquisition volume, of which more than 45% was for first-time homebuyers, decreased to $272.8 billion in 2023 from $378.0 billion in 2022. Refinance acquisition volume was $43.2 billion in 2023, a decrease from $236.9 billion in 2022. | |||||||
| • | The average single-family conventional guaranty book of business increased by 1.4% to $3.6 trillion in 2023 compared with 2022, driven by an increase in the average loan size of the book. The overall credit characteristics of the single-family conventional guaranty book of business remained strong, with a weighted-average mark-to-market loan-to-value ratio of 51% and a weighted-average FICO credit score at origination of 753 as of December 31, 2023. | |||||||
| • | The average charged guaranty fee, net of TCCA fees, on the single-family conventional guaranty book increased by 0.7 basis points to 46.9 basis points in 2023, primarily as a result of higher base guaranty fees charged on new acquisitions. The average charged guaranty fee on newly acquired single-family conventional loans, net of TCCA fees, increased by 3.8 basis points to 53.2 basis points in 2023. | |||||||
| • | The single-family serious delinquency rate decreased to 0.55% as of December 31, 2023 from 0.65% as of December 31, 2022. Single-family seriously delinquent loans are loans that are 90 days or more past due or in the foreclosure process. | |||||||
| Fourth Quarter and Full Year 2023 Results | 3 | |||||||
| Multifamily Business Financial Results | ||||||||||||||||||||||||||||||||||||||||||||||||||||||||
| (Dollars in millions) | 2023 | 2022 | Variance | % Change | Q423 | Q323 | Variance | % Change | ||||||||||||||||||||||||||||||||||||||||||||||||
| Net interest income | $ | 4,544 | $ | 4,687 | $ | (143) | (3) | % | $ | 1,166 | $ | 1,146 | $ | 20 | 2 | % | ||||||||||||||||||||||||||||||||||||||||
| Fee and other income | 70 | 88 | (18) | (20) | % | 17 | 20 | (3) | (15) | % | ||||||||||||||||||||||||||||||||||||||||||||||
| Net revenues | 4,614 | 4,775 | (161) | (3) | % | 1,183 | 1,166 | 17 | 1 | % | ||||||||||||||||||||||||||||||||||||||||||||||
| Fair value gains (losses), net | 73 | (80) | 153 | NM | 38 | 53 | (15) | (28) | % | |||||||||||||||||||||||||||||||||||||||||||||||
| Administrative expenses | (611) | (540) | (71) | (13) | % | (165) | (152) | (13) | (9) | % | ||||||||||||||||||||||||||||||||||||||||||||||
| Provision for credit losses | (495) | (1,248) | 753 | 60 | % | (80) | (84) | 4 | 5 | % | ||||||||||||||||||||||||||||||||||||||||||||||
| Credit enhancement expense | (231) | (261) | 30 | 11 | % | (65) | (55) | (10) | (18) | % | ||||||||||||||||||||||||||||||||||||||||||||||
| Change in expected credit enhancement recoveries | 117 | 257 | (140) | (54) | % | (13) | 42 | (55) | NM | |||||||||||||||||||||||||||||||||||||||||||||||
| Other expenses, net* | (301) | (214) | (87) | (41) | % | (110) | (125) | 15 | 12 | % | ||||||||||||||||||||||||||||||||||||||||||||||
| Income before federal income taxes | 3,166 | 2,689 | 477 | 18 | % | 788 | 845 | (57) | (7) | % | ||||||||||||||||||||||||||||||||||||||||||||||
| Provision for federal income taxes | (613) | (536) | (77) | (14) | % | (149) | (171) | 22 | 13 | % | ||||||||||||||||||||||||||||||||||||||||||||||
| Net income | $ | 2,553 | $ | 2,153 | $ | 400 | 19 | % | $ | 639 | $ | 674 | $ | (35) | (5) | % | ||||||||||||||||||||||||||||||||||||||||
| Average charged guaranty fee rate on multifamily guaranty book of business, at period end | 76.1 bps | 78.5 bps | (2.4) bps | (3) | % | 76.1 bps | 76.8 bps | (0.7) bps | (1) | % | ||||||||||||||||||||||||||||||||||||||||||||||
| NM - Not meaningful | ||||||||||||||||||||||||||||||||||||||||||||||||||||||||
| * Includes investment gains or losses and other income or expenses. | ||||||||||||||||||||||||||||||||||||||||||||||||||||||||
| Key Business Highlights | ||||||||
| • | New multifamily business volume was $52.9 billion in 2023, compared with $69.2 billion in 2022. | |||||||
| • | The multifamily guaranty book of business grew by 7% in 2023 to $470.4 billion driven by the company’s acquisitions combined with low prepayment volumes due to the high interest rate environment. | |||||||
| • | The average charged guaranty fee on the multifamily guaranty book declined by 2.4 basis points to 76.1 basis points in 2023, primarily due to lower average charged fees on the company’s 2023 acquisitions as compared with the existing loans in the multifamily guaranty book of business. | |||||||
| • | The multifamily serious delinquency rate increased to 0.46% as of December 31, 2023, compared with 0.24% as of December 31, 2022, primarily driven by stress in the company’s seniors housing loans. Multifamily seriously delinquent loans are loans that are 60 days or more past due. | |||||||
| • | Fannie Mae is subject to an annual multifamily loan purchase cap set by FHFA. For 2024, FHFA reduced the multifamily volume cap to $70 billion from the $75 billion cap applicable for 2023. Consistent with the 2023 cap, a minimum of 50% of the company’s 2024 multifamily loan purchases must be mission-driven, focused on specified affordable and underserved market segments. For 2024, FHFA has exempted from the volume cap loans financing workforce housing properties meeting specified criteria that preserve long-term affordability for the properties. The company’s 2023 multifamily business volume remained below the applicable cap and it met the mission requirements established by FHFA. | |||||||
| Fourth Quarter and Full Year 2023 Results | 4 | |||||||
| Additional Matters | ||
Fannie Mae’s Consolidated Balance Sheets and Consolidated Statements of Operations and Comprehensive Income for the full year of 2023 are available in the accompanying Annex; however, investors and interested parties should read the company’s annual report on Form 10-K for the year ended December 31, 2023 (“2023 Form 10-K”), which was filed today with the Securities and Exchange Commission and is available on Fannie Mae’s website, www.fanniemae.com. The company provides further discussion of its financial results and condition, credit performance, and other matters in its 2023 Form 10-K. Additional information about the company’s financial and credit performance is contained in Fannie Mae’s “Q4 and Full Year 2023 Financial Supplement” at www.fanniemae.com.
# # #
Fannie Mae provides website addresses in its news releases solely for readers’ information. Other content or information appearing on these websites is not part of this release.
Fannie Mae advances equitable and sustainable access to homeownership and quality, affordable rental housing for millions of people across America. We enable the 30-year fixed-rate mortgage and drive responsible innovation to make homebuying and renting easier, fairer, and more accessible. To learn more, visit fanniemae.com.
| Fourth Quarter and Full Year 2023 Results | 5 | |||||||
ANNEX
FANNIE MAE
(In conservatorship)
Consolidated Balance Sheets
(Dollars in millions)
| As of December 31, | |||||||||||||||||||||||
| 2023 | 2022 | ||||||||||||||||||||||
| ASSETS | |||||||||||||||||||||||
| Cash and cash equivalents | $ | 35,817 | $ | 57,987 | |||||||||||||||||||
| Restricted cash and cash equivalents (includes $25,836 and $23,348, respectively, related to consolidated trusts) | 32,889 | 29,854 | |||||||||||||||||||||
| Securities purchased under agreements to resell (includes $0 and $3,475, respectively, related to consolidated trusts) | 30,700 | 14,565 | |||||||||||||||||||||
| Investments in securities, at fair value | 53,116 | 50,825 | |||||||||||||||||||||
| Mortgage loans: | |||||||||||||||||||||||
| Loans held for sale, at lower of cost or fair value | 2,149 | 2,033 | |||||||||||||||||||||
| Loans held for investment, at amortized cost: | |||||||||||||||||||||||
| Of Fannie Mae | 48,199 | 52,081 | |||||||||||||||||||||
| Of consolidated trusts | 4,094,013 | 4,071,669 | |||||||||||||||||||||
| Total loans held for investment (includes $3,315 and $3,645, respectively, at fair value) | 4,142,212 | 4,123,750 | |||||||||||||||||||||
| Allowance for loan losses | (8,730) | (11,347) | |||||||||||||||||||||
| Total loans held for investment, net of allowance | 4,133,482 | 4,112,403 | |||||||||||||||||||||
| Total mortgage loans | 4,135,631 | 4,114,436 | |||||||||||||||||||||
| Advances to lenders | 1,389 | 1,502 | |||||||||||||||||||||
| Deferred tax assets, net | 11,681 | 12,911 | |||||||||||||||||||||
| Accrued interest receivable, net (includes $10,132 and $9,241 related to consolidated trusts and net of allowance of $25 and $111, respectively) | 10,724 | 9,821 | |||||||||||||||||||||
| Other assets | 13,490 | 13,387 | |||||||||||||||||||||
| Total assets | $ | 4,325,437 | $ | 4,305,288 | |||||||||||||||||||
| LIABILITIES AND EQUITY | |||||||||||||||||||||||
| Liabilities: | |||||||||||||||||||||||
| Accrued interest payable (includes $10,212 and $9,347, respectively, related to consolidated trusts) | $ | 10,931 | $ | 9,917 | |||||||||||||||||||
| Debt: | |||||||||||||||||||||||
| Of Fannie Mae (includes $761 and $1,161, respectively, at fair value) | 124,065 | 134,168 | |||||||||||||||||||||
| Of consolidated trusts (includes $14,343 and $16,260, respectively, at fair value) | 4,098,653 | 4,087,720 | |||||||||||||||||||||
| Other liabilities (includes $1,713 and $1,748, respectively, related to consolidated trusts) | 14,106 | 13,206 | |||||||||||||||||||||
| Total liabilities | 4,247,755 | 4,245,011 | |||||||||||||||||||||
| Commitments and contingencies (Note 17) | — | — | |||||||||||||||||||||
| Fannie Mae stockholders’ equity: | |||||||||||||||||||||||
| Senior preferred stock (liquidation preference of $195,224 and $180,339, respectively) | 120,836 | 120,836 | |||||||||||||||||||||
| Preferred stock, 700,000,000 shares are authorized—555,374,922 shares issued and outstanding | 19,130 | 19,130 | |||||||||||||||||||||
| Common stock, no par value, no maximum authorization—1,308,762,703 shares issued and 1,158,087,567 shares outstanding | 687 | 687 | |||||||||||||||||||||
| Accumulated deficit | (55,603) | (73,011) | |||||||||||||||||||||
| Accumulated other comprehensive income | 32 | 35 | |||||||||||||||||||||
| Treasury stock, at cost, 150,675,136 shares | (7,400) | (7,400) | |||||||||||||||||||||
| Total stockholders’ equity (See Note 2: Senior Preferred Stock Purchase Agreement, Senior Preferred Stock and Warrant for information on the related dividend obligation and liquidation preference) | 77,682 | 60,277 | |||||||||||||||||||||
| Total liabilities and equity | $ | 4,325,437 | $ | 4,305,288 | |||||||||||||||||||
See Notes to Consolidated Financial Statements in the 2023 Form 10-K
| Fourth Quarter and Full Year 2023 Results | 6 | |||||||
FANNIE MAE
(In conservatorship)
Consolidated Statements of Operations and Comprehensive Income
(Dollars in millions, except per share amounts)
| For the Year Ended December 31, | |||||||||||||||||||||||||||||||||||||||||||||||
| 2023 | 2022 | 2021 | |||||||||||||||||||||||||||||||||||||||||||||
| Interest income: | |||||||||||||||||||||||||||||||||||||||||||||||
| Investments in securities | $ | 4,158 | $ | 1,828 | $ | 582 | |||||||||||||||||||||||||||||||||||||||||
| Mortgage loans | 133,234 | 117,813 | 98,930 | ||||||||||||||||||||||||||||||||||||||||||||
| Other | 2,322 | 656 | 163 | ||||||||||||||||||||||||||||||||||||||||||||
| Total interest income | 139,714 | 120,297 | 99,675 | ||||||||||||||||||||||||||||||||||||||||||||
| Interest expense: | |||||||||||||||||||||||||||||||||||||||||||||||
| Short-term debt | (672) | (76) | (4) | ||||||||||||||||||||||||||||||||||||||||||||
| Long-term debt | (110,269) | (90,798) | (70,084) | ||||||||||||||||||||||||||||||||||||||||||||
| Total interest expense | (110,941) | (90,874) | (70,088) | ||||||||||||||||||||||||||||||||||||||||||||
| Net interest income | 28,773 | 29,423 | 29,587 | ||||||||||||||||||||||||||||||||||||||||||||
| Benefit (provision) for credit losses | 1,670 | (6,277) | 5,130 | ||||||||||||||||||||||||||||||||||||||||||||
| Net interest income after benefit (provision) for credit losses | 30,443 | 23,146 | 34,717 | ||||||||||||||||||||||||||||||||||||||||||||
| Investment gains (losses), net | (53) | (297) | 1,352 | ||||||||||||||||||||||||||||||||||||||||||||
| Fair value gains, net | 1,304 | 1,284 | 155 | ||||||||||||||||||||||||||||||||||||||||||||
| Fee and other income | 275 | 312 | 361 | ||||||||||||||||||||||||||||||||||||||||||||
| Non-interest income | 1,526 | 1,299 | 1,868 | ||||||||||||||||||||||||||||||||||||||||||||
| Administrative expenses: | |||||||||||||||||||||||||||||||||||||||||||||||
| Salaries and employee benefits | (1,906) | (1,671) | (1,493) | ||||||||||||||||||||||||||||||||||||||||||||
| Professional services | (850) | (850) | (817) | ||||||||||||||||||||||||||||||||||||||||||||
| Other administrative expenses | (848) | (808) | (755) | ||||||||||||||||||||||||||||||||||||||||||||
| Total administrative expenses | (3,604) | (3,329) | (3,065) | ||||||||||||||||||||||||||||||||||||||||||||
| TCCA fees | (3,431) | (3,369) | (3,071) | ||||||||||||||||||||||||||||||||||||||||||||
| Credit enhancement expense | (1,512) | (1,323) | (1,051) | ||||||||||||||||||||||||||||||||||||||||||||
| Change in expected credit enhancement recoveries | (193) | 727 | (194) | ||||||||||||||||||||||||||||||||||||||||||||
| Other expenses, net | (1,273) | (918) | (1,255) | ||||||||||||||||||||||||||||||||||||||||||||
| Total expenses | (10,013) | (8,212) | (8,636) | ||||||||||||||||||||||||||||||||||||||||||||
| Income before federal income taxes | 21,956 | 16,233 | 27,949 | ||||||||||||||||||||||||||||||||||||||||||||
| Provision for federal income taxes | (4,548) | (3,310) | (5,773) | ||||||||||||||||||||||||||||||||||||||||||||
| Net income | 17,408 | 12,923 | 22,176 | ||||||||||||||||||||||||||||||||||||||||||||
| Other comprehensive loss | (3) | (3) | (78) | ||||||||||||||||||||||||||||||||||||||||||||
| Total comprehensive income | $ | 17,405 | $ | 12,920 | $ | 22,098 | |||||||||||||||||||||||||||||||||||||||||
| Net income | $ | 17,408 | $ | 12,923 | $ | 22,176 | |||||||||||||||||||||||||||||||||||||||||
| Dividends distributed or amounts attributable to senior preferred stock | (17,405) | (12,920) | (22,098) | ||||||||||||||||||||||||||||||||||||||||||||
| Net income attributable to common stockholders | $ | 3 | $ | 3 | $ | 78 | |||||||||||||||||||||||||||||||||||||||||
| Earnings per share: | |||||||||||||||||||||||||||||||||||||||||||||||
| Basic | $ | 0.00 | $ | 0.00 | $ | 0.01 | |||||||||||||||||||||||||||||||||||||||||
| Diluted | 0.00 | 0.00 | 0.01 | ||||||||||||||||||||||||||||||||||||||||||||
| Weighted-average common shares outstanding: | |||||||||||||||||||||||||||||||||||||||||||||||
| Basic | 5,867 | 5,867 | 5,867 | ||||||||||||||||||||||||||||||||||||||||||||
| Diluted | 5,893 | 5,893 | 5,893 | ||||||||||||||||||||||||||||||||||||||||||||
See Notes to Consolidated Financial Statements in the 2023 Form 10-K
| Fourth Quarter and Full Year 2023 Results | 7 | |||||||