Federal National Mortgage Association (FNMA)
Filed: 14 Feb 25, 6:47am

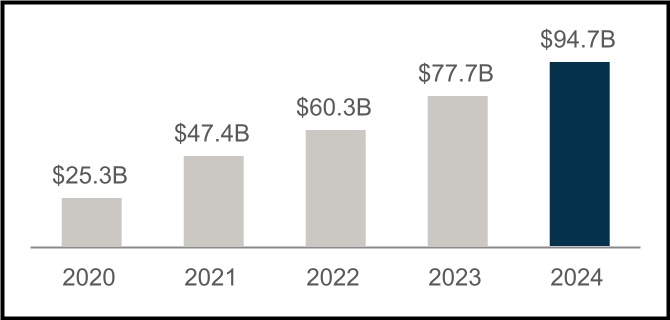
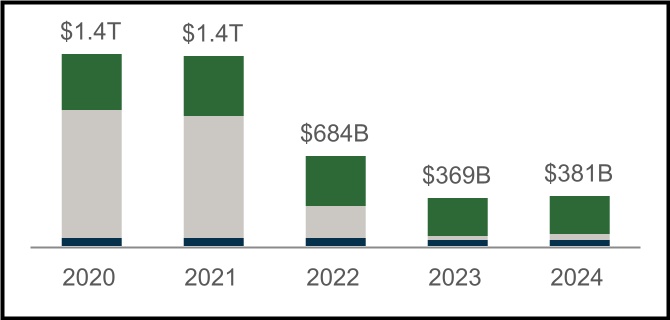
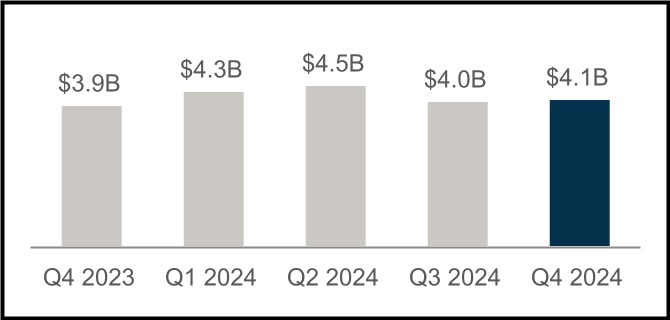
| • | $17.0 billion annual net income and $4.1 billion fourth quarter 2024 net income, with net worth reaching $94.7 billion as of December 31, 2024 | “Fannie Mae concluded the year with a strong quarter, generating net income of $4.1 billion, and $17.0 billion for the year. In 2024, we grew our net worth to nearly $95 billion, continued to build our regulatory capital, and carried out our mission. Our strong results were driven by guaranty fee income, consistent with the transformation of our business model that began well over a decade ago. For the year, we provided $381 billion in liquidity to the U.S. housing market, helping 1.4 million households buy, refinance, or rent a home.” Priscilla Almodovar President and Chief Executive Officer | |||||||||
| • | $381 billion in liquidity provided in 2024, which enabled the financing of approximately 1.4 million home purchases, refinancings, and rental units | ||||||||||
| • | Acquired approximately 778,000 single-family purchase loans, of which approximately half were for first-time homebuyers, and approximately 204,000 single-family refinance loans during 2024 | ||||||||||
| • | Financed approximately 420,000 units of multifamily rental housing in 2024; a significant majority were affordable to households earning at or below 120% of area median income, providing support for both workforce and affordable housing | ||||||||||
| • | Home prices grew 5.8% on a national basis in 2024 according to the Fannie Mae Home Price Index | ||||||||||
| • | The U.S. weekly average 30-year fixed-rate mortgage rate increased from 6.61% as of the end of 2023 to 6.85% as of the end of 2024 | ||||||||||
| Q4 and Full Year 2024 Key Results | |||||||||||||||||||||||||||||||||||
| $94.7 Billion Net Worth | $381 Billion Supporting Housing Activity | ||||||||||||||||||||||||||||||||||
| Increase of $17.0 billion in 2024 | SF Home Purchases | SF Refinancings | MF Rental Units | ||||||||||||||||||||||||||||||||
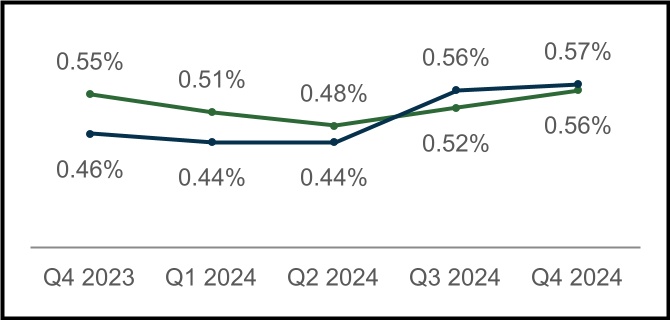
| $4.1 Billion Net Income for Q4 2024 | Serious Delinquency Rates | |||||||||||||||||||
| Increase of $86 million compared with third quarter 2024 | Single-Family SDQ Rate | Multifamily SDQ Rate | ||||||||||||||||||

| Fourth Quarter and Full Year 2024 Results | 1 | |||||||
| Summary of Financial Results | ||||||||||||||||||||||||||||||||||||||||||||||||||
| (Dollars in millions) | 2024 | 2023 | Variance | % Change | Q424 | Q324 | Variance | % Change | ||||||||||||||||||||||||||||||||||||||||||
| Net interest income | $ | 28,748 | $ | 28,773 | $ | (25) | — | %* | $ | 7,182 | $ | 7,275 | $ | (93) | (1) | % | ||||||||||||||||||||||||||||||||||
| Fee and other income | 321 | 275 | 46 | 17 | % | 115 | 66 | 49 | 74 | % | ||||||||||||||||||||||||||||||||||||||||
| Net revenues | 29,069 | 29,048 | 21 | — | %* | 7,297 | 7,341 | (44) | (1) | % | ||||||||||||||||||||||||||||||||||||||||
| Benefit (provision) for credit losses | 186 | 1,670 | (1,484) | (89) | % | (321) | 27 | (348) | NM | |||||||||||||||||||||||||||||||||||||||||
| Fair value gains (losses), net | 1,821 | 1,304 | 517 | 40 | % | 842 | 52 | 790 | NM | |||||||||||||||||||||||||||||||||||||||||
| Investment gains (losses), net | (38) | (53) | 15 | 28 | % | (10) | 12 | (22) | NM | |||||||||||||||||||||||||||||||||||||||||
| Non-interest expense: | ||||||||||||||||||||||||||||||||||||||||||||||||||
Administrative expenses(1) | (3,619) | (3,445) | (174) | (5) | % | (947) | (884) | (63) | (7) | % | ||||||||||||||||||||||||||||||||||||||||
Legislative assessments(2) | (3,766) | (3,745) | (21) | (1) | % | (949) | (948) | (1) | — | %* | ||||||||||||||||||||||||||||||||||||||||
Credit enhancement expense(3) | (1,641) | (1,512) | (129) | (9) | % | (406) | (411) | 5 | 1 | % | ||||||||||||||||||||||||||||||||||||||||
| Change in expected credit enhancement recoveries | 194 | (193) | 387 | NM | 5 | 89 | (84) | (94) | % | |||||||||||||||||||||||||||||||||||||||||
Other expenses, net(4) | (937) | (1,118) | 181 | 16 | % | (332) | (225) | (107) | (48) | % | ||||||||||||||||||||||||||||||||||||||||
| Total non-interest expense | (9,769) | (10,013) | 244 | 2 | % | (2,629) | (2,379) | (250) | (11) | % | ||||||||||||||||||||||||||||||||||||||||
| Income before federal income taxes | 21,269 | 21,956 | (687) | (3) | % | 5,179 | 5,053 | 126 | 2 | % | ||||||||||||||||||||||||||||||||||||||||
| Provision for federal income taxes | (4,291) | (4,548) | 257 | 6 | % | (1,049) | (1,009) | (40) | (4) | % | ||||||||||||||||||||||||||||||||||||||||
| Net income | $ | 16,978 | $ | 17,408 | $ | (430) | (2) | % | $ | 4,130 | $ | 4,044 | $ | 86 | 2 | % | ||||||||||||||||||||||||||||||||||
| 4,047 | ||||||||||||||||||||||||||||||||||||||||||||||||||
| Total comprehensive income | $ | 16,975 | $ | 17,405 | $ | (430) | (2) | % | $ | 4,127 | $ | 4,047 | $ | 80 | 2 | % | ||||||||||||||||||||||||||||||||||
| Net worth | $ | 94,657 | $ | 77,682 | $ | 16,975 | 22 | % | $ | 94,657 | $ | 90,530 | $ | 4,127 | 5 | % | ||||||||||||||||||||||||||||||||||
| NM - Not meaningful | ||||||||||||||||||||||||||||||||||||||||||||||||||
| * Represents less than 0.5% | ||||||||||||||||||||||||||||||||||||||||||||||||||
(1) Consists of (1) salaries and employee benefits, and (2) professional services, technology and occupancy expenses. | ||||||||||||||||||||||||||||||||||||||||||||||||||
(2) Consists of TCCA fees, affordable housing allocations and FHFA assessments. | ||||||||||||||||||||||||||||||||||||||||||||||||||
(3) Consists of costs associated with freestanding credit enhancements, which primarily include the company’s Connecticut Avenue Securities® (“CAS”) and Credit Insurance Risk TransferTM programs, enterprise-paid mortgage insurance, and certain lender risk-sharing programs. | ||||||||||||||||||||||||||||||||||||||||||||||||||
(4) Consists of debt extinguishment gains and losses, expenses associated with legal claims, foreclosed property income (expense), gains and losses from partnership investments, loan subservicing costs, and servicer fees paid in connection with certain loss mitigation activities. | ||||||||||||||||||||||||||||||||||||||||||||||||||
| Key Highlights | |||||||||||
| • | Net income of $17.0 billion for 2024 driven by strong revenues, bringing the company’s net worth to $94.7 billion as of December 31, 2024. •$29.1 billion of revenues for 2024 primarily driven by guaranty fees on the company’s $4.1 trillion guaranty book of business: •$24.4 billion of single-family revenues generated from a $3.6 trillion conventional guaranty book with an average charged guaranty fee of 47.6 basis points. 77% of the underlying mortgages in the single-family guaranty book were below a 5% interest rate. •$4.7 billion of multifamily revenues generated from a $499.7 billion guaranty book with an average charged guaranty fee of 74.4 basis points. | ||||||||||
| • | Key credit characteristics of the company’s guaranty book of business as of December 31, 2024: •Single-family conventional guaranty book had a weighted-average mark-to-market loan-to-value ratio of 50%, a weighted-average FICO credit score at origination of 753, and a serious delinquency rate of 0.56%. •Multifamily guaranty book had a weighted-average origination loan-to-value ratio of 63%, a weighted-average debt service coverage ratio of 2.0, and a serious delinquency rate of 0.57%. | ||||||||||
| • | Credit enhancements as of December 31, 2024: •46% of the company’s single-family guaranty book was covered by one or more forms of credit enhancement, including 21% covered by mortgage insurance, which generally has a first loss position. •Approximately 99% of the company’s multifamily guaranty book was subject to lender loss-sharing agreements, and 31% was covered by a multifamily credit risk transfer transaction. | ||||||||||
| Fourth Quarter and Full Year 2024 Results | 2 | |||||||
| Single-Family Business Financial Results | ||||||||||||||||||||||||||||||||||||||||||||||||||||||||
| (Dollars in millions) | 2024 | 2023 | Variance | % Change | Q424 | Q324 | Variance | % Change | ||||||||||||||||||||||||||||||||||||||||||||||||
| Net interest income | $ | 24,130 | $ | 24,229 | $ | (99) | — | %* | $ | 6,029 | $ | 6,131 | $ | (102) | (2) | % | ||||||||||||||||||||||||||||||||||||||||
| Fee and other income | 245 | 205 | 40 | 20 | % | 91 | 48 | 43 | 90 | % | ||||||||||||||||||||||||||||||||||||||||||||||
| Net revenues | 24,375 | 24,434 | (59) | — | %* | 6,120 | 6,179 | (59) | (1) | % | ||||||||||||||||||||||||||||||||||||||||||||||
| Benefit (provision) for credit losses | 938 | 2,165 | (1,227) | (57) | % | (396) | 451 | (847) | NM | |||||||||||||||||||||||||||||||||||||||||||||||
| Fair value gains (losses), net | 1,745 | 1,231 | 514 | 42 | % | 815 | (8) | 823 | NM | |||||||||||||||||||||||||||||||||||||||||||||||
| Investment gains (losses), net | (53) | (41) | (12) | (29) | % | (5) | 9 | (14) | NM | |||||||||||||||||||||||||||||||||||||||||||||||
| Non-interest expense: | ||||||||||||||||||||||||||||||||||||||||||||||||||||||||
| Administrative expenses | (3,000) | (2,858) | (142) | (5) | % | (776) | (732) | (44) | (6) | % | ||||||||||||||||||||||||||||||||||||||||||||||
| Legislative assessments | (3,719) | (3,699) | (20) | (1) | % | (934) | (936) | 2 | — | %* | ||||||||||||||||||||||||||||||||||||||||||||||
| Credit enhancement expense | (1,349) | (1,281) | (68) | (5) | % | (327) | (336) | 9 | 3 | % | ||||||||||||||||||||||||||||||||||||||||||||||
| Change in expected credit enhancement recoveries | (134) | (310) | 176 | 57 | % | — | (45) | 45 | 100 | % | ||||||||||||||||||||||||||||||||||||||||||||||
| Other expenses, net | (683) | (851) | 168 | 20 | % | (172) | (178) | 6 | 3 | % | ||||||||||||||||||||||||||||||||||||||||||||||
| Total non-interest expense | (8,885) | (8,999) | 114 | 1 | % | (2,209) | (2,227) | 18 | 1 | % | ||||||||||||||||||||||||||||||||||||||||||||||
| Income before federal income taxes | 18,120 | 18,790 | (670) | (4) | % | 4,325 | 4,404 | (79) | (2) | % | ||||||||||||||||||||||||||||||||||||||||||||||
| Provision for federal income taxes | (3,690) | (3,935) | 245 | 6 | % | (871) | (890) | 19 | 2 | % | ||||||||||||||||||||||||||||||||||||||||||||||
| Net income | $ | 14,430 | $ | 14,855 | $ | (425) | (3) | % | $ | 3,454 | $ | 3,514 | $ | (60) | (2) | % | ||||||||||||||||||||||||||||||||||||||||
| Average charged guaranty fee on new conventional acquisitions, net of TCCA fees | 54.1 bps | 53.2 bps | 0.9 bps | 2 | % | 56.3 bps | 54.1 bps | 2.2 bps | 4 | % | ||||||||||||||||||||||||||||||||||||||||||||||
| Average charged guaranty fee on conventional guaranty book of business, net of TCCA fees | 47.6 bps | 46.9 bps | 0.7 bps | 1 | % | 47.9 bps | 47.7 bps | 0.2 bps | — | %* | ||||||||||||||||||||||||||||||||||||||||||||||
| NM - Not meaningful | ||||||||||||||||||||||||||||||||||||||||||||||||||||||||
| * Represents less than 0.5% | ||||||||||||||||||||||||||||||||||||||||||||||||||||||||
| Single-Family Key Business Highlights | ||||||||
| • | Single-family conventional acquisition volume was $326.0 billion in 2024, compared with $316.0 billion in 2023. Purchase acquisition volume, of which approximately half was for first-time homebuyers, decreased slightly to $269.9 billion in 2024 from $272.8 billion in 2023. Refinance acquisition volume was $56.1 billion in 2024, an increase from $43.2 billion in 2023. | |||||||
| • | The average single-family conventional guaranty book of business decreased by $8.2 billion to $3,626.2 billion in 2024, compared with 2023, driven by loan paydowns and liquidations outpacing acquisitions in 2024. The overall credit characteristics of the single-family conventional guaranty book of business remained strong, with a weighted-average mark-to-market loan-to-value ratio of 50% and a weighted-average FICO credit score at origination of 753 as of December 31, 2024. | |||||||
| • | The average charged guaranty fee, net of TCCA fees, on the single-family conventional guaranty book increased slightly to 47.6 basis points in 2024. The average charged guaranty fee on newly acquired single-family conventional loans, net of TCCA fees, increased to 54.1 basis points in 2024 primarily as a result of higher base guaranty fees charged on new acquisitions. | |||||||
| • | The single-family serious delinquency rate increased to 0.56% as of December 31, 2024 from 0.55% as of December 31, 2023. Single-family seriously delinquent loans are loans that are 90 days or more past due or in the foreclosure process. | |||||||
| Fourth Quarter and Full Year 2024 Results | 3 | |||||||
| Multifamily Business Financial Results | ||||||||||||||||||||||||||||||||||||||||||||||||||||||||
| (Dollars in millions) | 2024 | 2023 | Variance | % Change | Q424 | Q324 | Variance | % Change | ||||||||||||||||||||||||||||||||||||||||||||||||
| Net interest income | $ | 4,618 | $ | 4,544 | $ | 74 | 2 | % | $ | 1,153 | $ | 1,144 | $ | 9 | 1 | % | ||||||||||||||||||||||||||||||||||||||||
| Fee and other income | 76 | 70 | 6 | 9 | % | 24 | 18 | 6 | 33 | % | ||||||||||||||||||||||||||||||||||||||||||||||
| Net revenues | 4,694 | 4,614 | 80 | 2 | % | 1,177 | 1,162 | 15 | 1 | % | ||||||||||||||||||||||||||||||||||||||||||||||
| Benefit (provision) for credit losses | (752) | (495) | (257) | (52) | % | 75 | (424) | 499 | NM | |||||||||||||||||||||||||||||||||||||||||||||||
| Fair value gains (losses), net | 76 | 73 | 3 | 4 | % | 27 | 60 | (33) | (55) | % | ||||||||||||||||||||||||||||||||||||||||||||||
| Investment gains (losses), net | 15 | (12) | 27 | NM | (5) | 3 | (8) | NM | ||||||||||||||||||||||||||||||||||||||||||||||||
| Non-interest expense: | ||||||||||||||||||||||||||||||||||||||||||||||||||||||||
| Administrative expenses | (619) | (587) | (32) | (5) | % | (171) | (152) | (19) | (13) | % | ||||||||||||||||||||||||||||||||||||||||||||||
| Legislative assessments | (47) | (46) | (1) | (2) | % | (15) | (12) | (3) | (25) | % | ||||||||||||||||||||||||||||||||||||||||||||||
| Credit enhancement expense | (292) | (231) | (61) | (26) | % | (79) | (75) | (4) | (5) | % | ||||||||||||||||||||||||||||||||||||||||||||||
| Change in expected credit enhancement recoveries | 328 | 117 | 211 | 180 | % | 5 | 134 | (129) | (96) | % | ||||||||||||||||||||||||||||||||||||||||||||||
| Other expenses, net | (254) | (267) | 13 | 5 | % | (160) | (47) | (113) | NM | |||||||||||||||||||||||||||||||||||||||||||||||
| Total non-interest expense | (884) | (1,014) | 130 | 13 | % | (420) | (152) | (268) | (176) | % | ||||||||||||||||||||||||||||||||||||||||||||||
| Income before federal income taxes | 3,149 | 3,166 | (17) | (1) | % | 854 | 649 | 205 | 32 | % | ||||||||||||||||||||||||||||||||||||||||||||||
| Provision for federal income taxes | (601) | (613) | 12 | 2 | % | (178) | (119) | (59) | (50) | % | ||||||||||||||||||||||||||||||||||||||||||||||
| Net income | $ | 2,548 | $ | 2,553 | $ | (5) | — | %* | $ | 676 | $ | 530 | $ | 146 | 28 | % | ||||||||||||||||||||||||||||||||||||||||
| Average charged guaranty fee rate on multifamily guaranty book of business, at period end | 74.4 bps | 76.1 bps | (1.7) bps | (2) | % | 74.4 bps | 75.1 bps | (0.7) bps | (1) | % | ||||||||||||||||||||||||||||||||||||||||||||||
| NM - Not meaningful | ||||||||||||||||||||||||||||||||||||||||||||||||||||||||
| * Represents less than 0.5% | ||||||||||||||||||||||||||||||||||||||||||||||||||||||||
| Multifamily Key Business Highlights | ||||||||
| • | New multifamily business volume was $55.1 billion in 2024, compared with $52.9 billion in 2023. Multifamily business volumes increased in 2024 compared with 2023, reflecting increased market activity in the fourth quarter of 2024. | |||||||
| • | The multifamily guaranty book of business grew 6.2% in 2024 to $499.7 billion, driven by the company’s acquisitions combined with low prepayment volumes due to the high interest rate environment. | |||||||
| • | The average charged guaranty fee on the multifamily guaranty book of business declined by 1.7 basis points in 2024 to 74.4 basis points as of December 31, 2024, due to lower average charged fees on the company’s 2024 acquisitions as compared with the existing loans in the multifamily guaranty book of business. | |||||||
| • | The multifamily serious delinquency rate increased to 0.57% as of December 31, 2024 from 0.46% as of December 31, 2023, primarily due to a portfolio of approximately $600 million of adjustable-rate conventional loans that became seriously delinquent in the third quarter of 2024. Multifamily seriously delinquent loans are loans that are 60 days or more past due. | |||||||
| Fourth Quarter and Full Year 2024 Results | 4 | |||||||
| Additional Matters | ||
| Fourth Quarter and Full Year 2024 Results | 5 | |||||||
| As of December 31, | |||||||||||||||||||||||
| 2024 | 2023 | ||||||||||||||||||||||
| ASSETS | |||||||||||||||||||||||
| Cash and cash equivalents | $ | 38,853 | $ | 35,817 | |||||||||||||||||||
| Restricted cash and cash equivalents (includes $31,893 and $25,836, respectively, related to consolidated trusts) | 39,958 | 32,889 | |||||||||||||||||||||
| Securities purchased under agreements to resell | 15,975 | 30,700 | |||||||||||||||||||||
| Investments in securities, at fair value | 79,197 | 53,116 | |||||||||||||||||||||
| Mortgage loans: | |||||||||||||||||||||||
| Loans held for sale, at lower of cost or fair value | 373 | 2,149 | |||||||||||||||||||||
| Loans held for investment, at amortized cost: | |||||||||||||||||||||||
| Of Fannie Mae | 50,053 | 48,199 | |||||||||||||||||||||
| Of consolidated trusts | 4,095,287 | 4,094,013 | |||||||||||||||||||||
| Total loans held for investment (includes $3,744 and $3,315, respectively, at fair value) | 4,145,340 | 4,142,212 | |||||||||||||||||||||
| Allowance for loan losses | (7,707) | (8,730) | |||||||||||||||||||||
| Total loans held for investment, net of allowance | 4,137,633 | 4,133,482 | |||||||||||||||||||||
| Total mortgage loans | 4,138,006 | 4,135,631 | |||||||||||||||||||||
| Advances to lenders | 1,825 | 1,389 | |||||||||||||||||||||
| Deferred tax assets, net | 10,545 | 11,681 | |||||||||||||||||||||
| Accrued interest receivable (includes $10,666 and $10,132, respectively, related to consolidated trusts) | 11,364 | 10,724 | |||||||||||||||||||||
| Other assets | 14,008 | 13,490 | |||||||||||||||||||||
| Total assets | $ | 4,349,731 | $ | 4,325,437 | |||||||||||||||||||
| LIABILITIES AND EQUITY | |||||||||||||||||||||||
| Liabilities: | |||||||||||||||||||||||
| Accrued interest payable (includes $10,858 and $10,212, respectively, related to consolidated trusts) | $ | 11,585 | $ | 10,931 | |||||||||||||||||||
| Debt: | |||||||||||||||||||||||
| Of Fannie Mae (includes $385 and $761, respectively, at fair value) | 139,422 | 124,065 | |||||||||||||||||||||
| Of consolidated trusts (includes $13,292 and $14,343, respectively, at fair value) | 4,088,675 | 4,098,653 | |||||||||||||||||||||
| Other liabilities (includes $1,699 and $1,713, respectively, related to consolidated trusts) | 15,392 | 14,106 | |||||||||||||||||||||
| Total liabilities | 4,255,074 | 4,247,755 | |||||||||||||||||||||
| Commitments and contingencies (Note 17) | — | — | |||||||||||||||||||||
| Fannie Mae stockholders’ equity: | |||||||||||||||||||||||
| Senior preferred stock (liquidation preference of $212,029 and $195,224, respectively) | 120,836 | 120,836 | |||||||||||||||||||||
| Preferred stock, 700,000,000 shares are authorized—555,374,922 shares issued and outstanding | 19,130 | 19,130 | |||||||||||||||||||||
| Common stock, no par value, no maximum authorization—1,308,762,703 shares issued and 1,158,087,567 shares outstanding | 687 | 687 | |||||||||||||||||||||
| Accumulated deficit | (38,625) | (55,603) | |||||||||||||||||||||
| Accumulated other comprehensive income | 29 | 32 | |||||||||||||||||||||
| Treasury stock, at cost, 150,675,136 shares | (7,400) | (7,400) | |||||||||||||||||||||
| Total stockholders’ equity | 94,657 | 77,682 | |||||||||||||||||||||
| Total liabilities and equity | $ | 4,349,731 | $ | 4,325,437 | |||||||||||||||||||
| Fourth Quarter and Full Year 2024 Results | 6 | |||||||
| For the Year Ended December 31, | |||||||||||||||||||||||||||||||||||||||||||||||
| 2024 | 2023 | 2022 | |||||||||||||||||||||||||||||||||||||||||||||
| Interest income: | |||||||||||||||||||||||||||||||||||||||||||||||
| Investments in securities | $ | 3,916 | $ | 4,158 | $ | 1,828 | |||||||||||||||||||||||||||||||||||||||||
| Mortgage loans | 144,152 | 133,234 | 117,813 | ||||||||||||||||||||||||||||||||||||||||||||
| Other | 2,498 | 2,322 | 656 | ||||||||||||||||||||||||||||||||||||||||||||
| Total interest income | 150,566 | 139,714 | 120,297 | ||||||||||||||||||||||||||||||||||||||||||||
| Interest expense: | |||||||||||||||||||||||||||||||||||||||||||||||
| Short-term debt | (595) | (672) | (76) | ||||||||||||||||||||||||||||||||||||||||||||
| Long-term debt | (121,223) | (110,269) | (90,798) | ||||||||||||||||||||||||||||||||||||||||||||
| Total interest expense | (121,818) | (110,941) | (90,874) | ||||||||||||||||||||||||||||||||||||||||||||
| Net interest income | 28,748 | 28,773 | 29,423 | ||||||||||||||||||||||||||||||||||||||||||||
| Benefit (provision) for credit losses | 186 | 1,670 | (6,277) | ||||||||||||||||||||||||||||||||||||||||||||
| Net interest income after benefit (provision) for credit losses | 28,934 | 30,443 | 23,146 | ||||||||||||||||||||||||||||||||||||||||||||
| Fair value gains (losses), net | 1,821 | 1,304 | 1,284 | ||||||||||||||||||||||||||||||||||||||||||||
| Investment gains (losses), net | (38) | (53) | (297) | ||||||||||||||||||||||||||||||||||||||||||||
| Fee and other income | 321 | 275 | 312 | ||||||||||||||||||||||||||||||||||||||||||||
| Non-interest income | 2,104 | 1,526 | 1,299 | ||||||||||||||||||||||||||||||||||||||||||||
| Non-interest expense: | |||||||||||||||||||||||||||||||||||||||||||||||
| Salaries and employee benefits | (2,004) | (1,906) | (1,671) | ||||||||||||||||||||||||||||||||||||||||||||
| Professional services, technology, and occupancy | (1,615) | (1,539) | (1,526) | ||||||||||||||||||||||||||||||||||||||||||||
| Legislative assessments | (3,766) | (3,745) | (3,788) | ||||||||||||||||||||||||||||||||||||||||||||
| Credit enhancement expense | (1,641) | (1,512) | (1,323) | ||||||||||||||||||||||||||||||||||||||||||||
| Change in expected credit enhancement recoveries | 194 | (193) | 727 | ||||||||||||||||||||||||||||||||||||||||||||
| Other expenses, net | (937) | (1,118) | (631) | ||||||||||||||||||||||||||||||||||||||||||||
| Total non-interest expense | (9,769) | (10,013) | (8,212) | ||||||||||||||||||||||||||||||||||||||||||||
| Income before federal income taxes | 21,269 | 21,956 | 16,233 | ||||||||||||||||||||||||||||||||||||||||||||
| Provision for federal income taxes | (4,291) | (4,548) | (3,310) | ||||||||||||||||||||||||||||||||||||||||||||
| Net income | 16,978 | 17,408 | 12,923 | ||||||||||||||||||||||||||||||||||||||||||||
| Other comprehensive income (loss) | (3) | (3) | (3) | ||||||||||||||||||||||||||||||||||||||||||||
| Total comprehensive income | $ | 16,975 | $ | 17,405 | $ | 12,920 | |||||||||||||||||||||||||||||||||||||||||
| Net income | $ | 16,978 | $ | 17,408 | $ | 12,923 | |||||||||||||||||||||||||||||||||||||||||
| Dividends distributed or amounts attributable to senior preferred stock | (16,975) | (17,405) | (12,920) | ||||||||||||||||||||||||||||||||||||||||||||
| Net income attributable to common stockholders | $ | 3 | $ | 3 | $ | 3 | |||||||||||||||||||||||||||||||||||||||||
| Earnings per share: | |||||||||||||||||||||||||||||||||||||||||||||||
| Basic | $ | 0.00 | $ | 0.00 | $ | 0.00 | |||||||||||||||||||||||||||||||||||||||||
| Diluted | 0.00 | 0.00 | 0.00 | ||||||||||||||||||||||||||||||||||||||||||||
| Weighted-average common shares outstanding: | |||||||||||||||||||||||||||||||||||||||||||||||
| Basic | 5,867 | 5,867 | 5,867 | ||||||||||||||||||||||||||||||||||||||||||||
| Diluted | 5,893 | 5,893 | 5,893 | ||||||||||||||||||||||||||||||||||||||||||||
| Fourth Quarter and Full Year 2024 Results | 7 | |||||||