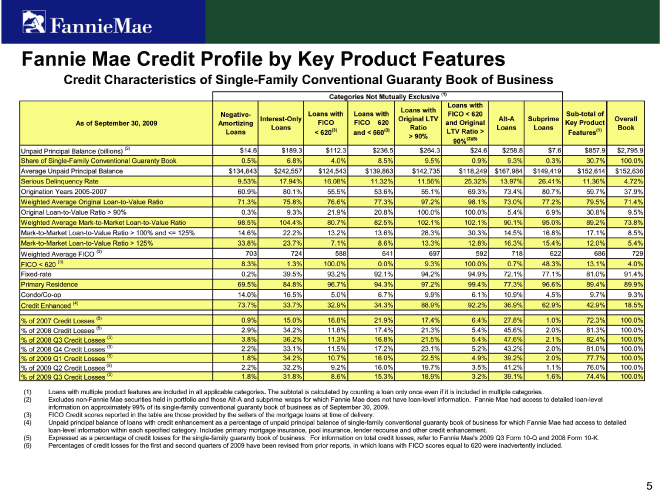
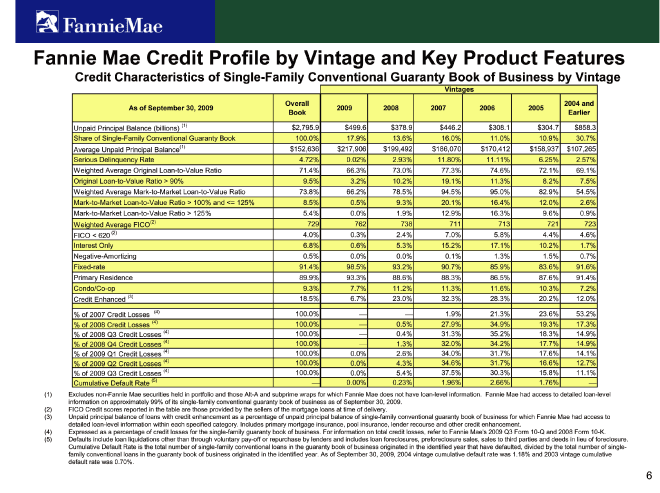
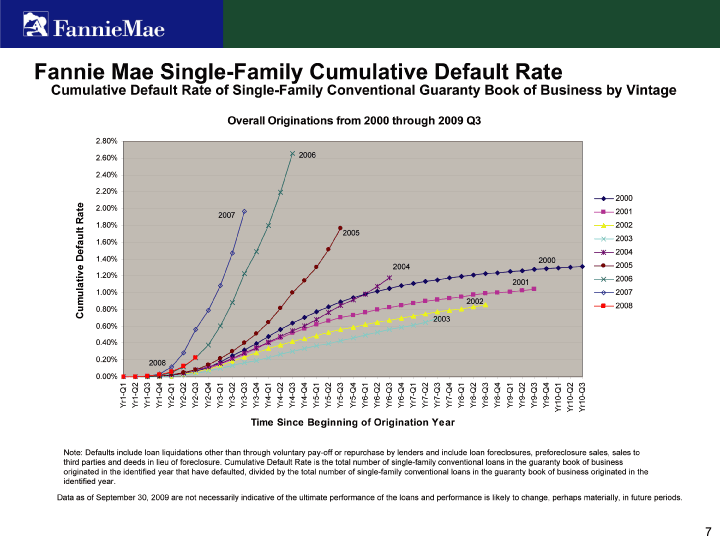
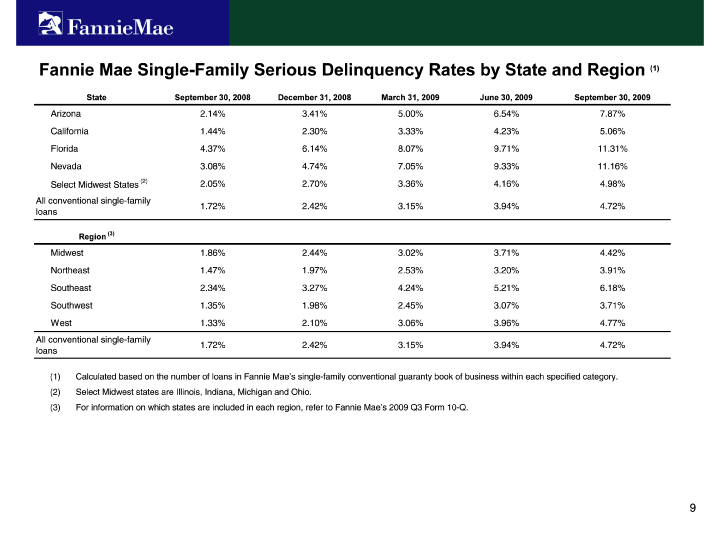
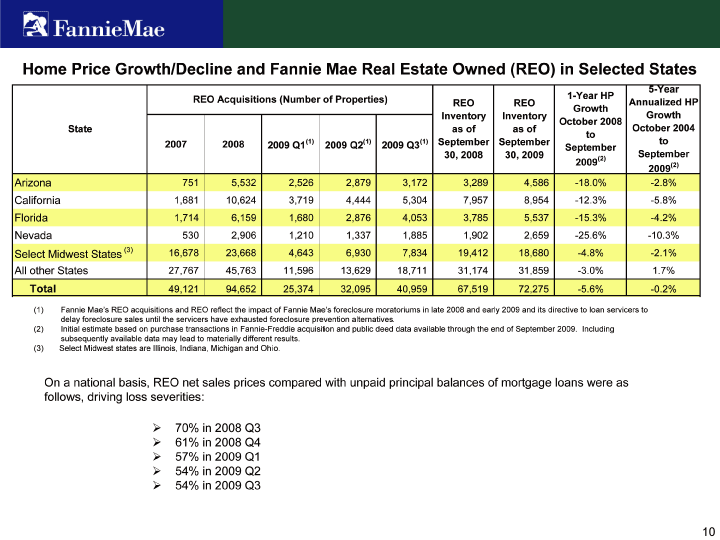
| Home Price Growth/Decline and Fannie Mae Real Estate Owned (REO) in Selected States 5-Year REO Acquisitions (Number of Properties) 1-Year HP REO REO Annualized HP Growth Inventory Inventory Growth October 2008 State as of as of October 2004 to 2007 2008 2009 Q1(1) 2009 Q2(1) 2009 Q3(1) September September to September 30, 2008 30, 2009 September 2009(2) 2009(2) Arizona 751 5,532 2,526 2,879 3,172 3,289 4,586 -18.0% -2.8% California 1,681 10,624 3,719 4,444 5,304 7,957 8,954 - -12.3% -5.8% Florida 1,714 6,159 1,680 2,876 4,053 3,785 5,537 -15.3% -4.2% Nevada 530 2,906 1,210 1,337 1,885 1,902 2,659 -25.6% -10.3% Select Midwest States (3) 16,678 23,668 4,643 6,930 7,834 19,412 18,680 -4.8% -2.1% All other States 27,767 45,763 11,596 13,629 18,711 31,174 31,859 -3.0% 1.7% Total 49,121 94,652 25,374 32,095 40,959 67,519 72,275 -5.6% -0.2% (1) Fannie Mae’s REO acquisitions and REO reflect the impact of Fannie Mae’s foreclosure moratoriums in late 2008 and early 2009 and its directive to loan servicers to delay foreclosure sales until the servicers have exhausted foreclosure prevention alternatives. (2) Initial estimate based on purchase transactions in Fannie-Freddie acquisition and public deed data available through the end of September 2009. Including subsequently available data may lead to materially different results. (3) Select Midwest states are Illinois, Indiana, Michigan and Ohio. On a national basis, REO net sales prices compared with unpaid principal balances of mortgage loans were as follows, driving loss severities:70% in 2008 Q361% in 2008 Q457% in 2009 Q154% in 2009 Q254% in 2009 Q3 |

