Exhibit 99.2
| Fannie Mae 2007 Q1-Q3 10-Q Investor Summary November 9, 2007 Credit Supplement |

| Characteristics of Fannie Mae Single-Family Conventional Mortgage Credit Book of Business Product Types* Occupancy* Primary Residence 6% Investor 4% Second/ Vacation 6% Other ARMs 3% IO Fixed 5% IO ARM 1% Negam * Data as of September 30, 2007 September 30, 2007 September 30, 2007 Single-Family Conventional Mortgage Credit Book of Business $2.4 Trillion Weighted Average FICO 721 Weighted Average Original LTV 71% Weighted Average MTM LTV 59% Long Term and Intermediate Term Fixed Rate (excluding IO) 85% 90% 1 |

| Fannie Mae Subprime and Alt-A Exposure Total Exposure of $55.9 Billion Total Exposure of $359.1 Billion PLS Portfolio Investment PLS Wrap $6.2B Purchased or Guaranteed Loans $7.3B PLS Wrap $0.6B PLS Portfolio Investment $33.8B Purchased or Guaranteed Loans * Data as of September 30, 2007 Subprime $42.4B $324.7B Alt-A 2 |
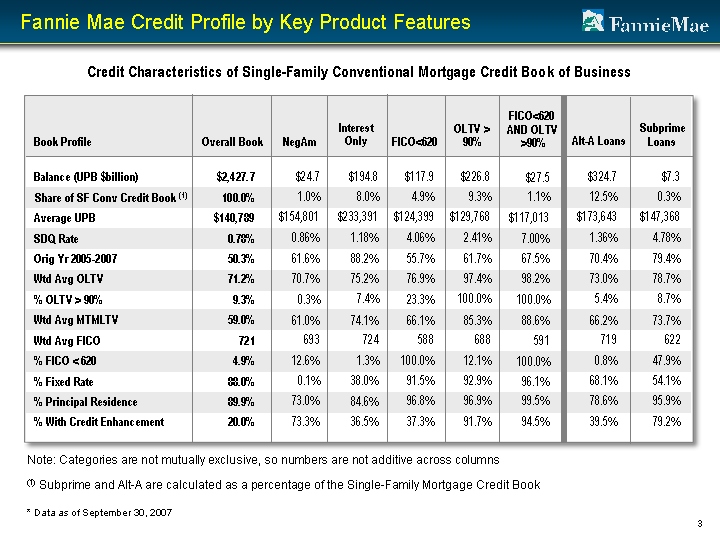
| Fannie Mae Credit Profile by Key Product Features * Data as of September 30, 2007 Note: Categories are not mutually exclusive, so numbers are not additive across columns Credit Characteristics of Single-Family Conventional Mortgage Credit Book of Business Book Profile Overall Book Subprime Loans Alt-A Loans NegAm Interest Only FICO<620 OLTV > 90% FICO<620 AND OLTV >90% Balance (UPB $billion) $2,427.7 $7.3 Share of SF Conv Credit Book (1) 100.0% 0.3% Average UPB $140,789 SDQ Rate 0.78% 4.78% Orig Yr 2005-2007 50.3% Wtd Avg OLTV 71.2% 78.7% % OLTV > 90% 9.3% 8.7% Wtd Avg MTMLTV 59.0% Wtd Avg FICO 721 622 % FICO < 620 4.9% 47.9% % Fixed Rate 88.0% 54.1% % Principal Residence 89.9% % With Credit Enhancement 20.0% 79.2% $147,368 79.4% 73.7% 95.9% $324.7 12.5% 1.36% 73.0% 5.4% 719 0.8% 68.1% 39.5% $173,643 70.4% 66.2% 78.6% $24.7 1.0% 0.86% 70.7% 0.3% 693 12.6% 0.1% 73.3% $154,801 61.6% 61.0% 73.0% $194.8 8.0% 1.18% 75.2% 7.4% 724 1.3% 38.0% 36.5% $233,391 88.2% 74.1% 84.6% $117.9 4.9% 4.06% 76.9% 23.3% 588 100.0% 91.5% 37.3% $124,399 55.7% 66.1% 96.8% $27.5 1.1% 7.00% 98.2% 100.0% 591 100.0% 96.1% 94.5% $117,013 67.5% 88.6% 99.5% $226.8 9.3% 2.41% 97.4% 100.0% 688 12.1% 92.9% 91.7% $129,768 61.7% 85.3% 96.9% 3 (1) Subprime and Alt-A are calculated as a percentage of the Single-Family Mortgage Credit Book |
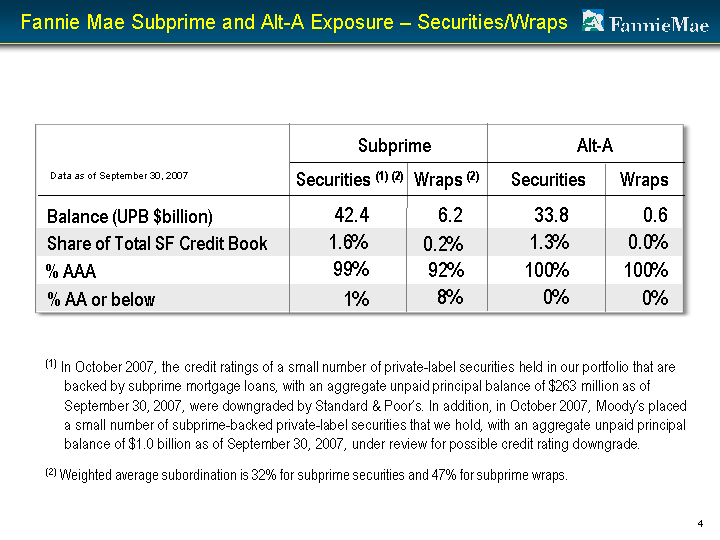
| Fannie Mae Subprime and Alt-A Exposure - Securities/Wraps Data as of September 30, 2007 Securities (1) (2) Wraps (2) Securities Wraps Balance (UPB $billion) 42.4 6.2 33.8 0.6 Share of Total SF Credit Book 1.6% 1.3% % AAA 99% 100% % AA or below Subprime Alt-A 1% 8% 92% 0.2% 0% 0.0% 100% 0% (1) In October 2007, the credit ratings of a small number of private-label securities held in our portfolio that are backed by subprime mortgage loans, with an aggregate unpaid principal balance of $263 million as of September 30, 2007, were downgraded by Standard & Poor's. In addition, in October 2007, Moody's placed a small number of subprime-backed private-label securities that we hold, with an aggregate unpaid principal balance of $1.0 billion as of September 30, 2007, under review for possible credit rating downgrade. (2) Weighted average subordination is 32% for subprime securities and 47% for subprime wraps. 4 |
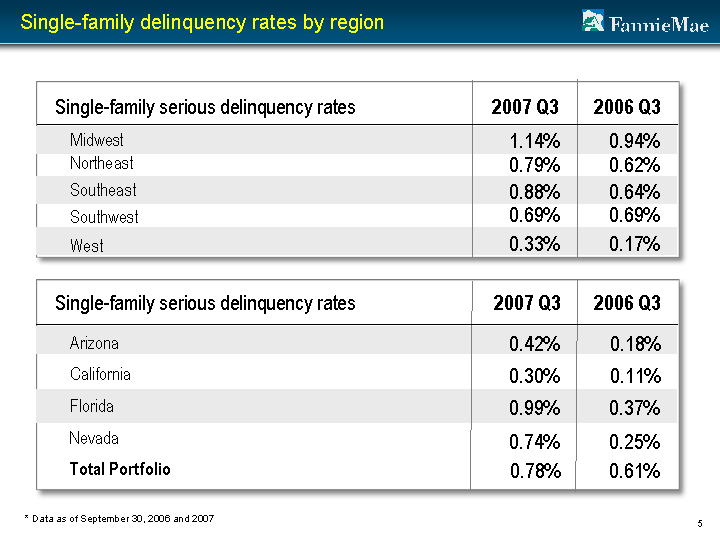
| Single-family delinquency rates by region * Data as of September 30, 2006 and 2007 Single-family serious delinquency rates 2007 Q3 2006 Q3 Midwest Northeast Southeast Southwest West Single-family serious delinquency rates 2007 Q3 2006 Q3 California Florida Total Portfolio 1.14% 0.79% 0.88% 0.69% 0.33% 0.94% 0.62% 0.64% 0.69% 0.17% 0.30% 0.99% 0.78% 0.11% 0.37% 0.61% 5 Arizona Nevada 0.42% 0.18% 0.74% 0.25% |
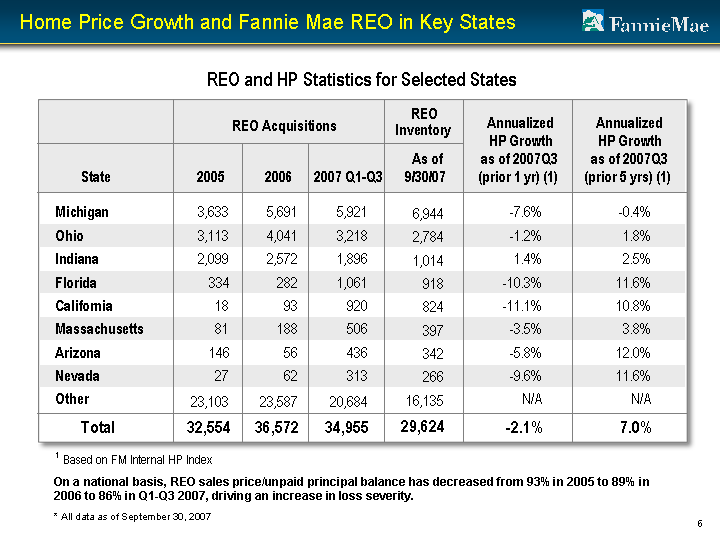
| Home Price Growth and Fannie Mae REO in Key States * All data as of September 30, 2007 On a national basis, REO sales price/unpaid principal balance has decreased from 93% in 2005 to 89% in 2006 to 86% in Q1-Q3 2007, driving an increase in loss severity. REO and HP Statistics for Selected States REO Inventory Annualized HP Growth as of 2007Q3 (prior 5 yrs) (1) 3,633 3,113 2,099 334 18 81 146 27 5,691 4,041 2,572 282 93 188 56 62 5,921 3,218 1,896 1,061 920 506 436 313 Total 32,554 36,572 34,955 - -2.1% 7.0% 1 Based on FM Internal HP Index REO Acquisitions State 2005 2006 2007 Q1-Q3 As of 9/30/07 Annualized HP Growth as of 2007Q3 (prior 1 yr) (1) Michigan Ohio Indiana Florida California Massachusetts Arizona Nevada Other - -7.6% - -1.2% 1.4% - -10.3% - -11.1% - -3.5% - -5.8% - -9.6% N/A - -0.4% 1.8% 2.5% 11.6% 10.8% 3.8% 12.0% 11.6% N/A 6,944 2,784 1,014 918 824 397 342 266 29,624 23,103 23,587 20,684 16,135 6 |